Embed Size (px)
Citation preview
Second Quarter of 2021
EARNINGS RELEASE
CONFERENCE CALL Portuguese
(simultaneous English translation) August 12, 2021
11:00 AM (Brasília time) 10:00 AM (New York time)
Dial in Brazil: +55 3181-8565 or +55 11 4210-1803 Dial in USA: +1 844 204-8942 or +1 412 717-9627
Code: Enauta
ENAUTA PARTICIPAÇÕES S.A.
Av Almirante Barroso, nº 52, Sala 1301 – Centro Rio de Janeiro – RJ | Cep: 20031-918
Phone: 55 21 3509-5800 www.enauta.com.br
1
1
EARNINGS RELEASE | SECOND QUARTER OF 2021
Enauta reports 2Q21 results Rio de Janeiro, August 11, 2021 – Enauta Participações S.A. (B3: ENAT3) today announces its results for the second quarter of 2021. Except where indicated otherwise, the financial and operating data in this release are presented on a consolidated basis in accordance with International Financial Reporting Standards (“IFRS”) and the accounting practices adopted in Brazil (“BR GAAP”), as described in the financial section of this release.
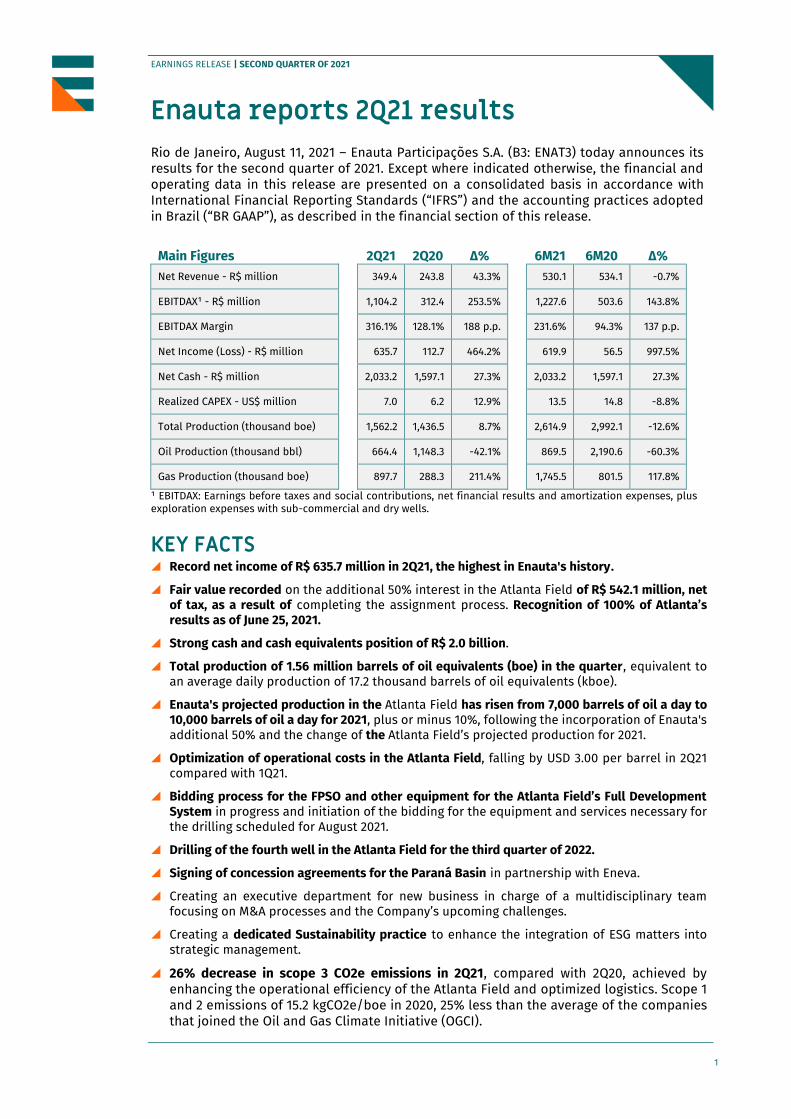
Main Figures 2Q21 2Q20 ∆%
6M21 6M20 ∆%
Net Revenue - R$ million 349.4 243.8 43.3% 530.1 534.1 -0.7%
EBITDAX¹ - R$ million 1,104.2 312.4 253.5% 1,227.6 503.6 143.8%
EBITDAX Margin 316.1% 128.1% 188 p.p. 231.6% 94.3% 137 p.p.
Net Income (Loss) - R$ million 635.7 112.7 464.2% 619.9 56.5 997.5%
Net Cash - R$ million 2,033.2 1,597.1 27.3% 2,033.2 1,597.1 27.3%
Realized CAPEX - US$ million 7.0 6.2 12.9% 13.5 14.8 -8.8%
Total Production (thousand boe) 1,562.2 1,436.5 8.7% 2,614.9 2,992.1 -12.6%
Oil Production (thousand bbl) 664.4 1,148.3 -42.1% 869.5 2,190.6 -60.3%
Gas Production (thousand boe) 897.7 288.3 211.4% 1,745.5 801.5 117.8%
¹ EBITDAX: Earnings before taxes and social contributions, net financial results and amortization expenses, plus exploration expenses with sub-commercial and dry wells.
KEY FACTS Record net income of R$ 635.7 million in 2Q21, the highest in Enauta's history.
Fair value recorded on the additional 50% interest in the Atlanta Field of R$ 542.1 million, net of tax, as a result of completing the assignment process. Recognition of 100% of Atlanta’s results as of June 25, 2021.
Strong cash and cash equivalents position of R$ 2.0 billion.
Total production of 1.56 million barrels of oil equivalents (boe) in the quarter, equivalent to an average daily production of 17.2 thousand barrels of oil equivalents (kboe).
Enauta's projected production in the Atlanta Field has risen from 7,000 barrels of oil a day to 10,000 barrels of oil a day for 2021, plus or minus 10%, following the incorporation of Enauta's additional 50% and the change of the Atlanta Field’s projected production for 2021.
Optimization of operational costs in the Atlanta Field, falling by USD 3.00 per barrel in 2Q21 compared with 1Q21.
Bidding process for the FPSO and other equipment for the Atlanta Field’s Full Development System in progress and initiation of the bidding for the equipment and services necessary for the drilling scheduled for August 2021.
Drilling of the fourth well in the Atlanta Field for the third quarter of 2022.
Signing of concession agreements for the Paraná Basin in partnership with Eneva.
Creating an executive department for new business in charge of a multidisciplinary team focusing on M&A processes and the Company’s upcoming challenges.
Creating a dedicated Sustainability practice to enhance the integration of ESG matters into strategic management.
26% decrease in scope 3 CO2e emissions in 2Q21, compared with 2Q20, achieved by enhancing the operational efficiency of the Atlanta Field and optimized logistics. Scope 1 and 2 emissions of 15.2 kgCO2e/boe in 2020, 25% less than the average of the companies that joined the Oil and Gas Climate Initiative (OGCI).
2
2
EARNINGS RELEASE | SECOND QUARTER OF 2021
Zero lost-time injuries in 2021 and zero oil spills since production commenced at the Atlanta Field in May 2018.
Message from Management
The second half of 2021 got underway with promising prospects for Enauta. In our sector, the global demand for oil is still riding high due to the economic recovery, positively impacting prices. Petrobras’ divestments in Brazil continue to present asset acquisition opportunities. Key events in the quarter took Enauta to an unprecedented level of production capacity and future revenue generation. It is in this extremely favorable situation that we enter the second half of the year, well positioned to advance our strategic agenda. We remain steadfast and are assessing opportunities to diversify our portfolio and enhance our operational efficiency. The end of the second quarter of 2021 saw the Company reach a milestone. We signed the amendment to the concession agreement for Block BS-4, which houses the Atlanta Field. This led us to assume all of the asset’s results, expanding our oil production by 50%. We currently have two wells in Atlanta and a third well will resume production before the end of this month. This will significantly bolster our cash generation, driven by the strong demand for oil with a low sulfur content produced in Atlanta. The bidding process for the FPSO and other equipment of the Full Development System is going as planned, which will enable us to ramp up production following the start-up of the Field’s Full Development System. This month we will initiate the bid for the items and services necessary to drill the fourth well, which should take place in the second half of 2022. We completed the second quarter of 2021 with record results for Enauta, mainly due to the impact of incorporating the additional 50% interest in the Atlanta Field valued at R$ 542.1 million, net of tax. The Field has also contributed significantly to the Company’s better operating results, having gradually recovered production over the quarter. The revenue from Manati was also important, reaching R$ 132.7 million, due to the growing demand for gas. Our Year-on-Year (Yoy) consolidated net revenue increased 43% to R$ 349.4 million. The Company is well capitalized, with a cash balance of R$ 2.0 billion, which will facilitate acquisitions. We remain focused on diversifying our portfolio with an emphasis on producing assets, including mature onshore and offshore fields. We lastly emphasize that the progress made in our strategic agenda, including resource optimization and efficiency gains, is accompanied by meaningful ESG achievements. In line with our strategy of pursuing sustainable development and constantly enhancing emissions management, we registered a 26% decrease in CO2e intensity of greenhouse gas emissions (scope 3) in the quarter on the same quarter last year, by optimizing logistics operations in the Atlanta Field. We also highlight the important result of zero lost-time injuries in 2021. In governance, 40% of our leadership team is female, which is above the industry average. These results show that Enauta's current transformation process is solidly committed to advancing the initiatives that assure the Company’s sustainability.
3
3
EARNINGS RELEASE | SECOND QUARTER OF 2021
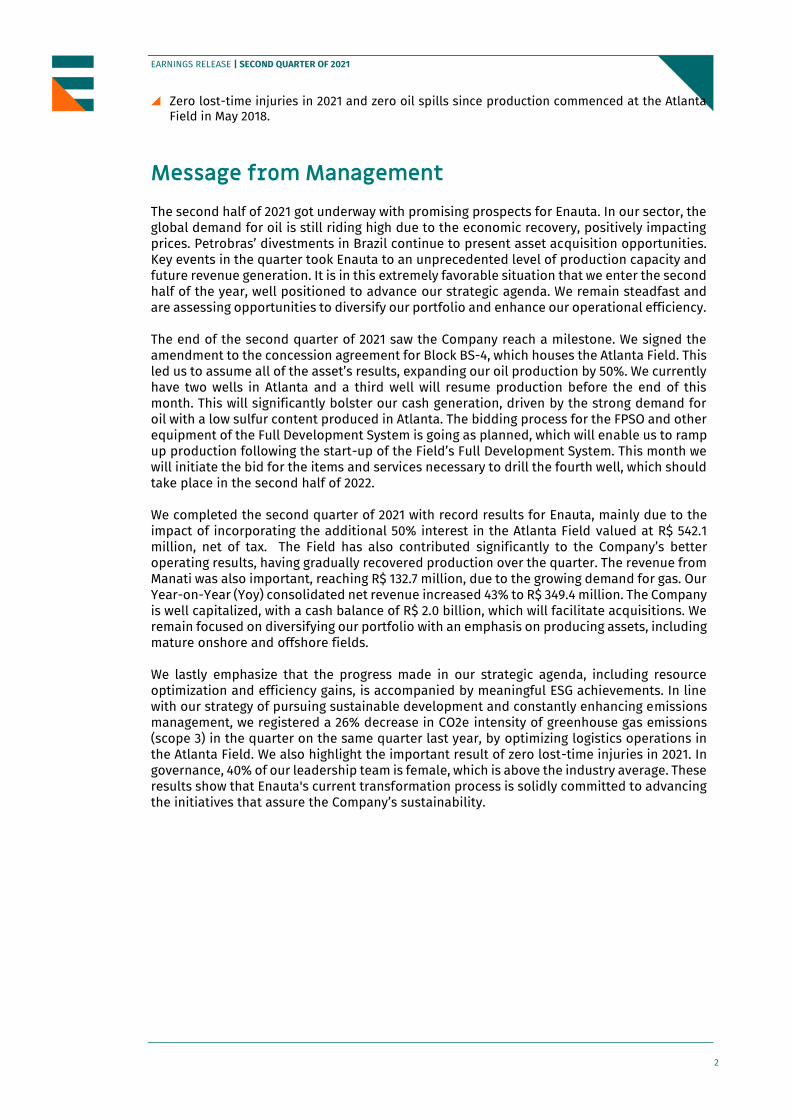
Asset Portfolio
Environmental, Social & Governance (ESG) The Company’s strategic sustainability management has been a priority and undergoing constant development in integrating operational matters. In the second quarter we created the Sustainability Practice, further expanding the focus on controls and integrating ESG matters into the Company’s other departments. We have a CDP score of B (formerly the Carbon Disclosure Project), a non-profit institution that administrates a global reporting system so that investors, companies and regions can manage their environmental impacts. This is an important recognition that confirms how seriously Enauta is managing greenhouse gas (GHG) emissions. In our 11th Annual Sustainability Report we included for the first time the disclosures of the Sustainability Accounting Standards Board (SASB) and bolstered our commitment to the 2030 Agenda and the UN’s Sustainable Development Goals. See below a number of key events for the period: Environmental:
26% decrease in scope 3 CO2e emissions in 2Q21, compared with 2Q20, achieved by enhancing the operational efficiency of the Atlanta Field and optimized logistics. Scope 1 and 2 emissions of 15.2 kgCO2e/boe in 2020, 25% less than the average of the companies that joined the Oil and Gas Climate Initiative (OGCI).
Smaller environmental impact - Low sulfur content 0.33% – Atlanta Oil - IMO 2020 (International Maritime Organization) <0.5%.

4
4
EARNINGS RELEASE | SECOND QUARTER OF 2021
Investment for decarbonization - Research and Development project in partnership with UERJ - Contribution of mangrove forests in Rio de Janeiro state to the process of mitigating global warming by storing carbon - was selected by the Brazilian Institute of Oil, Gas and Biofuels (IBP) to represent Brazilian industry initiatives at the UN Climate Change Conference (COP26 - Glasgow) in November this year.
Social:
Zero lost-time injury rate. Gender equity - 40% women in leadership positions versus the average of 19% in the
energy sector (management positions), according to the study published by FESA Executive Research in July 2021.
Governance:
6 years of consolidated work by our Ethics, Governance and Sustainability Committee. Implementation in progress of our Statutory Audit Committee. Approving our Internal Control Policy which establishes the concepts, principles and
guidelines to be followed to bolster and operate the Company’s internal control system.
Sector Performance The economic recovery, particularly in Europe and the USA, fueled the global demand for oil in the second quarter of 2021. Other important factors were China’s ongoing economic recovery and India’s gradual recovery following the severe humanitarian crisis unleashed by COVID-19. The oil market is currently experiencing a supply deficit of 2 million to 2.5 million barrels a year. The inventories of various products are below optimal levels in numerous countries, including gasoline in the USA, which is worsening the situation. Global production will not be sufficient to meet demand at the end of 2021. Estimates indicate that supply will only meet demand at the end of 2022 or early 2023. The recent OPEC + agreement to boost daily oil production by 400 thousand barrels in the coming months will not be enough to cover this shortfall. Brent began the second quarter of 2021 quoted at USD 64.86 per barrel, closing the period at USD 75.13 per barrel, an increase of 15.83%, fueled by the consistent increase in the demand for oil, the maintenance and control of OPEC + production and the relaxation of restrictive social distancing measures, above all in the USA and Europe. In September 2021 the global demand for oil is expected to return to pre-pandemic levels.
Natural gas is also booming globally. Countries in Asia, the Pacific and Europe continue to invest heavily in liquefaction plants. This is attracting a great deal of attention in EU member
5
5
EARNINGS RELEASE | SECOND QUARTER OF 2021
states, as they have committed to zero carbon emissions by 2050 in line with the goals of the Paris Agreement. In Brazil, in addition to natural gas, the water crisis related to the worsening of reservoir levels at hydroelectric plants also generated a greater demand for diesel and fuel oil by thermal plants, which use these products to generate energy.
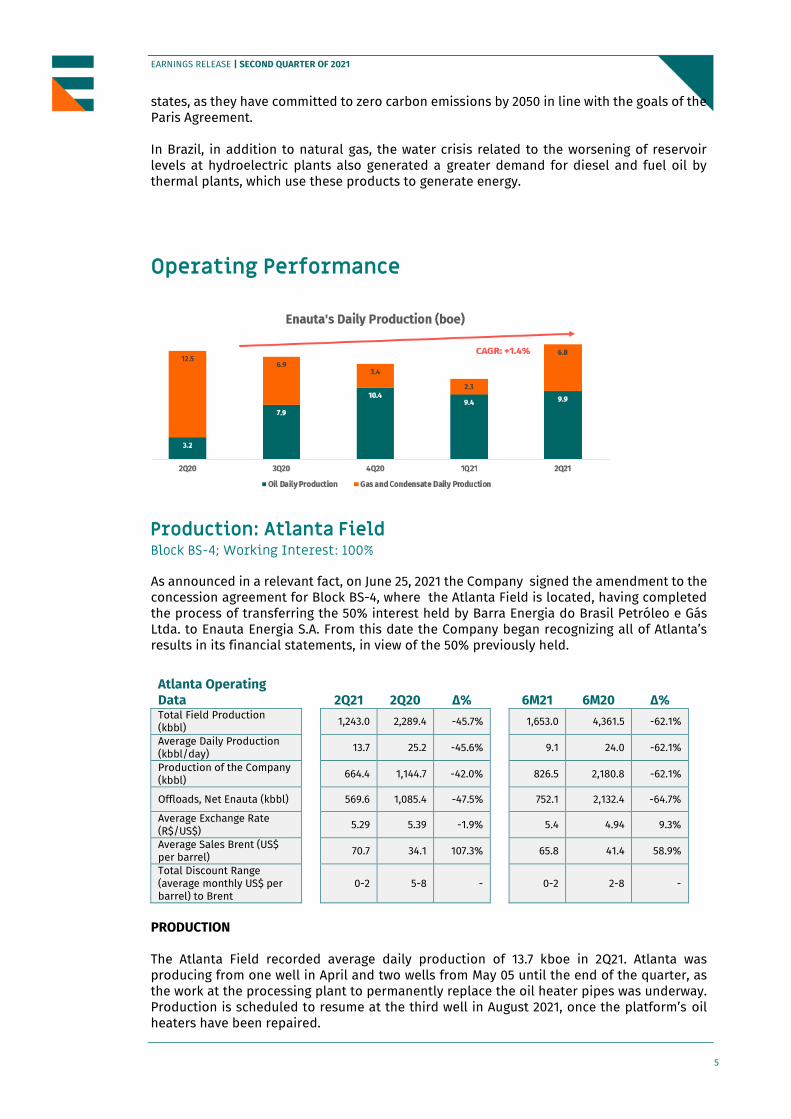
Operating Performance
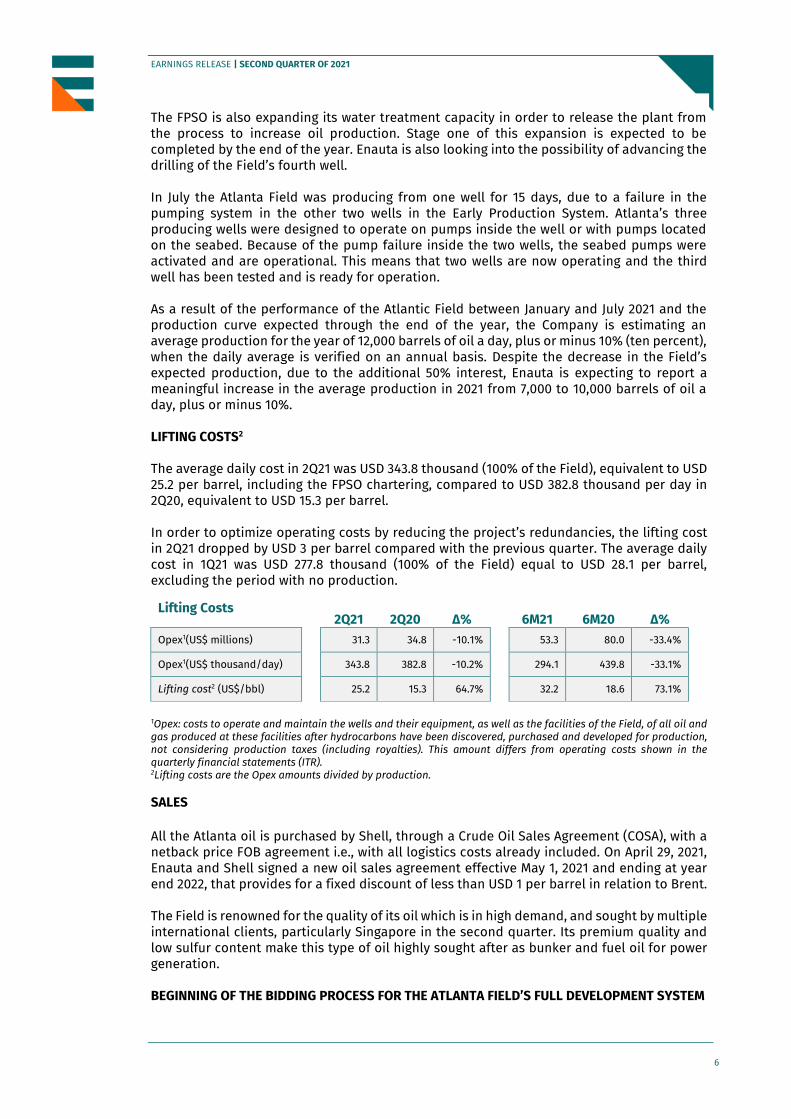
Production: Atlanta Field Block BS-4; Working Interest: 100% As announced in a relevant fact, on June 25, 2021 the Company signed the amendment to the concession agreement for Block BS-4, where the Atlanta Field is located, having completed the process of transferring the 50% interest held by Barra Energia do Brasil Petróleo e Gás Ltda. to Enauta Energia S.A. From this date the Company began recognizing all of Atlanta’s results in its financial statements, in view of the 50% previously held.
Atlanta Operating Data 2Q21 2Q20 ∆%
6M21 6M20 ∆%
Total Field Production (kbbl)
1,243.0 2,289.4 -45.7% 1,653.0 4,361.5 -62.1%
Average Daily Production (kbbl/day)
13.7 25.2 -45.6% 9.1 24.0 -62.1%
Production of the Company (kbbl)
664.4 1,144.7 -42.0% 826.5 2,180.8 -62.1%
Offloads, Net Enauta (kbbl) 569.6 1,085.4 -47.5% 752.1 2,132.4 -64.7%
Average Exchange Rate (R$/US$)
5.29 5.39 -1.9% 5.4 4.94 9.3%
Average Sales Brent (US$ per barrel)
70.7 34.1 107.3% 65.8 41.4 58.9%
Total Discount Range (average monthly US$ per barrel) to Brent
0-2 5-8 - 0-2 2-8 -
PRODUCTION The Atlanta Field recorded average daily production of 13.7 kboe in 2Q21. Atlanta was producing from one well in April and two wells from May 05 until the end of the quarter, as the work at the processing plant to permanently replace the oil heater pipes was underway. Production is scheduled to resume at the third well in August 2021, once the platform’s oil heaters have been repaired.
6
6
EARNINGS RELEASE | SECOND QUARTER OF 2021
The FPSO is also expanding its water treatment capacity in order to release the plant from the process to increase oil production. Stage one of this expansion is expected to be completed by the end of the year. Enauta is also looking into the possibility of advancing the drilling of the Field’s fourth well. In July the Atlanta Field was producing from one well for 15 days, due to a failure in the pumping system in the other two wells in the Early Production System. Atlanta’s three producing wells were designed to operate on pumps inside the well or with pumps located on the seabed. Because of the pump failure inside the two wells, the seabed pumps were activated and are operational. This means that two wells are now operating and the third well has been tested and is ready for operation. As a result of the performance of the Atlantic Field between January and July 2021 and the production curve expected through the end of the year, the Company is estimating an average production for the year of 12,000 barrels of oil a day, plus or minus 10% (ten percent), when the daily average is verified on an annual basis. Despite the decrease in the Field’s expected production, due to the additional 50% interest, Enauta is expecting to report a meaningful increase in the average production in 2021 from 7,000 to 10,000 barrels of oil a day, plus or minus 10%. LIFTING COSTS2
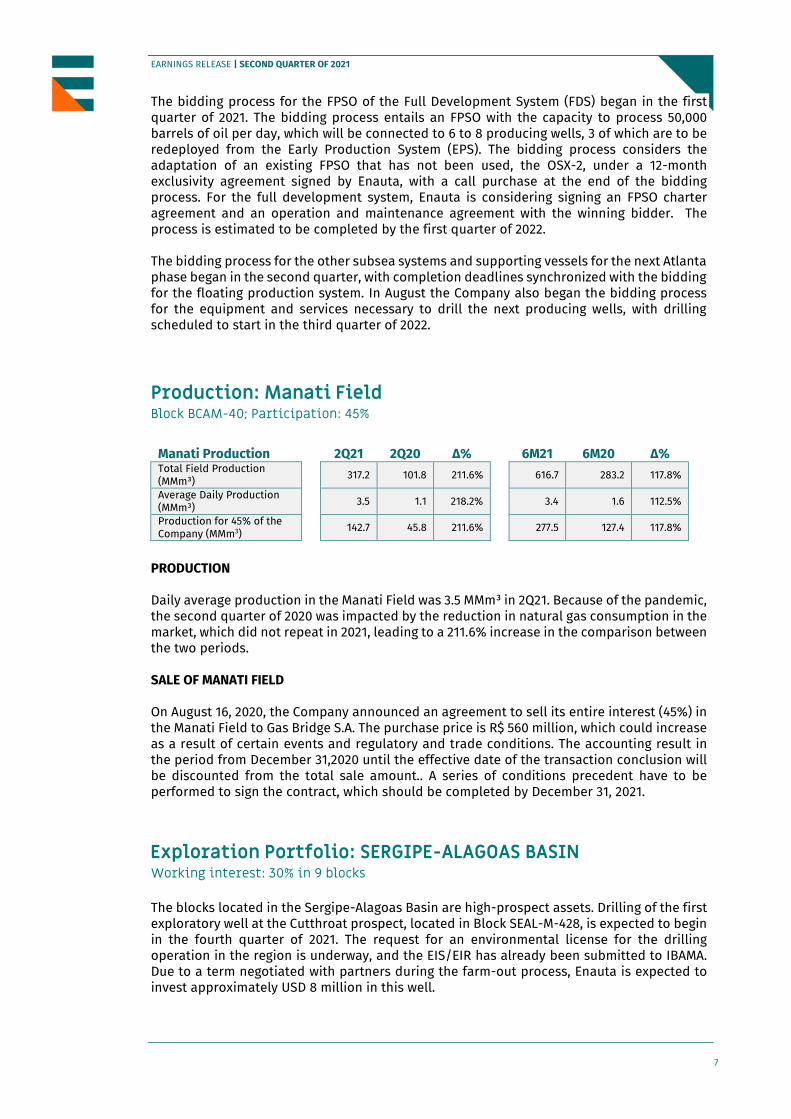
The average daily cost in 2Q21 was USD 343.8 thousand (100% of the Field), equivalent to USD 25.2 per barrel, including the FPSO chartering, compared to USD 382.8 thousand per day in 2Q20, equivalent to USD 15.3 per barrel. In order to optimize operating costs by reducing the project’s redundancies, the lifting cost in 2Q21 dropped by USD 3 per barrel compared with the previous quarter. The average daily cost in 1Q21 was USD 277.8 thousand (100% of the Field) equal to USD 28.1 per barrel, excluding the period with no production.
Lifting Costs 2Q21 2Q20 ∆%
6M21 6M20 ∆%
Opex1(US$ millions) 31.3 34.8 -10.1% 53.3 80.0 -33.4%
Opex1(US$ thousand/day) 343.8 382.8 -10.2% 294.1 439.8 -33.1%
Lifting cost2 (US$/bbl) 25.2 15.3 64.7% 32.2 18.6 73.1%
1Opex: costs to operate and maintain the wells and their equipment, as well as the facilities of the Field, of all oil and gas produced at these facilities after hydrocarbons have been discovered, purchased and developed for production, not considering production taxes (including royalties). This amount differs from operating costs shown in the quarterly financial statements (ITR). 2Lifting costs are the Opex amounts divided by production.
SALES All the Atlanta oil is purchased by Shell, through a Crude Oil Sales Agreement (COSA), with a netback price FOB agreement i.e., with all logistics costs already included. On April 29, 2021, Enauta and Shell signed a new oil sales agreement effective May 1, 2021 and ending at year end 2022, that provides for a fixed discount of less than USD 1 per barrel in relation to Brent.
The Field is renowned for the quality of its oil which is in high demand, and sought by multiple international clients, particularly Singapore in the second quarter. Its premium quality and low sulfur content make this type of oil highly sought after as bunker and fuel oil for power generation. BEGINNING OF THE BIDDING PROCESS FOR THE ATLANTA FIELD’S FULL DEVELOPMENT SYSTEM
7
7
EARNINGS RELEASE | SECOND QUARTER OF 2021
The bidding process for the FPSO of the Full Development System (FDS) began in the first quarter of 2021. The bidding process entails an FPSO with the capacity to process 50,000 barrels of oil per day, which will be connected to 6 to 8 producing wells, 3 of which are to be redeployed from the Early Production System (EPS). The bidding process considers the adaptation of an existing FPSO that has not been used, the OSX-2, under a 12-month exclusivity agreement signed by Enauta, with a call purchase at the end of the bidding process. For the full development system, Enauta is considering signing an FPSO charter agreement and an operation and maintenance agreement with the winning bidder. The process is estimated to be completed by the first quarter of 2022. The bidding process for the other subsea systems and supporting vessels for the next Atlanta phase began in the second quarter, with completion deadlines synchronized with the bidding for the floating production system. In August the Company also began the bidding process for the equipment and services necessary to drill the next producing wells, with drilling scheduled to start in the third quarter of 2022.
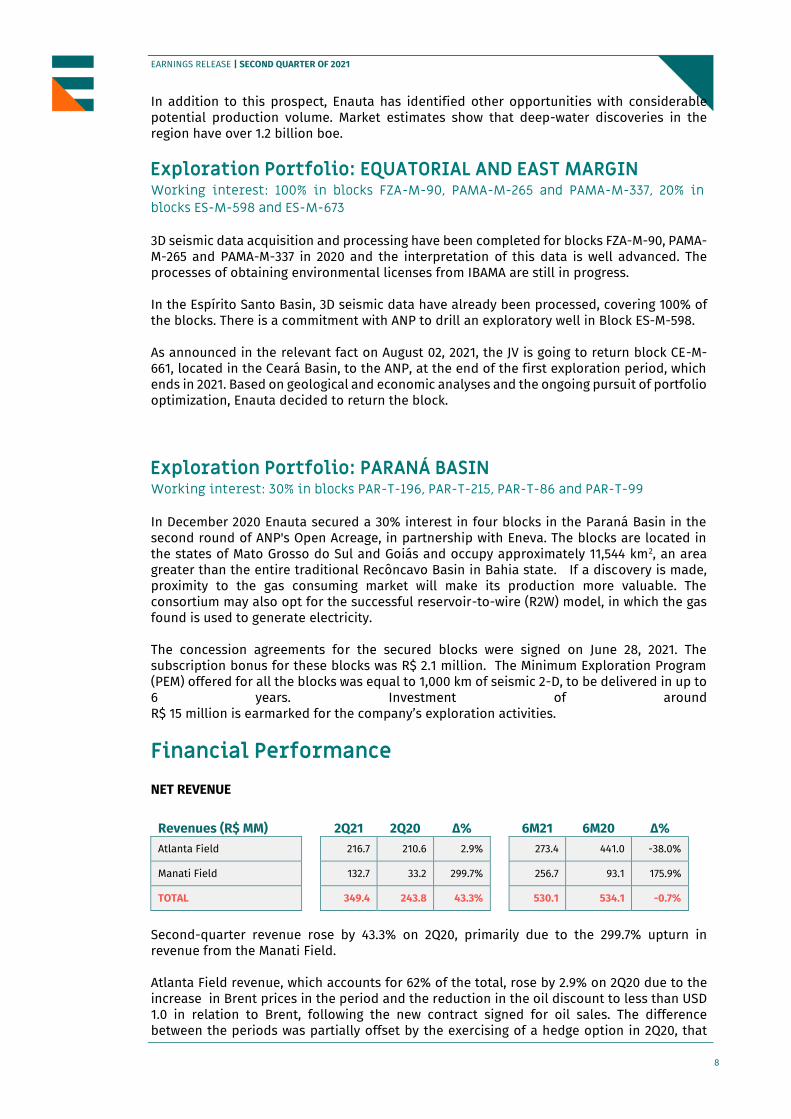
Production: Manati Field Block BCAM-40; Participation: 45%
Manati Production 2Q21 2Q20 ∆%
6M21 6M20 ∆%
Total Field Production (MMm³)
317.2 101.8 211.6% 616.7 283.2 117.8%
Average Daily Production (MMm³)
3.5 1.1 218.2% 3.4 1.6 112.5%
Production for 45% of the Company (MMm3)
142.7 45.8 211.6% 277.5 127.4 117.8%
PRODUCTION Daily average production in the Manati Field was 3.5 MMm³ in 2Q21. Because of the pandemic, the second quarter of 2020 was impacted by the reduction in natural gas consumption in the market, which did not repeat in 2021, leading to a 211.6% increase in the comparison between the two periods. SALE OF MANATI FIELD On August 16, 2020, the Company announced an agreement to sell its entire interest (45%) in the Manati Field to Gas Bridge S.A. The purchase price is R$ 560 million, which could increase as a result of certain events and regulatory and trade conditions. The accounting result in the period from December 31,2020 until the effective date of the transaction conclusion will be discounted from the total sale amount.. A series of conditions precedent have to be performed to sign the contract, which should be completed by December 31, 2021.
Exploration Portfolio: SERGIPE-ALAGOAS BASIN Working interest: 30% in 9 blocks The blocks located in the Sergipe-Alagoas Basin are high-prospect assets. Drilling of the first exploratory well at the Cutthroat prospect, located in Block SEAL-M-428, is expected to begin in the fourth quarter of 2021. The request for an environmental license for the drilling operation in the region is underway, and the EIS/EIR has already been submitted to IBAMA. Due to a term negotiated with partners during the farm-out process, Enauta is expected to invest approximately USD 8 million in this well.
8
8
EARNINGS RELEASE | SECOND QUARTER OF 2021
In addition to this prospect, Enauta has identified other opportunities with considerable potential production volume. Market estimates show that deep-water discoveries in the region have over 1.2 billion boe.
Exploration Portfolio: EQUATORIAL AND EAST MARGIN Working interest: 100% in blocks FZA-M-90, PAMA-M-265 and PAMA-M-337, 20% in blocks ES-M-598 and ES-M-673 3D seismic data acquisition and processing have been completed for blocks FZA-M-90, PAMA-M-265 and PAMA-M-337 in 2020 and the interpretation of this data is well advanced. The processes of obtaining environmental licenses from IBAMA are still in progress. In the Espírito Santo Basin, 3D seismic data have already been processed, covering 100% of the blocks. There is a commitment with ANP to drill an exploratory well in Block ES-M-598. As announced in the relevant fact on August 02, 2021, the JV is going to return block CE-M-661, located in the Ceará Basin, to the ANP, at the end of the first exploration period, which ends in 2021. Based on geological and economic analyses and the ongoing pursuit of portfolio optimization, Enauta decided to return the block.
Exploration Portfolio: PARANÁ BASIN Working interest: 30% in blocks PAR-T-196, PAR-T-215, PAR-T-86 and PAR-T-99 In December 2020 Enauta secured a 30% interest in four blocks in the Paraná Basin in the second round of ANP's Open Acreage, in partnership with Eneva. The blocks are located in the states of Mato Grosso do Sul and Goiás and occupy approximately 11,544 km2, an area greater than the entire traditional Recôncavo Basin in Bahia state. If a discovery is made, proximity to the gas consuming market will make its production more valuable. The consortium may also opt for the successful reservoir-to-wire (R2W) model, in which the gas found is used to generate electricity. The concession agreements for the secured blocks were signed on June 28, 2021. The subscription bonus for these blocks was R$ 2.1 million. The Minimum Exploration Program (PEM) offered for all the blocks was equal to 1,000 km of seismic 2-D, to be delivered in up to 6 years. Investment of around R$ 15 million is earmarked for the company’s exploration activities.
Financial Performance NET REVENUE
Revenues (R$ MM) 2Q21 2Q20 ∆%
6M21 6M20 ∆%
Atlanta Field 216.7 210.6 2.9% 273.4 441.0 -38.0%
Manati Field 132.7 33.2 299.7% 256.7 93.1 175.9%
TOTAL 349.4 243.8 43.3% 530.1 534.1 -0.7%
Second-quarter revenue rose by 43.3% on 2Q20, primarily due to the 299.7% upturn in revenue from the Manati Field. Atlanta Field revenue, which accounts for 62% of the total, rose by 2.9% on 2Q20 due to the increase in Brent prices in the period and the reduction in the oil discount to less than USD 1.0 in relation to Brent, following the new contract signed for oil sales. The difference between the periods was partially offset by the exercising of a hedge option in 2Q20, that
9
9
EARNINGS RELEASE | SECOND QUARTER OF 2021
generated revenue of R$ 49.8 million. In 2Q21 this generated an expense relating to the options premiums of R$ 4.7 million. For the six month period, revenue was flat. Manati's revenue grew 175.9%, offsetting Atlanta's 38.0% decrease.
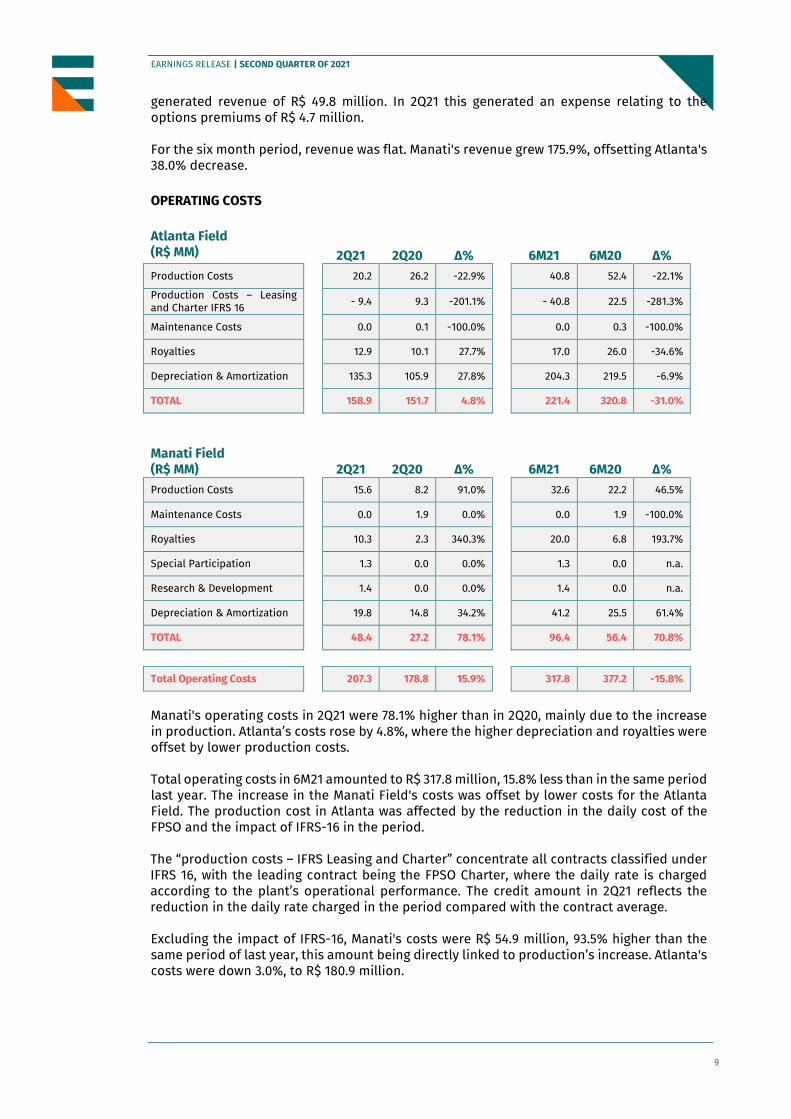
OPERATING COSTS Atlanta Field (R$ MM) 2Q21 2Q20 ∆%
6M21 6M20 ∆%
Production Costs 20.2 26.2 -22.9% 40.8 52.4 -22.1%
Production Costs – Leasing and Charter IFRS 16
- 9.4 9.3 -201.1% - 40.8 22.5 -281.3%
Maintenance Costs 0.0 0.1 -100.0% 0.0 0.3 -100.0%
Royalties 12.9 10.1 27.7% 17.0 26.0 -34.6%
Depreciation & Amortization 135.3 105.9 27.8% 204.3 219.5 -6.9%
TOTAL 158.9 151.7 4.8% 221.4 320.8 -31.0%
Manati Field (R$ MM) 2Q21 2Q20 ∆%
6M21 6M20 ∆% Production Costs 15.6 8.2 91.0% 32.6 22.2 46.5%
Maintenance Costs 0.0 1.9 0.0% 0.0 1.9 -100.0%
Royalties 10.3 2.3 340.3% 20.0 6.8 193.7%
Special Participation 1.3 0.0 0.0% 1.3 0.0 n.a.
Research & Development 1.4 0.0 0.0% 1.4 0.0 n.a.
Depreciation & Amortization 19.8 14.8 34.2% 41.2 25.5 61.4%
TOTAL 48.4 27.2 78.1% 96.4 56.4 70.8%
Total Operating Costs 207.3 178.8 15.9% 317.8 377.2 -15.8%
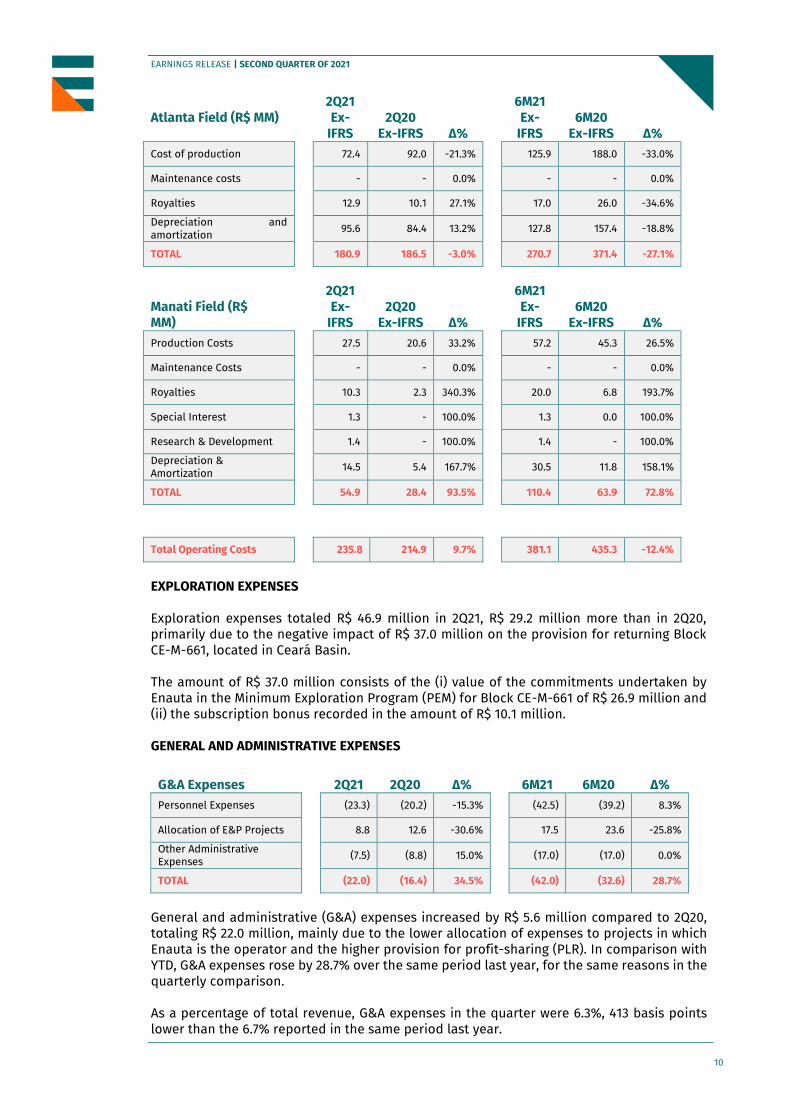
Manati's operating costs in 2Q21 were 78.1% higher than in 2Q20, mainly due to the increase in production. Atlanta’s costs rose by 4.8%, where the higher depreciation and royalties were offset by lower production costs. Total operating costs in 6M21 amounted to R$ 317.8 million, 15.8% less than in the same period last year. The increase in the Manati Field's costs was offset by lower costs for the Atlanta Field. The production cost in Atlanta was affected by the reduction in the daily cost of the FPSO and the impact of IFRS-16 in the period. The “production costs – IFRS Leasing and Charter” concentrate all contracts classified under IFRS 16, with the leading contract being the FPSO Charter, where the daily rate is charged according to the plant’s operational performance. The credit amount in 2Q21 reflects the reduction in the daily rate charged in the period compared with the contract average. Excluding the impact of IFRS-16, Manati's costs were R$ 54.9 million, 93.5% higher than the same period of last year, this amount being directly linked to production’s increase. Atlanta's costs were down 3.0%, to R$ 180.9 million.
10
10
EARNINGS RELEASE | SECOND QUARTER OF 2021
Atlanta Field (R$ MM)
2Q21 Ex-
IFRS 2Q20
Ex-IFRS ∆%
6M21 Ex-
IFRS 6M20
Ex-IFRS ∆% Cost of production 72.4 92.0 -21.3% 125.9 188.0 -33.0%
Maintenance costs - - 0.0% - - 0.0%
Royalties 12.9 10.1 27.1% 17.0 26.0 -34.6%
Depreciation and amortization
95.6 84.4 13.2% 127.8 157.4 -18.8%
TOTAL 180.9 186.5 -3.0% 270.7 371.4 -27.1%
Manati Field (R$ MM)
2Q21 Ex-
IFRS 2Q20
Ex-IFRS ∆%
6M21 Ex-
IFRS 6M20
Ex-IFRS ∆% Production Costs 27.5 20.6 33.2% 57.2 45.3 26.5%
Maintenance Costs - - 0.0% - - 0.0%
Royalties 10.3 2.3 340.3% 20.0 6.8 193.7%
Special Interest 1.3 - 100.0% 1.3 0.0 100.0%
Research & Development 1.4 - 100.0% 1.4 - 100.0%
Depreciation & Amortization
14.5 5.4 167.7% 30.5 11.8 158.1%
TOTAL 54.9 28.4 93.5% 110.4 63.9 72.8%
Total Operating Costs 235.8 214.9 9.7% 381.1 435.3 -12.4%
EXPLORATION EXPENSES Exploration expenses totaled R$ 46.9 million in 2Q21, R$ 29.2 million more than in 2Q20, primarily due to the negative impact of R$ 37.0 million on the provision for returning Block CE-M-661, located in Ceará Basin. The amount of R$ 37.0 million consists of the (i) value of the commitments undertaken by Enauta in the Minimum Exploration Program (PEM) for Block CE-M-661 of R$ 26.9 million and (ii) the subscription bonus recorded in the amount of R$ 10.1 million. GENERAL AND ADMINISTRATIVE EXPENSES
G&A Expenses 2Q21 2Q20 ∆% 6M21 6M20 ∆%
Personnel Expenses (23.3) (20.2) -15.3% (42.5) (39.2) 8.3%
Allocation of E&P Projects 8.8 12.6 -30.6% 17.5 23.6 -25.8%
Other Administrative Expenses
(7.5) (8.8) 15.0% (17.0) (17.0) 0.0%
TOTAL (22.0) (16.4) 34.5% (42.0) (32.6) 28.7%
General and administrative (G&A) expenses increased by R$ 5.6 million compared to 2Q20, totaling R$ 22.0 million, mainly due to the lower allocation of expenses to projects in which Enauta is the operator and the higher provision for profit-sharing (PLR). In comparison with YTD, G&A expenses rose by 28.7% over the same period last year, for the same reasons in the quarterly comparison. As a percentage of total revenue, G&A expenses in the quarter were 6.3%, 413 basis points lower than the 6.7% reported in the same period last year.
11
11
EARNINGS RELEASE | SECOND QUARTER OF 2021
OTHER OPERATING REVENUE Other operating revenue in 2Q21 was 443.0% higher than in 2Q20, totalling R$ 838.3 million. R$ 821.4 million of this amount denotes the nonrecurrent recording of the fair value of the additional 50% interest in the Atlanta Field and R$ 10.7 million denotes the agreement entered with Dommo, which settles all disputes related to the Atlanta Field. The other amounts of R$ 7.1 million denote tax credits resulting from excluding ICMS from the PIS and COFINS calculation base on top of the amount recorded last year, due to a Supreme Federal Court decision published in the official government press (Diário Oficial da União) on May 13, 2021. In 2Q20 other operating revenue was positively impacted by non-recurring events, including (i) R$ 121.0 million relating to the incorporation of Dommo's 20% interest in Atlanta Field B.V. (“AFBV”); and (ii) R$ 62.0 million relating to the tax credit resulting from the decision excluding ICMS from the PIS and COFINS calculation base paid from 2011, with R$ 39.6 million being recorded in this item. FAIR VALUE OF THE ADDITIONAL 50% INTEREST IN THE ATLANTA FIELD
The transfer of 50% of the previous rights and obligations from Barra Energia was analyzed and completed in 2Q21 as a business combination under CPC 15 and IFRS 3. The transaction resulted in a bargain purchase gain of R$ 797.0 million, primarily due to the added value of the exploration right of the Atlanta Field acquired and because the counterparty, Barra Energia, forewent the consideration for its interest in this venture when it notified the Company and ANP it would no longer continue in the project. The gain was recorded in profit or loss for the period ended June 30, 2021 under other operating revenue and expenses in the statement of profit or loss. The fair value of the interest in the Atlanta Field was estimated by using the projected discounted cash flow method. The estimated fair value was based on the following:
Real discount rate estimated at 8.0% 1P and 2P production curve (developed and undeveloped) certified on December 31,
2020 by GaffneyCline (the latest certification procured by the Company) weighted by the expected realization of the reserves less the effective production between January and June 2021 (acquisition date).
Early Production System (SPA) with the drilling of 3 wells and operation for 4 years. Full Development System (FDS) with five additional wells producing as from mid-
2024, by exchanging definitive FPSO and production capacity higher than current FPSO. The project was approved with a Capex estimated by the Company at the approximate amount of US$ 700 million.
Brent price estimated based on the Forward curve for 2021 and the median of Bloomberg's forecast for 2022 onwards (until 2034, when the concession expires).
The assets net of liabilities acquired were recorded in the financial information for 2Q21 based on a preliminary assessment of fair value by the cash flow method, as the independent assessment of the business acquired under CPC 15 and IFRS 3 had not been completed when this quarterly financial information was approved.
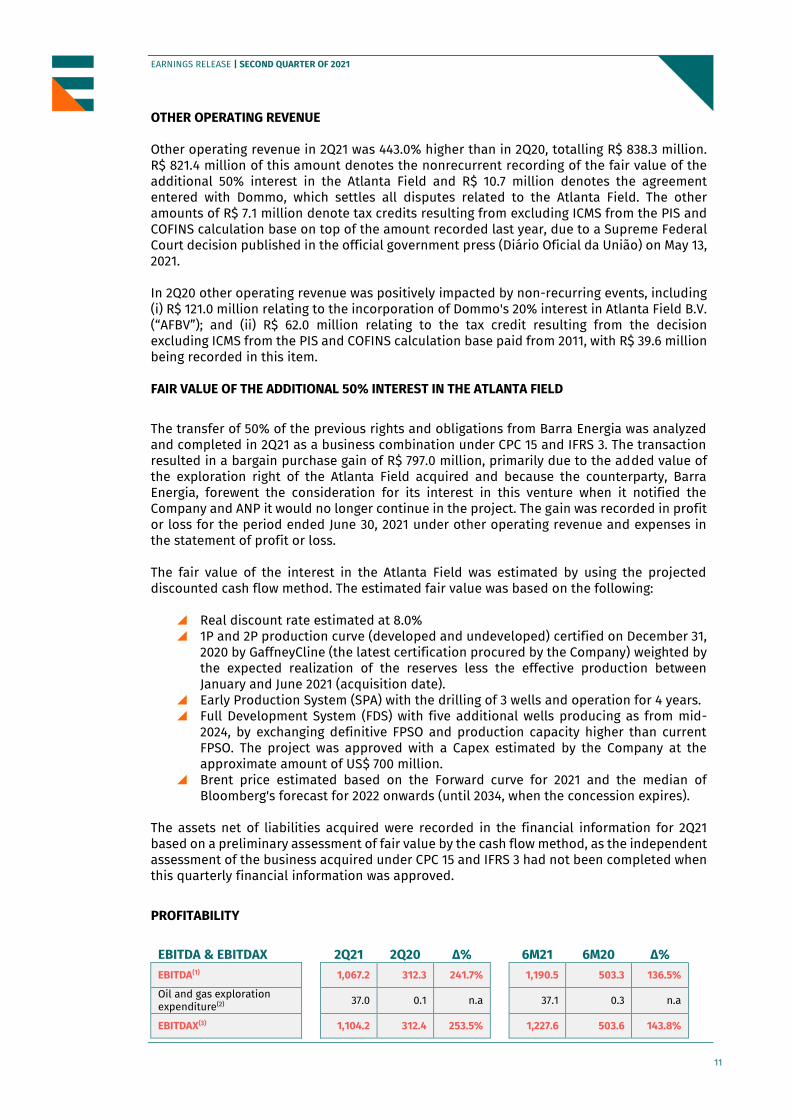
PROFITABILITY
EBITDA & EBITDAX 2Q21 2Q20 ∆%
6M21 6M20 ∆%
EBITDA(1) 1,067.2 312.3 241.7% 1,190.5 503.3 136.5%
Oil and gas exploration expenditure(2)
37.0 0.1 n.a 37.1 0.3 n.a
EBITDAX(3) 1,104.2 312.4 253.5% 1,227.6 503.6 143.8%
12
12
EARNINGS RELEASE | SECOND QUARTER OF 2021
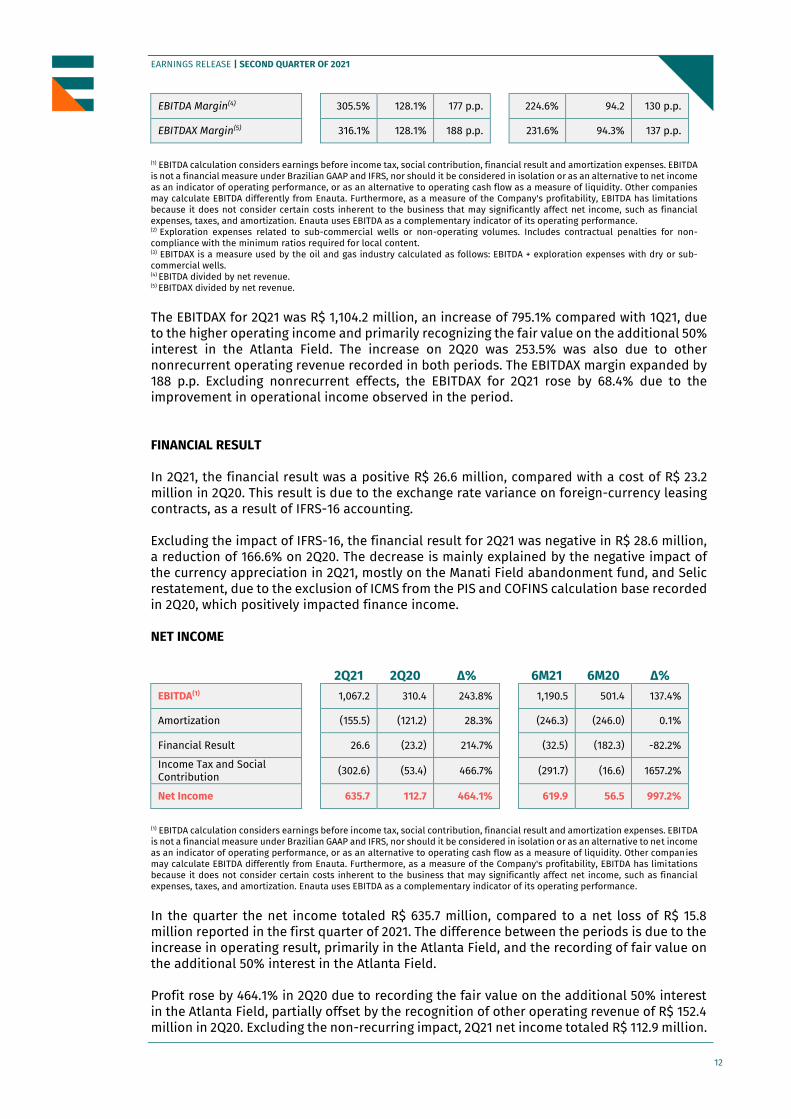
EBITDA Margin(4) 305.5% 128.1% 177 p.p. 224.6% 94.2 130 p.p.
EBITDAX Margin(5) 316.1% 128.1% 188 p.p. 231.6% 94.3% 137 p.p.
(1) EBITDA calculation considers earnings before income tax, social contribution, financial result and amortization expenses. EBITDA is not a financial measure under Brazilian GAAP and IFRS, nor should it be considered in isolation or as an alternative to net income as an indicator of operating performance, or as an alternative to operating cash flow as a measure of liquidity. Other companies may calculate EBITDA differently from Enauta. Furthermore, as a measure of the Company's profitability, EBITDA has limitations because it does not consider certain costs inherent to the business that may significantly affect net income, such as financial expenses, taxes, and amortization. Enauta uses EBITDA as a complementary indicator of its operating performance. (2) Exploration expenses related to sub-commercial wells or non-operating volumes. Includes contractual penalties for non-compliance with the minimum ratios required for local content. (3) EBITDAX is a measure used by the oil and gas industry calculated as follows: EBITDA + exploration expenses with dry or sub-commercial wells. (4) EBITDA divided by net revenue. (5) EBITDAX divided by net revenue.
The EBITDAX for 2Q21 was R$ 1,104.2 million, an increase of 795.1% compared with 1Q21, due to the higher operating income and primarily recognizing the fair value on the additional 50% interest in the Atlanta Field. The increase on 2Q20 was 253.5% was also due to other nonrecurrent operating revenue recorded in both periods. The EBITDAX margin expanded by 188 p.p. Excluding nonrecurrent effects, the EBITDAX for 2Q21 rose by 68.4% due to the improvement in operational income observed in the period. FINANCIAL RESULT In 2Q21, the financial result was a positive R$ 26.6 million, compared with a cost of R$ 23.2 million in 2Q20. This result is due to the exchange rate variance on foreign-currency leasing contracts, as a result of IFRS-16 accounting. Excluding the impact of IFRS-16, the financial result for 2Q21 was negative in R$ 28.6 million, a reduction of 166.6% on 2Q20. The decrease is mainly explained by the negative impact of the currency appreciation in 2Q21, mostly on the Manati Field abandonment fund, and Selic restatement, due to the exclusion of ICMS from the PIS and COFINS calculation base recorded in 2Q20, which positively impacted finance income. NET INCOME
2Q21 2Q20 ∆%
6M21 6M20 ∆%
EBITDA(1) 1,067.2 310.4 243.8% 1,190.5 501.4 137.4%
Amortization (155.5) (121.2) 28.3% (246.3) (246.0) 0.1%
Financial Result 26.6 (23.2) 214.7% (32.5) (182.3) -82.2%
Income Tax and Social Contribution
(302.6) (53.4) 466.7% (291.7) (16.6) 1657.2%
Net Income 635.7 112.7 464.1% 619.9 56.5 997.2%
(1) EBITDA calculation considers earnings before income tax, social contribution, financial result and amortization expenses. EBITDA is not a financial measure under Brazilian GAAP and IFRS, nor should it be considered in isolation or as an alternative to net income as an indicator of operating performance, or as an alternative to operating cash flow as a measure of liquidity. Other companies may calculate EBITDA differently from Enauta. Furthermore, as a measure of the Company's profitability, EBITDA has limitations because it does not consider certain costs inherent to the business that may significantly affect net income, such as financial expenses, taxes, and amortization. Enauta uses EBITDA as a complementary indicator of its operating performance.
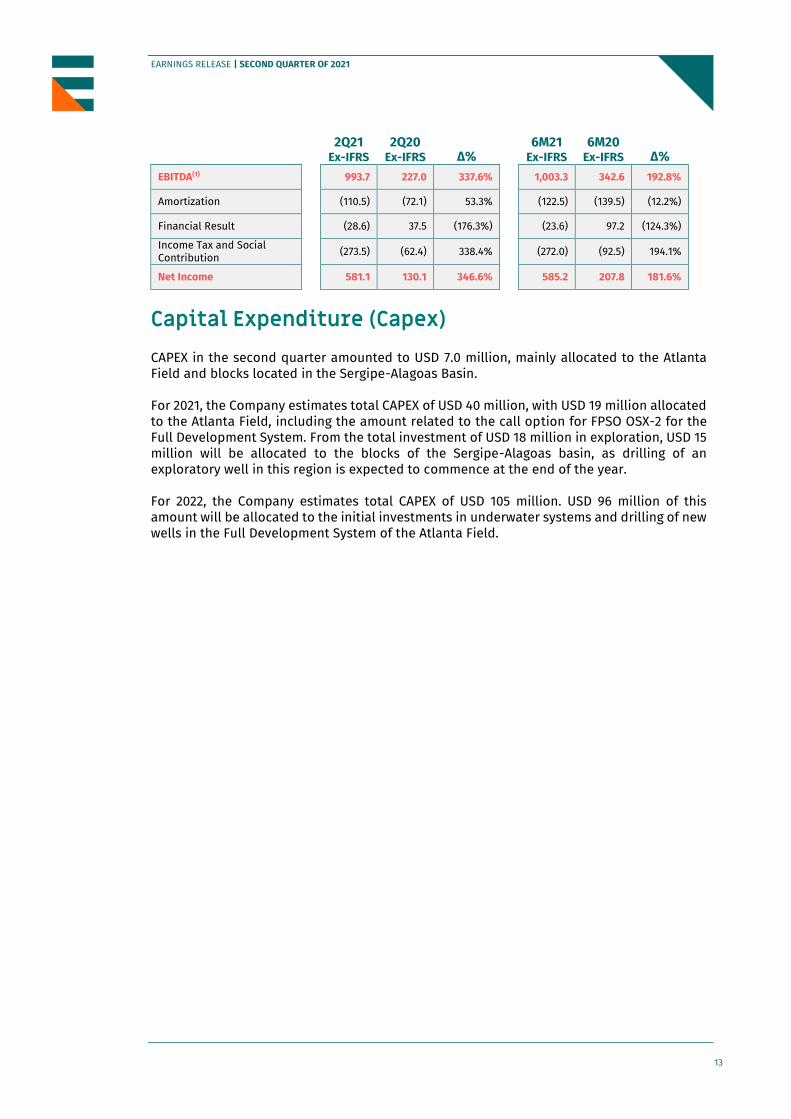
In the quarter the net income totaled R$ 635.7 million, compared to a net loss of R$ 15.8 million reported in the first quarter of 2021. The difference between the periods is due to the increase in operating result, primarily in the Atlanta Field, and the recording of fair value on the additional 50% interest in the Atlanta Field. Profit rose by 464.1% in 2Q20 due to recording the fair value on the additional 50% interest in the Atlanta Field, partially offset by the recognition of other operating revenue of R$ 152.4 million in 2Q20. Excluding the non-recurring impact, 2Q21 net income totaled R$ 112.9 million.
13
13
EARNINGS RELEASE | SECOND QUARTER OF 2021
2Q21
Ex-IFRS 2Q20
Ex-IFRS ∆%
6M21
Ex-IFRS 6M20
Ex-IFRS ∆% EBITDA(1) 993.7 227.0 337.6% 1,003.3 342.6 192.8%
Amortization (110.5) (72.1) 53.3% (122.5) (139.5) (12.2%)
Financial Result (28.6) 37.5 (176.3%) (23.6) 97.2 (124.3%)
Income Tax and Social Contribution
(273.5) (62.4) 338.4% (272.0) (92.5) 194.1%
Net Income 581.1 130.1 346.6% 585.2 207.8 181.6%
Capital Expenditure (Capex) CAPEX in the second quarter amounted to USD 7.0 million, mainly allocated to the Atlanta Field and blocks located in the Sergipe-Alagoas Basin. For 2021, the Company estimates total CAPEX of USD 40 million, with USD 19 million allocated to the Atlanta Field, including the amount related to the call option for FPSO OSX-2 for the Full Development System. From the total investment of USD 18 million in exploration, USD 15 million will be allocated to the blocks of the Sergipe-Alagoas basin, as drilling of an exploratory well in this region is expected to commence at the end of the year. For 2022, the Company estimates total CAPEX of USD 105 million. USD 96 million of this amount will be allocated to the initial investments in underwater systems and drilling of new wells in the Full Development System of the Atlanta Field.

14
14
EARNINGS RELEASE | SECOND QUARTER OF 2021
NET CAPEX FOR THE COMPANY (US$ MILLION)
Other Balance Sheet and Cash Flow Highlights CASH POSITION (CASH, CASH EQUIVALENTS AND SHORT-TERM INVESTMENTS)
On June 30, 2021, the Company recorded cash, cash equivalents and marketable securities of R$ 2.0 billion, 27.3% higher than in 2Q20 and 13.8% more than the balance recorded as of March 31, 2021. Following the transfer of the additional 50% interest in the Atlanta Field, on June 28, 2021 the Company recorded the receipt of R$ 212.4 million relating to the future abandonment of three wells and the decommissioning of facilities existing in the Field, pursuant to the agreement signed with Barra Energia do Brasil Petróleo e Gás Ltda. Currently, much of the Company’s funds are invested in conservative instruments indexed to Brazilian Reais. As of June 30, 2021, the average annual return of these investments was 101.3% of the CDI rate and 85.1% of the funds had daily liquidity.
96
8 1
2022 TOTAL CAPEX: US$ 105 MM
19
18
3
2021 TOTAL CAPEX: US$ 40 MM
Production Exploration Other
1
1
7
96
3
3
15
19
0 20 40 60 80 100 120
Other
Blocks 11th Round
Sergipe-Alagoas
Atlanta Field
2021 - TOTAL US$ 40 MM 2022 - TOTAL US$ 105 MM
15
15
EARNINGS RELEASE | SECOND QUARTER OF 2021
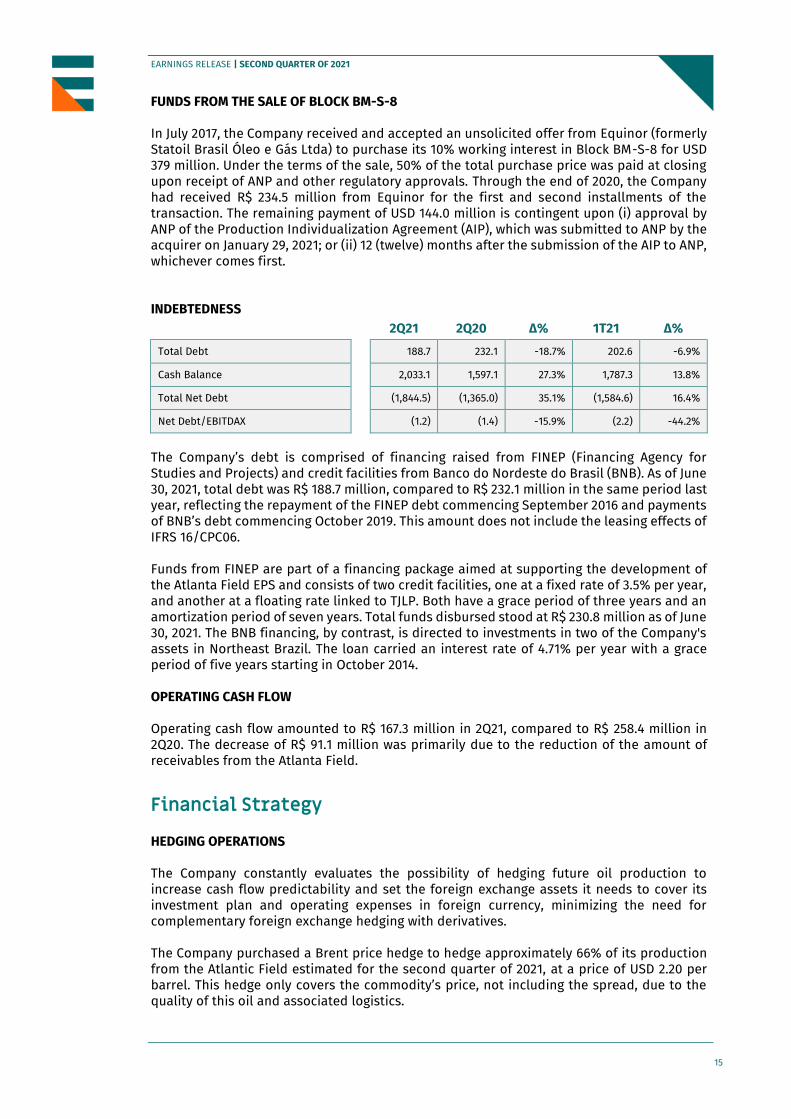
FUNDS FROM THE SALE OF BLOCK BM-S-8 In July 2017, the Company received and accepted an unsolicited offer from Equinor (formerly Statoil Brasil Óleo e Gás Ltda) to purchase its 10% working interest in Block BM-S-8 for USD 379 million. Under the terms of the sale, 50% of the total purchase price was paid at closing upon receipt of ANP and other regulatory approvals. Through the end of 2020, the Company had received R$ 234.5 million from Equinor for the first and second installments of the transaction. The remaining payment of USD 144.0 million is contingent upon (i) approval by ANP of the Production Individualization Agreement (AIP), which was submitted to ANP by the acquirer on January 29, 2021; or (ii) 12 (twelve) months after the submission of the AIP to ANP, whichever comes first. INDEBTEDNESS
2Q21 2Q20 ∆% 1T21 ∆%
Total Debt 188.7 232.1 -18.7% 202.6 -6.9%
Cash Balance 2,033.1 1,597.1 27.3% 1,787.3 13.8%
Total Net Debt (1,844.5) (1,365.0) 35.1% (1,584.6) 16.4%
Net Debt/EBITDAX (1.2) (1.4) -15.9% (2.2) -44.2%
The Company’s debt is comprised of financing raised from FINEP (Financing Agency for Studies and Projects) and credit facilities from Banco do Nordeste do Brasil (BNB). As of June 30, 2021, total debt was R$ 188.7 million, compared to R$ 232.1 million in the same period last year, reflecting the repayment of the FINEP debt commencing September 2016 and payments of BNB’s debt commencing October 2019. This amount does not include the leasing effects of IFRS 16/CPC06. Funds from FINEP are part of a financing package aimed at supporting the development of the Atlanta Field EPS and consists of two credit facilities, one at a fixed rate of 3.5% per year, and another at a floating rate linked to TJLP. Both have a grace period of three years and an amortization period of seven years. Total funds disbursed stood at R$ 230.8 million as of June 30, 2021. The BNB financing, by contrast, is directed to investments in two of the Company's assets in Northeast Brazil. The loan carried an interest rate of 4.71% per year with a grace period of five years starting in October 2014.
OPERATING CASH FLOW Operating cash flow amounted to R$ 167.3 million in 2Q21, compared to R$ 258.4 million in 2Q20. The decrease of R$ 91.1 million was primarily due to the reduction of the amount of receivables from the Atlanta Field.
Financial Strategy HEDGING OPERATIONS The Company constantly evaluates the possibility of hedging future oil production to increase cash flow predictability and set the foreign exchange assets it needs to cover its investment plan and operating expenses in foreign currency, minimizing the need for complementary foreign exchange hedging with derivatives.
The Company purchased a Brent price hedge to hedge approximately 66% of its production from the Atlantic Field estimated for the second quarter of 2021, at a price of USD 2.20 per barrel. This hedge only covers the commodity’s price, not including the spread, due to the quality of this oil and associated logistics.

16
16
EARNINGS RELEASE | SECOND QUARTER OF 2021
For 3Q21, the Company hedged 550 thousand barrels, which will cause the breakeven for operating cash generation in Atlanta to be reduced from USD 30.4/bbl to USD 7.8/bbl. In 4Q21, with hedging for 650 thousand barrels, the breakeven for operating cash generation will be reduced from USD 28.9/bbl to USD 5.3/bbl.
Hedge Data 2Q21 2Q20
Contracted instrument Asian PUT (quarterly average)
Asian PUT (quarterly average)
Barrels equivalent (kbbl) 400.0 390.0
Price per barrel (US$) 2.20 2.55
Average strike (US$) 47.5 56.7
Exercise of the option
Barrels equivalent (kbbl) 400.0 390.0
Price per barrel (US$) 0.0 23.31
Result (R$ million) (4.7) 49.8
2Q21 results had no positive impact from the exercising of options. Based on the hedge accounting policy adopted by the Company, the premium of the put options for 400 thousand barrels, expired in the quarter, was recognized as operating revenue, with a negative impact of R$ 4.7 million.
Forecasts Guidance 2021 Real 6M21 Atlanta’s Average Daily Production (kbbl/day) 10.8 ≤ ∆ ≤ 13.2 9.1
Investments in exploration, development and production (R$ million)
32 ≤ ∆ ≤ 48 13.5
Atlanta: The Company estimates average production of 12,000 barrels per day in 2021. Forecasts consider a plus or minus 10% variation when the daily average is verified on an annual basis.
Capex: Estimated USD 40 million for 2021 and USD 105 million for 2022. These projections have a plus or minus 20% variance (twenty percent).
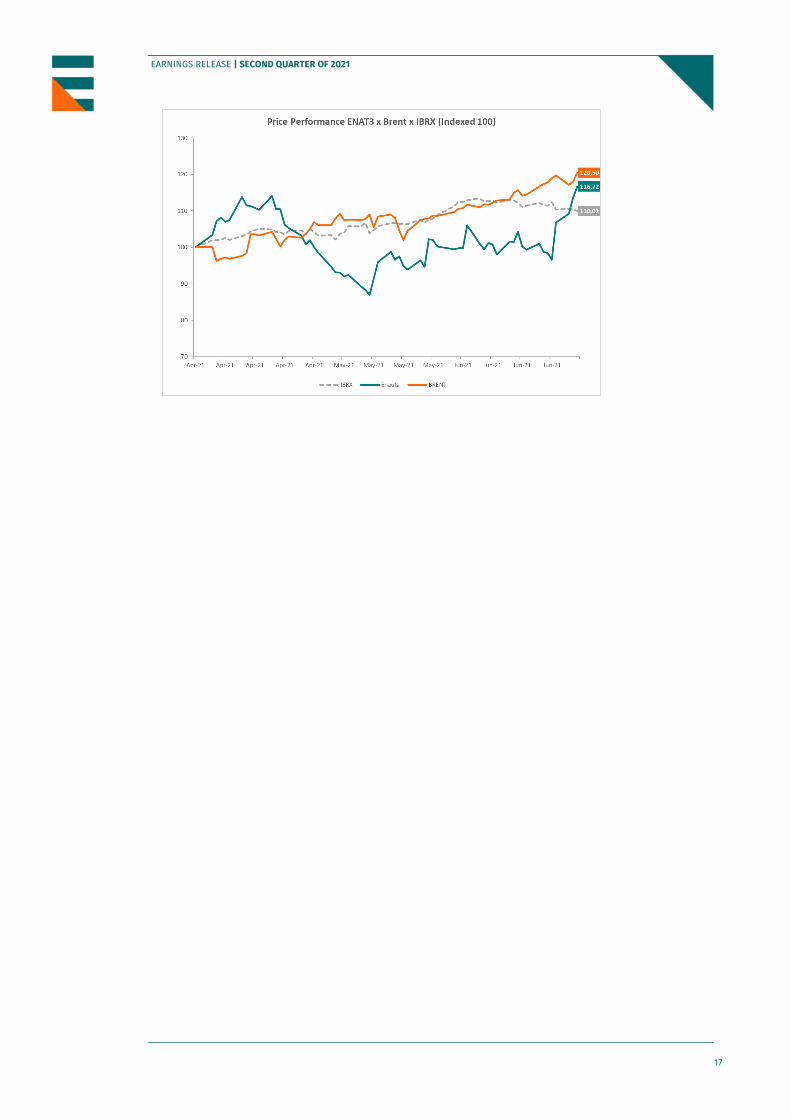
Capital Market The Company’s stock (B3: ENAT3) ended 2Q21 quoted at R$ 18.01, corresponding to a market cap of R$ 4.7 billion, appreciating 76.4% compared to the price recorded on June 30, 2020 and 15.5% compared to the price on March 31, 2021. This appreciation outperformed Ibovespa for the period. Regarding the Brent price, Enauta followed the same trend, attesting to investors' confidence in the company as the industry recovers.
ENAT3 30/jun/2021 Market Cap (R$ billion) 4.7
Total shares issued 265.806.905
Price variation 52 weeks (R$/share) +76.4%
Opening share price in 2Q21 (R$/share) 15.23
Closing share price in 2Q21 (R$/share) 18.01
Average daily trading volume in 2Q21 (R$ million) 29.59
17
17
EARNINGS RELEASE | SECOND QUARTER OF 2021
18
18
EARNINGS RELEASE | SECOND QUARTER OF 2021
Appendix I | Income Statement
Income Statement 2Q21 2Q20 ∆%
6M21 6M20 ∆%
Net Revenue 349.4 243.8 43.3% 530.1 534.1 -0.7%
Costs (207.3) (178.8) 15.9% (317.8) (377.2) -15.8%
Gross Profit 142.1 65.0 118.7% 212.4 156.9 35.4%
Operating income (expenses)
G&A expenses (22.0) (16.4) 34.5% (42.0) (32.6) 28.7%
Equity income 0.2 5.9 -97.0% (0.2) 11.1 -101.5%
Exploration Expenses (46.9) (17.7) 164.8% (63.8) (32.4) 97.1%
Other net operating income (expenses)
838.3 152.2 450.8% 837.8 152.5 449.4%
Operating income (loss) 911.7 189.2 381.9% 944.2 255.4 269.7%
Net Financial Result 26.6 (23.2) 214.8% (32.5) (182.3) -82.2%
Profit before income tax and social contribution
938.3 166.0 465.1% 911.7 73.1 1,147.4%
Income tax and social contribution
(302.5) (53.4) 466.8% (291.7) (16.6) 1,656.9%
Net Income (Loss) 635.7 112.7 464.2% 619.9 56.5 997.5%
Net cash generated from operating activities
167.2 273.1 -38.7% 242.6 575.5 -57.8%
EBITDAX(1) 1,104.2 312.4 253.5% 401.3 501.7 -20.0%
((1) EBITDAX is a measure used by the oil and gas industry calculated as follows: EBITDA + exploration expenses with dry or sub-commercial wells.
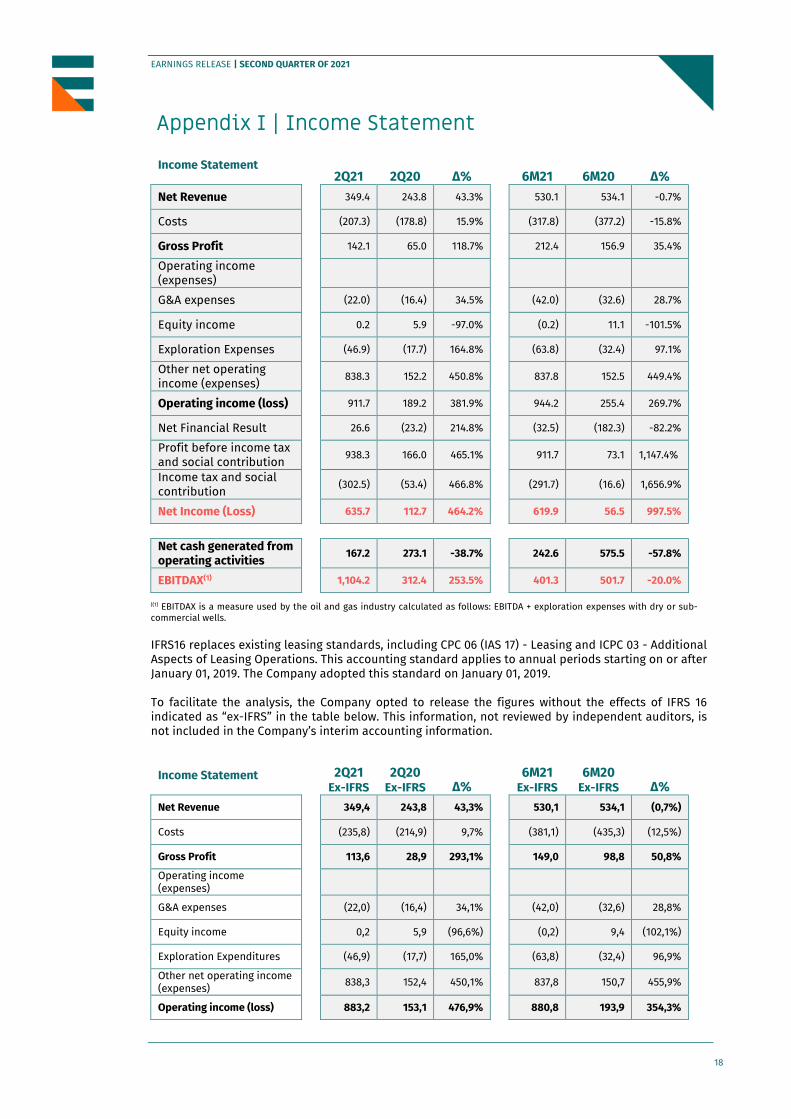
IFRS16 replaces existing leasing standards, including CPC 06 (IAS 17) - Leasing and ICPC 03 - Additional Aspects of Leasing Operations. This accounting standard applies to annual periods starting on or after January 01, 2019. The Company adopted this standard on January 01, 2019. To facilitate the analysis, the Company opted to release the figures without the effects of IFRS 16 indicated as “ex-IFRS” in the table below. This information, not reviewed by independent auditors, is not included in the Company’s interim accounting information.
Income Statement
2Q21 Ex-IFRS
2Q20 Ex-IFRS ∆%
6M21
Ex-IFRS 6M20
Ex-IFRS ∆% Net Revenue 349,4 243,8 43,3% 530,1 534,1 (0,7%)
Costs (235,8) (214,9) 9,7% (381,1) (435,3) (12,5%)
Gross Profit 113,6 28,9 293,1% 149,0 98,8 50,8%
Operating income (expenses)
G&A expenses (22,0) (16,4) 34,1% (42,0) (32,6) 28,8%
Equity income 0,2 5,9 (96,6%) (0,2) 9,4 (102,1%)
Exploration Expenditures (46,9) (17,7) 165,0% (63,8) (32,4) 96,9%
Other net operating income (expenses)
838,3 152,4 450,1% 837,8 150,7 455,9%
Operating income (loss) 883,2 153,1 476,9% 880,8 193,9 354,3%
19
19
EARNINGS RELEASE | SECOND QUARTER OF 2021
Net Financial Result -28,6% 39,4 (100,7%) (23,6) 100,9 (123,4%)
Profit before income tax and social contribution
854,6 192,5 343,9% 857,2 294,8 190,8%
Income tax and social contribution
(273,5) (62,4) 338,3% (272,0) (92,5) 194,1%
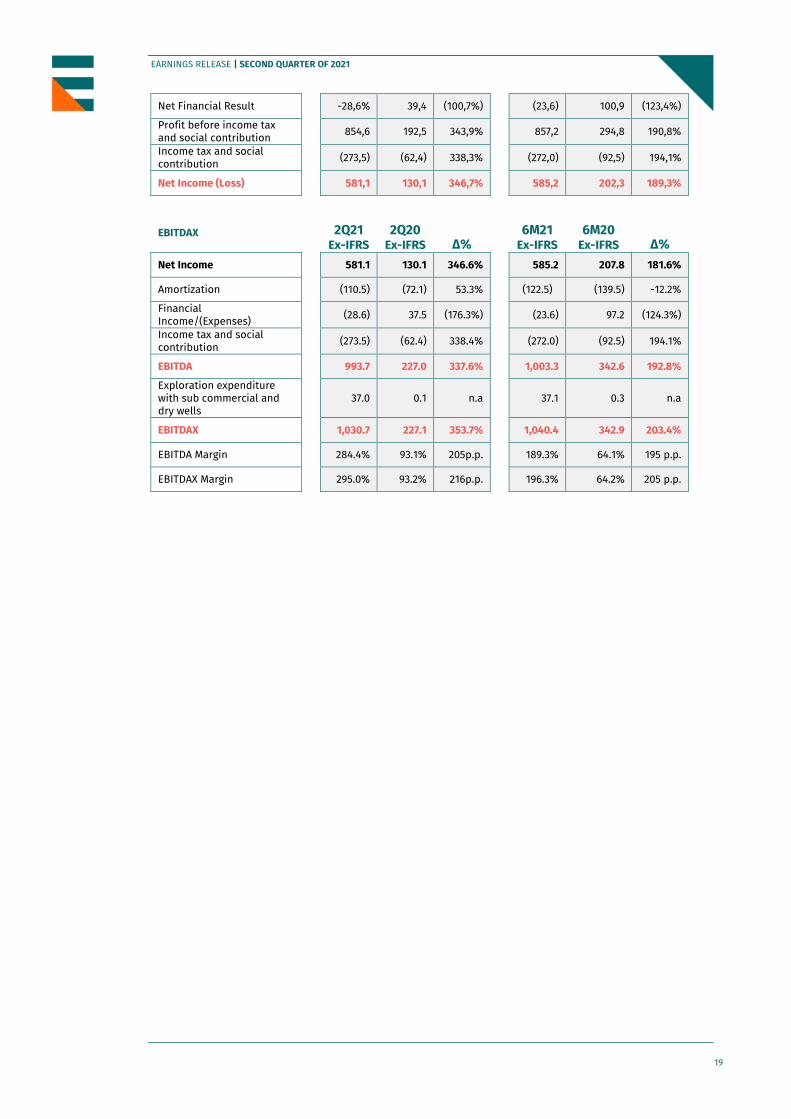
Net Income (Loss) 581,1 130,1 346,7% 585,2 202,3 189,3%
EBITDAX
2Q21 Ex-IFRS
2Q20 Ex-IFRS ∆%
6M21
Ex-IFRS 6M20
Ex-IFRS ∆% Net Income 581.1 130.1 346.6% 585.2 207.8 181.6%
Amortization (110.5) (72.1) 53.3% (122.5) (139.5) -12.2%
Financial Income/(Expenses)
(28.6) 37.5 (176.3%) (23.6) 97.2 (124.3%)
Income tax and social contribution
(273.5) (62.4) 338.4% (272.0) (92.5) 194.1%
EBITDA 993.7 227.0 337.6% 1,003.3 342.6 192.8%
Exploration expenditure with sub commercial and dry wells
37.0 0.1 n.a
37.1 0.3 n.a
EBITDAX 1,030.7 227.1 353.7% 1,040.4 342.9 203.4%
EBITDA Margin 284.4% 93.1% 205p.p. 189.3% 64.1% 195 p.p.
EBITDAX Margin 295.0% 93.2% 216p.p. 196.3% 64.2% 205 p.p.
20
20
EARNINGS RELEASE | SECOND QUARTER OF 2021
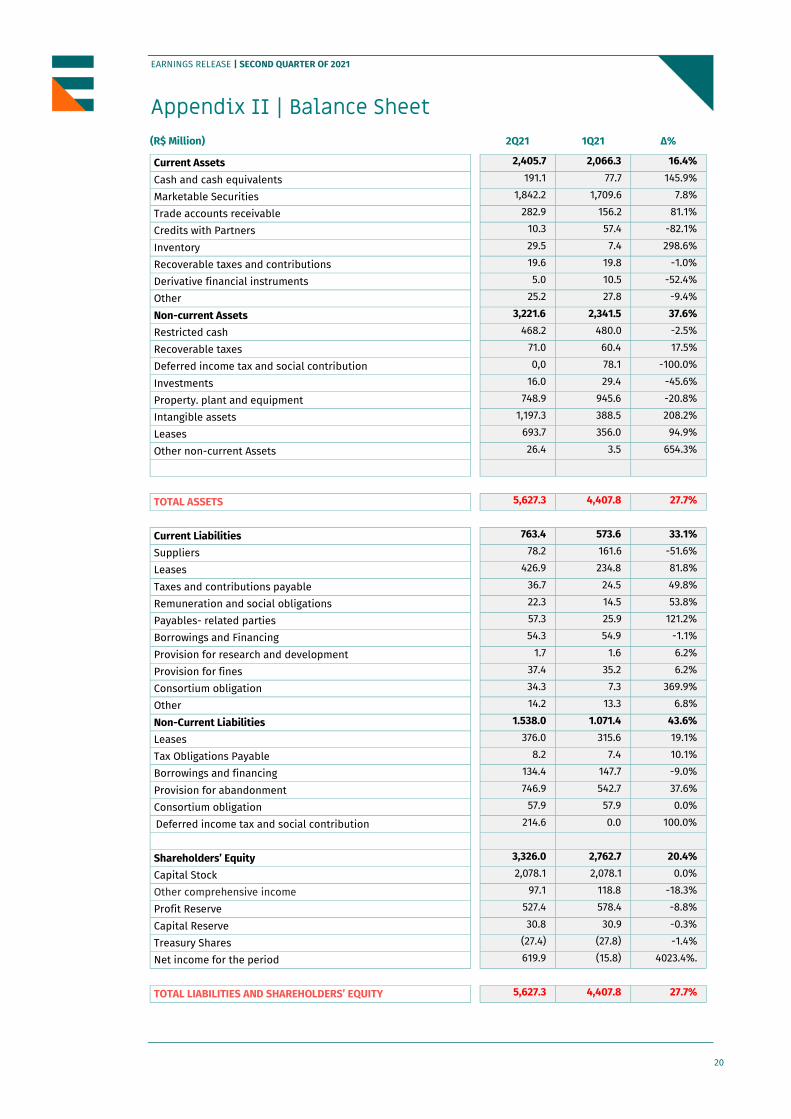
Appendix II | Balance Sheet
(R$ Million)
2Q21 1Q21 ∆%
Current Assets 2,405.7 2,066.3 16.4%
Cash and cash equivalents 191.1 77.7 145.9%
Marketable Securities 1,842.2 1,709.6 7.8%
Trade accounts receivable 282.9 156.2 81.1%
Credits with Partners 10.3 57.4 -82.1%
Inventory 29.5 7.4 298.6%
Recoverable taxes and contributions 19.6 19.8 -1.0%
Derivative financial instruments 5.0 10.5 -52.4%
Other 25.2 27.8 -9.4%
Non-current Assets 3,221.6 2,341.5 37.6%
Restricted cash 468.2 480.0 -2.5%
Recoverable taxes 71.0 60.4 17.5%
Deferred income tax and social contribution 0,0 78.1 -100.0%
Investments 16.0 29.4 -45.6%
Property. plant and equipment 748.9 945.6 -20.8%
Intangible assets 1,197.3 388.5 208.2%
Leases 693.7 356.0 94.9%
Other non-current Assets 26.4 3.5 654.3%
TOTAL ASSETS 5,627.3 4,407.8 27.7%
Current Liabilities 763.4 573.6 33.1%
Suppliers 78.2 161.6 -51.6%
Leases 426.9 234.8 81.8%
Taxes and contributions payable 36.7 24.5 49.8%
Remuneration and social obligations 22.3 14.5 53.8%
Payables- related parties 57.3 25.9 121.2%
Borrowings and Financing 54.3 54.9 -1.1%
Provision for research and development 1.7 1.6 6.2%
Provision for fines 37.4 35.2 6.2%
Consortium obligation 34.3 7.3 369.9%
Other 14.2 13.3 6.8%
Non-Current Liabilities 1.538.0 1.071.4 43.6%
Leases 376.0 315.6 19.1%
Tax Obligations Payable 8.2 7.4 10.1%
Borrowings and financing 134.4 147.7 -9.0%
Provision for abandonment 746.9 542.7 37.6%
Consortium obligation 57.9 57.9 0.0%
Deferred income tax and social contribution 214.6 0.0 100.0%
Shareholders’ Equity 3,326.0 2,762.7 20.4%
Capital Stock 2,078.1 2,078.1 0.0%
Other comprehensive income 97.1 118.8 -18.3%
Profit Reserve 527.4 578.4 -8.8%
Capital Reserve 30.8 30.9 -0.3%
Treasury Shares (27.4) (27.8) -1.4%
Net income for the period 619.9 (15.8) 4023.4%.
TOTAL LIABILITIES AND SHAREHOLDERS’ EQUITY 5,627.3 4,407.8 27.7%

21
21
EARNINGS RELEASE | SECOND QUARTER OF 2021
Appendix III | Cash Flows
CASH FLOW OF OPERATING ACTIVITIES
(R$ Million) 2Q21 2Q20 ∆% 6M21 6M20 ∆%
Net income for the period 635.7 112.7 464.1% 619.9 56.5 997.2%
ADJUSTMENTS TO RECONCILE NET INCOME TO NET CASH PROVIDED BY OPERATING ACTIVITIES
Equity Income (0.2) (5.9) -96.6% 0.2 (11.1) 101.8%
Exchange variation over investment 0.0 (171.2) 100% 0.0 (171.2) -100.0%
Amortization and depreciation 127.5 95.5 33.5%
181.9 178.8 1.7%
Amortization and depreciation – IFRS 16 43.6 31.0 40.6%
95.3 76.8 24.1%
IFRS 16 financial charges (39.7) 0.0 -247.6%
13.0 253.8 -105.1%
Deferred income tax and social contribution 292.7 59.8 389.5% 281.1 (9.6) 3028.1%
IFRS 16 financial charges (33.1) 62.6 -152.9% (22.0) 27.6 -179.7%
Financial charges and exchange rate (gain) loss on borrowings and financing 2.3 2.8 -17.9%
4.9 5.6 -12.5%
Investment acquisition 0.0 120.9 -100%
0.0 120.9 -100.0%
Increased participation in consortium (821.4) 0.0 -100%
(821.4) 0.0 -100.0%
Write-off 10.1 0.0 n.a. 10.1 (0.1) n.a
Exercise of stock option 0.0 0.2 -100.0% 0.0 0.2 -100.0%
Provision for stock option plan (0.4) (0.1) 300.0% 5.8 (1.6) 462.5%
Provision for income tax and social contribution
9.9 (6.4) 254.7% 10.7 26.2 -59.2%
Provision for research and development 0.1 (0.7) 114.3% (0.2) (1.8) -88.9%
(Increase) decrease in operating assets: (127.0) (7.5) 1593.3
%
(227.0) 56.9 -498.9%
Increase in operating liabilities: 1.4 85.6 -98.4% 24.5 38.6 -36.5%
Net cash generated by operating activities 101.4 137.4 -26.2% 176.8 575.4 -69.3%
CASH FLOW FROM INVESTING ACTIVITIES
Net cash from (used in) investing activities 152.7 168 -9.1% 139.3 (11.5) 1311.3%
CASH FLOWS FROM FINANCING ACTIVITIES
Net cash inflows from (used in) financing activities (136.2) (376.9) 63.9% (230.9) (482.2) 52.1%
Total exchange variation on cash and cash equivalents (4.6) 45.9 -110.0% 2.6 105.6 -97.5%
Increase (decrease) in cash and cash equivalents 113.3 (24.9) 555.0% 87.7 (24.0) 465.4%
Cash and cash equivalents at the beginning of the period
77.7 52.2 48.9% 103.2 51.3 101.2%
Cash and cash equivalents at the end of the period
191.0 27.3 599.6% 191.0 27.3 599.6%
Increase (decrease) in cash and cash equivalents 113.3 (24.9) 555.0% 87.7 (24.0) 465.4%
22
22
EARNINGS RELEASE | SECOND QUARTER OF 2021
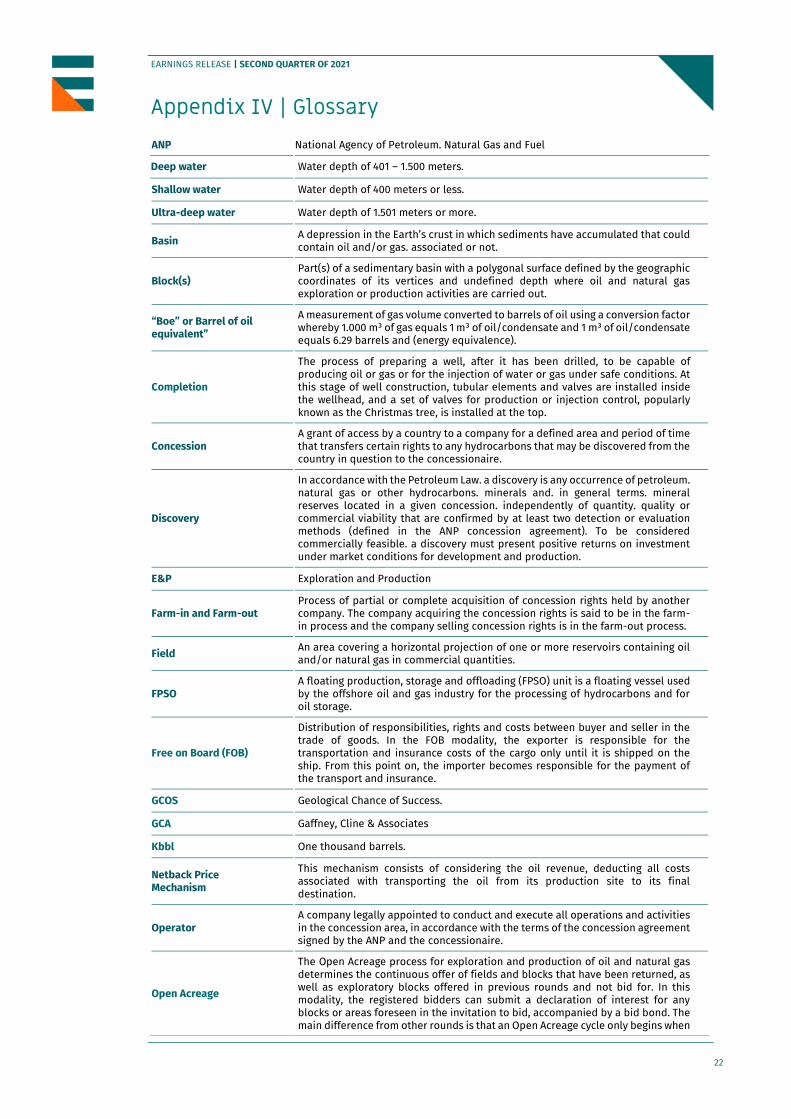
Appendix IV | Glossary ANP National Agency of Petroleum. Natural Gas and Fuel
Deep water Water depth of 401 – 1.500 meters.
Shallow water Water depth of 400 meters or less.
Ultra-deep water Water depth of 1.501 meters or more.
Basin A depression in the Earth’s crust in which sediments have accumulated that could contain oil and/or gas. associated or not.
Block(s) Part(s) of a sedimentary basin with a polygonal surface defined by the geographic coordinates of its vertices and undefined depth where oil and natural gas exploration or production activities are carried out.
“Boe” or Barrel of oil equivalent”
A measurement of gas volume converted to barrels of oil using a conversion factor whereby 1.000 m³ of gas equals 1 m³ of oil/condensate and 1 m³ of oil/condensate equals 6.29 barrels and (energy equivalence).
Completion
The process of preparing a well, after it has been drilled, to be capable of producing oil or gas or for the injection of water or gas under safe conditions. At this stage of well construction, tubular elements and valves are installed inside the wellhead, and a set of valves for production or injection control, popularly known as the Christmas tree, is installed at the top.
Concession A grant of access by a country to a company for a defined area and period of time that transfers certain rights to any hydrocarbons that may be discovered from the country in question to the concessionaire.
Discovery
In accordance with the Petroleum Law. a discovery is any occurrence of petroleum. natural gas or other hydrocarbons. minerals and. in general terms. mineral reserves located in a given concession. independently of quantity. quality or commercial viability that are confirmed by at least two detection or evaluation methods (defined in the ANP concession agreement). To be considered commercially feasible. a discovery must present positive returns on investment under market conditions for development and production.
E&P Exploration and Production
Farm-in and Farm-out Process of partial or complete acquisition of concession rights held by another company. The company acquiring the concession rights is said to be in the farm-in process and the company selling concession rights is in the farm-out process.
Field An area covering a horizontal projection of one or more reservoirs containing oil and/or natural gas in commercial quantities.
FPSO A floating production, storage and offloading (FPSO) unit is a floating vessel used by the offshore oil and gas industry for the processing of hydrocarbons and for oil storage.
Free on Board (FOB)
Distribution of responsibilities, rights and costs between buyer and seller in the trade of goods. In the FOB modality, the exporter is responsible for the transportation and insurance costs of the cargo only until it is shipped on the ship. From this point on, the importer becomes responsible for the payment of the transport and insurance.
GCOS Geological Chance of Success.
GCA Gaffney, Cline & Associates
Kbbl One thousand barrels.
Netback Price Mechanism
This mechanism consists of considering the oil revenue, deducting all costs associated with transporting the oil from its production site to its final destination.
Operator A company legally appointed to conduct and execute all operations and activities in the concession area, in accordance with the terms of the concession agreement signed by the ANP and the concessionaire.
Open Acreage
The Open Acreage process for exploration and production of oil and natural gas determines the continuous offer of fields and blocks that have been returned, as well as exploratory blocks offered in previous rounds and not bid for. In this modality, the registered bidders can submit a declaration of interest for any blocks or areas foreseen in the invitation to bid, accompanied by a bid bond. The main difference from other rounds is that an Open Acreage cycle only begins when
23
23
EARNINGS RELEASE | SECOND QUARTER OF 2021
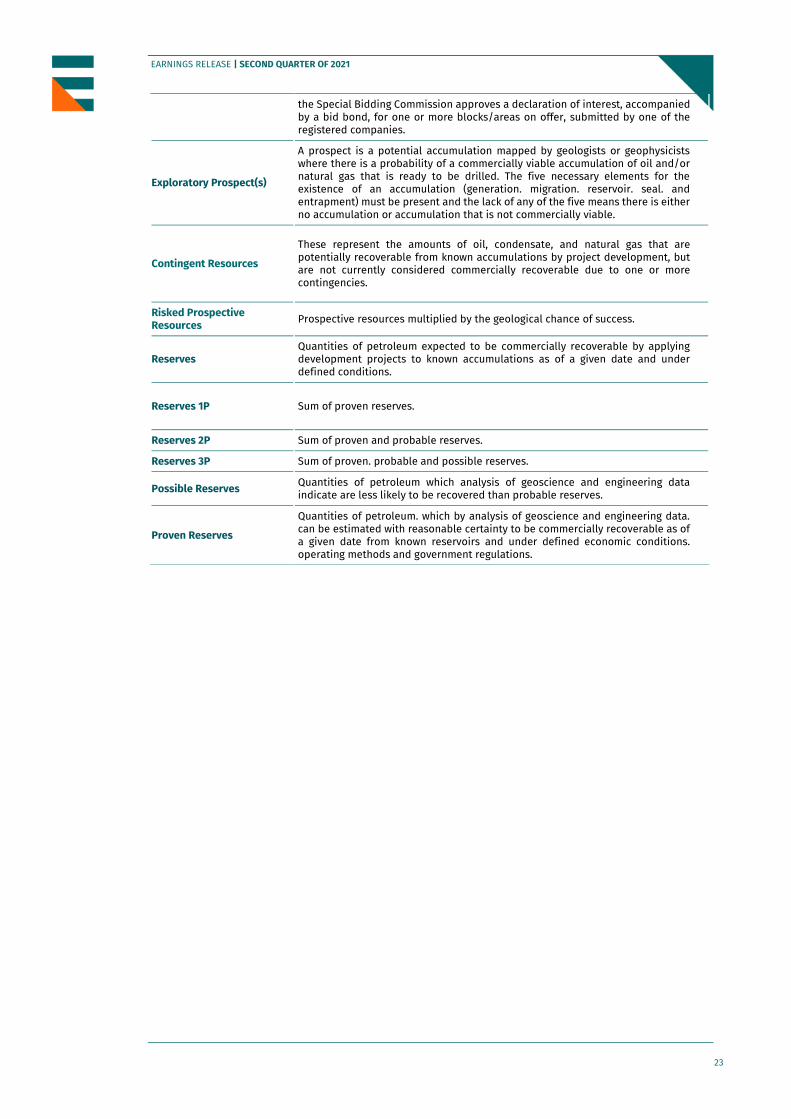
the Special Bidding Commission approves a declaration of interest, accompanied by a bid bond, for one or more blocks/areas on offer, submitted by one of the registered companies.
Exploratory Prospect(s)
A prospect is a potential accumulation mapped by geologists or geophysicists where there is a probability of a commercially viable accumulation of oil and/or natural gas that is ready to be drilled. The five necessary elements for the existence of an accumulation (generation. migration. reservoir. seal. and entrapment) must be present and the lack of any of the five means there is either no accumulation or accumulation that is not commercially viable.
Contingent Resources
These represent the amounts of oil, condensate, and natural gas that are potentially recoverable from known accumulations by project development, but are not currently considered commercially recoverable due to one or more contingencies.
Risked Prospective Resources Prospective resources multiplied by the geological chance of success.
Reserves Quantities of petroleum expected to be commercially recoverable by applying development projects to known accumulations as of a given date and under defined conditions.
Reserves 1P Sum of proven reserves.
Reserves 2P Sum of proven and probable reserves.
Reserves 3P Sum of proven. probable and possible reserves.
Possible Reserves Quantities of petroleum which analysis of geoscience and engineering data indicate are less likely to be recovered than probable reserves.
Proven Reserves
Quantities of petroleum. which by analysis of geoscience and engineering data. can be estimated with reasonable certainty to be commercially recoverable as of a given date from known reservoirs and under defined economic conditions. operating methods and government regulations.

Investor Relations Paula Costa Côrte-Real
CFO and Investor Relations Officer Renata Amarante Investor Relations Manager Caroline Cardoso Investor Relations Analyst
Av. Almirante Barroso. no 52. sala 1301. Centro - Rio de Janeiro. RJ
CEP: 20031-918
Phone: 55 21 3509-5959
E-mail: [email protected] www.enauta.com.br/ri
About Enauta Enauta is one of the leading private companies in the exploration and production sector in Brazil. The Company has a balanced asset portfolio spread through the Brazilian coast. and two producing assets: its 45%-owned Manati Field. one of the main suppliers of gas to the Northeast region of Brazil; and the Atlanta Field. located in the deep waters of the Santos Basin. where it is the operator. with a 100% ownership stake. Listed on the Novo Mercado of B3 since 2011. under the ticker symbol QGEP3. Enauta is committed to the sustainability of its operations. investing responsibly and adhering to best practices in the areas of governance and compliance. For more information. visit us at www.enauta.com.br. This press release may contain information relating to future business prospects. estimates of financial and operational results and growth of the company. This information should be considered as projections based exclusively on management expectations regarding future business developments and the availability of capital to finance the Company’s business plan. Such future considerations are substantially subject to changes in market conditions. government regulations. competitive pressures and developments within the sector and the Brazilian economy, among other factors. These points should also be considered along with risks disclosed in documents previously published by the Company. It should be understood that all these factors are subject to change without notice.