Embed Size (px)
Citation preview

Third Quarter 2015
Earnings Release October 21, 2015

Forward Looking Statements
We are making some forward looking statements today that use words like “outlook” or “target” or similar predictive
words. Such forward looking statements involve risks and uncertainties detailed in our recent periodic reports as filed in
accordance with the Securities and Exchange Act of 1934. These risks and uncertainties may cause actual results to
differ materially from our statements today.
2 Visit www.tupperwarebrands.com or download Investor Relations app
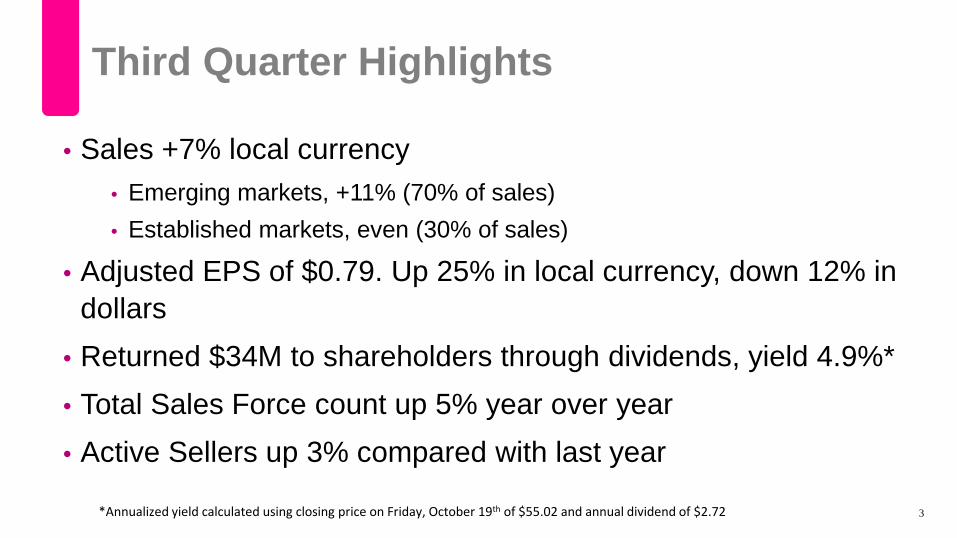
Third Quarter Highlights
• Sales +7% local currency • Emerging markets, +11% (70% of sales) • Established markets, even (30% of sales)
• Adjusted EPS of $0.79. Up 25% in local currency, down 12% in dollars
• Returned $34M to shareholders through dividends, yield 4.9%* • Total Sales Force count up 5% year over year • Active Sellers up 3% compared with last year
3 *Annualized yield calculated using closing price on Friday, October 19th of $55.02 and annual dividend of $2.72
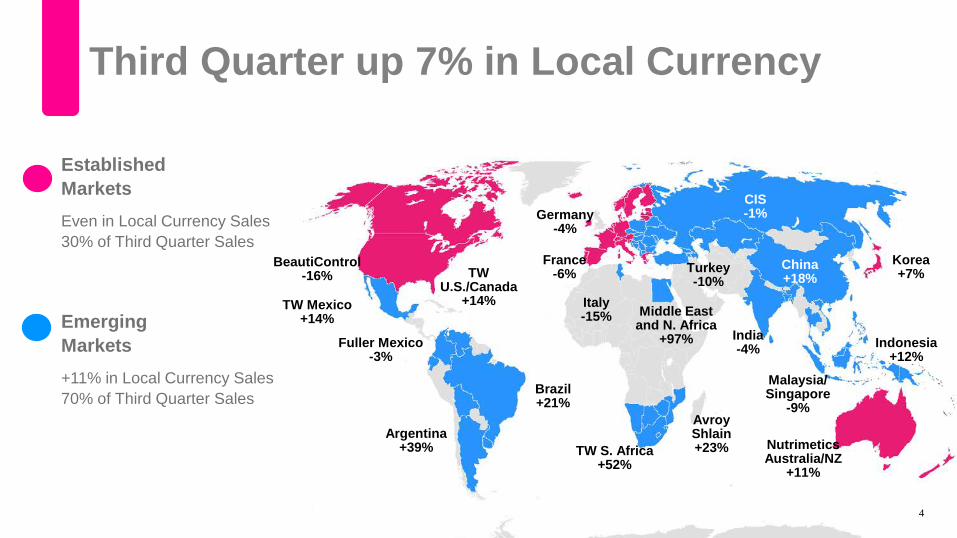
Third Quarter up 7% in Local Currency
Established Markets
Even in Local Currency Sales 30% of Third Quarter Sales
4
Emerging Markets
+11% in Local Currency Sales 70% of Third Quarter Sales Brazil
+21%
Indonesia +12%
Malaysia/ Singapore
-9%
India -4%
TW Mexico +14%
China +18%
Germany -4%
France -6%
TW S. Africa +52%
TW U.S./Canada
+14%
BeautiControl -16%
Fuller Mexico -3%
CIS -1%
Avroy Shlain +23%
Korea +7%
Argentina +39% Nutrimetics
Australia/NZ +11%
Italy -15% Middle East
and N. Africa +97%
Turkey -10%

Financial Highlights
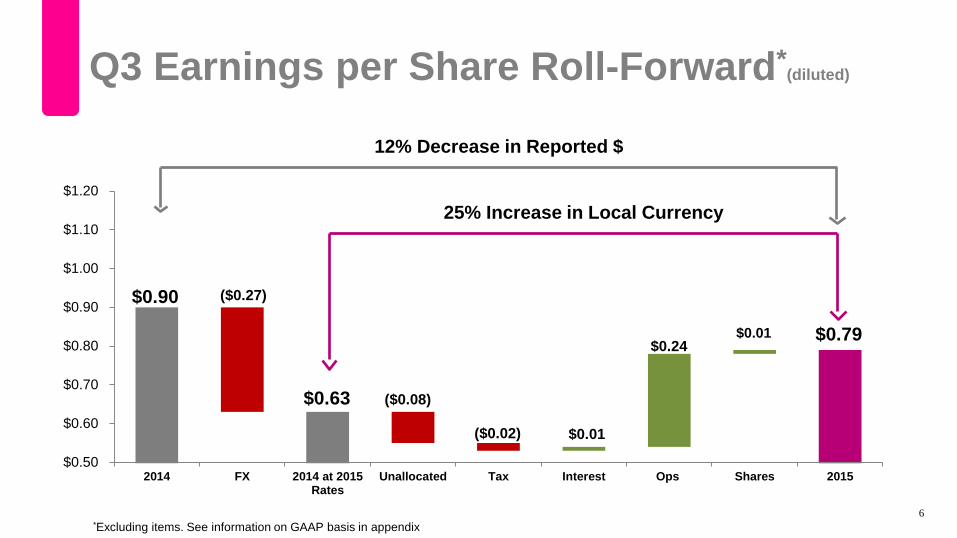
$0.90 ($0.27)
$0.63 ($0.08)
($0.02) $0.01
$0.24 $0.01 $0.79
$0.50
$0.60
$0.70
$0.80
$0.90
$1.00
$1.10
$1.20
2014 FX 2014 at 2015Rates
Unallocated Tax Interest Ops Shares 2015
Q3 Earnings per Share Roll-Forward*(diluted)
6 *Excluding items. See information on GAAP basis in appendix
12% Decrease in Reported $
25% Increase in Local Currency
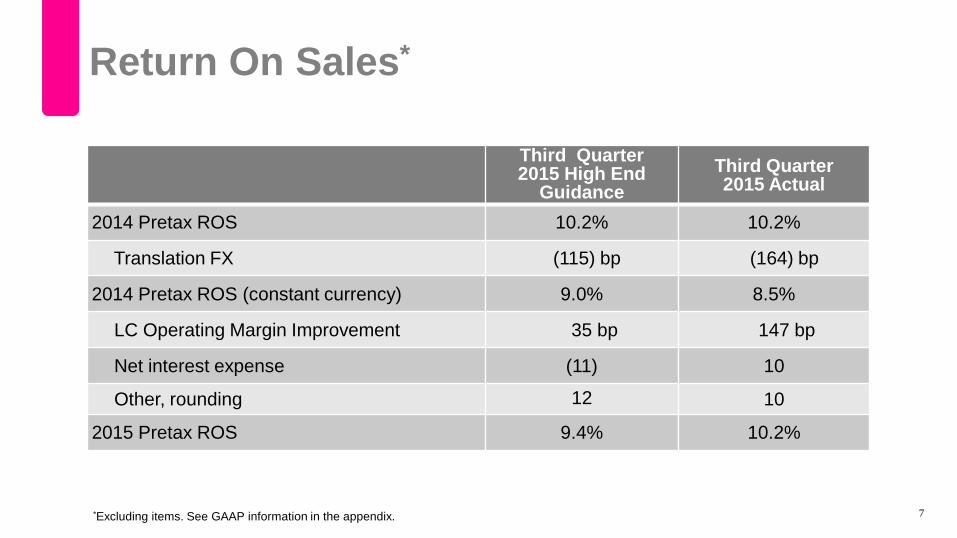
Return On Sales*
7
Third Quarter 2015 High End
Guidance Third Quarter 2015 Actual
2014 Pretax ROS 10.2% 10.2%
Translation FX (115) bp (164) bp
2014 Pretax ROS (constant currency) 9.0% 8.5%
LC Operating Margin Improvement 35 bp 147 bp
Net interest expense (11) 10
Other, rounding 12 10
2015 Pretax ROS 9.4% 10.2%
*Excluding items. See GAAP information in the appendix.
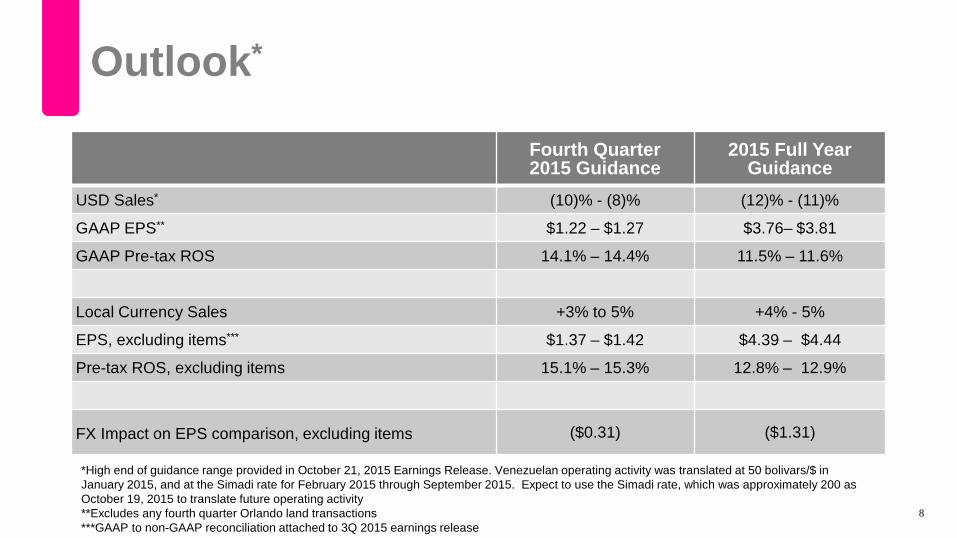
Outlook*
8
Fourth Quarter 2015 Guidance
2015 Full Year Guidance
USD Sales* (10)% - (8)% (12)% - (11)%
GAAP EPS** $1.22 – $1.27 $3.76– $3.81
GAAP Pre-tax ROS 14.1% – 14.4% 11.5% – 11.6%
Local Currency Sales +3% to 5% +4% - 5%
EPS, excluding items*** $1.37 – $1.42 $4.39 – $4.44
Pre-tax ROS, excluding items 15.1% – 15.3% 12.8% – 12.9%
FX Impact on EPS comparison, excluding items ($0.31) ($1.31)
*High end of guidance range provided in October 21, 2015 Earnings Release. Venezuelan operating activity was translated at 50 bolivars/$ in January 2015, and at the Simadi rate for February 2015 through September 2015. Expect to use the Simadi rate, which was approximately 200 as October 19, 2015 to translate future operating activity **Excludes any fourth quarter Orlando land transactions ***GAAP to non-GAAP reconciliation attached to 3Q 2015 earnings release
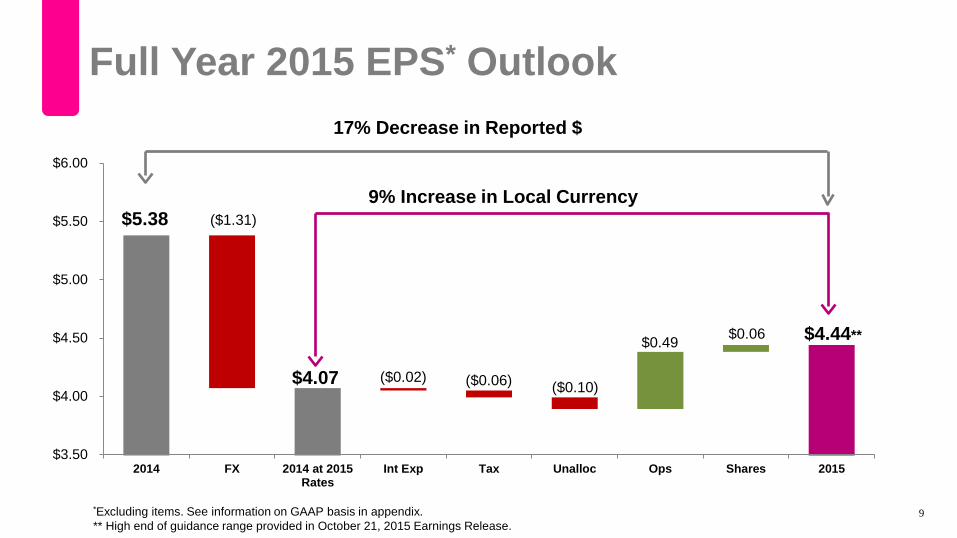
$5.38 ($1.31)
($0.02) ($0.06) ($0.10)
$0.49 $0.06 $4.44**
$3.50
$4.00
$4.50
$5.00
$5.50
$6.00
2014 FX 2014 at 2015Rates
Int Exp Tax Unalloc Ops Shares 2015
Full Year 2015 EPS* Outlook
9
17% Decrease in Reported $
9% Increase in Local Currency
$4.07
*Excluding items. See information on GAAP basis in appendix. ** High end of guidance range provided in October 21, 2015 Earnings Release.
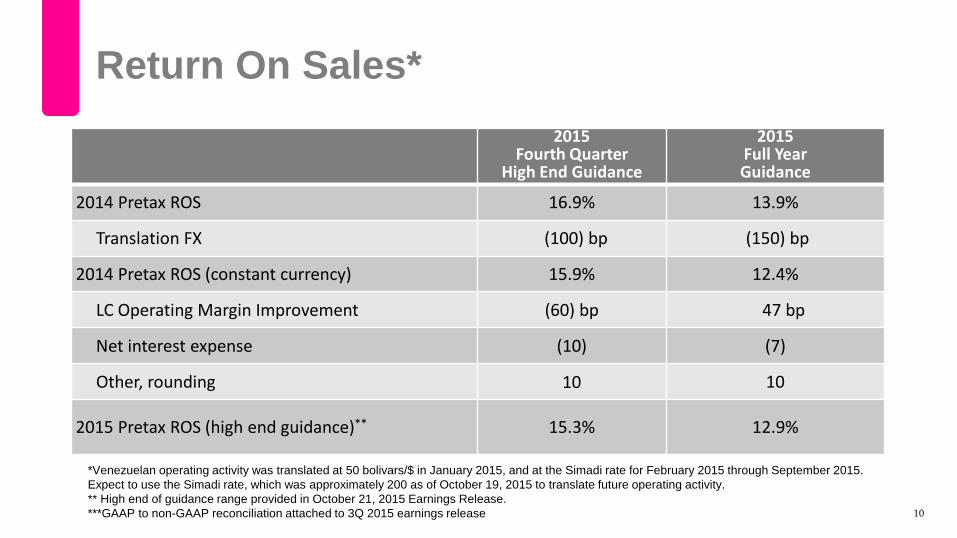
Return On Sales* 2015
Fourth Quarter High End Guidance
2015 Full Year Guidance
2014 Pretax ROS 16.9% 13.9%
Translation FX (100) bp (150) bp
2014 Pretax ROS (constant currency) 15.9% 12.4%
LC Operating Margin Improvement (60) bp 47 bp
Net interest expense (10) (7)
Other, rounding 10 10
2015 Pretax ROS (high end guidance)** 15.3% 12.9%
*Venezuelan operating activity was translated at 50 bolivars/$ in January 2015, and at the Simadi rate for February 2015 through September 2015. Expect to use the Simadi rate, which was approximately 200 as of October 19, 2015 to translate future operating activity. ** High end of guidance range provided in October 21, 2015 Earnings Release. ***GAAP to non-GAAP reconciliation attached to 3Q 2015 earnings release 10
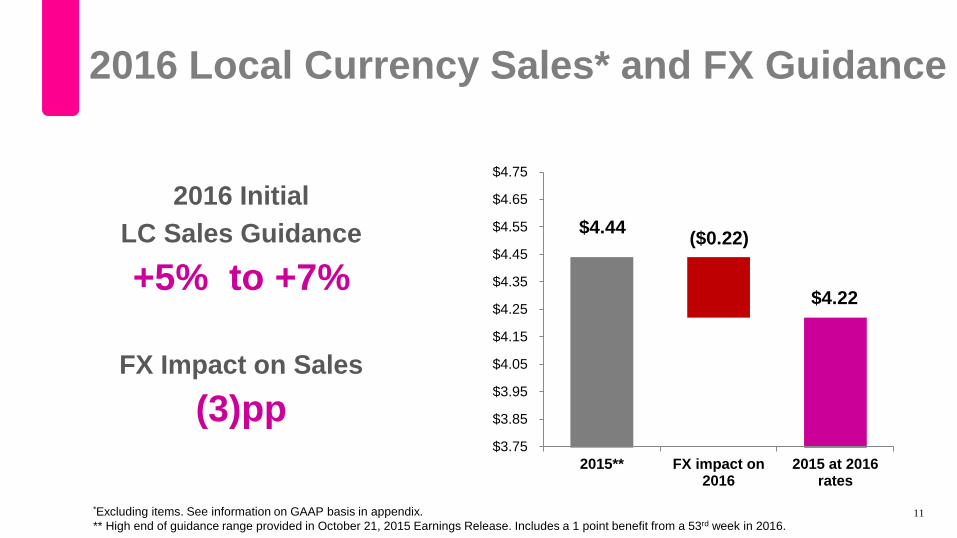
2016 Local Currency Sales* and FX Guidance
2016 Initial LC Sales Guidance
+5% to +7%
FX Impact on Sales
(3)pp
$4.44 ($0.22)
$4.22
$3.75
$3.85
$3.95
$4.05
$4.15
$4.25
$4.35
$4.45
$4.55
$4.65
$4.75
2015** FX impact on2016
2015 at 2016rates
11 *Excluding items. See information on GAAP basis in appendix. ** High end of guidance range provided in October 21, 2015 Earnings Release. Includes a 1 point benefit from a 53rd week in 2016.

Questions &
Answers

Appendix
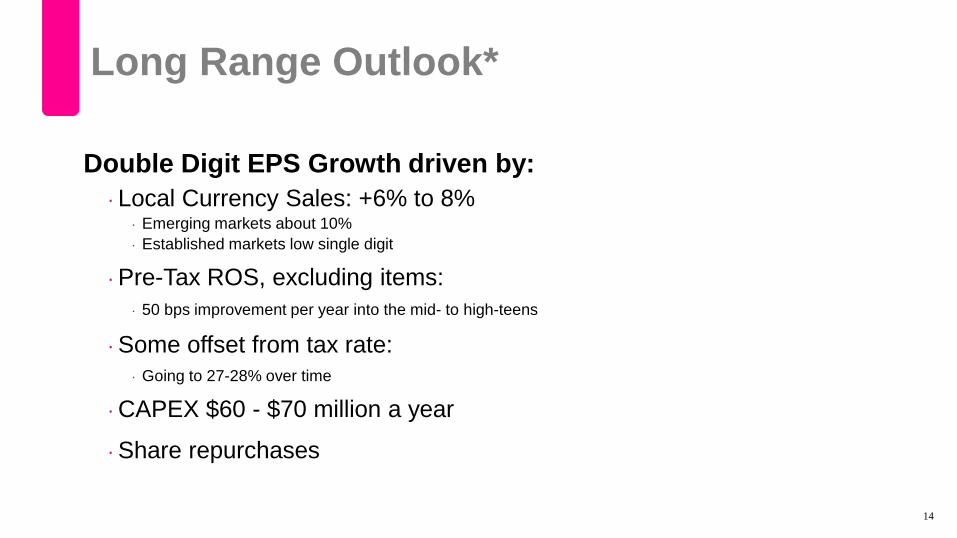
Long Range Outlook*
Double Digit EPS Growth driven by: · Local Currency Sales: +6% to 8%
· Emerging markets about 10% · Established markets low single digit
· Pre-Tax ROS, excluding items: · 50 bps improvement per year into the mid- to high-teens
· Some offset from tax rate: · Going to 27-28% over time
· CAPEX $60 - $70 million a year
· Share repurchases 14
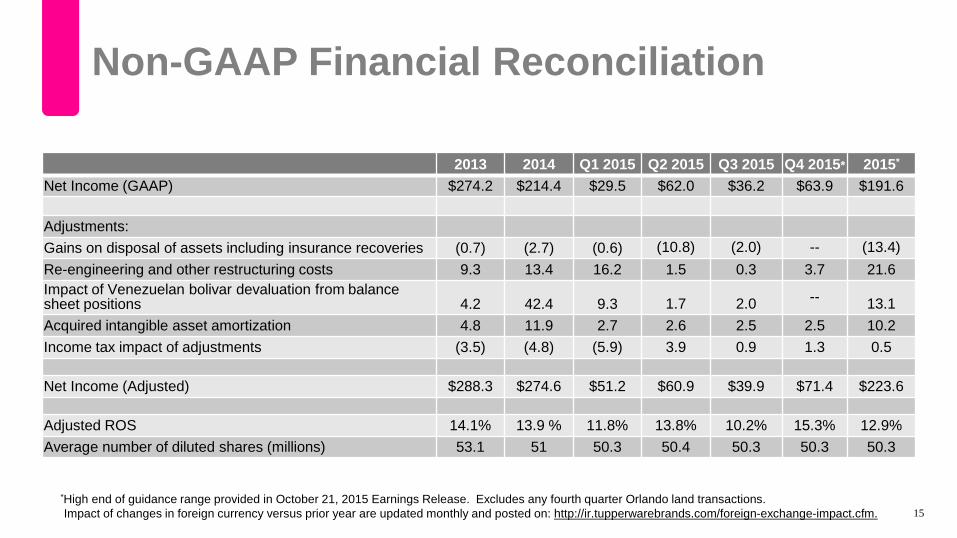
Non-GAAP Financial Reconciliation
15 *High end of guidance range provided in October 21, 2015 Earnings Release. Excludes any fourth quarter Orlando land transactions. Impact of changes in foreign currency versus prior year are updated monthly and posted on: http://ir.tupperwarebrands.com/foreign-exchange-impact.cfm.
2013 2014 Q1 2015 Q2 2015 Q3 2015 Q4 2015* 2015*
Net Income (GAAP) $274.2 $214.4 $29.5 $62.0 $36.2 $63.9 $191.6
Adjustments: Gains on disposal of assets including insurance recoveries (0.7) (2.7) (0.6) (10.8) (2.0) -- (13.4) Re-engineering and other restructuring costs 9.3 13.4 16.2 1.5 0.3 3.7 21.6 Impact of Venezuelan bolivar devaluation from balance sheet positions 4.2 42.4 9.3 1.7 2.0 -- 13.1 Acquired intangible asset amortization 4.8 11.9 2.7 2.6 2.5 2.5 10.2 Income tax impact of adjustments (3.5) (4.8) (5.9) 3.9 0.9 1.3 0.5
Net Income (Adjusted) $288.3 $274.6 $51.2 $60.9 $39.9 $71.4 $223.6
Adjusted ROS 14.1% 13.9 % 11.8% 13.8% 10.2% 15.3% 12.9% Average number of diluted shares (millions) 53.1 51 50.3 50.4 50.3 50.3 50.3
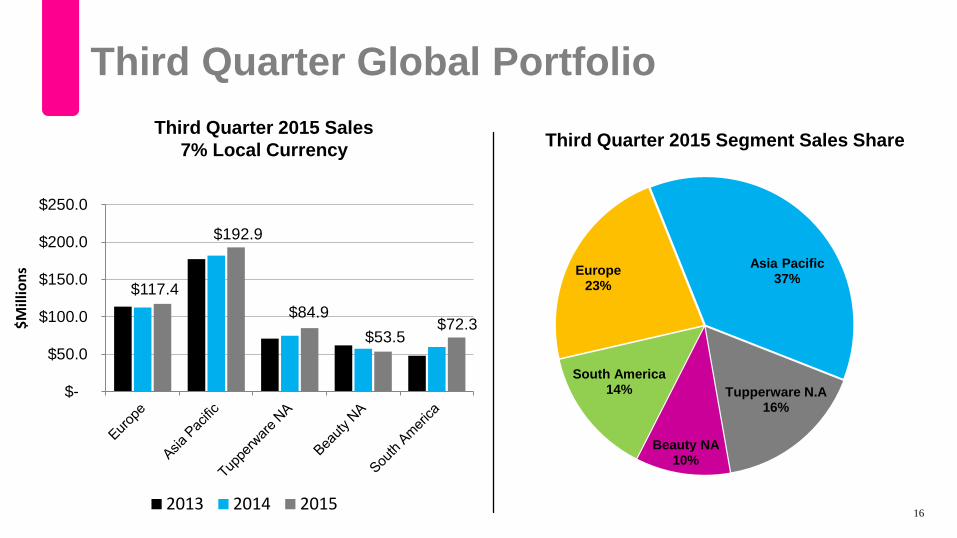
Third Quarter Global Portfolio
16
Third Quarter 2015 Segment Sales Share Third Quarter 2015 Sales 7% Local Currency
Europe 23%
Asia Pacific 37%
Tupperware N.A 16%
Beauty NA 10%
South America 14%
$117.4
$192.9
$84.9 $53.5
$72.3
$-
$50.0
$100.0
$150.0
$200.0
$250.0
$Mill
ions
2013 2014 2015
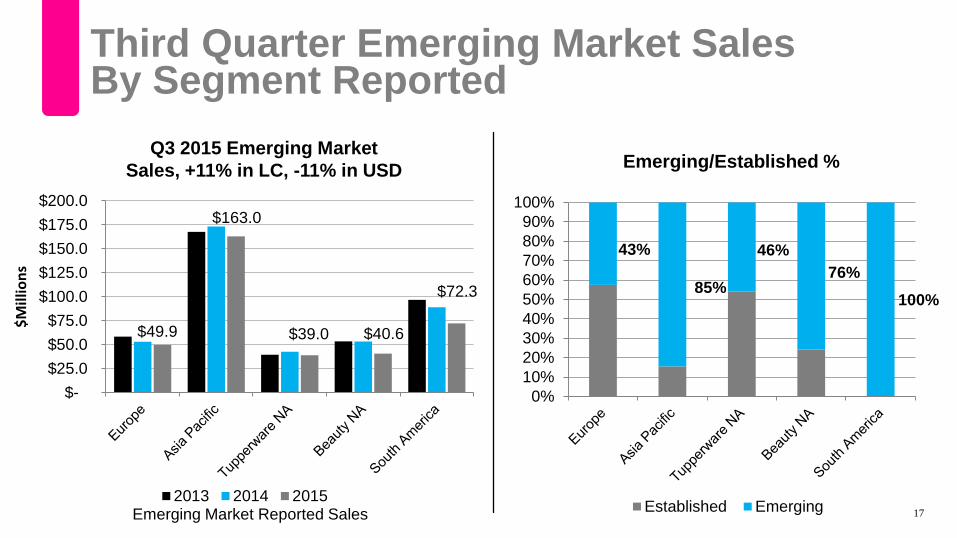
Third Quarter Emerging Market Sales By Segment Reported
Q3 2015 Emerging Market Sales, +11% in LC, -11% in USD Emerging/Established %
17
$49.9
$163.0
$39.0 $40.6
$72.3
$- $25.0 $50.0 $75.0
$100.0 $125.0 $150.0 $175.0 $200.0
$Mill
ions
2013 2014 2015
43%
85%
46% 76%
100%
0%10%20%30%40%50%60%70%80%90%
100%
Established EmergingEmerging Market Reported Sales
1H – 2014
Q3 – 2014
Q4 – 2014
FY 2014
Q1 – 2015
Q2 – 2015
Q3 – 2015
Q4 – 2015(1)
FY 2015(1)
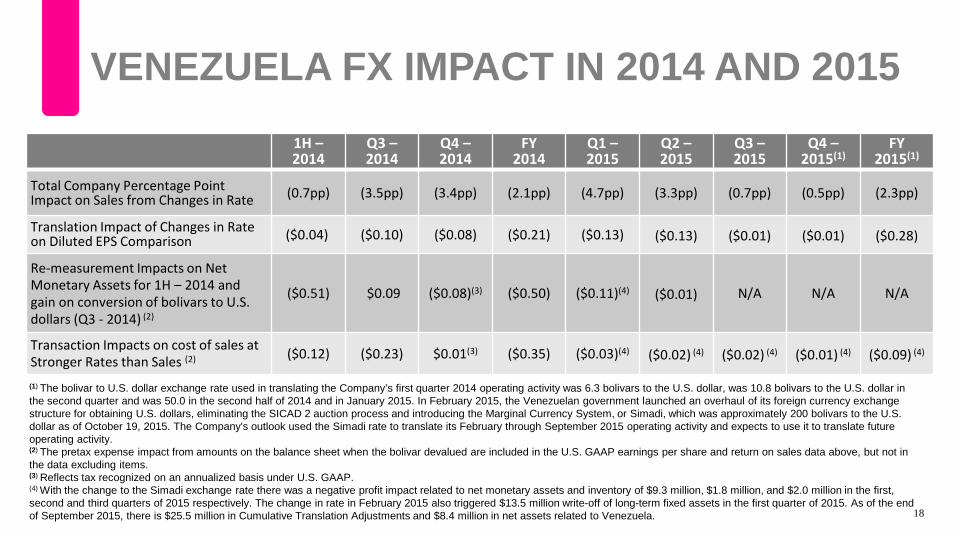
Total Company Percentage Point Impact on Sales from Changes in Rate (0.7pp) (3.5pp) (3.4pp) (2.1pp) (4.7pp) (3.3pp) (0.7pp) (0.5pp) (2.3pp)
Translation Impact of Changes in Rate on Diluted EPS Comparison ($0.04) ($0.10) ($0.08) ($0.21) ($0.13) ($0.13) ($0.01) ($0.01) ($0.28)
Re-measurement Impacts on Net Monetary Assets for 1H – 2014 and gain on conversion of bolivars to U.S. dollars (Q3 - 2014) (2)
($0.51) $0.09 ($0.08)(3) ($0.50) ($0.11)(4) ($0.01) N/A N/A N/A
Transaction Impacts on cost of sales at Stronger Rates than Sales (2) ($0.12) ($0.23) $0.01(3) ($0.35) ($0.03)(4) ($0.02) (4) ($0.02) (4) ($0.01) (4) ($0.09) (4)
(1) The bolivar to U.S. dollar exchange rate used in translating the Company’s first quarter 2014 operating activity was 6.3 bolivars to the U.S. dollar, was 10.8 bolivars to the U.S. dollar in the second quarter and was 50.0 in the second half of 2014 and in January 2015. In February 2015, the Venezuelan government launched an overhaul of its foreign currency exchange structure for obtaining U.S. dollars, eliminating the SICAD 2 auction process and introducing the Marginal Currency System, or Simadi, which was approximately 200 bolivars to the U.S. dollar as of October 19, 2015. The Company's outlook used the Simadi rate to translate its February through September 2015 operating activity and expects to use it to translate future operating activity. (2) The pretax expense impact from amounts on the balance sheet when the bolivar devalued are included in the U.S. GAAP earnings per share and return on sales data above, but not in the data excluding items. (3) Reflects tax recognized on an annualized basis under U.S. GAAP. (4) With the change to the Simadi exchange rate there was a negative profit impact related to net monetary assets and inventory of $9.3 million, $1.8 million, and $2.0 million in the first, second and third quarters of 2015 respectively. The change in rate in February 2015 also triggered $13.5 million write-off of long-term fixed assets in the first quarter of 2015. As of the end of September 2015, there is $25.5 million in Cumulative Translation Adjustments and $8.4 million in net assets related to Venezuela.
VENEZUELA FX IMPACT IN 2014 AND 2015
18

Third Quarter 2015
Earnings Release October 21, 2015