Embed Size (px)
Citation preview

‹#›© 2018 |
Earnings Webcast & Conference CallSecond Quarter and First Six Months of Fiscal Year 2019

22019 |
Forward-Looking Statements
This presentation and other written or oral statements made from time to time by representatives of Broadridge Financial Solutions, Inc. ("Broadridge" or the "Company") may contain “forward-looking statements” within the meaning of the Private Securities Litigation Reform Act of 1995. Statements that are not historical in nature, and which may be identified by the use of words such as “expects,” “assumes,” “projects,” “anticipates,” “estimates,” “we believe,” “could be” and other words of similar meaning, are forward-looking statements. In particular, information appearing in the “Fiscal Year 2019 Guidance” section are forward-looking statements.
These statements are based on management’s expectations and assumptions and are subject to risks and uncertainties that may cause actual results to differ materially from those expressed. These risks and uncertainties include those risk factors discussed in Part I, “Item 1A. Risk Factors” of our Annual Report on Form 10-K for the fiscal year ended June 30, 2018 (the “2018 Annual Report”), as they may be updated in any future reports fi led with the Securities and Exchange Commission. All forward-looking statements speak only as of the date of this presentation and are expressly qualified in their entirety by reference to the factors discussed in the 2018 Annual Report.
These risks include: the success of Broadridge in retaining and selling additional services to its existing clients and in obtaining new clients; Broadridge’sreliance on a relatively small number of clients, the continued financial health of those clients, and the continued use by such clients of Broadridge’sservices with favorable pricing terms; a material security breach or cybersecurity attack affecting the information of Broadridge's clients; changes in laws and regulations affecting Broadridge’s clients or the services provided by Broadridge; declines in participation and activity in the securities markets; the failure of Broadridge's key service providers to provide the anticipated levels of service; a disaster or other significant slowdown or failure of Broadridge’s systems or error in the performance of Broadridge’s services; overall market and economic conditions and their impact on the securities markets; Broadridge’s failure to keep pace with changes in technology and demands of its clients; Broadridge’s ability to attract and retain key personnel; the impact of new acquisitions and divestitures; and competitive conditions. Broadridge disclaims any obligation to update or revise forward-looking statements that may be made to reflect events or circumstances that arise after the date made or to reflect the occurrence of unanticipated events, other than as required by law.
Use of Material Contained HereinThe information contained in this presentation is being provided for your convenience and information only. This information is accurate as of the date of its initial presentation. If you plan to use this information for any purpose, verification of its continued accuracy is your responsibility. Broadridgeassumes no duty to update or revise the information contained in this presentation.
Revenue Accounting ChangeEffective July 1, 2018, Broadridgeadopted Accounting Standards Update No. 2014-09 “Revenue from Contracts with Customers” and its related amendments (the “revenue accounting change”). Results for reporting periods beginning July 1, 2018 reflect the revenue accounting change while prior period amounts have not been adjusted and continue to be reported in accordance with historical accounting guidelines. For additional information related to this change please refer to the appendix of this presentation and information expected to be fi led in Broadridge’s Quarterly Report on Form 10-Q for the second quarter of fiscal year 2019.

32019 |
Use of Non-GAAP Financial Measures
Explanation and Reconciliation of the Company’s Use of Non-GAAP Financial MeasuresThe Company’s results in this presentation are presented in accordance with U.S. generally accepted accounting principles ("GAAP") except where otherwise noted. In certain circumstances, results have been presented that are not generally accepted accounting principles measures (“Non -GAAP”). These Non-GAAP measures are Adjusted Operating income, Adjusted Operating income margin, Adjusted Net earnings, Adjusted earnings per share, and Free cash flow. These Non-GAAP financial measures should be viewed in addition to, and not as a substitute for, the Company’s reported results.
The Company believes its Non-GAAP financial measures help investors understand how management plans, measures and evaluates the Company’s business performance. Management believes that Non-GAAP measures provide consistency in its financial reporting and facilitates investors’ understanding of the Company’s operating results and trends by providing an additional basis for comparison. Management uses these Non-GAAP financial measures to, among other things, evaluate the Company's ongoing operations, for internal planning and forecasting purposes and in the calculation of performance-based compensation. In addition, and as a consequence of the importance of these Non-GAAP financial measures in managing its business, the Company’s Compensation Committee of the Board of Directors incorporates Non-GAAP financial measures in the evaluation process for determining management compensation.
Adjusted Operating Income, Adjusted Operating Income Margin, Adjusted Net Earnings and Adjusted Earnings per ShareThese Non-GAAP measures reflect Operating income, Operating income margin, Net earnings, and Diluted earnings per share, as adjusted to exclude the impact of certain costs, expenses, gains and losses and other specified items that management believes are not indicative of ourongoing operating performance. These adjusted measures exclude the impact of: (i) Amortization of Acquired Intangibles and Purchased Intellectual Property, (ii) Acquisition and Integration Costs and (iii) Tax Act items. Amortization of Acquired Intangibles and Purchased Intellectual Property represents non-cash amortization expenses associated with the Company's acquisition activities. Acquisition and Integration Costs represent certain transaction and integration costs associated with the Company’s acquisition activities. Tax Act items represent the net impact of a U.S. federal transition tax on earnings of certainforeign subsidiaries, foreign jurisdiction withholding taxes and certain benefits related to the remeasurement of the Company’s net U.S. federal and state deferred tax liabilities attributable to the Tax Act.
The Company excludes Amortization of Acquired Intangibles and Purchased Intellectual Property as well as Acquisition and Integration Costs and Tax Act items from our earnings measures because excluding such information provides us with an understanding of the results from the primary operations of our business and these items do not reflect ordinary operations or earnings. Management believes these adjusted measures may be useful to an investor in evaluating the underlying operating performance of our business.
Free Cash FlowIn addition to the Non-GAAP financial measures discussed above, we provide Free cash flow information because we consider Free cash flow to be a l iquidity measure that provides useful information to management and investors about the amount of cash generated that could be used for dividends, share repurchases, strategic acquisitions, other investments, as well as debt servicing. Free cash flow is a Non-GAAP financial measure and is defined by the Company as Net cash flows provided by operating activities less Capital expenditures as well as Software purchases and capitalized internal use software.
Reconciliations of such Non-GAAP measures to the most directly comparable financial measures presented in accordance with GAAP can be found in the tables that are part of this presentation.

42019 |
Highlights
Strong second quarter 2019 financial results
• Recurring fee revenues rose 7%
• Closed sales of $106 million, a second quarter record
o Strong Closed sales growth even excluding landmark sale to UBS
• As expected, event-driven revenues of $48 million declined relative to near record $97 million in 2Q18.
• Diluted EPS declined 19% to $0.42 and Adjusted EPS fell to $0.56
o Decline of higher-margin event-driven revenues in seasonally small 2Q
o SG&A up 11% versus 2Q18 on increased growth investments in technology and sales
Reaffirming fiscal year 2019 financial guidance
On track to achieve FY17-FY20 growth objectives
52019 |
Key Stakeholder Messages
Broadridge's role powering the critical infrastructure behind Investing, Governance, and Communications strengthens our clients and enables better financial lives
Broadridge has transformed over the past seven years as demonstrated by recent "Most Admired Company" award
That transformation gives Broadridge tremendous opportunity
Three key areas of focus to capture that opportunity over the near-, medium-, and long-term
Deliver on FY2019 guidance and FY2020 objectives
Execute against Investor Day growth plans across Governance, Capital Markets and Wealth Management
Build on current capabilities like culture, product and technology
Maintain balanced, shareholder friendly capital allocation

62019 |
Business Update
2Q record Closed sales of $106 million in second quarter
• Year to date Closed sales of $124 million, up 102%
• Strong Closed sales result even excluding UBS sale
• Pipeline remains strong
ICS Recurring fee revenues up 10%
• 25% Recurring fee revenue growth ex-Customer Communications driven by higher mutual fund interims, data-driven services and stock record growth
• Event-driven revenues down 51% as expected from near-record second quarter 2018
GTO Revenues up 4%
• Longer implementation times on recent sales wins creating modest lull in growth
• Investments underway to support long-term growth outlook

72019 |
Second Quarter 2019 Revenue Growth Drivers
▪ Second Quarter 2019 Recurring fee revenues grew 7% to $604 million
▪ Second Quarter 2019 Total revenues declined 6% to $953 million
$953M
+4%
(5)%
(5)% (0)%$1,013M
$562M
$604M
+1%+6%
(3)%
+3%+7%
(6)%
Note: Amounts may not sum due to rounding
Organic Growth: 6%
+1%

82019 |
1H 2019 Revenue Growth Drivers
▪ Six Months Fiscal 2019 Recurring fee revenues grew 6% to $1.18 billion
▪ Six Months Fiscal 2019 Total revenues declined 1% to $1.93 billion
$1.93B
+4%
(2)%
(0)%$1.94B
$1.11B
$1.18B
0%+6%
(3)% +2%
+6%
(1)%
Note: Amounts may not sum due to rounding
Organic Growth: 5%
+1%
(2)%

92019 |
Second Quarter 2019 GAAP and Adjusted Operating Income and EPS
$ in millions, except per share amounts
Year-over-Year Change in Operating Income and Adjusted Operating Income
Year-over-Year Change in EPS and Adjusted EPS
-27%
-33%
-29%
-19%

102019 |
Six Months Fiscal Year 2019 GAAP and Adjusted Operating Income and EPS
$ in millions, except per share amounts
Year-over-Year Change in Operating Income and Adjusted Operating Income
Year-over-Year Change in EPS and Adjusted EPS
-9%
-11%
+2%
+14%

112019 |
Second Quarter Cost of Revenues & Selling, General, and Administrative Expenses
($'s in millions)2Q FY17 2Q FY18 2Q FY19
Cost of Revenues $707.4 $769.3 $734.0
Gross Margin 20.7% 24.0% 23.0%
SG&A $125.9 $127.7 $141.2
Growth 21% 1% 11%

122019 |
First Half Contribution to Full Year EPS
32%29%1
26%
1 FY19 first half Diluted and Adjusted (Non-GAAP) EPS % of Full Year EPS based on mid-point of full year FY19 Diluted and Adjusted (Non-GAAP) EPS guidance.
Diluted EPSAdjusted EPS - Non-GAAP
26%26%1
23%

132019 |
($ in millions)
Investor Communication Solutions ("ICS")
2Q 1H
2018 2019 Change 2018 2019 Change
Recurring fee revenues $334 $367 10% $667 $715 7%
Event-driven fee revenues 97 48 (51)% 157 125 (20)%
Distribution revenues 370 323 (13)% 705 664 (6)%
Total revenues $802 $738 (8)% $1,529 $1,504 (2)%
Earnings before income taxes $72 $37 (49)% $118 $96 (19)%
Pre-tax margins 9.0% 5.0% 7.7% 6.4%
Global Technology and Operations ("GTO")
2Q 1H
2018 2019 Change 2018 2019 Change
Total revenues $228 $237 4% $443 $464 5%
Earnings before income taxes $51 $47 (7)% $96 $94 (2)%
Pre-tax margins 22.2% 20.0% 21.6% 20.2%
Segment Results
Note: Amounts may not sum due to rounding
142019 |
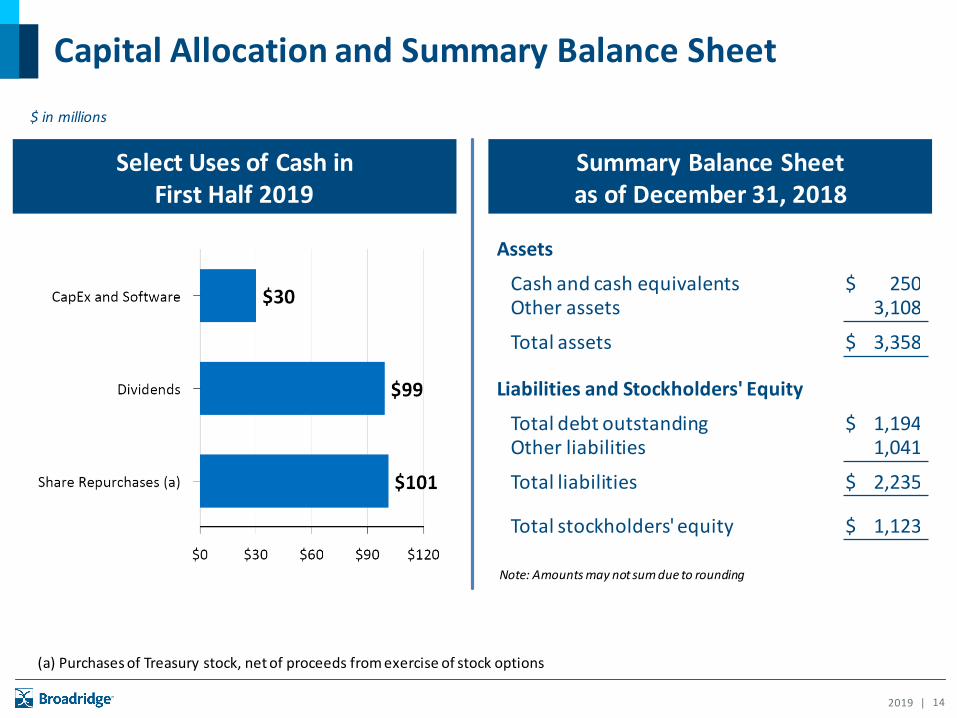
Capital Allocation and Summary Balance Sheet
Select Uses of Cash in First Half 2019
$ in millions
Summary Balance Sheetas of December 31, 2018
Assets
Cash and cash equivalents $ 250Other assets 3,108
Total assets $ 3,358
Liabilities and Stockholders' Equity
Total debt outstanding $ 1,194Other liabilities 1,041
Total liabilities $ 2,235
Total stockholders' equity $ 1,123
Note: Amounts may not sum due to rounding
(a) Purchases of Treasury stock, net of proceeds from exercise of stock options
152019 |
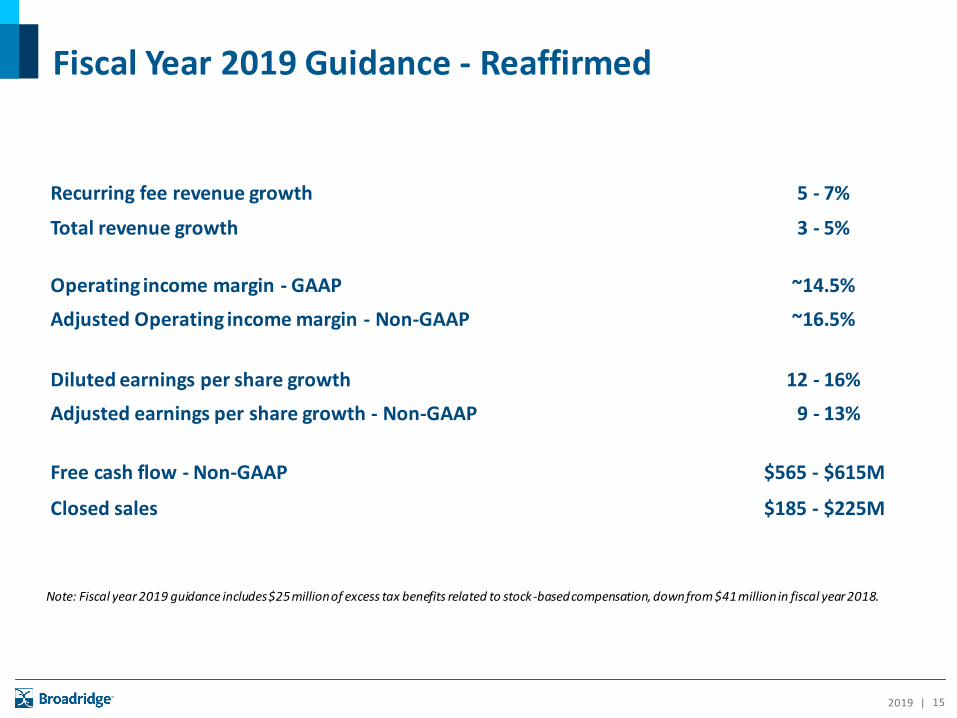
Fiscal Year 2019 Guidance - Reaffirmed
Recurring fee revenue growth 5 - 7%
Total revenue growth 3 - 5%
Operating income margin - GAAP ~14.5%
Adjusted Operating income margin - Non-GAAP ~16.5%
Diluted earnings per share growth 12 - 16%
Adjusted earnings per share growth - Non-GAAP 9 - 13%
Free cash flow - Non-GAAP $565 - $615M
Closed sales $185 - $225M
Note: Fiscal year 2019 guidance includes $25 million of excess tax benefits related to stock-based compensation, down from $41 million in fiscal year 2018.
162019 |
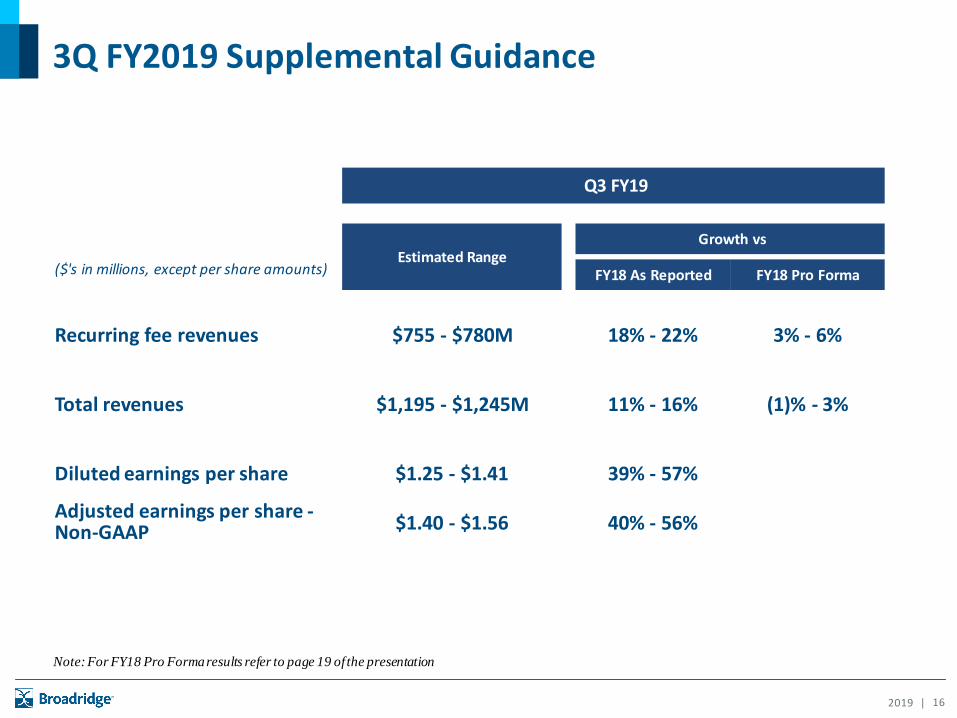
3Q FY2019 Supplemental Guidance
Q3 FY19
Estimated RangeGrowth vs
($'s in millions, except per share amounts) FY18 As Reported FY18 Pro Forma
Recurring fee revenues $755 - $780M 18% - 22% 3% - 6%
Total revenues $1,195 - $1,245M 11% - 16% (1)% - 3%
Diluted earnings per share $1.25 - $1.41 39% - 57%
Adjusted earnings per share -Non-GAAP $1.40 - $1.56 40% - 56%
Note: For FY18 Pro Forma results refer to page 19 of the presentation

172019 |
Appendix

182019 |
Tax Act & ETB Impact 2018 2019 2018 2019 2018 2019
$ in millions2Q 2Q 1H 1H FY
FY Outlook
Earnings before income taxes $103.5 $64.3 $177.8 $153.6 $561.0
Provision for income taxes (Excluding ETB and non-recurring gains & charges) $26.7 $15.2 $52.7 $34.8 $158.6
Net Tax Charges 16.1 — 16.1 — 15.4 —
Excess Tax Benefits "ETB" (1.5) (0.8) (3.0) (7.9) (40.9) ~(25)
Provision for income taxes (GAAP) $41.4 $14.4 $65.8 $27.0 $133.1
Tax Rates
Tax Rate (Ex- ETB & non-recurring gains & charges) 25.8% 23.6% 29.6% 22.7% 28.3% ~24%
Tax Rate (GAAP) 40.0% 22.4% 37.0% 17.6% 23.7% ~20%
EPS Growth
Diluted EPS 108% (19)% 79% 14% 32%
Adjusted EPS 103% (29)% 76% 2% 34%
Adjusted EPS (Ex- ETB) 97% (27)% 73% (1)% 23%
Note: Amounts may not sum due to rounding

192019 |
2018
$ in millions Q1 Q2 Q3 Q4 FYRevenues As Reported
Recurring Fee Revenues $ 547.8 $ 562.4 $ 638.6 $ 861.5 $ 2,610.4
Event-Driven Fee Revenues 59.3 97.3 66.5 60.7 283.9
Distribution Revenues 334.2 370.4 385.4 422.9 1,512.9
FX (16.5) (17.4) (18.6) (24.8) (77.3)
Total Revenues $ 924.8 $ 1,012.8 $ 1,071.9 $ 1,320.4 $ 4,329.9
Revenue Adjustments from Revenue Accounting ChangeRecurring Fee Revenues $ (3.3) $ 3.5 $ 97.8 $ (97.5) $ 0.4
Event-Driven Fee Revenues 43.9 (47.3) 2.1 (1.0) (2.2)
Distribution Revenues 18.5 (21.4) 36.4 (24.0) 9.6
FX — — — — —
Total Revenues $ 59.1 $ (65.2) $ 136.3 $ (122.5) $ 7.7
Revenues (As Adjusted)
Recurring Fee Revenues $ 544.5 $ 565.9 $ 736.4 $ 764.0 $ 2,610.8
Event-Driven Fee Revenues 103.2 50.0 68.6 59.7 281.6
Distribution Revenues 352.8 349.0 421.8 399.0 1,522.5
FX (16.5) (17.4) (18.6) (24.8) (77.3)
Total Revenues $ 983.9 $ 947.6 $ 1,208.2 $ 1,197.9 $ 4,337.6
Pro Forma Accounting Change Impact to FY 2018 Total Revenues
Note: Amounts may not sum due to rounding

202019 |
Pro Forma Accounting Change Impact to FY 2018 Recurring Revenues
2018
$ in millions Q1 Q2 Q3 Q4 FY
Recurring Fee Revenues As Reported
ICS $ 332.9 $ 334.4 $ 403.5 $ 628.0 $ 1,698.9
GTO 214.9 228.0 235.2 233.5 911.6
Total Recurring Fee Revenues $ 547.8 $ 562.4 $ 638.6 $ 861.5 $ 2,610.4
% of FY Recurring Fee Revenue 21.0% 21.5% 24.5% 33.0% 100.0%
Recurring Fee Revenue Adjustments from Revenue Accounting Change
ICS $ (1.1) $ 3.1 $ 96.9 $ (97.7) $ 1.3
GTO (2.3) 0.4 0.8 0.2 (0.9)
Total Recurring Fee Revenues $ (3.3) $ 3.5 $ 97.8 $ (97.5) $ 0.4
Recurring Fee Revenues (As Adjusted)
ICS $ 331.8 $ 337.5 $ 500.4 $ 530.4 $ 1,700.1
GTO 212.6 228.4 236.0 233.7 910.7
Total Recurring Fee Revenues $ 544.5 $ 565.9 $ 736.4 $ 764.0 $ 2,610.8
% of FY Recurring Fee Revenue 20.9% 21.7% 28.2% 29.3% 100.0%
Note: Amounts may not sum due to rounding

212019 |
Pro Forma Accounting Change Impact to FY 2019 Revenue Growth
2019 Growth
Q1 Q2 1H
Recurring Fee Revenues:
As Reported 5% 7% 6%
Pro Forma 6% 7% 6%
Total Revenues:
As Reported 5% (6)% (1)%
Pro Forma (1)% 1% —%
Note: For FY18 Pro Forma results refer to page 19 of the presentation

222019 |
Supplemental Reporting Detail - Product Line Reporting1
$ in millions Q1FY18 Q2FY18 Q3FY18 Q4FY18 FY 2018 Q1FY19 Q2 FY19 YTD FY19
Investor Communication Solutions ("ICS")Equity proxy $ 30.0 $ 33.6 $ 45.1 $ 298.1 $ 406.8 $ 31.0 $ 41.7 $ 72.7
Mutual fund & ETF interims 49.2 46.9 67.0 58.3 221.4 57.8 60.7 118.5
Customer communications & fulfillment 181.5 187.3 210.7 180.6 760.1 174.9 182.6 357.5
Other ICS 72.2 66.5 80.7 91.1 310.6 83.8 82.1 165.9
Total ICS recurring fee revenues $ 332.9 $ 334.4 $ 403.5 $ 628.0 $ 1,698.9 $ 347.4 $ 367.2 $ 714.6
Equity & other $ 30.8 $ 28.8 $ 39.9 $ 34.9 $ 134.4 $ 24.1 $ 19.5 $ 43.6Mutual funds 28.5 68.6 26.6 25.8 149.4 52.8 28.6 81.4
Total Event-driven fee revenues $ 59.3 $ 97.3 $ 66.5 $ 60.7 $ 283.9 $ 76.9 $ 48.1 $ 125.1
Distribution 334.2 370.4 385.4 422.9 1,512.9 341.4 322.9 664.2Total ICS revenues $ 726.4 $ 802.2 $ 855.3 $ 1,111.7 $ 3,495.6 $ 765.8 $ 738.1 $ 1,503.9
Global Technology & Operations ("GTO")Equities & other $ 179.0 $ 189.4 $ 195.9 $ 193.0 $ 757.2 $ 187.7 $ 196.5 $ 384.2Fixed income 35.9 38.5 39.3 40.5 154.3 40.0 40.1 80.1
Total GTO recurring fee revenues $ 214.9 $ 228.0 $ 235.2 $ 233.5 $ 911.6 $ 227.7 $ 236.6 $ 464.3
Foreign currency exchange (16.5) (17.4) (18.6) (24.8) (77.3) (20.7) (21.4) (42.0)Total revenues $ 924.8 $ 1,012.8 $ 1,071.9 $ 1,320.4 $ 4,329.9 $ 972.8 $ 953.4 $ 1,926.2
Revenues by Type
Recurring fee revenues $ 547.8 $ 562.4 $ 638.6 $ 861.5 $ 2,610.4 $ 575.2 $ 603.8 $ 1,179.0Event-driven fee revenues 59.3 97.3 66.5 60.7 283.9 76.9 48.1 125.1Distribution revenues 334.2 370.4 385.4 422.9 1,512.9 341.4 322.9 664.2Foreign currency exchange (16.5) (17.4) (18.6) (24.8) (77.3) (20.7) (21.4) (42.0)Total revenues $ 924.8 $ 1,012.8 $ 1,071.9 $ 1,320.4 $ 4,329.9 $ 972.8 $ 953.4 $ 1,926.2
Note: Amounts may not sum due to rounding
1 Fiscal 2018 results have not been restated for the revenue accounting change.

232019 |
Reconciliation of GAAP to Non-GAAP Measures
Note: Amounts may not sum due to rounding
$ in millions, except per share amounts Three Months Ended December 31, Six Months Ended December 31,
2018 2017 2018 2017
Operating income (GAAP) $ 78.2 $ 115.9 $ 178.3 $ 201.1
Adjustments:
Amortization of Acquired Intangibles and Purchased Intellectual Property 21.3 19.7 43.2 39.2
Acquisition and Integration Costs 1.3 2.6 2.2 4.7
Adjusted Operating income (Non-GAAP) $ 100.8 $ 138.3 $ 223.7 $ 244.9
Operating income margin (GAAP) 8.2% 11.4% 9.3% 10.4%
Adjusted Operating income margin (Non-GAAP) 10.6% 13.7% 11.6% 12.6%
Three Months Ended December 31, Six Months Ended December 31,
2018 2017 2018 2017
Net earnings (GAAP) $ 49.9 $ 62.1 $ 126.6 $ 112.0
Adjustments:
Amortization of Acquired Intangibles and Purchased Intellectual Property 21.3 19.7 43.2 39.2
Acquisition and Integration Costs 1.3 2.6 2.2 4.7
Taxable adjustments 22.6 22.4 45.4 43.8
Tax Act items — 16.1 — 16.1
Tax impact of adjustments (a) (5.3) (5.9) (10.3) (13.0)
Adjusted Net earnings (Non-GAAP) $ 67.2 $ 94.7 $ 161.8 $ 158.9
(a) Calculated using the GAAP effective tax rate, adjusted to exclude $0.8 million and $7.9 million of excess tax benefits associated with stock-based compensation for the three and six months ended December 31, 2018, as well as the net $16.1 million charges associated with the Tax Act and $1.5 million and $3.0 million of excess tax benefits associated with stock-based compensation, for the three and six months ended December 31, 2017. For purposes of calculating the Adjusted earnings per share, the same adjustments were made on a per share basis.
(Unaudited)
242019 |
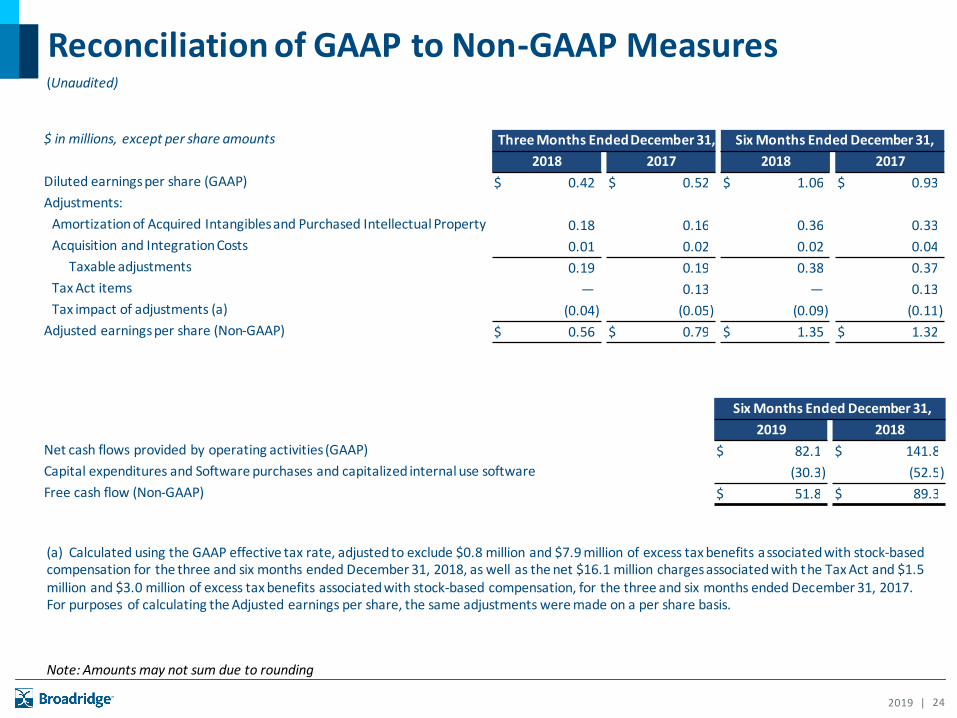
Reconciliation of GAAP to Non-GAAP Measures
Note: Amounts may not sum due to rounding
$ in millions, except per share amounts Three Months Ended December 31, Six Months Ended December 31,
2018 2017 2018 2017
Diluted earnings per share (GAAP) $ 0.42 $ 0.52 $ 1.06 $ 0.93
Adjustments:
Amortization of Acquired Intangibles and Purchased Intellectual Property 0.18 0.16 0.36 0.33
Acquisition and Integration Costs 0.01 0.02 0.02 0.04
Taxable adjustments 0.19 0.19 0.38 0.37
Tax Act items — 0.13 — 0.13
Tax impact of adjustments (a) (0.04) (0.05) (0.09) (0.11)
Adjusted earnings per share (Non-GAAP) $ 0.56 $ 0.79 $ 1.35 $ 1.32
Six Months Ended December 31,
2019 2018
Net cash flows provided by operating activities (GAAP) $ 82.1 $ 141.8
Capital expenditures and Software purchases and capitalized internal use software (30.3) (52.5)
Free cash flow (Non-GAAP) $ 51.8 $ 89.3
(a) Calculated using the GAAP effective tax rate, adjusted to exclude $0.8 million and $7.9 million of excess tax benefits associated with stock-based compensation for the three and six months ended December 31, 2018, as well as the net $16.1 million charges associated with the Tax Act and $1.5 million and $3.0 million of excess tax benefits associated with stock-based compensation, for the three and six months ended December 31, 2017. For purposes of calculating the Adjusted earnings per share, the same adjustments were made on a per share basis.
(Unaudited)

252019 |
Reconciliation of GAAP to Non-GAAP Measures
(b) Calculated using the GAAP effective tax rate, adjusted to exclude the net $15.4 million charges associated with the Tax Act, as well as $40.9 million of excess tax benefits associated with stock-based compensation for the fiscal year ended June 30, 2018. For purposes of calculating Adjusted earnings per share, the same adjustments were made on a per share basis.
Fiscal Years Ended June 30, 2018 2017 2016 2015 2014
Diluted earnings per share (GAAP) $ 3.56 $ 2.70 $ 2.53 $ 2.32 $ 2.12
Adjustments:
Amortization of Acquired Intangibles and Purchased Intellectual Property 0.68 0.60 0.26 0.20 0.18
Acquisition and Integration Costs 0.07 0.16 0.04 0.04 0.02
Gain on Sale of Securities (0.05) — — — —
Taxable Adjustments 0.70 0.76 0.30 0.24 0.20
Tax Act items 0.13 — — — —
MAL investment gain (a) — (0.08) — — —
Tax impact of adjustments (b) (0.20) (0.26) (0.10) (0.08) (0.07)
Adjusted earnings per share (Non-GAAP) $ 4.19 $ 3.13 $ 2.73 $ 2.47 $ 2.25
(a) Represents a non-cash, nontaxable gain on investment.
Note: Amounts may not sum due to rounding

262019 |
(Dollars in millions, except per share amounts)
Third Quarter FY19 Adjusted Earnings Per Share (1)
Diluted earnings per share (GAAP) $1.25 - $1.41
Adjusted earnings per share (Non-GAAP) $1.40 - $1.56
FY19 Adjusted Earnings Per Share Growth Rate (1)
Diluted earnings per share (GAAP) 12% - 16%
Adjusted earnings per share (Non-GAAP) 9% - 13%
FY19 Adjusted Operating Income Margin (2)
Operating income margin % (GAAP) ~14.5%
Adjusted Operating income margin % (Non-GAAP) ~16.5%
Free Cash Flow
Net cash flows provided by operating activities (GAAP) $660 - $730 million
Capital expenditures and Software purchases and capitalized internal use software (95) - (115) million
Free cash flow (Non-GAAP) $565 - $615 million
(1) Adjusted earnings per share growth (Non-GAAP) is adjusted to exclude the projected impact of Amortization of Acquired Intangibles and Purchased Intellectual Property, and Acquisition and Integration Costs, and is calculated using diluted shares outstanding. Fiscal year 2019 Non -GAAP Adjusted earnings per share guidance estimates exclude
Amortization of Acquired Intangibles and Purchased Intellectual Property, and Acquisition and Integration Costs, net of taxes , of approximately $0.60 per share. For the third quarter of Fiscal Year 2019, the guidance excludes Amortization of Acquired Intangibles and Purchased Intellectual Property, and Acquisition and Integration Costs, net of taxes,
of approximately $0.15 per share.
(2) Adjusted Operating income margin (Non-GAAP) is adjusted to exclude the projected impact of Amortization of Acquired Intangi bles and Purchased Intellectual Property, and Acquisition and Integration Costs. Fiscal year 2019 Non-GAAP Adjusted Operating income margin guidance estimates exclude Amortization of Acquired Intangibles and
Purchased Intellectual Property, and Acquisition and Integration Costs of approximately $94 million.
Reconciliation of GAAP to Non-GAAP Measures -Third Quarter and FY19 Guidance
(Unaudited)

272019 |
Broadridge Investor Relations
W. Edings ThibaultInvestor Relations
Tel: 516-472-5129Email: [email protected]