Embed Size (px)
Citation preview

Earth and Planetary Science Letters 459 (2017) 252–263
Contents lists available at ScienceDirect
Earth and Planetary Science Letters
www.elsevier.com/locate/epsl
Formation of obsidian pyroclasts by sintering of ash particles in the
volcanic conduit
James E. Gardner a,∗, Edward W. Llewellin b, James M. Watkins c, Kenneth S. Befus d
a Department of Geological Sciences, Jackson School of Geosciences, The University of Texas at Austin, Austin, TX, 78712-0254, USAb Department of Earth Sciences, Durham University, Durham, DH1 3LE, UKc Department of Earth Sciences, University of Oregon, Eugene, OR, 97403-1272, USAd Department of Geosciences, Baylor University, Waco, TX, 76798, USA
a r t i c l e i n f o a b s t r a c t
Article history:Received 6 June 2016Received in revised form 18 November 2016Accepted 20 November 2016Available online 6 December 2016Editor: T.A. Mather
Keywords:obsidianexplosive eruptionvolatilesMono Cratersdegassingvesicle
The ranges in intensity and style of volcanic eruptions, from highly explosive Plinian eruptions to quiescent lava extrusions, depend on the style and efficiency of gas loss from ascending magma. Obsidian pyroclasts – small, glassy pieces of quenched magma found in some volcanic tephra beds – may preserve valuable information about magma degassing in their vesicle textures and volatile contents. Accurate interpretation of their textures and volatiles, however, requires understanding the mechanism of formation of the pyroclasts. Obsidian pyroclasts from the ca. 1325–1350 C.E. North Mono eruption of Mono Craters (CA, USA) were analyzed and found to have H2O and CO2 contents indicating that they were formed at pressures in the approximate range of 3–40 MPa. Many also contain domains with differing vesicle textures, separated by boundaries containing xenocrystic material, indicating that they are composed of smaller fragments that have sutured together. More than half of the pyroclasts analyzed contained small (∼10 μm), highly distorted vesicles, with multi-cuspate morphology, interpreted as the remnants of interstitial gas trapped amongst sintered fragments of melt/glass. Rounded vesicles are also common and are interpreted to result from surface tension-driven relaxation of the distorted vesicles. Calculated timescales of sintering and relaxation are consistent with timescales for pyroclast formation indicated by H2O re-equilibration within the heterogeneous pyroclasts. This sintering model for the origin of obsidian pyroclasts is further supported by the observation that spherical vesicles are found mainly in H2O-rich pyroclasts, and distorted vesicles mainly in H2O-poor pyroclasts. We conclude that obsidian pyroclasts generated during the North Mono eruption were formed by cycles of fragmentation, sintering/suturing, and relaxation, over a very wide range of depths within the conduit; we find no evidence to support pumice (foam) collapse as the formation mechanism. Similar textures, and the occurrence of xenolithic material, in obsidian pyroclasts in other eruptions suggest that sintering may be generally responsible for the origin of obsidian pyroclasts. Our conceptual model indicates that volatile contents in obsidian pyroclasts reflect both degassing of bubbly magma and the composition of gas trapped between sintering particles.
© 2016 The Authors. Published by Elsevier B.V. This is an open access article under the CC BY license (http://creativecommons.org/licenses/by/4.0/).
1. Introduction
The style of silicic volcanic eruptions depends on the behavior of gas that exsolves from magma during ascent (Eichelberger et al., 1986; Jaupart and Allegre, 1991; Gonnermann and Manga, 2003). In the current paradigm, if the gas remains trapped in the bubbly magma (closed-system degassing), then the magma will eventu-ally fragment, driving explosive activity. If, instead, the magma becomes permeable, allowing the gas to escape (open-system de-
* Corresponding author. Fax: +1 512 471 9425.E-mail address: [email protected] (J.E. Gardner).
http://dx.doi.org/10.1016/j.epsl.2016.11.0370012-821X/© 2016 The Authors. Published by Elsevier B.V. This is an open access article
gassing), then the magma does not fragment, but collapses to a bubble-poor liquid and effuses as lava (Eichelberger et al., 1986).
Evidence for magma degassing (exsolution of magmatic volatiles from the melt) and outgassing (loss of exsolved gas from the magma) is preserved in obsidian pyroclasts – glassy pieces of quenched magma found in some volcanic tephras (e.g., Eichelberger and Westrich, 1981; Taylor et al., 1983; Newman et al., 1988;Rust et al., 2004; Barnes et al., 2014). Variations in concen-trations and isotopic compositions of volatiles among obsidian pyroclasts often appear to follow trends expected from closed-system degassing (Taylor et al., 1983; Newman et al., 1988;Barnes et al., 2014). This presents a problem because obsidian py-
under the CC BY license (http://creativecommons.org/licenses/by/4.0/).

J.E. Gardner et al. / Earth and Planetary Science Letters 459 (2017) 252–263 253
Fig. 1. Schematic stratigraphic sections for pits A and B, both of which were ∼1.5–1.75 m in thickness. Pumice fragments and obsidian pyroclasts were collected from layers labeled “P” in the two pits. Pit A is the same as that in Barnes et al. (2014). Inset map shows the location of the two pits, relative to the positions of the obsidian domes and the cumulative tephra isopachs (in mm) for the ca. 1325–1350 C.E. Mono Craters eruption (modified from Newman et al., 1988).
roclasts are vesicle-poor, yet closed-system degassing implies that gas bubbles remain within the packet of magma in which they form. Various models have been proposed to explain this appar-ent conundrum, hypothesizing that the closed-system-like volatile signatures arise from disequilibrium bubble growth (Gonnermann and Manga, 2005) or from buffering the magma by CO2-rich gas that streams through brecciated magma (Rust et al., 2004). Rust et al. (2004) also propose that some obsidian pyroclasts form by ‘an-nealing’ of glass/melt fragments at the conduit margin, challenging the foam-collapse model for their origin (Eichelberger et al., 1986).
In this study, we investigate the origin and evolution of vesi-cles in obsidian pyroclasts from the most recent eruption of Mono Craters (Sieh and Bursik, 1986) by comparing vesicle textures to the preserved volatile contents. Based on our observations we go further than Rust et al. (2004) and argue that most, if not all, of the obsidian pyroclasts originate from sintering of small glass/melt fragments in the conduit (sintering is used in preference to an-nealing, following Wadsworth et al., 2014, 2016). Volatile contents in obsidian pyroclasts thus reflect the composition of gas trapped between sintered ash fragments, rather than preserve degassing trends.
2. Methods
Obsidian pyroclasts were collected from the North Mono tephra bed, dated to the interval 1325–1350 C.E. (Sieh and Bursik, 1986;Bursik, 1993). The eruption began with a series of sub-plinian ex-plosions that spread a thick blanket of tephra to the north and east of Mono Craters (Fig. 1). The eruption shifted to producing pyro-clastic surges and flows, and ended by extruding at least five lava domes and flows (coulees) (Sieh and Bursik, 1986). As many as 10 vents were active, and their alignment, plus the extrusion of sep-arate lavas, suggest that the eruption was fed from one or more dikes (Sieh and Bursik, 1986).
Samples were collected from two pits dug into the North Mono tephra (Fig. 1). The stratigraphy is the same between pits, and can be matched with that described in Sieh and Bursik (1986); our layers P2, P4, and P6 match their Beds 2, 4, and 6. The relatively
Fig. 2. Vesicularity distributions of pumice lapilli (open bars) and obsidian pyroclasts (solid bars). Tephra layer names mark the median pumice vesicularities. Although only 23 obsidian pyroclasts were measured, these are representative of the range of textures seen. P2B-24 is the one pumice lapilli that consists of smaller vesicular fragments sutured together with crystal-rich ash (see Fig. 3f).
lithic- and obsidian-rich nature of P10 suggests it is Bed 7, but it could also be a coarse layer in their Gray Glassy Beds. Bursik(1993) found that Beds 1–6 have ∼60–90% pumice and ∼1–20% obsidian pyroclasts, with different types of lithics making up the difference. Their Bed 7 contains ∼40% obsidian pyroclasts and sub-ordinate amounts of pumice and lithics. Although we did not sieve our tephra layers, those proportions are consistent with our obser-vations.
A total of 81 obsidian pyroclasts collected from four tephra lay-ers were analyzed in this study (Fig. 1). All methods are discussed in the Supplemental text; results are presented in Supplemental Tables A.1 to A.7. Vesicle textures were analyzed in 80 of the ob-sidian pyroclasts. Volatile contents of 54 were measured in this study; volatile contents of the other 27 were reported in Barnes et al. (2014). Together, the measured volatile contents span the en-tire range of values reported by Newman et al. (1988) and Rust et al. (2004). Vesicularities of 221 pumice and 23 obsidian pyroclasts were also measured.
254 J.E. Gardner et al. / Earth and Planetary Science Letters 459 (2017) 252–263
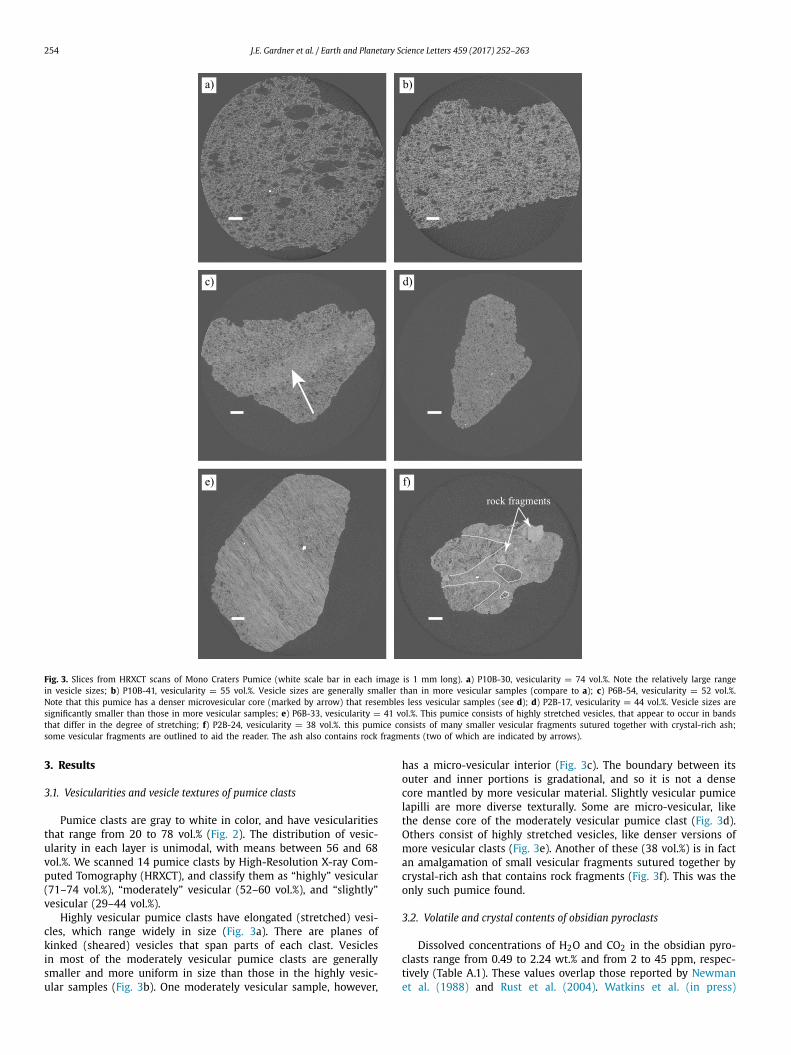
Fig. 3. Slices from HRXCT scans of Mono Craters Pumice (white scale bar in each image is 1 mm long). a) P10B-30, vesicularity = 74 vol.%. Note the relatively large range in vesicle sizes; b) P10B-41, vesicularity = 55 vol.%. Vesicle sizes are generally smaller than in more vesicular samples (compare to a); c) P6B-54, vesicularity = 52 vol.%. Note that this pumice has a denser microvesicular core (marked by arrow) that resembles less vesicular samples (see d); d) P2B-17, vesicularity = 44 vol.%. Vesicle sizes are significantly smaller than those in more vesicular samples; e) P6B-33, vesicularity = 41 vol.%. This pumice consists of highly stretched vesicles, that appear to occur in bands that differ in the degree of stretching; f) P2B-24, vesicularity = 38 vol.%. this pumice consists of many smaller vesicular fragments sutured together with crystal-rich ash; some vesicular fragments are outlined to aid the reader. The ash also contains rock fragments (two of which are indicated by arrows).
3. Results
3.1. Vesicularities and vesicle textures of pumice clasts
Pumice clasts are gray to white in color, and have vesicularities that range from 20 to 78 vol.% (Fig. 2). The distribution of vesic-ularity in each layer is unimodal, with means between 56 and 68 vol.%. We scanned 14 pumice clasts by High-Resolution X-ray Com-puted Tomography (HRXCT), and classify them as “highly” vesicular (71–74 vol.%), “moderately” vesicular (52–60 vol.%), and “slightly” vesicular (29–44 vol.%).
Highly vesicular pumice clasts have elongated (stretched) vesi-cles, which range widely in size (Fig. 3a). There are planes of kinked (sheared) vesicles that span parts of each clast. Vesicles in most of the moderately vesicular pumice clasts are generally smaller and more uniform in size than those in the highly vesic-ular samples (Fig. 3b). One moderately vesicular sample, however,
has a micro-vesicular interior (Fig. 3c). The boundary between its outer and inner portions is gradational, and so it is not a dense core mantled by more vesicular material. Slightly vesicular pumice lapilli are more diverse texturally. Some are micro-vesicular, like the dense core of the moderately vesicular pumice clast (Fig. 3d). Others consist of highly stretched vesicles, like denser versions of more vesicular clasts (Fig. 3e). Another of these (38 vol.%) is in fact an amalgamation of small vesicular fragments sutured together by crystal-rich ash that contains rock fragments (Fig. 3f). This was the only such pumice found.
3.2. Volatile and crystal contents of obsidian pyroclasts
Dissolved concentrations of H2O and CO2 in the obsidian pyro-clasts range from 0.49 to 2.24 wt.% and from 2 to 45 ppm, respec-tively (Table A.1). These values overlap those reported by Newman et al. (1988) and Rust et al. (2004). Watkins et al. (in press)
J.E. Gardner et al. / Earth and Planetary Science Letters 459 (2017) 252–263 255
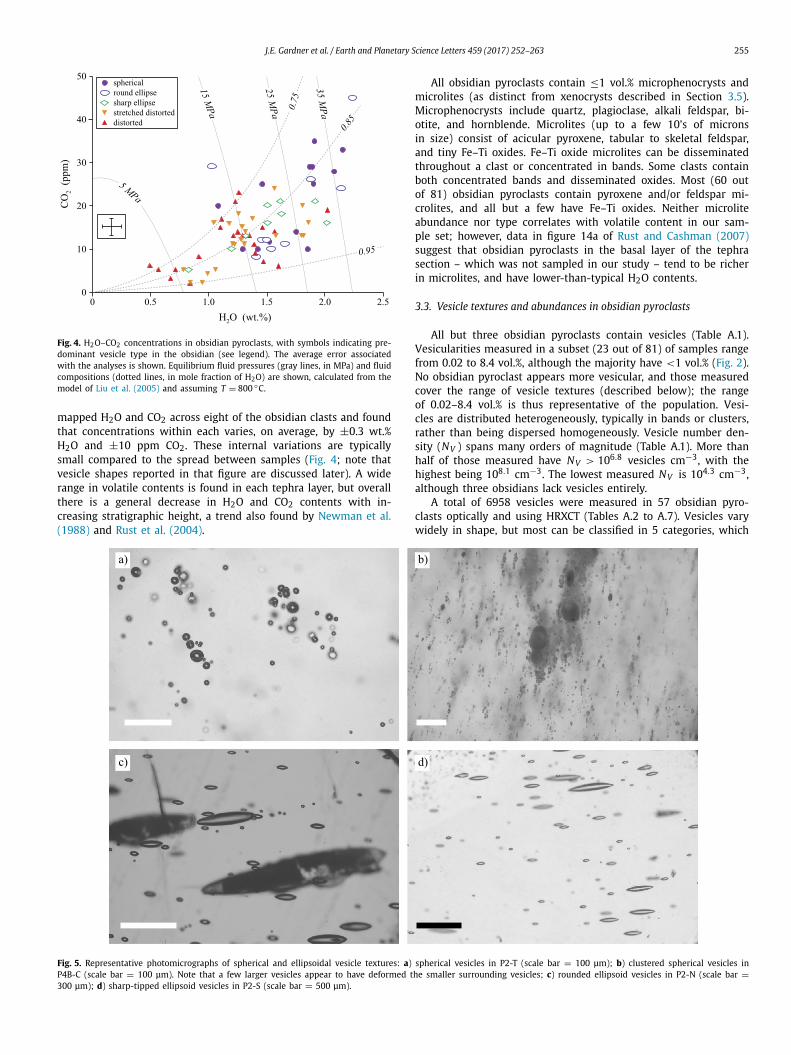
Fig. 4. H2O–CO2 concentrations in obsidian pyroclasts, with symbols indicating pre-dominant vesicle type in the obsidian (see legend). The average error associated with the analyses is shown. Equilibrium fluid pressures (gray lines, in MPa) and fluid compositions (dotted lines, in mole fraction of H2O) are shown, calculated from the model of Liu et al. (2005) and assuming T = 800 ◦C.
mapped H2O and CO2 across eight of the obsidian clasts and found that concentrations within each varies, on average, by ±0.3 wt.% H2O and ±10 ppm CO2. These internal variations are typically small compared to the spread between samples (Fig. 4; note that vesicle shapes reported in that figure are discussed later). A wide range in volatile contents is found in each tephra layer, but overall there is a general decrease in H2O and CO2 contents with in-creasing stratigraphic height, a trend also found by Newman et al.(1988) and Rust et al. (2004).
All obsidian pyroclasts contain ≤1 vol.% microphenocrysts and microlites (as distinct from xenocrysts described in Section 3.5). Microphenocrysts include quartz, plagioclase, alkali feldspar, bi-otite, and hornblende. Microlites (up to a few 10’s of microns in size) consist of acicular pyroxene, tabular to skeletal feldspar, and tiny Fe–Ti oxides. Fe–Ti oxide microlites can be disseminated throughout a clast or concentrated in bands. Some clasts contain both concentrated bands and disseminated oxides. Most (60 out of 81) obsidian pyroclasts contain pyroxene and/or feldspar mi-crolites, and all but a few have Fe–Ti oxides. Neither microlite abundance nor type correlates with volatile content in our sam-ple set; however, data in figure 14a of Rust and Cashman (2007)suggest that obsidian pyroclasts in the basal layer of the tephra section – which was not sampled in our study – tend to be richer in microlites, and have lower-than-typical H2O contents.
3.3. Vesicle textures and abundances in obsidian pyroclasts
All but three obsidian pyroclasts contain vesicles (Table A.1). Vesicularities measured in a subset (23 out of 81) of samples range from 0.02 to 8.4 vol.%, although the majority have <1 vol.% (Fig. 2). No obsidian pyroclast appears more vesicular, and those measured cover the range of vesicle textures (described below); the range of 0.02–8.4 vol.% is thus representative of the population. Vesi-cles are distributed heterogeneously, typically in bands or clusters, rather than being dispersed homogeneously. Vesicle number den-sity (NV ) spans many orders of magnitude (Table A.1). More than half of those measured have NV > 106.8 vesicles cm−3, with the highest being 108.1 cm−3. The lowest measured NV is 104.3 cm−3, although three obsidians lack vesicles entirely.
A total of 6958 vesicles were measured in 57 obsidian pyro-clasts optically and using HRXCT (Tables A.2 to A.7). Vesicles vary widely in shape, but most can be classified in 5 categories, which
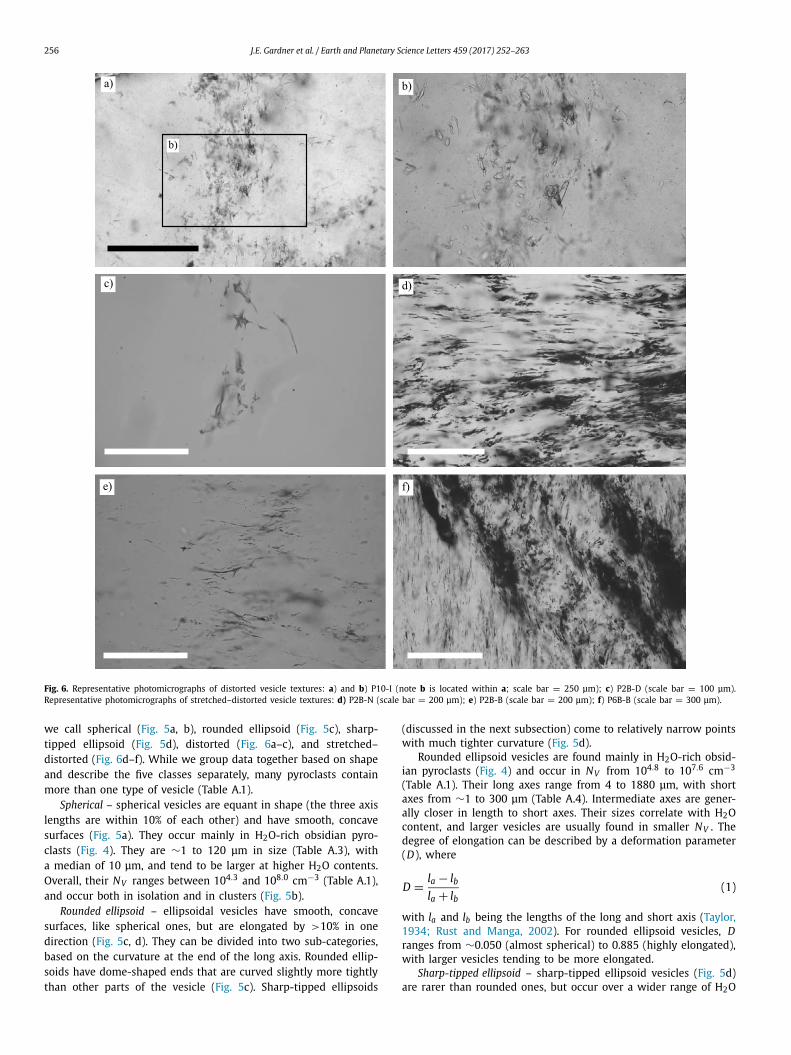
Fig. 5. Representative photomicrographs of spherical and ellipsoidal vesicle textures: a) spherical vesicles in P2-T (scale bar = 100 μm); b) clustered spherical vesicles in P4B-C (scale bar = 100 μm). Note that a few larger vesicles appear to have deformed the smaller surrounding vesicles; c) rounded ellipsoid vesicles in P2-N (scale bar =300 μm); d) sharp-tipped ellipsoid vesicles in P2-S (scale bar = 500 μm).
256 J.E. Gardner et al. / Earth and Planetary Science Letters 459 (2017) 252–263
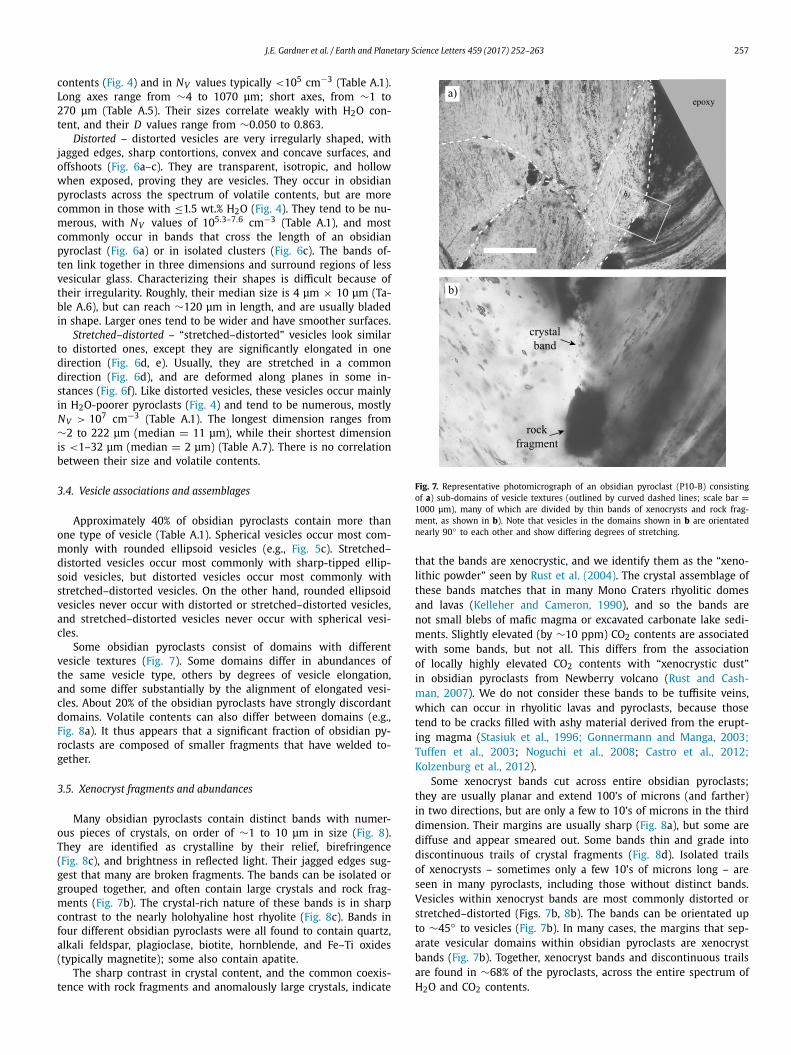
Fig. 6. Representative photomicrographs of distorted vesicle textures: a) and b) P10-I (note b is located within a; scale bar = 250 μm); c) P2B-D (scale bar = 100 μm). Representative photomicrographs of stretched–distorted vesicle textures: d) P2B-N (scale bar = 200 μm); e) P2B-B (scale bar = 200 μm); f) P6B-B (scale bar = 300 μm).
we call spherical (Fig. 5a, b), rounded ellipsoid (Fig. 5c), sharp-tipped ellipsoid (Fig. 5d), distorted (Fig. 6a–c), and stretched–distorted (Fig. 6d–f). While we group data together based on shape and describe the five classes separately, many pyroclasts contain more than one type of vesicle (Table A.1).
Spherical – spherical vesicles are equant in shape (the three axis lengths are within 10% of each other) and have smooth, concave surfaces (Fig. 5a). They occur mainly in H2O-rich obsidian pyro-clasts (Fig. 4). They are ∼1 to 120 μm in size (Table A.3), with a median of 10 μm, and tend to be larger at higher H2O contents. Overall, their NV ranges between 104.3 and 108.0 cm−3 (Table A.1), and occur both in isolation and in clusters (Fig. 5b).
Rounded ellipsoid – ellipsoidal vesicles have smooth, concave surfaces, like spherical ones, but are elongated by >10% in one direction (Fig. 5c, d). They can be divided into two sub-categories, based on the curvature at the end of the long axis. Rounded ellip-soids have dome-shaped ends that are curved slightly more tightly than other parts of the vesicle (Fig. 5c). Sharp-tipped ellipsoids
(discussed in the next subsection) come to relatively narrow points with much tighter curvature (Fig. 5d).
Rounded ellipsoid vesicles are found mainly in H2O-rich obsid-ian pyroclasts (Fig. 4) and occur in NV from 104.8 to 107.6 cm−3
(Table A.1). Their long axes range from 4 to 1880 μm, with short axes from ∼1 to 300 μm (Table A.4). Intermediate axes are gener-ally closer in length to short axes. Their sizes correlate with H2O content, and larger vesicles are usually found in smaller NV . The degree of elongation can be described by a deformation parameter (D), where
D = la − lbla + lb
(1)
with la and lb being the lengths of the long and short axis (Taylor, 1934; Rust and Manga, 2002). For rounded ellipsoid vesicles, Dranges from ∼0.050 (almost spherical) to 0.885 (highly elongated), with larger vesicles tending to be more elongated.
Sharp-tipped ellipsoid – sharp-tipped ellipsoid vesicles (Fig. 5d) are rarer than rounded ones, but occur over a wider range of H2O
J.E. Gardner et al. / Earth and Planetary Science Letters 459 (2017) 252–263 257
contents (Fig. 4) and in NV values typically <105 cm−3 (Table A.1). Long axes range from ∼4 to 1070 μm; short axes, from ∼1 to 270 μm (Table A.5). Their sizes correlate weakly with H2O con-tent, and their D values range from ∼0.050 to 0.863.
Distorted – distorted vesicles are very irregularly shaped, with jagged edges, sharp contortions, convex and concave surfaces, and offshoots (Fig. 6a–c). They are transparent, isotropic, and hollow when exposed, proving they are vesicles. They occur in obsidian pyroclasts across the spectrum of volatile contents, but are more common in those with ≤1.5 wt.% H2O (Fig. 4). They tend to be nu-merous, with NV values of 105.3–7.6 cm−3 (Table A.1), and most commonly occur in bands that cross the length of an obsidian pyroclast (Fig. 6a) or in isolated clusters (Fig. 6c). The bands of-ten link together in three dimensions and surround regions of less vesicular glass. Characterizing their shapes is difficult because of their irregularity. Roughly, their median size is 4 μm × 10 μm (Ta-ble A.6), but can reach ∼120 μm in length, and are usually bladed in shape. Larger ones tend to be wider and have smoother surfaces.
Stretched–distorted – “stretched–distorted” vesicles look similar to distorted ones, except they are significantly elongated in one direction (Fig. 6d, e). Usually, they are stretched in a common direction (Fig. 6d), and are deformed along planes in some in-stances (Fig. 6f). Like distorted vesicles, these vesicles occur mainly in H2O-poorer pyroclasts (Fig. 4) and tend to be numerous, mostly NV > 107 cm−3 (Table A.1). The longest dimension ranges from ∼2 to 222 μm (median = 11 μm), while their shortest dimension is <1–32 μm (median = 2 μm) (Table A.7). There is no correlation between their size and volatile contents.
3.4. Vesicle associations and assemblages
Approximately 40% of obsidian pyroclasts contain more than one type of vesicle (Table A.1). Spherical vesicles occur most com-monly with rounded ellipsoid vesicles (e.g., Fig. 5c). Stretched–distorted vesicles occur most commonly with sharp-tipped ellip-soid vesicles, but distorted vesicles occur most commonly with stretched–distorted vesicles. On the other hand, rounded ellipsoid vesicles never occur with distorted or stretched–distorted vesicles, and stretched–distorted vesicles never occur with spherical vesi-cles.
Some obsidian pyroclasts consist of domains with different vesicle textures (Fig. 7). Some domains differ in abundances of the same vesicle type, others by degrees of vesicle elongation, and some differ substantially by the alignment of elongated vesi-cles. About 20% of the obsidian pyroclasts have strongly discordant domains. Volatile contents can also differ between domains (e.g., Fig. 8a). It thus appears that a significant fraction of obsidian py-roclasts are composed of smaller fragments that have welded to-gether.
3.5. Xenocryst fragments and abundances
Many obsidian pyroclasts contain distinct bands with numer-ous pieces of crystals, on order of ∼1 to 10 μm in size (Fig. 8). They are identified as crystalline by their relief, birefringence (Fig. 8c), and brightness in reflected light. Their jagged edges sug-gest that many are broken fragments. The bands can be isolated or grouped together, and often contain large crystals and rock frag-ments (Fig. 7b). The crystal-rich nature of these bands is in sharp contrast to the nearly holohyaline host rhyolite (Fig. 8c). Bands in four different obsidian pyroclasts were all found to contain quartz, alkali feldspar, plagioclase, biotite, hornblende, and Fe–Ti oxides (typically magnetite); some also contain apatite.
The sharp contrast in crystal content, and the common coexis-tence with rock fragments and anomalously large crystals, indicate
Fig. 7. Representative photomicrograph of an obsidian pyroclast (P10-B) consisting of a) sub-domains of vesicle textures (outlined by curved dashed lines; scale bar =1000 μm), many of which are divided by thin bands of xenocrysts and rock frag-ment, as shown in b). Note that vesicles in the domains shown in b are orientated nearly 90◦ to each other and show differing degrees of stretching.
that the bands are xenocrystic, and we identify them as the “xeno-lithic powder” seen by Rust et al. (2004). The crystal assemblage of these bands matches that in many Mono Craters rhyolitic domes and lavas (Kelleher and Cameron, 1990), and so the bands are not small blebs of mafic magma or excavated carbonate lake sedi-ments. Slightly elevated (by ∼10 ppm) CO2 contents are associated with some bands, but not all. This differs from the association of locally highly elevated CO2 contents with “xenocrystic dust” in obsidian pyroclasts from Newberry volcano (Rust and Cash-man, 2007). We do not consider these bands to be tuffisite veins, which can occur in rhyolitic lavas and pyroclasts, because those tend to be cracks filled with ashy material derived from the erupt-ing magma (Stasiuk et al., 1996; Gonnermann and Manga, 2003;Tuffen et al., 2003; Noguchi et al., 2008; Castro et al., 2012;Kolzenburg et al., 2012).
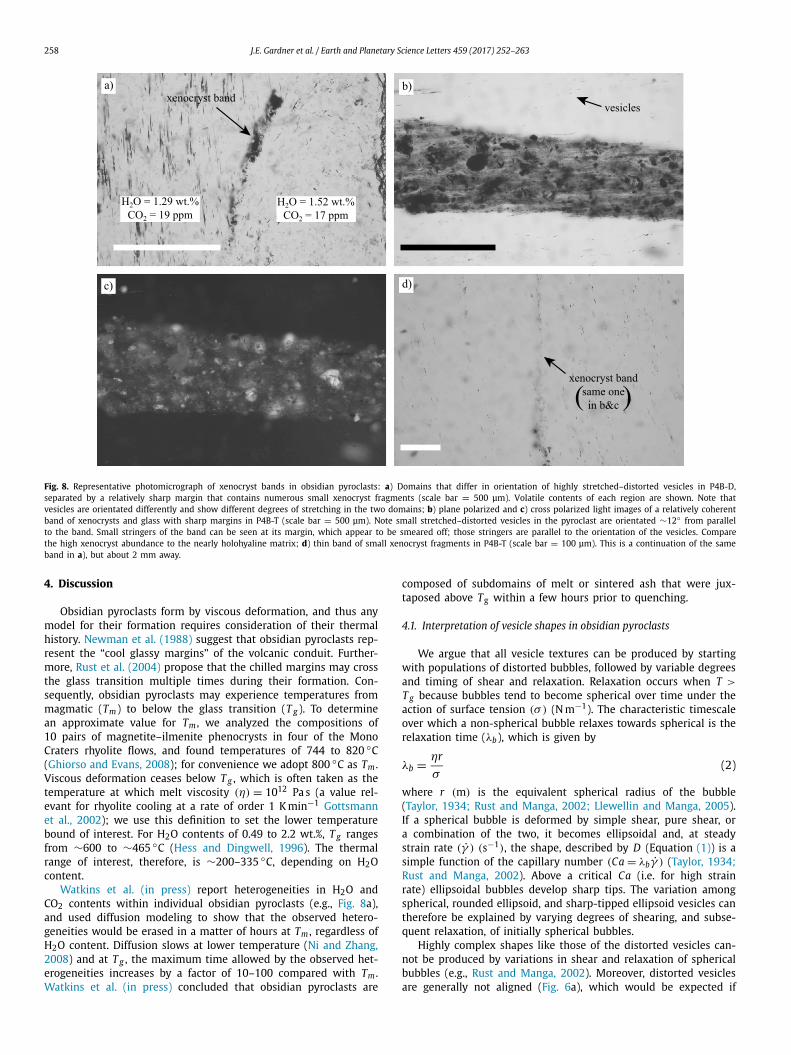
Some xenocryst bands cut across entire obsidian pyroclasts; they are usually planar and extend 100’s of microns (and farther) in two directions, but are only a few to 10’s of microns in the third dimension. Their margins are usually sharp (Fig. 8a), but some are diffuse and appear smeared out. Some bands thin and grade into discontinuous trails of crystal fragments (Fig. 8d). Isolated trails of xenocrysts – sometimes only a few 10’s of microns long – are seen in many pyroclasts, including those without distinct bands. Vesicles within xenocryst bands are most commonly distorted or stretched–distorted (Figs. 7b, 8b). The bands can be orientated up to ∼45◦ to vesicles (Fig. 7b). In many cases, the margins that sep-arate vesicular domains within obsidian pyroclasts are xenocryst bands (Fig. 7b). Together, xenocryst bands and discontinuous trails are found in ∼68% of the pyroclasts, across the entire spectrum of H2O and CO2 contents.
258 J.E. Gardner et al. / Earth and Planetary Science Letters 459 (2017) 252–263
Fig. 8. Representative photomicrograph of xenocryst bands in obsidian pyroclasts: a) Domains that differ in orientation of highly stretched–distorted vesicles in P4B-D, separated by a relatively sharp margin that contains numerous small xenocryst fragments (scale bar = 500 μm). Volatile contents of each region are shown. Note that vesicles are orientated differently and show different degrees of stretching in the two domains; b) plane polarized and c) cross polarized light images of a relatively coherent band of xenocrysts and glass with sharp margins in P4B-T (scale bar = 500 μm). Note small stretched–distorted vesicles in the pyroclast are orientated ∼12◦ from parallel to the band. Small stringers of the band can be seen at its margin, which appear to be smeared off; those stringers are parallel to the orientation of the vesicles. Compare the high xenocryst abundance to the nearly holohyaline matrix; d) thin band of small xenocryst fragments in P4B-T (scale bar = 100 μm). This is a continuation of the same band in a), but about 2 mm away.
4. Discussion
Obsidian pyroclasts form by viscous deformation, and thus any model for their formation requires consideration of their thermal history. Newman et al. (1988) suggest that obsidian pyroclasts rep-resent the “cool glassy margins” of the volcanic conduit. Further-more, Rust et al. (2004) propose that the chilled margins may cross the glass transition multiple times during their formation. Con-sequently, obsidian pyroclasts may experience temperatures from magmatic (Tm) to below the glass transition (T g ). To determine an approximate value for Tm , we analyzed the compositions of 10 pairs of magnetite–ilmenite phenocrysts in four of the Mono Craters rhyolite flows, and found temperatures of 744 to 820 ◦C (Ghiorso and Evans, 2008); for convenience we adopt 800 ◦C as Tm . Viscous deformation ceases below T g , which is often taken as the temperature at which melt viscosity (η) = 1012 Pa s (a value rel-evant for rhyolite cooling at a rate of order 1 K min−1 Gottsmann et al., 2002); we use this definition to set the lower temperature bound of interest. For H2O contents of 0.49 to 2.2 wt.%, T g ranges from ∼600 to ∼465 ◦C (Hess and Dingwell, 1996). The thermal range of interest, therefore, is ∼200–335 ◦C, depending on H2O content.
Watkins et al. (in press) report heterogeneities in H2O and CO2 contents within individual obsidian pyroclasts (e.g., Fig. 8a), and used diffusion modeling to show that the observed hetero-geneities would be erased in a matter of hours at Tm , regardless of H2O content. Diffusion slows at lower temperature (Ni and Zhang, 2008) and at T g , the maximum time allowed by the observed het-erogeneities increases by a factor of 10–100 compared with Tm . Watkins et al. (in press) concluded that obsidian pyroclasts are
composed of subdomains of melt or sintered ash that were jux-taposed above Tg within a few hours prior to quenching.
4.1. Interpretation of vesicle shapes in obsidian pyroclasts
We argue that all vesicle textures can be produced by starting with populations of distorted bubbles, followed by variable degrees and timing of shear and relaxation. Relaxation occurs when T >
T g because bubbles tend to become spherical over time under the action of surface tension (σ ) (N m−1). The characteristic timescale over which a non-spherical bubble relaxes towards spherical is the relaxation time (λb), which is given by
λb = ηr
σ(2)
where r (m) is the equivalent spherical radius of the bubble (Taylor, 1934; Rust and Manga, 2002; Llewellin and Manga, 2005). If a spherical bubble is deformed by simple shear, pure shear, or a combination of the two, it becomes ellipsoidal and, at steady strain rate (γ̇ ) (s−1), the shape, described by D (Equation (1)) is a simple function of the capillary number (Ca = λbγ̇ ) (Taylor, 1934;Rust and Manga, 2002). Above a critical Ca (i.e. for high strain rate) ellipsoidal bubbles develop sharp tips. The variation among spherical, rounded ellipsoid, and sharp-tipped ellipsoid vesicles can therefore be explained by varying degrees of shearing, and subse-quent relaxation, of initially spherical bubbles.
Highly complex shapes like those of the distorted vesicles can-not be produced by variations in shear and relaxation of spherical bubbles (e.g., Rust and Manga, 2002). Moreover, distorted vesicles are generally not aligned (Fig. 6a), which would be expected if
J.E. Gardner et al. / Earth and Planetary Science Letters 459 (2017) 252–263 259
they formed by shearing. On the other hand, stretched–distorted vesicles are typically aligned; we thus infer that they formed by shearing of distorted bubbles. While it is not possible to form dis-torted vesicles by shear deformation of spherical bubbles, distorted bubbles will tend to relax towards spherical over time (Rust and Manga, 2002). Applying shear at different times during the relax-ation of distorted bubbles could lead to either stretched–distorted vesicles (if applied relatively early) or ellipsoid vesicles (if applied relatively late).
4.2. Evidence for a fragmental origin for obsidian pyroclasts
The occurrence of xenocryst bands and rock fragments in a large majority of obsidian pyroclasts is strong evidence that the obsidians did not form by pumice (foam) collapse (Eichelberger et al., 1986; Westrich and Eichelberger, 1994). This interpretation is supported by the observation that many obsidian pyroclasts are composed of domains that experienced different vesiculation and deformation histories (Figs. 6, 7). In addition, the wide gap in vesicularity between obsidian and pumice (Fig. 2) is hard to recon-cile with a foam-collapse origin, which would necessitate that the magma passed through a stage of intermediate vesicularity that is not observed. Finally, recent experiments demonstrate that foam collapse takes much longer than the time available for the forma-tion of the North Mono obsidian pyroclasts. Martel and Iacono-Marziano (2015) decompressed hydrous rhyolite at magmatic tem-peratures and pressures, causing their samples to vesiculate, and then eventually collapse in the manner proposed by Eichelberger et al. (1986). Their findings imply that at least 105 h are required for foam collapse at the lowest melt viscosity that we expect dur-ing formation of the obsidian pyroclasts (η ≈ 106 Pa s for 2.2 wt.% H2O at Tm , using the method of Hess and Dingwell, 1996). More viscous samples would take even longer. This is clearly inconsis-tent with both the time above T g inferred from the heterogeneities of H2O within the pyroclasts (Watkins et al., in press), and the wide gap in vesicularities between pumice and obsidian (Fig. 2). We conclude that some other process besides foam collapse led to the formation of the Mono Craters obsidian pyroclasts.
Some obsidian pyroclasts are composed of separate vesicular domains, and the contacts between them consist of xenocrysts and rock fragments (e.g., Figs. 7–8). This shows that some bands of ash-sized (and larger) xenocrysts became incorporated where pieces of obsidian sutured together. Some sutures remained as coher-ent bands through an obsidian pyroclast (Fig. 8a); other xenocryst bands are short, isolated trails only 10’s to 100’s of microns long. These disconnected bands most likely represent instances where obsidian fragments welded together more thoroughly. In some cases, there is evidence that these welded pyroclasts underwent further deformation and broke apart again, to leave small, iso-lated fragments of xenocrysts, which then welded together with other fragments. Each vesicular domain seen in Fig. 7, for exam-ple, contains xenocryst bands orientated obliquely to the outer, xenocryst-lined sutures. This pyroclast thus records multiple cycles of fragmentation and suturing.
Distorted vesicles show textures that are also strongly sugges-tive of a fragmental origin. They are often organized into zones that separate regions of more-or-less vesicle-poor glass (Fig. 6a, b). These textures are consistent with partial sintering of fragments of obsidian and ash-sized glass of various sizes. The jagged and contorted shapes of the vesicles then result from the trapping of gas between the fragments. Indeed, the distorted vesicles seen in Fig. 6c have multi-cuspate forms that are what one would expect if gas were trapped in the junctions between sintering glass frag-ments. The preservation of these distorted shapes requires that no significant relaxation of the trapped gas bubbles occurred; relax-ation is discussed in detail later in Section 4.4.
This interpretation of the distorted vesicles is supported by their relationship to volatile heterogeneities and xenocryst bands. Watkins et al. (in press) found that the poorly vesicular regions in P2B-N (Fig. 6d) have different volatile contents than the bands of distorted vesicles that separate them. In addition, the glassy regions on either side of bands of distorted vesicles in P10-I (Fig. 6a) have different volatile contents. These domains are also separated by xenocryst bands and rock fragments. In general, vesi-cles that occur within xenocryst bands are most often distorted or stretched–distorted (Figs. 7, 8d), suggesting that xenocryst bands and distorted vesicles are linked, and both mark where ash and obsidian fragments sintered together.
4.3. Conceptual model for the formation of obsidian pyroclasts
Rust et al. (2004) proposed that some pyroclastic obsidians form through sintering of ash fragments. Here, we extend that model and argue that it is a general process that forms most, if not all, obsidian pyroclasts generated during the North Mono erup-tion. Xenocryst bands, which record cycles of fragmentation and sintering, are found in obsidian pyroclasts across the spectrum of measured volatile contents and in every tephra layer sampled, in-dicating that this process occurs over a wide range of depths in the conduit (Fig. 4), and at all stages of development of vesicular textures.
We argue that distorted vesicles are not relicts of collapsed magmatic bubbles, but are remnants of sintering, marking where ash fragments sintered together (Fig. 9). In this model, the spec-trum of vesicle textures results from varying degrees of shearing and relaxation that act on starting populations of distorted vesi-cles formed by sintering. Both sintering and relaxation processes require time (see Section 4.4); consequently, the most likely loca-tion for these processes is at the conduit margin, where erupt-ing material may be accreted and held for variable amounts of time, as proposed by Newman et al. (1988). After a packet of ash has begun to weld to form obsidian-like magma, it can be re-incorporated into the erupting mass and ejected to form obsidian pyroclasts with mainly distorted vesicles, or stretched–distorted vesicles if that packet is sheared shortly before (or while) it is re-incorporated (Fig. 9). Stalling for longer times at the margins of the conduit allows vesicles to relax, and thus re-incorporated pieces of this magma will produce obsidian pyroclasts with spherical to el-lipsoid vesicles, depending on the degree of shear that acts on the packet (Fig. 9). The sequence of sintering, shearing, and relaxation can be repeated, resulting in pyroclasts with multiple domains of varying vesicular textures (Figs. 7, 8d).
Previous models suggest that obsidian forms in localized re-gions of fragmentation within a conduit that is otherwise filled with continuous magma. Rust et al. (2004) conclude that North Mono obsidian pyroclasts formed at conduit margins, where magma was brecciated by shear. Castro et al. (2014) conclude that obsidian lavas are produced through fragmentation and outgassing of vesicular magma along tuffisite veins. Although our data do not preclude these mechanisms, two lines of evidence support a model in which obsidian pyroclasts are formed in a conduit filled with fragmental material. First, the wide range in volatile contents indicates that obsidian formed over a great range of pressures (Ta-ble A.1) and hence depths (likely a few kilometers, depending on the density of the conduit-filling material), and was transported to the surface rapidly enough to preserve relatively steep gradi-ents in volatile contents (Watkins et al., 2012, in press). It is easier to imagine this happening in a conduit filled with an erupting gas–particle mixture than in one filled with continuous magma. Second, obsidian pyroclasts contain subdomains with different wa-ter contents. Although juxtaposition of clasts with different water contents can occur in tuffisite veins (Saubin et al., 2016), again it

260 J.E. Gardner et al. / Earth and Planetary Science Letters 459 (2017) 252–263
Fig. 9. Schematic model for the formation of obsidian pyroclasts. Ash collects and sinters along the margins of the volcanic conduit, forming distorted vesicles. Given time, vesicles relax to spherical under the stress of surface tension. Time allowed for relaxation increases with increasing viscosity, which increases as temperature decreases from magmatic to the glass transition and as dissolved H2O content decreases. Plot on right shows H2O contents for pyroclasts with different dominant vesicle shapes, in each category n samples were analyzed: thick line = median; box = quartiles; whiskers = range. Pyroclasts that contain spherical vesicles tend to be low viscosity (H2O-rich), which is a statistically separate population from high viscosity (H2O-poor) pyroclasts that contain distorted vesicles (ANOVA of H2O contents based on n number of samples). Vesicles are stretched if shear is exerted on the vesicular magma. If exerted soon after sintering, then stretched–distorted vesicles result; if exerted late, then smooth, elongated vesicles result. Consistent with this, H2O contents of pyroclasts with sheared vesicles overlap with the other populations.
is easier to imagine this happening in a conduit filled with fast-moving fragmental material.
Our conceptualization requires that the environment at the conduit wall varies from depositional to erosional over time and space, suggesting that flow in the conduit is unsteady. It is possi-ble that the sub-Plinian character of the eruption (Bursik, 1993)favors episodic cycling between deposition and erosion. Obsid-ian pyroclasts with higher volatile contents become less common up-section in the stratigraphy (Table A.1; Newman et al., 1988;Rust and Cashman, 2007; Barnes et al., 2014). It is possible that as the eruption waned (Sieh and Bursik, 1986), the main location for deposition and erosion of sintered material became shallower in the conduit.
Finally, we note that very similar vesicle textures are seen in obsidian pyroclasts erupted at Newberry Volcano (Rust and Cashman, 2007). Those pyroclasts also contain abundant veins of xenocrystic material. These features are compatible with our model, and we conclude that the Newberry Volcano samples could have formed by sintering of ash, suggesting that our model pro-vides a general mechanism for generating obsidian pyroclasts.
4.4. Timescales and conditions of formation of obsidian pyroclasts
Our model postulates that the spectrum of vesicular textures results from varying degrees of shearing and relaxation of bubbles that were, originally, distorted gas pockets trapped between sin-tered fragments (Fig. 9). Both sintering and relaxation require that T > T g , a condition that can exist for only a few hours at Tm across the range of H2O contents (Watkins et al., in press). A first test of the model is to determine whether this allows sufficient time for bubble relaxation.
The characteristic relaxation time for a deformed bubble λb is given by equation (2). Surface tension is only weakly controlled by melt composition and T , and so for the limited range in H2O contents of interest (Fig. 4) it is reasonable to assume that σ is constant, with a value of ∼0.2 N m−1 (Walker and Mullins, 1981;Bagdassarov et al., 2000; Gardner and Ketcham, 2011; Gardner et al., 2013). Relaxation time therefore depends mainly on viscosity and bubble radius (Fig. 10). We note that the early stages of relax-ation of a distorted bubble will proceed more rapidly because of the tighter radius of curvature, but for a bubble to become spheri-cal, it must have an amount of time available for relaxation that is at least as long as the time calculated using equation (2) with the spherical bubble radius. Given the range in measured H2O contents (Fig. 4), and allowing T to range from Tm to T g , viscosity varies from ∼106 to 1012 Pa s. Bubble radius varies over an approximate range of 1 to 100’s of microns. Also shown in Fig. 10 is the range in time allowed – bracketed at ca. 1–10 h at Tm (Watkins et al., in press). This time is determined from modeling of diffusion of H2O and CO2, and diffusivity is a weaker function of temperature than is viscosity (Ni and Zhang, 2008); hence, the time allowed increases at T < Tm as indicated by the shift to longer times at lower T . This analysis demonstrates that, at high H2O content, there is ample time for bubbles to relax at Tm , and even near T g
there is still time for small bubbles to relax (Fig. 10a). At low H2O contents, however, relaxation can only occur near Tm and only for relatively small bubbles (Fig. 10b).
A first-order conclusion, based on this analysis, is that distorted vesicles are more likely to be preserved in samples with lower H2O content because the melt is more viscous and hence, bubbles relax more slowly. A logical corollary is that spherical vesicles should be more common in melts with higher H2O content. We tested

J.E. Gardner et al. / Earth and Planetary Science Letters 459 (2017) 252–263 261
Fig. 10. Time required for a bubble of radius r to relax or ash particle of size L to sinter as a function of temperature, for a) 2.2 wt.% H2O and b) 0.49 wt.% H2O; these values are the highest and lowest water contents measured in our samples. The gray band delimits the time available for these processes during the North Mono erup-tion, based on H2O diffusion modeling of Watkins et al. (in press). Dashed curves are where sintering and relaxation take longer than the time allowed by diffusion modeling. Surface tension (σ ) equals 0.2 N m−1 for all times.
this hypothesis quantitatively using analysis of variance (ANOVA) of the H2O and CO2 contents of the pyroclasts, by dividing obsidian pyroclasts into three groups: distorted, spheroidal, and stretched. The “distorted” group includes samples with predominantly dis-torted or stretched–distorted vesicles; the “spheroidal” group in-cludes samples with predominantly spherical, rounded ellipsoid, or sharp-tipped ellipsoid vesicles; and the “stretched” group includes samples with predominantly rounded ellipsoid, sharp-tipped ellip-soid, or stretched–distorted vesicles (thus it repeats some samples from each of the spheroidal and distorted categories). The rationale for these groupings is that distorted vesicles (whether stretched or not) indicate samples in which little bubble relaxation has oc-curred. Spheroidal vesicles, by contrast, represent samples in which bubbles have relaxed considerably. Samples with stretched vesi-cles should not differ from their non-stretched counterparts, except that they were sheared during, or shortly before, quench.
For H2O concentrations, ANOVA indicates that the null hypoth-esis that samples in the spheroidal and distorted categories are drawn from the same distribution can be rejected at the 0.01% level (P -value =0.000026). Hence, it is highly likely that sam-ples in those two categories came from populations with different H2O concentrations. By contrast, the null hypothesis that sam-ples in the spheroidal and stretched categories are drawn from the same distribution cannot be rejected at the 1% level (P -value =0.057). The same is true for the distorted and stretched cate-gories (P -value =0.040). The findings are the same for CO2 con-centrations (P -values of 0.00011, 0.18, and 0.030, respectively, for the three null hypotheses). The volatile and vesicle shape data therefore support the hypothesis that spheroidal vesicles are more common in H2O-rich (low viscosity) melts, whereas distorted vesi-cles are more common in H2O-poor (high viscosity) melts (Fig. 4). The data in figure 14b of Rust and Cashman (2007) also support this broad correlation in North Mono obsidian pyroclasts.
More generally, our model postulates that distorted vesicles are gas pockets formed by sintering ash particles. Wadsworth et al.(2016) showed that the characteristic sintering timescale (λs) for randomly packed, monodisperse spherical particles of silicate melt is also given by equation (2), except with particle radius (L) re-placing bubble radius r (i.e., λS = ηL
σ ). We do not have a direct measure of L, but can approximate it from the number density of distorted vesicles, such that L ≈ 3
√N−1
V . NV ranges from 105.3 to 108.1 cm−3, thus L ≈ 20–170 μm. Using the same values for sur-face tension and viscosity as above, and reading the vertical axis in Fig. 10 as particle radius, we find that there is ample time at high H2O contents to sinter ash together across almost the entire range of temperature (Fig. 10a). At low H2O contents, however, sinter-ing is only likely for small ash sizes (Fig. 10b). We note that the sintering timescale presented is likely a maximum, because it as-sumes no shear or compression, both of which accelerate sintering (Rahaman et al., 1986; Rahaman and De Jonghe, 1990). Regardless, our analysis shows that, to first order, ash sintering can happen over the range of conditions of interest (time, magma temperature, and water content) of the eruption (Fig. 10).
Wadsworth et al. (2016) found that sintering monodisperse par-ticles results in a final vesicularity of ∼3 vol.%, whilst obsidian pyroclasts from the North Mono tephra typically have vesiculari-ties of <1 vol.% (Table A.1). It is likely that the initial population of ash particles is polydisperse, which allows sintering to proceed to lower vesicularities (Wadsworth et al., 2016). In addition, resorp-tion of volatiles from vesicles into the melt, as a result of either cooling (McIntosh et al., 2014) or increased pressure (Watkins et al., 2012), would also lower vesicularity.
Our calculations indicate that sintering is favored for ash-sized particles (Fig. 10). This may explain why sintering of large pumice clasts is uncommon (Fig. 3f), even in an eruption that is generat-ing abundant obsidian pyroclasts. Sintering may even require ash to act as the ‘glue’ that facilitates assembling larger clasts that are composed of smaller domains (e.g., Figs. 7, 8c, 8d). Xenolithic material often lines sutures between sub-domains, supporting this hypothesis. The lack of sutured pumice clasts may reflect a lower likelihood of trapping larger clasts at the conduit wall, because they presumably move with greater momentum and they typically make up a smaller proportion of the erupting mixture (e.g., Carey and Sigurdsson, 1982; Alfano et al., 2016).
4.5. Implications for magmatic degassing
The formation of obsidian pyroclasts by sintering of ash implies that the vesicles within them, and associated dissolved volatiles, reflect not only the degassing trends of bubbly magma but also the composition of gas trapped between particles. That volatile record can then be modified by internal diffusive re-equilibration (Watkins et al., in press) and distorted by break-up and re-sintering of disparate fragments (e.g., Fig. 8a). Variations in H2O and CO2contents thus do not reflect either exclusively closed- or exclu-sively open-system trends (Newman et al., 1988).
Dissolved H2O and CO2 contents in obsidian pyroclasts are con-trolled by their solubilities, which are, in turn, controlled largely by pressure (Blank et al., 1993; Holtz et al., 1995; Liu et al., 2005). Accordingly, local volatile concentrations reflect pressures of for-mation, and suggest that obsidian pyroclasts formed at pressures ranging from ∼3 to 43 MPa (Fig. 4). Additionally, in our model, dissolved H2O and CO2 contents reflect the composition of trapped gas. Volatile contents in each obsidian pyroclast indicate that the trapped gas composition, calculated using the model of Liu et al.(2005), ranges from 65 to 96 mol.% H2O (Fig. 4). Gas composition does not vary systematically with inferred formation pressure; in-stead, its composition is roughly constant at 87 ± 6 mol.% H2O,
262 J.E. Gardner et al. / Earth and Planetary Science Letters 459 (2017) 252–263
despite the wide range in pressure, and regardless of vesicle type. Obsidian pyroclasts with mainly spherical bubbles record a gas of 87 ± 5 mol.% H2O, and those with distorted vesicles record a gas of 85 ± 7 mol.% H2O.
Our model generally supports the idea that the gas trapped in obsidian pyroclasts – and therefore the gas in the conduit – was buffered at a roughly constant composition (Rust et al., 2004). If it were not buffered, then it should have become progressively richer in H2O from continued degassing of the ash (i.e., open-system de-gassing). In that case, gas trapped at shallow levels (low pressures) would be richer in H2O, and the outcome would be that those ob-sidian pyroclasts with mainly distorted vesicles would contain a higher ratio of H2O to CO2 than those with mainly spherical vesi-cles, which is not what is seen (Fig. 9).
5. Conclusions
Obsidian pyroclasts from the ca. 1325–1350 C.E. eruption of North Mono tephra provide a window into processes that occurred in the conduit during the eruption. Detailed analysis of the vesi-cle textures show that a range of vesicle shapes exist, from highly distorted and multi-cuspate to spherical; vesicles also show vari-able degrees of shearing. Based on the inferred thermal–temporal environment in which the clasts formed, we show that vesicles of all types can be generated by relaxation and shearing of a starting population of distorted vesicles. We conclude that highly distorted vesicles represent the remnants of the interstitial spaces between sintered fragments of ash, and that all obsidian pyroclasts ana-lyzed formed by sintering and relaxation of ash fragments. We also find that obsidian pyroclasts formed through repeated fragmen-tation and welding over a wide range of pressures (∼3–43 MPa) – and hence a wide range of depths – within the conduit. We conclude that the conduit environment provides multiple opportu-nities for fragmented magma to stall, weld, and re-fragment, on its way to the surface. By contrast, we are able to eliminate the pos-sibility that the obsidian pyroclasts formed through collapse of a permeable magma foam. The occurrence of similar vesicle textures and xenolithic material in obsidian pyroclasts in other eruptions (Rust and Cashman, 2007) suggests that ash sintering along con-duit walls may be a general mechanism for generating obsidian pyroclasts.
Acknowledgements
The authors gratefully acknowledge B. Andrews, R. Zinke, and M. Manga for help in the field and helpful discussions; F. Wadsworth for discussions on sintering processes and obsidian formation; F. Worrall for assistance with statistical analysis; and T. Clow and J. Mariano for collection and analysis of HRXCT data. The authors also wish to Drs. Alison Rust and Yan Lavallée for their insightful reviews of this manuscript. The work was supported by NSF EAR-1348050 to JEG, NERC NE/N002954/1 to EWL, and NSF EAR-1249404 to JMW. Funding for HRXCT scanning was provided in part by NSF grant EAR-1258878 to R. Ketcham, T. Rowe, and W. Carlson. JEG wishes to thank the Institute for Advanced Studies, Durham University, for their support and hospitality during prepa-ration of this manuscript. Data Access Statement: Underlying data are available in the supplementary information.
Appendix A. Supplementary material
Supplementary material related to this article can be found on-line at http://dx.doi.org/10.1016/j.epsl.2016.11.037.
References
Alfano, F., Bonadonna, C., Watt, S., Connor, C., Volentik, A., Pyle, D.M., 2016. Recon-struction of total grain size distribution of the climactic phase of a long-lasting eruption: the example of the 2008–2013 Chaitén eruption. Bull. Volcanol. 78, 46.
Bagdassarov, N., Dorfman, A., Dingwell, D.B., 2000. Effect of alkalis, phosphorus, and water on the surface tension of haplogranite melt. Am. Mineral. 85, 33–40.
Barnes, J.D., Prather, T.J., Cisneros, M., Befus, K., Gardner, J.E., Larson, T.E., 2014. Stable chlorine isotope behavior during volcanic degassing of H2O and CO2 at Mono Craters, CA. Bull. Volcanol. 76, 805.
Blank, J.G., Stolper, E.M., Carroll, M.R., 1993. Solubilities of carbon dioxide and water in rhyolitic melt at 850 ◦C and 750 bars. Earth Planet. Sci. Lett. 119, 27–36.
Bursik, M., 1993. Subplinian eruption mechanisms inferred from volatile and clast dispersal data. J. Volcanol. Geotherm. Res. 57, 57–70.
Carey, S., Sigurdsson, H., 1982. Influence of particle aggregation on deposition of distal tephra from the May 18, 1980, eruption of Mount St. Helens volcano. J. Geophys. Res. 87, 7061–7072.
Castro, J.M., Bindeman, I.N., Tuffen, H., Schipper, C.I., 2014. Explosive origin of silicic lava: textural and δD–H2O evidence for pyroclastic degassing during rhyolite effusion. Earth Planet. Sci. Lett. 405, 52–61.
Castro, J.M., Cordonnier, B., Tuffen, H., Tobin, M.J., Puskar, L., Martin, M.C., 2012. The role of melt-fracture degassing in defusing explosive rhyolite eruptions at Volcán Chaitén. Earth Planet. Sci. Lett. 333–334, 63–69.
Eichelberger, J.C., Westrich, H.R., 1981. Magmatic volatiles in explosive rhyolitic eruptions. Geophys. Res. Lett. 8, 757–760.
Eichelberger, J.C., Carrigan, C.R., Westrich, H.R., Price, R.H., 1986. Non-explosive sili-cic volcanism. Nature 323, 598–602.
Gardner, J.E., Ketcham, R.A., 2011. Bubble nucleation in rhyolite and dacite melts: temperature dependence of surface tension. Contrib. Mineral. Petrol. 162, 929–943.
Gardner, J.E., Ketcham, R.A., Moore, G., 2013. The dynamics of bubble nucleation in hydrous mafic magmas. J. Volcanol. Geotherm. Res. 267, 68–74.
Ghiorso, M.S., Evans, B.W., 2008. Thermodynamics of rhombohedral oxide solid solutions and a revision of the Fe–Ti two-oxide geothermometer and oxygen-barometer. Am. J. Sci. 308, 957–1039.
Gonnermann, H., Manga, M., 2003. Explosive volcanism may not be an inevitable consequence of magma fragmentation. Nature 426, 432–435.
Gonnermann, H.M., Manga, M., 2005. Nonequilibrium magma degassing: results from modeling of the ca. 1340 A.D. eruption of Mono Craters, California. Earth Planet. Sci. Lett. 238, 1–16.
Gottsmann, J., Giordano, D., Dingwell, D.B., 2002. Predicting shear viscosity dur-ing volcanic processes at the glass transition: a calorimetric calibration. Earth Planet. Sci. Lett. 198, 417–427.
Hess, K.-U., Dingwell, D.B., 1996. Viscosities of hydrous leucogranitic melts: a non-Arrhenian model. Am. Mineral. 81, 1297–1300.
Holtz, F., Behrens, H., Dingwell, D.B., Johannes, W., 1995. H2O solubility in haplo-granitic melts: compositional, pressure, and temperature dependence. Am. Min-eral. 80, 94–108.
Jaupart, C., Allegre, C.J., 1991. Gas content, eruption rate and instabilities of eruption regime in silicic volcanoes. Earth Planet. Sci. Lett. 102, 413–429.
Kelleher, P.C., Cameron, K.L., 1990. The geochemistry of the Mono Craters–Mono Lake Islands volcanic complex, Eastern California. J. Geophys. Res. 95, 17643–17659.
Kolzenburg, S., Heap, M.J., Lavallée, Y., Russell, J.K., Meredith, P.G., Dingwell, D.B., 2012. Strength and permeability recovery of tuffisite-bearing andesite. Solid Earth 3, 191–198.
Liu, Y., Zhang, Y., Behrens, H., 2005. Solubility of H2O in rhyolitic melts at low pressure and a new empirical model for mixed H2O–CO2 solubility in rhyolitic melts. J. Volcanol. Geotherm. Res. 143, 219–235.
Llewellin, E.W., Manga, M., 2005. Bubble suspension rheology and implications for conduit flow. J. Volcanol. Geotherm. Res. 143, 205–217.
Martel, C., Iacono-Marziano, G., 2015. Timescales of bubble coalescence, outgassing, and foam collapse in decompressed rhyolitic melts. Earth Planet. Sci. Lett. 412, 173–185.
McIntosh, I.M., Llewellin, E.W., Humphreys, M.C.S., Nichols, A.R.L., Burgisser, A., Schipper, C.I., Larsen, J.F., 2014. Distribution of dissolved water in magmatic glass records growth and resorption of bubbles. Earth Planet. Sci. Lett. 401, 1–11.
Newman, S., Epstein, S., Stolper, E., 1988. Water, carbon dioxide and hydrogen iso-topes in glasses from the ca. 1340 A.D. eruption of the Mono Craters, California: constraints on degassing phenomena and initial volatile content. J. Volcanol. Geotherm. Res. 35, 75–96.
Ni, H., Zhang, Y., 2008. H2O diffusion models in rhyolitic melt with new high pres-sure data. Chem. Geol. 250, 68–78.
Nogauchi, S., Toramaru, A., Nakada, S., 2008. Groundmass crystallization in dacite dykes taken in Unzen Scientific Drilling Project (USDP-4). J. Volcanol. Geotherm. Res. 175, 71–81.
Rahaman, M.N., De Jonghe, L.C., 1990. Sintering of spherical glass powder under a uniaxial stress. J. Am. Ceram. Soc. 73, 707–712.
Rahaman, M.N., Jonghe, L.C., Brook, R.J., 1986. Effect of shear stress on sintering. J. Am. Ceram. Soc. 69, 53–58.
J.E. Gardner et al. / Earth and Planetary Science Letters 459 (2017) 252–263 263
Rust, A.C., Manga, M., 2002. Bubble shapes and orientations in low Re simple shear flow. J. Colloid Interface Sci. 249, 476–480.
Rust, A.C., Cashman, K.V., 2007. Multiple origins of obsidian pyroclasts and impli-cations for changes in the dynamics of the 1300 B.P. eruption of Newberry Volcano, USA. Bull. Volcanol. 69, 825–845.
Rust, A.C., Cashman, K.V., Wallace, P.J., 2004. Magma degassing buffered by vapor flow through brecciated conduit margins. Geology 32, 349–352.
Saubin, E., Tuffen, H., Gurioli, L., Owen, J., Castro, J.M., Berlo, K., McGowan, E., Schip-per, C.I., Wehbe, K., 2016. Conduit Dynamics in transitional rhyolitic activity recorded by tuffisite vein textures from the 2008–2009 Chaitén Eruption. Front. Earth Sci. 4, 59. http://dx.doi.org/10.3389/feart.2016.00059.
Sieh, K., Bursik, M., 1986. Most recent eruption of the Mono Craters, eastern central California. J. Geophys. Res. 91, 12539–12571.
Stasiuk, M.V., Barclay, J., Carroll, M.R., Jaupart, C., Ratté, J.C., Sparks, R.S.J., 1996. De-gassing during magma ascent in the Mule Creek vent (USA). Bull. Volcanol. 58, 117–130.
Taylor, B.E., Eichelberger, J.C., Westrich, H.R., 1983. Hydrogen isotopic evidence of rhyolitic magma degassing during shallow intrusion and eruption. Nature 306, 541–545.
Taylor, G.I., 1934. The formation of emulsions in definable fields of flow. Proc. R. Soc. Lond. Ser. A 146, 501–523.
Tuffen, H., Dingwell, D.R., Pinkerton, H., 2003. Repeated fracture and healing of sili-cic magma generate flow banding and earthquakes? Geology 31, 1089–1092.
Wadsworth, F.B., Vasseur, J., von Aulock, F.W., Hess, K.U., Scheu, B., Lavallée, Y., Ding-well, D.B., 2014. Nonisothermal viscous sintering of volcanic ash. J. Geophys. Res. 119, 8792–8804.
Wadsworth, F.B., Vasseur, J., Llewellin, E.W., Schauroth, J., Dobson, K.J., Scheu, B., Dingwell, D.B., 2016. Sintering of viscous droplets under surface tension. Proc. R. Soc. A 472, 20150780.
Walker, D., Mullins Jr., O., 1981. Surface tension of natural silicate melts from 1200◦–1500 ◦C and implications for melt structure. Contrib. Mineral. Petrol. 76, 455–462.
Watkins, J.M., Manga, M., DePaolo, D.J., 2012. Bubble geobarometry: a record of pressure changes, degassing, and regassing at Mono Craters, California. Geol-ogy 40, 699–702.
Watkins, J.M., Gardner, J.E., Befus, K.S., in press. Non-equilibrium degassing, re-gassing, and vapor fluxing in magmatic feeder systems. Geology.
Westrich, H.R., Eichelberger, J.C., 1994. Gas transport and bubble collapse in rhyolitic magma: an experimental approach. Bull. Volcanol. 56, 447–458.