Embed Size (px)
Citation preview

EARTH RESOURCES REGULATION
2014 – 2015 STATISTICAL REPORT

Earth Resources Regulation 2014 – 2015 Statistical Report 2 of 24
TABLE OF CONTENTS
Executive Summary ................................................................................................................................................. 3
Introduction ............................................................................................................................................................ 4
Petroleum, Geothermal and Pipelines .................................................................................................................... 5
Petroleum ........................................................................................................................................................... 5
Petroleum Tenements .................................................................................................................................... 5
Petroleum Exploration and Development ...................................................................................................... 7
Geothermal Energy ............................................................................................................................................. 8
Geothermal Energy Tenements ...................................................................................................................... 8
Geothermal Energy Exploration ...................................................................................................................... 8
Pipelines .............................................................................................................................................................. 9
Minerals ................................................................................................................................................................ 10
Mineral Tenements ........................................................................................................................................... 10
Mineral Exploration and Mining Expenditure ................................................................................................... 13
Mineral Production ........................................................................................................................................... 15
Extractive industry ................................................................................................................................................ 18
Revenue and Bonds .............................................................................................................................................. 20
Revenue ............................................................................................................................................................ 20
Rehabilitation Bonds ......................................................................................................................................... 21
Monitoring, Compliance and Enforcement........................................................................................................... 23

Earth Resources Regulation 2014 – 2015 Statistical Report 3 of 24
EXECUTIVE SUMMARY
In the 2014/15 financial year, activity and investment in the earth resources industries continued consistent with the trend of previous financial years. The petroleum and geothermal sector showed a decrease in activity, and mineral exploration expenditure increased by 5.9% in 2014/15. Brown coal production remained relatively stable, showing a slight increase in production.
In the petroleum sector, production remained limited to production and injection at the Iona gas storage facility and carbon dioxide production at Boggy Creek, both of which are located in the onshore Otway Basin area. A hydrocarbon discovery was reported within the area contained within Offshore Petroleum Production Licence VIC/L1 (V).
Investment in geothermal energy resource exploration totalled $621,087. No wells were drilled during the financial year due to the continuing moratorium on fracking and onshore natural gas exploration. There was no geothermal energy production.
The number of licence applications received by ERR fell in the 2014/15 financial year. The number of licences granted and renewed fell in the 2014/15 financial year. The total number of active licences at 30 June 2015 fell by 5.5% from 494 to 467 as compared to 30 June 2014.
The minerals sector continued to reflect the trend of the past 5 years that shows that there has been a fluctuating demand for minerals. Production of brown coal showed a marginal increase in production. Gold production volume decreased by almost 12% from 225,168 ounces to 198,387 ounces. Gold production value also fell as a result from $303.4 million to $286.9 million, a 5.4% reduction in production value.
Mineral exploration expenditure rose with a reduction in mining expenditure. Mining expenditure rose in relation to brown coal yet declined in relation to gold and heavy mineral sands. Exploration expenditure increased in relation to all mineral resources.
Value sales of extractive industry products increased by $75.35 million in 2014/15, an increase of 11.1%. Volume sales increased from 40.3 million tonnes to 50.0 million tonnes, an increase of 24.1%.
In 2014/15, state revenue (rent, royalty and administrative charges) derived from the earth resources sector totalled $51.8 million, an increase of $1.7 million or 3.3%. The amounts collected in relation to rent and fees & charges fell while amounts collected in relation to royalty and mine stability levy increased.

Earth Resources Regulation 2014 – 2015 Statistical Report 4 of 24
INTRODUCTION
The Statistical Report is a compilation of data as reported by Victoria’s earth resources industry. The report includes data on
production, exploration, expenditure, licensing, revenues and regulatory actions.
Victoria’s earth resource industry production includes:
gas and carbon dioxide – from onshore;
brown coal – used almost exclusively for power generation;
gold;
antimony;
industrial minerals – including gypsum, feldspar, rutile, zircon, ilmenite and kaolin; and
rock, sand and clay – used mainly for building and road construction.
Earth Resources Regulation Branch in the Department of Economic Development, Jobs, Transport and Resources (DEDJTR) - is
responsible for the regulation of the minerals, extractives, petroleum, pipelines, geothermal and carbon storage industries in
Victoria and offshore (Victorian) waters. The Branch provides a consistent and transparent tenement management regime,
together with monitoring and enforcement that ensure these industries comply with their statutory obligations and meet
community expectations.
Earth Resources Regulation Branch administers the following Acts:
Mineral Resources (Sustainable Development) Act 1990 (MRSDA) (mineral exploration, mining and quarrying);
Offshore Petroleum and Greenhouse Gas Storage Act 2010 (OPGGSA) (petroleum exploration and development,
greenhouse gas storage and pipelines in the Victorian offshore waters);
Petroleum Act 1998 (petroleum exploration and development onshore);
Pipelines Act 2005 (licensing and regulation of high pressure pipelines onshore);
Geothermal Energy Resources Act 2005 (geothermal energy exploration and development); and
Greenhouse Gas Geological Sequestration Act 2008 (greenhouse gas storage onshore).

Earth Resources Regulation 2014 – 2015 Statistical Report 5 of 24
PETROLEUM, GEOTHERMAL AND PIPELINES
PETROLEUM
Victoria’s petroleum exploration is concentrated in the Otway and Gippsland Basins, with activities undertaken onshore and within Victorian offshore waters. Production activity is limited to the Otway Basin.
Offshore activities concern waters effectively within three nautical miles of the coast, as covered by Victorian legislation. Waters
greater than three nautical miles offshore from the coast are Commonwealth waters and are as such covered by Commonwealth
legislation and therefore not included in this report.
PETROLEUM TENEMENTS
In 2014/15, no offshore petroleum production licence applications were received. One offshore petroleum production licence
received in the last financial year, was granted. Two offshore petroleum exploration permits were granted, these applications
were made in the previous financial year. No offshore petroleum retention leases were granted and no applications were
received.
Table 1.1 Overview of petroleum tenements current as at 30 June 2015
Petroleum Exploration Permits (PEPs)
Petroleum Retention Leases (PRLs)
Petroleum Production Licences (PPLs)
Onshore 11 3 13 Offshore (Vic)
3 1 1
Source: DEDJTR
ONSHORE
No onshore petroleum retention licence applications were received or granted. No onshore petroleum exploration permits were granted with no applications received.
Table 1.2 Overview of onshore petroleum exploration permits (PEPs)
2007/08 2008/09 2009/10 2010/11 2011/12 2012/13 2013/14 2014/15
PEP Application Received
0 0 0 4 1 0 0 0
PEP Granted 1 0 0 1 0 2 2 0
Source: DEDJTR
Table 1.3 Overview of onshore petroleum retention licences (PRLs)
2007/08 2008/09 2009/10 2010/11 2011/12 2012/13 2013/14 2014/15
PRL Application Received
0 0 0 0 0 0 0 0
PRL Granted 1 0 0 0 0 0 0 0 Source: DEDJTR

Earth Resources Regulation 2014 – 2015 Statistical Report 6 of 24
OFFSHORE (STATE WATERS)
Two offshore petroleum exploration permits were granted with no applications received. No applications for offshore petroleum retention licences were received nor were any granted. One offshore petroleum production licence was granted with no applications received.
Table 1.4 Overview of offshore petroleum exploration permits (VIC/P(V)s)
2008/09 2009/10 2010/11 2011/12 2012/13 2013/14 2014/15
VIC/P(V) Application Received
0 0 1 0 0 2 0
VIC/P(V) Granted
0 0 0 1 0 0 2
Source: DEDJTR
Table 1.5 Overview of offshore petroleum retention leases (VIC/RL(V)s)
2008/09 2009/10 2010/11 2011/12 2012/13 2013/14 2014/15
VIC/RL(V) Application Received
1 0 0 0 0 0 0
VIC/RL(V) Granted
1 0 0 0 0 0 0
Source: DEDJTR
Table 1.6 Overview of offshore petroleum production licences (VIC/L(V)s)
2008/09 2009/10 2010/11 2011/12 2012/13 2013/14 2014/15
VIC/L(V) Application Received
0 0 0 0 0 1 0
VIC/L(V) Granted
0 0 0 0 0 0 1
Source: DEDJTR
Earth Resources Regulation 2014 – 2015 Statistical Report 7 of 24
PETROLEUM EXPLORATION AND DEVELOPMENT
No drilling or seismic activities occurred in Victoria. $1,525,134 in expenditure was reported on onshore petroleum exploration
permits and retention leases. The majority of this expenditure was spent on geophysical studies, geophysical logging and
administration.
$2,645,908 in expenditure was reported on offshore tenements. No wells were drilled, nor any seismic surveys undertaken, the
majority of expenditure was represented by geological studies, studies on licensing and permits, ongoing capital appraisal work
and market studies.
DRILLING
In the course of 2014/15, no onshore wells were drilled in Victoria as a result of the moratorium on onshore natural gas and
hydraulic fracturing.
Table 1.7 Number of exploration wells drilled in Victoria
Year Offshore (Vic) Gippsland Offshore (Vic) Otway Onshore Gippsland Onshore Otway Onshore Murray
Total wells
1999/00 0 0 3 2 0 5
2000/01 0 0 2 5 0 7
2001/02 0 0 4 7 1 12
2002/03 0 0 3 4 0 7
2003/04 0 0 1 2 0 3
2004/05 0 1 2 0 0 3
2005/06 0 0 4 4 0 8
2006/07 1 0 4 2 0 7
2007/08 0 0 0 2 0 2
2008/09 0 0 0 1 0 1
2009/10 0 0 1 0 0 1
2010/11 0 0 0 0 0 0
2011/12 0 0 1 1 0 2
2012/13 0 0 2 0 0 2
2013/14 0 0 0 0 0 0
2014/15 0 0 0 0 0 0
Total 1 1 27 30 1 60
Source: DEDJTR
Graph 1.1 Number of exploration wells drilled
Source: DEDJTR
0
2
4
6
8
10
12
14
Tota
l Wel
ls
Offshore (Victoria) Gippsland Offshore (Victoria) Otway Onshore Gippsland Onshore Otway Onshore Murray
Earth Resources Regulation 2014 – 2015 Statistical Report 8 of 24
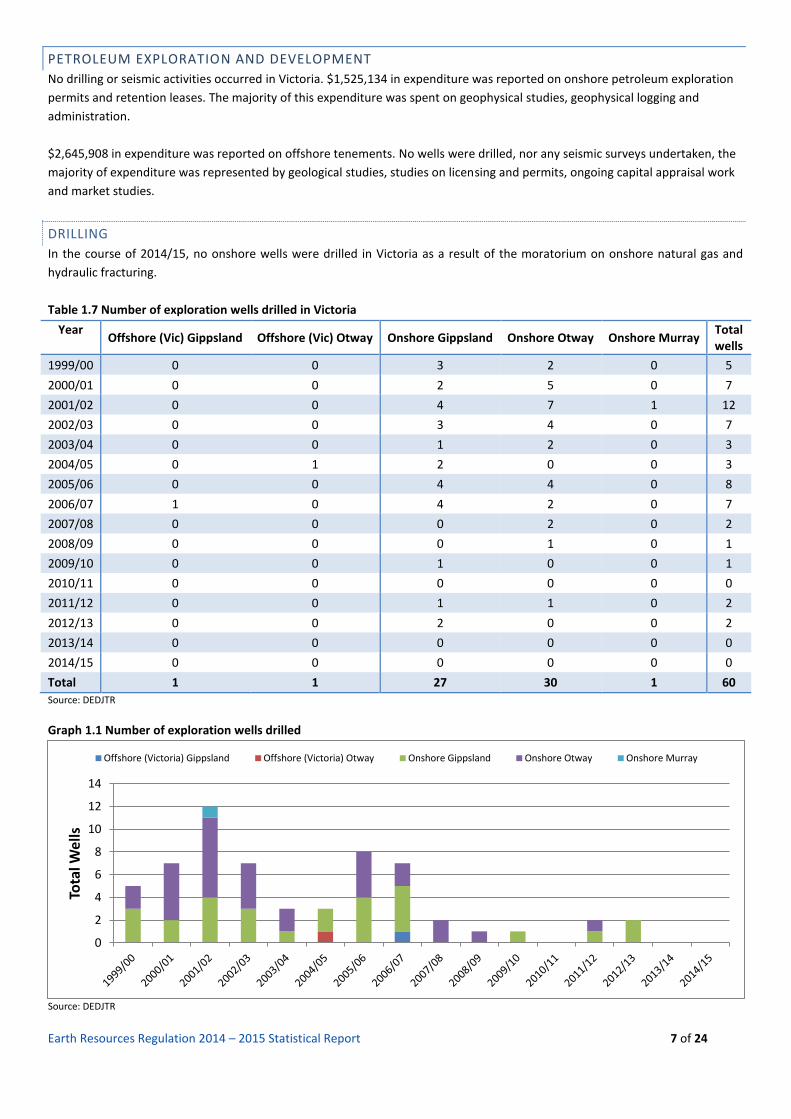
GEOPHYSICAL SURVEYS
No geophysical surveys were conducted in 2014/15.
HYDROCARBON DISCOVERIES
There was one hydrocarbon discovery made by Origin Energy Resources Pty Ltd, in an offshore area on 9 December 2014 within
the area contained in Offshore Petroleum Production Licence VIC/L1 (V).
PRODUCTION
Production is currently limited to carbon dioxide production at Boggy Creek and gas injection and production at the Iona gas storage facility which are both onshore facilities located in the Otway basin.
Table 1.8: Otway onshore production and injection 2014/15
Field Condensate
(bbl*) Gas Production
(MMscf**) CO2 Prod. (tonnes)
Gas Injection (MMscf)
Comments
Iona 669.82 10,290.98 - 11,797.26 Gas Storage
Boggy Creek
Negligible - 35,103.20 - CO2
Production Source: DEDJTR
*bbl = barrels **MMscf = million standard cubic feet
GEOTHERMAL ENERGY
As at 30 June 2015, six geothermal energy exploration permits were current, following the surrender of seven permits in
2013/14. There were no granted geothermal energy retention leases or production licences. Any geothermal energy activities in
Victoria remain limited to exploration.
GEOTHERMAL ENERGY TENEMENTS
No geothermal energy tenements were applied for or granted in 2014/15.
Table 1.9 Overview of geothermal energy tenements
Description 2007/08 2008/09 2009/10 2010/11 2011/12 2012/13 2013/14 2014/15
GEP Application Received 26 0 0 0 0 0 0 0
GEP Granted 11 0 0 0 0 0 0 0 Source: DEDJTR
GEOTHERMAL ENERGY EXPLORATION
There were no exploration activities that involved drilling or geophysical surveys. Most of the reported activities comprised of
geological and geophysical data compilation and analysis, geothermal modelling and administration.

Earth Resources Regulation 2014 – 2015 Statistical Report 9 of 24
PIPELINES
Licences are granted for the construction and operation of high pressure pipelines, primarily to convey hydrocarbons, including
natural gas, crude oil and petroleum products. Pipeline licences are granted onshore under the Pipelines Act 2005 and offshore
in Victorian waters under the Offshore Petroleum and Greenhouse Gas Storage Act 2010. Pipeline licences in offshore Victorian
waters are used to convey onshore hydrocarbons originating from petroleum production facilities in offshore (Commonwealth)
waters to onshore processing facilities.
In 2014/15, three pipeline licences were applied for, and no pipeline licences were granted. There were a total of 18 alterations
to pipeline routes registered, with 11 classified as minor alterations and 7 classified as significant alterations.
Table 1.10 Onshore pipeline licences (PL) applications received and granted
Source: DEDJTR
Table 1.11 Offshore pipeline licences (PL) applications received and granted (state waters)
Source: DEDJTR
Table 1.12 Pipeline licences (PLs) current as at 30 June 2015
Tenement Number of PLs
Onshore 214
Offshore (Vic) 13 Source: DEDJTR
Table 1.13 Onshore pipeline licence alterations of route registered
Type of Alteration of Route Number of registrations
Minor 11
Significant 7
Total 18 Source: DEDJTR
2007/08 2008/09 2009/10 2010/11 2011/12 2012/13 2013/14 2014/15
PL Application Received 0 0 0 1 0 0 2 3
PL Granted 2 1 0 0 1 0 1 0
2007/08 2008/09 2009/10 2010/11 2011/12 2012/13 2013/14 2014/15
PL Application Received 0 1 0 0 0 0 0 0
PL Granted 0 0 0 0 0 0 0 0

Earth Resources Regulation 2014 – 2015 Statistical Report 10 of 24
MINERALS
MINERAL TENEMENTS
The number of exploration and mining licences fell in relation to the previous year due to licence expirations and surrenders as
well as a reduction in the overall number of applications received for new licences. The number of current retention and
prospecting licences increased in comparison to 2013/14.
As in the previous year, the majority of the applications for new licences under the MRSDA were made for exploration licences.
The overall number of applications dropped from 151 to 130, all application types showed a decrease in the number of
applications made in comparison to 2013/14.
Table 2.1 Licences current as at 30 June
Tenement Type 2008 2009 2010 2011 2012 2013 2014 2015
Exploration Licences 326 298 285 302 326 311 271 247
Mining Licences 236 211 216 218 208 212 191 171
Prospecting Licences n/a n/a n/a n/a 1 13 31 41
Retention Licences n/a n/a n/a 0 0 1 1 8
Totals 562 509 501 520 535 537 494 467
Change year-on-year (%) - -9.4 -1.6 3.8 2.9 0.4 -8.0 -5.5
Source: DEDJTR
Graph 2.1 Licences current as at 30 June
Source: DEDJTR
0
50
100
150
200
250
300
350
2006/2007 2007/2008 2008/2009 2009/2010 2010/2011 2011/2012 2012/2013 2013/2014 2014/2015
Nu
mb
er o
f Li
cen
ces
Exploration Licences Mining Licences Prospecting Licences Retention Licences

Earth Resources Regulation 2014 – 2015 Statistical Report 11 of 24
Table 2.2 New licence applications and licence renewals in 2014/15
Received Granted / Renewed Withdrawn Refused
New Exploration Licence Applications 49 37 14 0
Renewal Exploration Licence Applications 35 19 3 0
Sub Total Exploration Licence Applications 84 56 17 0
New Mining Licence Applications 3 3 1 0
Renewal Mining Licence Applications 20 14 0 0
Sub Total Mining Licence Applications 23 17 1 0
New Prospecting Licence Applications 14 13 1 0
New Retention Licence Applications 9 7 1 0
Total 130 93 20 0
Source: DEDJTR
Table 2.3 Licences granted and renewed Year 2007/08 2008/09 2009/10 2010/11 2011/12 2012/13 2013/14 2014/15
Exploration Licences Granted 91 57 61 73 62 41 37 37
Exploration Licences Renewed 58 51 55 60 74 52 57 19
Subtotal Exploration Licences Granted and Renewed
149 108 116 133 136 93 94 56
Mining Licences Granted 11 14 15 20 12 11 9 3
Mining Licences Renewed 21 41 30 23 21 14 28 14
Sub Total Mining Licences Granted and Renewed 32 55 45 43 33 25 37 17
Prospecting Licences Granted 0 0 0 0 1 12 18 13
Retention Licences Granted 0 0 0 0 0 0 1 7
Total Licences 181 163 161 176 170 130 150 93
Source: DEDJTR
Graph 2.3 a) Exploration licences granted and renewed
Source: DEDJTR
0
10
20
30
40
50
60
70
80
90
100
2006/07 2007/08 2008/09 2009/10 2010/11 2011/12 2012/13 2013/14 2014/15
Nu
mb
er
of
Lice
nce
s
Exploration Licences Granted Exploration Licences Renewed

Earth Resources Regulation 2014 – 2015 Statistical Report 12 of 24
Graph 2.3 b) Mining licences granted and renewed
Source: DEDJTR
Graph 2.3 c) Prospecting* and retention licences granted
Source: DEDJTR * Prospecting licence cannot be renewed.
The total area of Victoria covered by exploration licences (current and in application) on 30 June 2015 was 70,474km2, which
marked a reduction in comparison to the 2014 figure. This correlates to a downward trend as observed within the industry and
points to a reduction in the scale of the mining industry.
Table 2.4 Total area covered by exploration licences (current and in application as at 30 June)
2008 2009 2010 2011 2012 2013 2014 2015
Total area (km2) 98,086 95,240 86,365 75,753 83,900 77,366 75,018 70,474
Source: DEDJTR
Graph 2.4 Total area covered by exploration licences
Source: DEDJTR
0
10
20
30
40
50
60
2006/07 2007/08 2008/09 2009/10 2010/11 2011/12 2012/13 2013/14 2014/15
Nu
mb
er
of
Lice
nce
s Mining Licences Granted Mining Licences Renewed
0
5
10
15
20
2011/12 2012/13 2013/14 2014/15
Nu
mb
er
of
Lice
nce
s
Prospecting Licences Granted Retention Licences Granted
0
20,000
40,000
60,000
80,000
100,000
120,000
2007 2008 2009 2010 2011 2012 2013 2014 2015
Total area (km2)

Earth Resources Regulation 2014 – 2015 Statistical Report 13 of 24
MINERAL EXPLORATION AND MINING EXPENDITURE
Mineral exploration expenditure is an indicator of activity within the mineral industry. Australian Bureau of Statistics (ABS) data
shows a decrease of 29.75% in Victorian exploration expenditure in 2014/15 as compared to 2013/14. This is a sharp decline
and reflects the trend in overall exploration expenditure Australia wide over the same period, from $2,108.8 million to $1,575
million, a decrease of 25.28%. Mineral Resources (Sustainable Development) Act 1990 (MRSDA) data on mining exploration
shows an increase in the amount spent on exploration from $30.5 million to $32.3 million, a modest increase of 5.9%. MRSDA
data shows that expenditure on mining has fallen 4.3% from $650.3 million to $622.3 million.
Table 2.5 Expenditure on mineral exploration and mining development ($A million)
2007/08 2008/09 2009/10 2010/11 2011/12 2012/13 2013/14 2014/15
Mineral Exploration (ABS)
1
93.7 62.2 84.8 57.4 58.5 38.6 32.6 22.9
MRSDA Exploration
2
76.7 69.9 58.4 31.7 37.8 39.7 30.5 32.3
MRSDA Mining3 576.6 923.3 742 719.2 813.8 701.2 650.3 622.3
Source: Figures collated from activity reports forwarded to DEDJTR required by the MRSDA, and ABS, Actual and Expected Private Mineral Exploration
(Catalogue No. 8412.0) 1
The Australian Bureau of Statistics (ABS) reports quarterly on private mineral exploration expenditure for all Australian States and the Northern Territory (NT).
Victorian mineral exploration and mining expenditure is also reported in accordance with the requirement of the MRSDA. The ABS exploration expenditure
statistics can vary significantly from expenditure reported under the MRSDA. The difference between these two exploration expenditure data sets is mainly due to
the difference in methodologies for data collection, and the inclusion of the exploration expenditure on mining licences in the MRSDA figure. The ABS statistics are
a valid basis for comparison of Victorian expenditure with that of other States/NT. However, the MRSDA figures provide greater detail. 2 Change of metric - expenditure on Exploration and Retention Licences with an Expenditure Reporting Period that ends within the Financial Year 3The MRSDA mining expenditure figure covers all expenditure on mining and prospecting licences (including capital and operating expenses), less any specified
exploration expenditure on mining and prospecting licences.

Earth Resources Regulation 2014 – 2015 Statistical Report 14 of 24
By sector, exploration in gold mining accounted for almost one quarter (23.3%) of all exploration expenditure. Exploration in
brown coal accounted only for 1.2% of total exploration expenditure, reflective of wider industry and social trends.
Graph 2.5 Expenditure on mineral exploration and mining development
Source: DEDJTR
Table 3.6 Expenditure on mineral exploration and mining development by sector*
Sector Exploration ($A million)
As % of total Mining
($A million) As % of total
Brown Coal 0.4 1.2% 302.4 49%
Gold 7.5 23.3% 191.5 31%
Heavy Mineral Sands 3.1 9.6% 75.4 12%
Other** 21.3 65.9% 53.0 9%
Total 32.3 100.0% 622.3 100%
Source: DEDJTR *Notes: Expenditures are allocated to commodity according to the primary nominated mineral commodity on the licence. Brown coal includes all coal types. ** “Other” includes cases where there is more than one primary mineral
Graph 2.6 Mineral exploration and mining development expenditure by sector (MRSDA) 2014/15
Source: DEDJTR
0
100
200
300
400
500
600
700
800
900
1000
2007/08 2008/09 2009/10 2010/11 2011/12 2012/13 2013/14 2014/15
$A
mill
ion
Mineral Exploration (ABS)1 MRSDA Exploration2 MRSDA Mining3
0.0
50.0
100.0
150.0
200.0
250.0
300.0
350.0
Brown Coal Gold Heavy Mineral Sands Other
$A
m
Exploration ($A million) Mining ($A million)

Earth Resources Regulation 2014 – 2015 Statistical Report 15 of 24
MINERAL PRODUCTION
Victorian mineral production is comprised mainly of brown coal, gold, mineral sands and antimony. Brown coal production continues to be dominated by electricity generation companies in the Latrobe Valley, Hazelwood Power Corporation, AGL and Energy Australia. The Maddingley Brown Coal company produces a small amount of coal in Bacchus Marsh for fuel and soil conditioning. Brown coal production increased by 2.95 million tonnes in 2014/15, a 5.1% increase as compared to 2013/14.
Gold production dropped from 225,168 ounces to 198,387 ounces, a reduction of 11.9%. Gold production values dropped from $303.4 million to $286.9 million, a 5.4% reduction in gold production value.

Earth Resources Regulation 2014 – 2015 Statistical Report 16 of 24
Table 2.7 Mineral production over time*
Year Brown
Coal Gold Antimony
Copper Concentrate
Zinc Concentrate
Zircon Rutile Ilmenite Feldspar Gypsum Kaolin and fine
clay
1993/94 49,683 125,960 - 16,287 1,012 - - - - 176,800 105,400
1994/95 49,922 138,876 - 13,163 5,947 - - - - 193,100 79,500
1995/96 54,281 155,550 - 1,338 6,384 - - - - 198,667 55,065
1996/97 60,795 151,229 - - - - - - - 501,495 114,778
1997/98 65,274 160,122 - - - - - - 25,703 479,820 166,100
1998/99 66,648 159,088 - - - - - - 45,293 404,917 180,634
1999/00 67,363 154,043 - - - - - - 46,162 462,806 201,436
2000/01 64,958 122,632 - - - 1,307 5,921 - 53,148 437,694 203,753
2001/02 66,661 112,283 - - - 3,702 16,805 28,123 56,757 600,931 202,370
2002/03 66,809 107,544 - - - 10,841 28,329 50,984 68,198 420,293 248,692
2003/04 66,343 104,188 - - - 4,645 11,239 19,978 69,552 439,906 251,392
2004/05 67,152 123,308 - - - - - - 75,683 346,522 189,237
2005/06 67,737 203,352 - - - - - - 69,876 416,294 149,218
2006/07 65,613 224,927 1,033 - - 48,636 22,263 - 76,187 235,266 170,727
2007/08 66,033 181,100 1,468 - - 140,853 72,166 13,503 75,384 395,717 151,669
2008/09 68,252 248,918 2,133 - - 102,123 80,317 - 73,893 313,145 90,553
2009/10 68,750 241,965 2,357 - - 90,671 117,314 27,904 66,507 315,509 92,862
2010/11 66,733 186,146 4,859 - - 188,663 209,919 82,075 74,806 289,528 31,683
2011/12 69,124 211,201 5,007 - - 187,538 261,744 42,814 95,310 630,258 80,202
2012/13 59,854 225,776 4,558 - - 86,243 140,842 67,067 61,578 499,681 204,164
2013/14 58,001 225,168 5,336 - - 128,064 243,355 563,371 44,254 454,526 167,333
2014/15 60,957 198,387 3.684 - - 77,162 85,983 383,369 40,232 335,374 152,047
Change
year-on-year (%) 5.1% -11.9% -31.0% - - -39.7% -64.7% -32.0% -9.1% -26.2% -9.1%
Source: DEDJTR, statutory returns under the MRSDA. *Gold reported in ounces, brown coal in thousand tonnes, gypsum in cubic meters, and the remainder in tonnes.
Table 2.8 Mineral production sales values (A$ million)
Mineral 2013/14 2014/15 Change year-on-year (%)
Brown Coal* N/A N/A N/A Gold 303.4 286.9 -5.4% Antimony 12.5 37.8 202.2% Heavy Mineral Sands (Zircon, Rutile, Ilmenite) 316.5 185.1 -41.5% Industrial Minerals (Feldspar, Gypsum, Kaolin & fine clay) 14.1 10.2 -27.4% Others 0.2 0.1 -30.5%
Total (excl. brown coal) 646.7 520.1 -19.6% Source: DEDJTR, statutory returns under the MRSDA.
*No unit value is assigned to brown coal for the purposes of determining its production value. Brown coal is almost entirely used for electricity production and is largely an internal
transfer within mining/generation entities. As such, there is no available market price for brown coal.

Earth Resources Regulation 2014 – 2015 Statistical Report 17 of 24
Graph 2.8 Gold production (ounces) by year
Source: DEDJTR
Table 3.9 Brown coal production (thousand tonnes) by year
Year Maddingley Brown Coal Co.
Bacchus Marsh Alcoa
Anglesea SECV*
Loy Yang
Yallourn Hazelwood Annual Total
1993/94 31 1,093 48,559 - - - 49,683
1994/95 43 1,162 48,717 - - - 49,922
1995/96 40 836 - 25,000 17,460 10,945 54,281
1996/97 39 1,005 - 27,808 17,083 14,860 60,795
1997/98 28 1,030 - 29,766 17,924 16,525 65,274
1998/99 22 1,091 - 30,510 17,350 17,675 66,648
1999/00 4 926 - 30,865 16,098 19,470 67,363
2000/01 11 963 - 28,686 16,234 19,063 64,958
2001/02 10 1,069 - 30,949 15,650 18,982 66,661
2002/03 15 1,051 - 29,017 17,515 19,210 66,809
2003/04 18 1,107 - 29,577 16,585 19,056 66,343
2004/05 19 943 - 29,826 17,663 18,701 67,152
2005/06 22 1,101 - 30,937 16,933 18,743 67,737
2006/07 15 1,049 - 29,146 16,090 19,313 65,613
2007/08 16 1,066 - 30,745 15,467 18,739 66,033
2008/09 14 966 - 29,007 18,229 20,036 68,252
2009/10 11 1,077 - 30,446 17,685 19,531 68,750
2010/11 16 1,070 - 29,895 17,705 18,047 66,733
2011/12 21 1,022 - 30,237 17,404 20,440 69,124
2012/13 18 913 - 28,921 12,885 17,118 59,854
2013/14 19 1,034 - 26,967 13,494 16,487 58,001
2014/15 19 - - 27,624 17,171 16,144 60,957
Source: DEDJTR, statutory returns under the MRSDA. * State Electricity Commission of Victoria, disaggregated in 1994.
0
50,000
100,000
150,000
200,000
250,000
300,000
Go
ld (
oz)

Earth Resources Regulation 2014 – 2015 Statistical Report 18 of 24
EXTRACTIVE INDUSTRY
Extractive industries produce the raw material necessary for building and construction, which is vital to the State’s development,
as well as contributing to the agricultural industry via soil additives. The industry operates quarries that produce a range of
“stone” products, predominantly being hard rock, clay, sand and gravel.
As at 30 June 2015, 887 quarries were operating under the MRSDA in Victoria. The total number of quarries has remained stable over the last decade. Table 3.1 Status of extractive industry work authorities* as at 30 June 2015
Tenement Application** Current
Work Authority 49 887
Source: DEDJTR *A Work Authority is granted under the MRSDA. **Application stage is when a Work Authority application is lodged with all requirements to obtain an approved Work Plan.
Graph 3.1 Extractive industry quarries 2006/07 to 2014/15
Source: DEDJTR
Sales of quarry products fluctuate based on the demand for products from the domestic building and construction sector. The
increase in demand is explained by the increase in active quarries and the initiation of major infrastructure projects.
A total of 302 quarries reported production in 2014/15 with the total sales volume being 50.0 million tonnes. In 2013/14 the
number of producing quarries was 485 with a total sales volume of 40.3 million tonnes.
Volume sales of extractive industry products in 2014/15 increased by around 10 million tonnes or 23.9% in comparison to
2013/14. Sales value increased by $75.35 million or 11.1% as compared to 2013/14.
0
10
20
30
40
50
60
70
80
90
100
2006/07 2007/08 2008/09 2009/10 2010/11 2011/12 2012/13 2013/14 2014/15
Number of Quarries (x10) Sales (million tonnes)
Earth Resources Regulation 2014 – 2015 Statistical Report 19 of 24
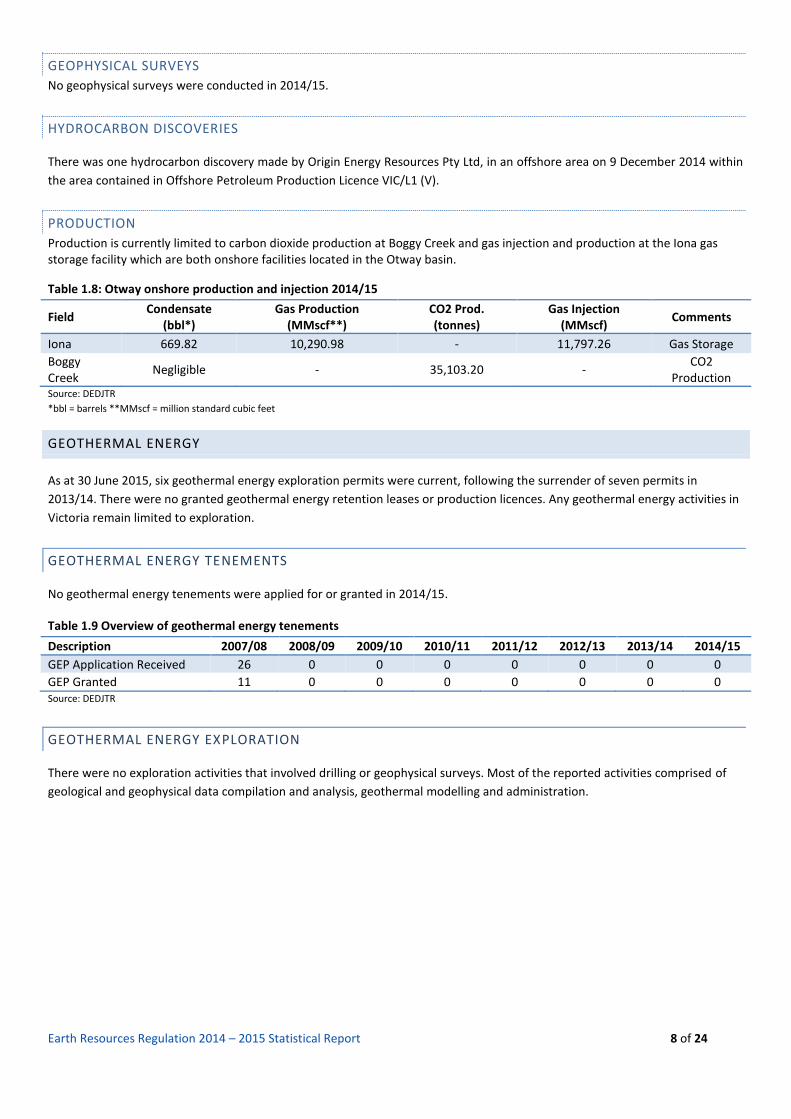
Table 3.2 Victorian extractive industries sales by rock type 2014/15
Product Group Product Type Sales Volume
(million tonnes) Sales Value
($Am)
Hard Rock BASALT 18.4 304.0
Hard Rock GNEISS 0.0 0.0
Hard Rock GRANITE 3.2 58.9
Hard Rock HORNFELS 5.4 84.5
Hard Rock IGNIMBRITE 0.0 0.0
Hard Rock MUDSTONE 0.0 0.0
Hard Rock QUARTZITE 0.2 1.2
Hard Rock RHYODACITE 1.6 33.4
Hard Rock SCHIST 0.0 3.9
Hard Rock SEDIMENTARY 2.7 25.7
Hard Rock SLATE 0.0 0.8
Hard Rock TRACHYTE 0.0 0.4
Hard Rock Total
31.5 512.8
Soft Rock CLAY & CLAY SHALE 1.2 3.4
Soft Rock LIMESTONE 2.2 30.9
Soft Rock SAND & GRAVEL 13.5 187.4
Soft Rock SANDSTONE 0.0 0.0
Soft Rock SCORIA 1.1 13.8
Soft Rock SOIL 0.1 0.3
Soft Rock TUFF 0.4 3.2
Soft Rock Total 18.5 239.0
Other/Aggregates 0.0 0.1
GRAND TOTAL 50.0 751.9 Source: DEDJTR, statutory returns under the MRSDA.

Earth Resources Regulation 2014 – 2015 Statistical Report 20 of 24
REVENUE AND BONDS
REVENUE
In 2014/15, a total of $51.8 million was collected from industry in royalties, rentals, levies, fees and charges under the Acts
administered by the department. This compares with $50.1 million collected in 2013/14.
Royalties rose from $45.1 million in 2013/14 to $47.3 million, as a result of increased production from the mining and extractive
industry sectors. Petroleum royalties remained stable, totalling $0.1 million.
Table 4.1 Mineral, extractive and petroleum revenue 2014/15
Revenue Stream Revenue ($A million)
Fees and charges 0.6 Rent 2.5 Royalty 47.3 Mine Stability Levy 1.4 Total 51.8 Source: DEDJTR
Graph 4.1 Mineral, extractive and petroleum revenue 2014/15
Source: DEDJTR
Table 5.2 Minerals, extractive and petroleum royalties 2014/15
Sector Royalties ($A million)
Mining 42.2 Extractive 5.0 Petroleum (Onshore)* 0.1 Total 47.3 Source: DEDJTR
Fees and charges, 1%
Rent, 5%
Royalty, 91%
Mine Stability Levy, 3%

Earth Resources Regulation 2014 – 2015 Statistical Report 21 of 24
Graph 4.2 Mineral, extractive and petroleum royalties 2014/15
Source: DEDJTR
REHABILITATION BONDS
The sum of rehabilitation bonds held by the Department in 2014/15 was $241 million. A reduction in the value of exploration
licence, mining licence and extractive industry work authority bonds between 2013/14 and 2014/15 reflects the reduction in the
number of such licences held. In addition, this reflected the return of bonds following the rehabilitation of sites without licences
necessarily being cancelled, expired or surrendered. In addition, recalculation of rehabilitation liability on sites has resulted in a
reduction of the total rehabilitation liability attached to sites in Victoria.
Table 4.3 Value of rehabilitation bonds by authority type ($A million)
Year Exploration
Licence Mining Licence Prospecting Licence Retention Licence
Extractive Industry Work Authority
Total
2006/07 2.8 73.7 N/A N/A 57.5 134.0 2007/08 3.1 75.6 N/A N/A 58.8 137.5 2008/09 2.0 97.1 N/A N/A 64.9 164.0 2009/10 2.3 103.7 N/A N/A 72.3 178.3 2010/11 1.9 122.1 N/A N/A 65.0 189.0 2011/12 2.5 156.9 0 N/A 80.9 240.3 2012/13 2.4 158.3 0.025 N/A 81.0 241.7 2013/14 2.1 183.4 0.091 0.010 90.9 276.5 2014/15 1.9 153.0 0.138 0.050 85.8 241.0 Source: DEDJTR
Mining 89%
Extractive 11%
Petroleum (Onshore) 0%

Earth Resources Regulation 2014 – 2015 Statistical Report 22 of 24
Graph 4.3 Value of rehabilitation bonds by authority type ($A million) 2006/7 to 2014/15
Source: DEDJTR
Table 4.4 Rehabilitation bond reviews over time
Year Number of Bonds Reviewed Result of Review -
Increase Result of Review – No Change Result of Review - Decrease
2006/07 258 65 190 3 2007/08 402 58 335 9 2008/09 382 49 323 10 2009/10 413 55 344 14 2010/11 185 15 166 4 2011/12 216 19 193 4 2012/13 258 37 220 1 2013/14 214 66 139 9 2014/15 106 54 10 42 Source: DEDJTR
0
20
40
60
80
100
120
140
160
180
200
2006/07 2007/08 2008/09 2009/10 2010/11 2011/12 2012/13 2013/14 2014/15
Exploration Licence
Mining Licence
Prospecting Licence
Retention Licence
Extractive IndustryWork Authority
Earth Resources Regulation 2014 – 2015 Statistical Report 23 of 24
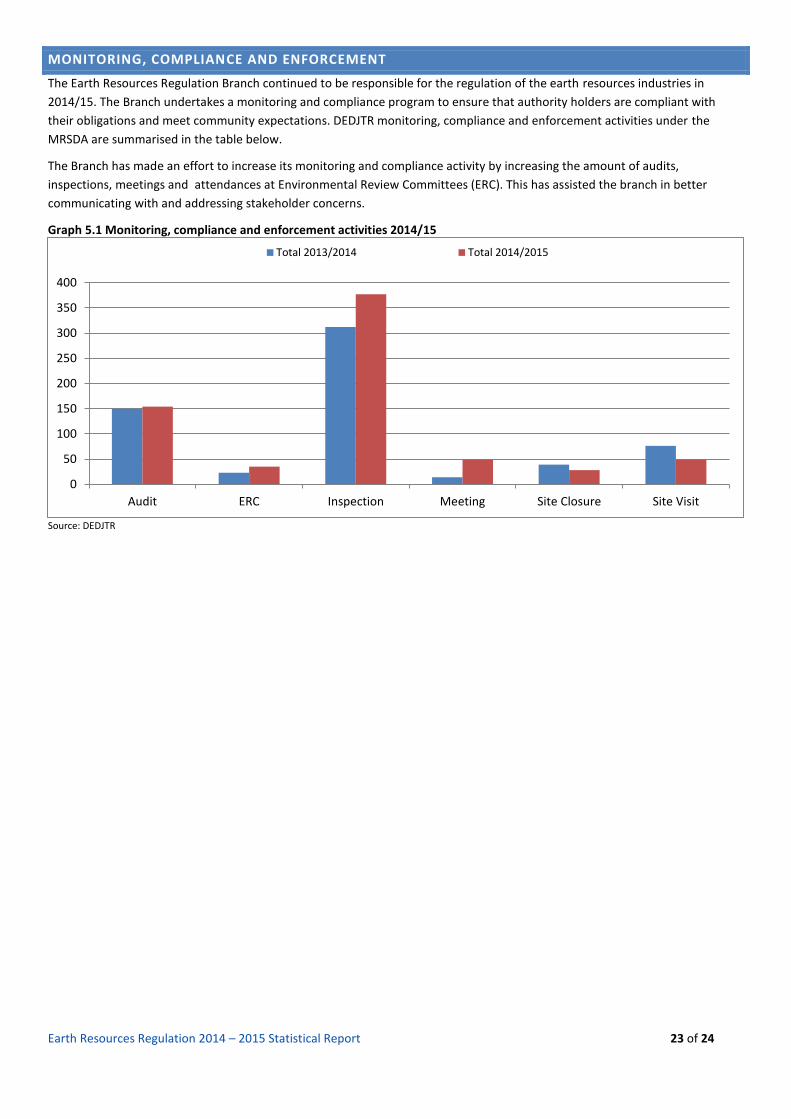
MONITORING, COMPLIANCE AND ENFORCEMENT
The Earth Resources Regulation Branch continued to be responsible for the regulation of the earth resources industries in
2014/15. The Branch undertakes a monitoring and compliance program to ensure that authority holders are compliant with
their obligations and meet community expectations. DEDJTR monitoring, compliance and enforcement activities under the
MRSDA are summarised in the table below.
The Branch has made an effort to increase its monitoring and compliance activity by increasing the amount of audits,
inspections, meetings and attendances at Environmental Review Committees (ERC). This has assisted the branch in better
communicating with and addressing stakeholder concerns.
Graph 5.1 Monitoring, compliance and enforcement activities 2014/15
Source: DEDJTR
0
50
100
150
200
250
300
350
400
Audit ERC Inspection Meeting Site Closure Site Visit
Total 2013/2014 Total 2014/2015

Earth Resources Regulation 2014 – 2015 Statistical Report 24 of 24
Authorised by the Minister for Industry and Employment and Minister for Resources, the Hon. Wade Noonan MP
Department of Economic Development, Jobs, Transport and Resources
1 Spring Street Melbourne Victoria 3000
Telephone (03) 9651 9999
© Copyright State of Victoria, Department of Economic Development, Jobs, Transport and Resources 2016
Except for any logos, emblems, trademarks, artwork and photography, this document is made available under the terms of the
Creative Commons Attribution 3.0 Australia license.
This document is also available in an accessible format at http://earthresources.efirst.com.au/categories.asp?cID=46