Embed Size (px)
Citation preview

2020ANNUAL SUMMARYNASA EARTH SCIENCE APPLIED SCIENCES PROGRAM
CAPACITY BUILDING PROGRAM
EARTH SCIENCEAPPLIED SCIENCES

CAPACITY BUILDING PROGRAM 2020 ANNUAL REPORT2
We welcome you to the Capacity Building Program’s 2020 Annual Report. The year has brought many challenges yet the program’s agility & the team’s dedication and creativity
have helped us to shift these challenges into opportunities.
As a program, we set new records in 2020 for the number of individuals & institutions engaged & countries reached. ARSET continued its online training offerings, which reached a broader/larger audience breaking its participation record, offered new training topics, e.g. urban heat islands, and increased private sector participation. The Indigenous Peoples Pilot offered its first virtual trainings, including an introductory course on remote sensing for indigenous lands through a partnership with United Tribes Technical College. DEVELOP successfully transitioned its in-person experiential learning to a virtual platform, including a program-wide software skills-building training. SERVIR found new ways to work virtually with the global network, and continues to work with users on improved services, e.g. with the Thailand Pollution Control Department on a system to visualize historical, near real-time, & forecasted air quality and impacts of fires in the Mekong.
I am proud of and grateful for our team and its continued achievements in 2020 despite many difficulties. On behalf of the entire Capacity Building Program, I’d like to thank our many stakeholders that help us impact so many across the globe. We invite you to read on to learn about our 2020 highlights and accomplishments.
Dr. Nancy D. Searby
Capacity Building Program Manager
W E L C O M E
On October 22, 2020, the Operational Land Imager (OLI) on Landsat 8 captured this false-color image of the Colorado East Trou-
blesome fire. The image shows active fires (bright red), scarred land consumed by fire (darker red), and intact vegetation (green).

CAPACITY BUILDING PROGRAM 2020 ANNUAL REPORT 3
I . P R OGR A M INTR ODUCTIONPart of NASA’s Earth Science Division’s Applied Sciences, the Capacity Building Program (CBP) builds capacity around the globe to expand the Earth observations user base &
increase awareness within non-traditional audiences of NASA Earth observations data & products. CBP works through both program and element activities. Program activities include participating in domestic and international capacity building groups, such as the Group on Earth Observations (GEO) and the Committee on Earth Observation Satellites (CEOS), as well as identifying partnership opportunities to reach new end-users like the Indigenous Peoples Pilot. CBP includes three elements: the Applied Remote Sensing
Training Program (ARSET), DEVELOP, and SERVIR.
Through its trainings, participants learn how to access and use NASA Earth science data, applications, and models for environmental management and decision support.
DE V ELOP
A R SE T
SERV IR
empowers the global community through remote sensing trainings.
addresses environmental issues & public policy through applying the lens of NASA Earth observations to community concerns.
supports developing countries apply geospacial technology toenvrionmental decision making.
These interdisciplinary feasibility projects provide experiential learning & workforce development for both participants & part-ner organizations to utilize NASA data and resources in their decision making processes.
A joint development initiative between NASA and the U.S. Agency for International Development (USAID), works in partnershipwith a global network of leading regional organizations to support developing countries’ use of Earth-observing satellites & geospatial technologies.
https://appliedsciences.nasa.gov/arset
http://develop.larc.nasa.gov/
http://www.servirglobal.net/
Capacity Building is led by Dr. Nancy Searby at NASA Headquarters and supported by Lauren Childs-Gleason, Christine Mataya, and Yasha Moz. Each element and pilot is led by management teams at NASA Centers:
ARSET – Dr. Ana Prados, UMD at GSFC
DEVELOP – Michael Ruiz, NASA LaRC
SERVIR – Dan Irwin, NASA MSFC Indigenous Peoples Initiative – Dr. Cindy Schmidt, BAERI at ARC

CAPACITY BUILDING PROGRAM 2020 ANNUAL REPORT4
T E A M W O R K
The program elements work independently, yet engage in many collaborative activities. These include a joint initiative to strengthen foundations of science, technology, engineering, and mathematics in Bhutan, collaboration on trainings and feasibility projects, joint relationship building with external organizations, and participation in each other’s events.
I I . 20 20 RE ACH & ACCOMP L ISHMENT SCBP had a dynamic year with an increased focus on virtual capacity building & efforts to creatively collaborate & engage with partners & the user community. The program conducted 93 trainings, 69 co-development projects, and 43 feasibility studies, which reached broadly across sectors, thematic areas, & geographies leading to a 103% increase over 2019 in individuals engaged, a 42% increase in unique organizations engaged, and 4% increase in countries reached.
29,275INDIVIDUALS ENGAGED
6,457INSTITUTIONS ENGAGED
93TRAININGS
112PROJECTS
Another key collaboration for the CBP team was the collective effort to lead the coordina-tion of the first ever, virtual Applied Sciences Week 2020 which took place in August 2020.
Pg 5
Text in center: Institutional Sector Engagement
Academic Institution (43%) Consortium (<1%) Federal/Central Government (15%) Intergovernmental Organization (2%) Local Government (3%) Private Sector (For-Profit) (17%) Private Sector (Non-Profit)/Voluntary OR NGO (13%) Regional or Multi-State Agency (1%) Research Institution (<1%) State/Provincial Government (5%) Tribal/Indigenous Organization (<1%)
Academic Institution (43%)
Consortium (<1%)
Federal/Central Government (15%)
Intergovernmental Organization (2%)
Local Government (3%)
Private Sector (For-Profit) (17%)
Private Sector (Non-Profit)/Voluntary or NGO (13%)
Regional or Multi-State Agency (1%)
Research Institution (<1%)
State/Provincial Government (5%)
Tribal/Indigenous Organization (<1%)
INSTITUTIONAL SECTOR
S E C T O R A L E N GAG E M E N T

CAPACITY BUILDING PROGRAM 2020 ANNUAL REPORT 5
The program reached participants from all sectors of society. Compared to 2019, 2020 saw increases in academic institutions (5% increase) & the for-profit private sector (1% increase), while a decrease in federal government (6% decrease).
2 0 2 0 R E AC H & AC C O M P L I S H M E N T S
Programmatic STATISTICS (2016-2020)
Trainings Feasibility Studies Co-Development Projects
69
43
93
71
56
163
19
65
85
35
70
104
35
77
55
2016 2017 2018 2019 2020
Pg 5
TRAININGS FEASIBILITYSTUDIES
CO-DEVELOPMENTPROJECTS
Programmatic STATISTICS (2016-2020)
Individuals Engaged Institutions Engaged
6457
29275
4556
14445
2944
8600
2369
6622
1684
4259
2016 2017 2018 2019 2020
Pg 5
Programmatic STATISTICS (2016-2020)
EO Assets Applied Products Developed Peer-Reviewed Pubs Conferences Attended
67
31
406
58
101
31
478
57
78
20
211
55
131
18
245
65
103
23
4665
2016 2017 2018 2019 2020
Pg 5
P R OGR A MM ATIC S TATIS TIC S
INDIVIDUALS INSTITUTIONS
Programmatic STATISTICS (2016-2020)
Individuals Engaged Institutions Engaged
6457
29275
4556
14445
2944
8600
2369
6622
1684
4259
2016 2017 2018 2019 2020
Pg 5
Programmatic STATISTICS (2016-2020)
Individuals Engaged Institutions Engaged
6457
29275
4556
14445
2944
8600
2369
6622
1684
4259
2016 2017 2018 2019 2020
Pg 5
EO ASSETS APPLIED
PRODUCTS DEVELOPED
PEER-REVIEWEDPUBLICATIONS
CONFERENCESATTENDED
55
104
84
163
93
7770 65
5643
35
19
71 69
4259
66228600
14445
29275
16842369 29444556
6457
65 55 57 58
23 20 3118
10378
101131
6746
211
478
245
406
65
31

CAPACITY BUILDING PROGRAM 2020 ANNUAL REPORT6
While the numbers of feasibility studies, trainings and conferences decreased this year partly due to the impacts of pandemic, the Capacity Building Program still had a combined reach of 164 countries, up from 158 in 2019. The map below shows the extent of the program’s reach:
G EO G R A P H I C R E AC H
Each element has different geographical targets & focus. ARSET has global reach whereas DEVELOP focuses more domestically & SERVIR focuses in the 50 countries served by five hubs in Africa, Asia, & the Amazon. The Indigenous Peoples Pilot is focused on the US but is engaging virtual trainees globally. The virtualization of capacity building activities in 2020 allowed for more people to participate from around the world, which can be seen in the following maps:
ALL CBP ENGAGED
3 ELEMENTS/PILOT
2 ELEMENTS/PILOT
1 ELEMENT
NO ENGAGEMENT
ARSET REACH (COUNTRIES ENGAGED) DEVELOP REACH
SERVIR REACH INDIGENOUS PEOPLES PILOT REACH164COUNTRIES
REACHED

CAPACITY BUILDING PROGRAM 2020 ANNUAL REPORT 7
A major accomplishment was the program’s response to the COVID-19 pandemic, including transitioning in-person activities to virtual and addressing new needs through new trainings:
2 0 2 0 R E AC H & AC C O M P L I S H M E N T S
COV ID -19 RESP ONSE: V IR T UA L IZ ATION
DE VELOP
A R SE T
SERVIR
AN INSIDE LOOK AT HOW NASA MEASURES AIR POLLUTIONLANGUAGES: ENGLISH & SPANISH
REACH: 2000+ PARTICIPANTS 96 COUNTRIES 46 STATES
VIRTUAL SOFTWARE CARPENTRY TRAININGDEVELOP successfully transitioned its in-person experiential learning opportunities to virtual by using collaborative software tools/virtual machines that provided access to software & pro-cessing for project work.
APPLIED SCIENCES TEAM (AST)International travel restrictions affected projects & hubs by limiting in-person trainings, consultation workshops, and events, yet the network found ways to effectively get their work done virtually.
VIRTUAL AMAZONIA SUBJECT MATTER EXPERT TRAININGTo conduct this training virtually, SERVIR used Amazon Web Services (AWS) cloud-computing resources, a time-saving alternative for working with big data & complex software remotely.
INDIGENOUS PEOPLES PILOT
1ST VIRTUAL REMOTE SENSING TRAINING Through collaboration with the United Tribes Technical College, a virtual course, “Introduction to Remote Sensing on Indigenous Lands” strengthened the skills of 151 partic-ipants from 135 unique organizations (42% academic, 25% Indigenous, 12% Govt., 11% NGO, and 10% Private), from 24 countries and 24 U.S. states. Sessions/materials can be freely accessed at the course website.
INDIGENOUS MAPPING WORKSHOPThe pilot conducted a series of training sessions for the Indigenous Mapping Workshop focused on Earth observations, web tools, & various land analyses. They also presented at multiple confer-ences, & continued to foster relationships with indigenous groups through meetings/activities.

CAPACITY BUILDING PROGRAM 2020 ANNUAL REPORT8
To engage with stakeholders and the broader user community, Capacity Building partici-pated in 67 national conferences, interagency meetings, and international events and seven NASA Science Team meetings – 60 of these events were virtual.
The CBP Program Manager, Dr. Nancy Searby, served as Chair for the CEOS Working Group on Capacity Building and Data Democracy (WGCapD), Co-Chair for the GEO Ca-pacity Development Working Group (CD-WG), and Program Scientist for NASA’s Socio-economic Data Center (SEDAC). She also supported the interagency U.S. Group on EarthObservations (USGEO)’s International Activities Working Group, Co-Chaired USGEO’s Americas Group, and led AmeriGEO’s capacity building actiiviites.
CBP leadership chaired over a dozen sessions at the 2020 AGU Fall Meeting, contributed to a multiple day side-event during the European Space Agency’s (ESA) Earth Observa-
tion Phi Week, and hosted a virtual synthetic aperture radar (SAR)Townhall at the European Geosciences Union (EGU) General Assembly 2020. The CBP team served as panelists at events such as the United Nations High-level Political Forum on Sustainable Development Indigenous side event, and the GEO Indigenous Sum-mit and presented at dozens of virtual conferences and meetings such as the GEO Virtual Symposium 2020, the Geo For Good Summit 2020, and the 2020 Virtual Annual Water Resources Conference.
2 0 2 0 R E AC H & AC C O M P L I S H M E N T S
S TA K EHOL DER & COMMUNIT Y ENGAGEMENT
67NATIONAL CONFERENCES, INTERAGENCY MEETINGS, & INTERNATIONAL EVENTS
7NASA SCIENCE TEAM MEETINGS
DI V ER SIT Y, EQUIT Y, & INCLUSIONSupporting a renewed focus on enhancing diversity, equity, and inclusion activities, CBP pursued multiple efforts to increase outreach to underserved communities, expand its offer-ings of informational webinars, review demographic trends and tracking processes, as well as hosted a series of dialogues and events.
The Indigenous Peoples Pilot continued its focus on social inclusion and worked to increase indigenous representation in the Earth observations community, and built skills of indigenous decision makers and their staff to use satellite data.
In a train the trainer approach, the overall program engaged a team of interns that re-searched best practices for conducting trainings, then built their own training to intro-duce marginalized youth in the Groundwork USA network to remote sensing and urban applications of Earth observations.

CAPACITY BUILDING PROGRAM 2020 ANNUAL REPORT 9
SERVIR
SERVIR GENDER EXCHANGEORGANIZERS: International Union for Conservation of Nature (IUCN), Advancing Gender in the Environment (AGENT) Program
REACH: 100+ PARTICIPANTS
PURPOSE: CBP exploring how better to incorporate gender in service design
WHITE HOUSE WOMEN’S GLOBAL DEVELOPMENT AND PROSPERITY INITIATIVE (W-GDP)PARTICIPANTS: SERVIR /YouthMappers networks
PARTNERSHIP: Arizona State University
PURPOSE: A series of trainings to emplower early career women
D I V E R S I T Y, E Q U I T Y, & I N C L U S I O N
VIRTUAL WiSci STEAM CAMPS
DE VELOP + SERVIR
SOUTHERN BHUTAN ECOLOGICAL FORECASTING + BHUTAN WATER RESOURCES FEASIBILITY STUDIESPARTNERSHIP: Interagency Agreement - U.S. Department of State
PARTICIPANTS: 9 Bhutanese scholars
LOCATIONS: Maryland–Goddard DEVELOP, Alabama–Marshall DEVELOP
PURPOSE: DEVELOP assembled two teams of participants with backgrounds ranging from psychology to civil engineering, global supply chain management, and international business. The participants used their diverse backgrounds, along with guidance from SERVIR, NASA, and partner advisors, to apply remote sensing and GIS to evaluate elephant habitat suitability in southern Bhutan & compare precipitation, temperature, & phenology data trends in Bhutan to assist the Himalayan Environmental Rhythm Observation and Evaluation System project.

CAPACITY BUILDING PROGRAM 2020 ANNUAL REPORT10
I I I . 20 20 EL EMENT ACCOMP L ISHMENT S
21k +LIVE TRAINING PARTICIPANTS
A R SE T6kON DEMAND/SELF-GUIDED TRAINING PARTICIPANTS
13 ONLINE TRAININGS
5LIVE TRAININGS IN SPANISH
27,425TOTAL ARSET TRAINING PARTICIPANTS
RECORD:
2,931TOTAL TRAINING PARTICIPANTS [DUAL-LANGUAGE]
MOST POPULAR: REMOTE SENSING OF COASTAL ECOSYSTEMS
RECORD HIGH: FUNDAMENTALS OF REMOTE SENSING
1,121 PRIVATE COMPANIES
HIGHEST GROWTH IN PARTICIPATION: PRIVATE SECTOR
How remote sensing data can be used for decision-making among the food security communities.
NEW THEME: AGRICULTURE AND FOODSECURITY TRAINING
NEW THEME: URBAN HEAT ISLANDS TRAINING
Use of remote sensing to identify “hot spots” of land surface temp. in urban areas for adaptive land use planning.
217INDIVIDUALS/FELLOWS
DE V ELOP
ENGAGEMENT:
94 PARTNER ORGS
43PROJECTS (11 NODE LOCATIONS)
43 U.S. STATES
IMPACT:
15 COUNTRIES
5PEER-REVIEWED JOURNAL ARTICLES
SSAI ScholarshipsPresentation Awards: 26th Annual Front Range Student Symposium The Governor’s Conference on the Future of Water in Kansas
awards
1stVIRTUAL SOFTWARE CARPENTRY TRAINING WORKSHOP
A series of storymaps were created for projects in 2020, two highlight storymaps: Central Valley Water ResourcesCherokee Water Resources
storymaps A DEVELOP team partnered with Howard County’s Office of Emergency Management & Storm Water Management Divisions to enhance a statistical flood risk model using Earth observation to continue improving early warning systems & public safety in Ellicott City, Maryland.
ENHANCING FLOOD EARLY WARNING SYSTEMS
DEVELOP collaborated w/AGU Thriving Earth Exchange & the City of Cambridge to quantify changes in urban albedo using Earth observations to reduce urban heat island effects through an Urban Heat Da-shboard for enhanced monitoring.
URBAN HEAT DASHBOARDDEVELOPMENT

CAPACITY BUILDING PROGRAM 2020 ANNUAL REPORT 11
2 0 2 0 E L E M E N T AC C O M P L I S H M E N T S
1,456INDIVIDUALS
SERV IR
ENGAGEMENT FROM : TOOLS, TECHNOLOGIES, DATA, & METHODOLOGIES
42TRAININGS
46COUNTRIES
IMPACT:
39CUSTOM SERVICES
5 REGIONAL HUBS: Science Coordination Office, Applied Sciences Team, SERVIR Support Team
35SATELLITE INSTRUMENTS
USING DATA FROM:
APPLICATION READINESS LEVEL AVG. FOR AST PROJECTS
ARL - 4
15PROJECTS ADVANCING 1+ ARLS SINCE PROJECT START
The UN World Food Programme (WFP) is integrating SERVIR services & data into their PRISM interactive platform, ingesting information from SERVIR’s near real-time flood monitoring system, HYDrologic Remote Sensing Analysis for Floods and drought monitoring tool, R DCYIS.
HYDRA FLOODS
In partnership with Thailand’s Pollution Control Department (PCD) & Geo-Informatics & Space Technology Development Agency (GISTDA), SERVIR-Mekong developed a new Air Quality Explorer tool for Thailand, in response to chro-nic seasonal air pollution. The tool allows users to intercompare historic, near real-time satellite observations, ground-based air quality observa-tions, and forecasted conditions.
AIR QUALITY EXPLORER
The Global Forest Resource Assessment 2020 Report cited SERVIR’s Collect Earth Online (CEO), as enabling countries in “the collection of data for FRA’s remote sensing survey” and many countries continue to use SERVIR’s CEO to support Greenhouse Emissions reports.
COLLECT EARTH ONLINE
INDIGENOUS P EOP L ES P ILOT
2ONLINE TRAININGS
UTTC TRAINING ENGAGEMENT:
135 ORGANIZATIONS
151 PARTICIPANTS
24COUNTRIES
24U.S. STATES
UTTC TRAINING REACH: GEO IPP supported the creation of the GEO Indigenous Alliance & the first GEO Indigenous Summit
27WORKSHOPS
44WEBSITE ARTICLES PUBLISHED

CAPACITY BUILDING PROGRAM 2020 ANNUAL REPORT12
The Capacity Building Program engages individuals & institutions through a variety of capacity building approaches: trainings, collaborative feasibility studies, and co-development projects. In 2020, the program conducted 93 trainings, 43 feasibility studies, & 69 projects. For more information about the full portfolio of individual projects and trainings, visit the ARSET, DEVELOP, and SERVIR websites and Appendix D below.
CBP activities addressed eight thematic topics in alignment with the Applied Sciences’ Application Areas: Agriculture and Food Security, Disasters,
Ecological Forecasting, Energy, Health & Air Quality, Transportation
& Infrastructure, Urban Development, and Water Resources, as well as other cross-cutting topics such as remote sensing/GIS fundamentals, coding, and climate/weather applications.
I V. THEM ATIC & REGION A L P OR TFOL IO
WATER RESOURCES
ECOLOGICAL FORECASTING
URBAN DEVELOPMENT
HEALTH & AIR QUALITY
TRANSPORTATION & INFRASTRUCTURE
ENERGY
AGRICULTURE & FOOD SECURITY
DISASTERS
CROSS-CUTTING/OTHER
WEATHER/CLIMATE
26%
15%
27%
1%
12%
5%
4%
7%
1%
2%
93TRAININGS
THEMATIC FOCUS AREA
DISTRIBUTION
112 PROJECTS
18% 33%
7%
5%
7%
1%
29%
7%
26%
2%
17%
32%
7%
5%1%
4%

CAPACITY BUILDING PROGRAM 2020 ANNUAL REPORT 13
T H E M AT I C & R E G I O N A L P O R T F O L I O
REGION A L S TATIS TIC SCBP organizes international activities by GEO Regional Caucus (Americas, Asia
& Oceania, Europe, Africa, and CIS) to assess progress and identify regions that have benefited most from the Program’s capacity building.
AMERICAS
10,480 ARSET
166DEVELOP
566SERVIR
115 IPP
INDIVIDUALS
ACTIVITIES
10SERVIR AST/HUB PROJECTS
10SERVIR TRAININGS
38DEVELOP PROJECTS
ASIA & OCEANIA
6,124 ARSET
15DEVELOP
553SERVIR
22 IPP
INDIVIDUALS
ACTIVITIES
25SERVIR AST/HUB PROJECTS
18SERVIR TRAININGS
2DEVELOP PROJECTS
AFRICA
1,898 ARSET
347SERVIR
11 IPP
INDIVIDUALS
ACTIVITIES
24SERVIR AST/HUB PROJECTS
12SERVIR TRAININGS
3DEVELOP PROJECTS
EUROPE
2,918 ARSET
2 IPP
INDIVIDUALS
CIS
149 ARSET
1 IPP
INDIVIDUALS
CAPACITY BUILDING PROGRAM 2020 ANNUAL REPORT14
The program collects outcomes through success stories, highlights, ARSET surveys, and DEVELOP participant surveys. Indicators are used to track intermediate results. Strategic targets are assessed annually, along with Application Readiness Level (ARL) and Proj-ect Strength Index (PSI) scores to track yearly progress. The programmatic performance tracking system was initiated in 2016 based on results frameworks that identify unique indicators for each program element, with a refined number of program-wide indicators collected across all elements. The collection process and indicators collected were refined at the end of 2018 with enhanced definitions of inputs feeding each indicator from each element and a new submission system and documentation.
Some targets, actuals, and indicators’ increased, while others decreased from 2019 to 2020 and were driven primarily by the COVID-19 pandemic and its restrictions and impacts to onsite work, travel, and equitable resources (see Appendix B).
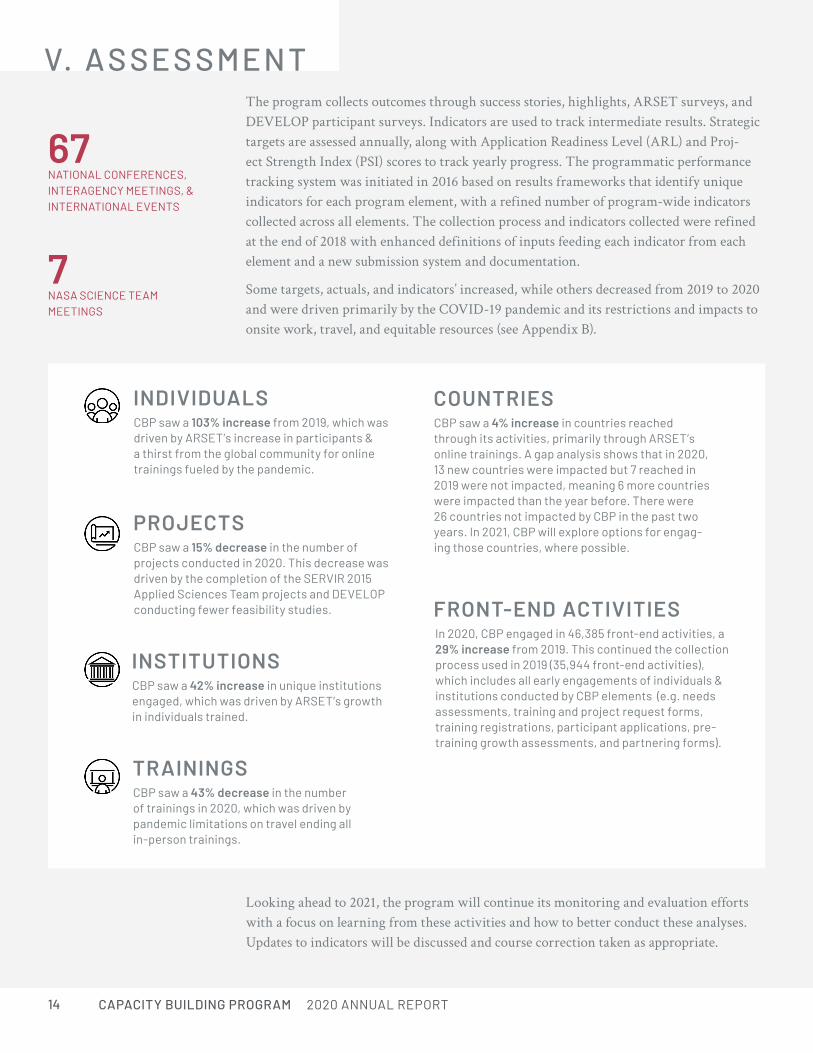
67NATIONAL CONFERENCES, INTERAGENCY MEETINGS, & INTERNATIONAL EVENTS
7NASA SCIENCE TEAM MEETINGS
V. AS SES SMENT
INDIVIDUALSCBP saw a 103% increase from 2019, which was driven by ARSET’s increase in participants & a thirst from the global community for online trainings fueled by the pandemic.
INSTITUTIONSCBP saw a 42% increase in unique institutions engaged, which was driven by ARSET’s growth in individuals trained.
PROJECTSCBP saw a 15% decrease in the number of projects conducted in 2020. This decrease was driven by the completion of the SERVIR 2015 Applied Sciences Team projects and DEVELOP conducting fewer feasibility studies.
TRAININGSCBP saw a 43% decrease in the number of trainings in 2020, which was driven by pandemic limitations on travel ending all in-person trainings.
COUNTRIESCBP saw a 4% increase in countries reached through its activities, primarily through ARSET’s online trainings. A gap analysis shows that in 2020, 13 new countries were impacted but 7 reached in 2019 were not impacted, meaning 6 more countries were impacted than the year before. There were 26 countries not impacted by CBP in the past two years. In 2021, CBP will explore options for engag-ing those countries, where possible.
FRONT-END ACTIVITIESIn 2020, CBP engaged in 46,385 front-end activities, a 29% increase from 2019. This continued the collection process used in 2019 (35,944 front-end activities), which includes all early engagements of individuals & institutions conducted by CBP elements (e.g. needs assessments, training and project request forms, training registrations, participant applications, pre-training growth assessments, and partnering forms).
Looking ahead to 2021, the program will continue its monitoring and evaluation efforts with a focus on learning from these activities and how to better conduct these analyses. Updates to indicators will be discussed and course correction taken as appropriate.

CAPACITY BUILDING PROGRAM 2020 ANNUAL REPORT 15
A S S E S S M E N T
P R O JECT P R OGRES S & S TRENGTH
SERVIR’s Applied Sciences Team was selected through NASA’s Research Opportunities in Space and Earth Science (ROSES) in fall 2019, resulting in 20 new AST projects
beginning in early 2020. The in-person kickoff for the new teams was held at the 2020 SERVIR Annual Global Exchange (SAGE), held February in Siem Reap, Cambodia. Ses-sions on the first day of SAGE allowed participants from the new AST team to engage with SCO and hub scientists, and the networking opportunities provided by SAGE were of particular value this year, allowing for in-person interactions and side discussions of regional activities throughout the week. In terms of performance, out of the 2018 AST projects, 15 of 20 projects advanced one or more ARLs. Three projects advanced by two ARLs. The initial mean ARL for these projects was 3.1, and the current mean is 4.
In 2020, DEVELOP conducted 43 feasibility projects, 32 were first term projects, eight were second term projects, and three third term projects. The program updated its Project Strength Index (PSI) to incorporate partner feedback directly into the score to depict project strength more accurately. The PSI is now calculated two terms after the project’s completion. As such, the number of projects that have a complete PSI score within a single calendar year is lower than in previous years. The PSI takes into con-sideration both the scientific merit of the work and the project’s applicability to deci-sion-making and partner capacity building. It tracks project progress across a 5-point scale of 1) Basic Research, 2) Application Concept Complete, 3) Application Demon-stration Successful, 4) Application Verified/End User Engaged, and 5) Transition to End User/Decision Enhanced. For the eight feasibility studies completed & fully assessed during 2020, the average PSI score was a 3.0. More 2020 scores will be calculated as more post-project partner forms are received.
ARL - 4AVERAGE FOR SERVIR AST PROJECTS
43FEASIBILITY PROJECTS
PSI - 3.0AVERAGE FOR 8 STUDIES
PROJECT STRENGTH INDEX1) BASIC RESEARCH
2) APPLICATION CONCEPT COMPLETE
3) APPLICATION DEMONSTRATION SUCCESSFUL
4) APPLICATION VERIFIED/END USER ENGAGED
5) TRANSITION TO END USER/DECISION ENHANCED
DE VELOP
SERVIR

CAPACITY BUILDING PROGRAM 2020 ANNUAL REPORT16
As the world moves on from the COVID-19 pandemic, Capacity Building will continue its pursuit of expanding the networks of individuals and institutions to be aware of, able to access, and use Earth observations in their decision making. Through its elements and ini-tiatives, the program will engage with interagency and international consortiums, bound-ary organizations, and the broader NASA Earth Sciences community to further increase the number of individuals and institutions benefiting from NASA’s investment in Earth science. We look forward to contributing to the strategic priorities of Applied Sciences and the Earth Sciences Division.
V I. LOOK ING A HE A D
2021 ELEMENT PLANS
plans to explore new thematic application areas (i.e. energy resilience) and novel datasets (e.g. hy-perspectral data, population grids, LIDAR, and solar induced fluorescence) for its trainings, as well as a multi-thematic training series drawing on relevant Earth observations for water resources, land man-agement, and air quality for wildfire management.
will continue to engage the future workforce virtually &offer Software Carpentry trainings across the program, refining virtual workshop curriculum, and expanding participation of external groups. It is exploring opportuni-ties to engage participants through an in-person/virtual hybrid model toward the end of 2021 and plans to expand its outreach and recruiting efforts to underrepresented applicants & geographic areas, while leveraging ongoing efforts across AppSci and NASA.
will continue to strengthen the network through co-development of services across multiple hubs and partners. The SERVIR Annual Global Exchange (SAGE) 2021 will be held virtually and the network will work to integrate the new SERVIR Strategic Plan for 2020 to 2025 into SERVIR services. SER-VIR hopes to explore additional phases for SERVIR hubs, creation of a geospatial infrastructure strate-gy, multi-donor support of new hubs, and cross-hub collaborations on joint services and exchanges.
will pursue workshops, trainings, & engagement sessions in support of the GEO Indigenous Alliance, US GEO, CEOS Amer-iGEO, and continue to engage with indigenous communities & partners to strengthen relationships, as well as develop an engagement strategy for working with US tribes and support Indigenous youth opportunities at NASA.
ARSET
SERVIRDEVELOP
INDIGENOUS PEOPLES PILOT
We also look forward to the day our team can reunite in-person, renew in-person interac-tions with our partners, and physically attend conferences!

CAPACITY BUILDING PROGRAM 2020 ANNUAL REPORT 17
V I I . A P P ENDI X A . ACR ON Y MSAmeriGEO: Americas Group on Earth ObservationsAGENT: Advancing Gender in the EnvironmentAppSci: Applied Sciences ProgramARC: Ames Research CenterARL: Application Readiness LevelARSET: Applied Remote Sensing TrainingAST: Applied Sciences TeamAWS: Amazon Web ServicesBAERI: Bay Area Environmental Research InstituteCBP: Capacity Building ProgramCD-WG: Capacity Development Working GroupCEMADEN: Centro Nacional de Monitoramento e Alerta de Desastres NaturaisCEO: Collect Earth OnlineCEOS: Committee on Earth Observation SatellitesCEUs: Continuing Education UnitsCIS: Commonwealth of Independent StatesCOVID-19: Coronavirus Disease 2019CY: Calendar YearEGU: European Geosciences UnionEO: Earth ObservationsESA: European Space AgencyGEO: Group on Earth ObservationsGIS: Geographic Information SystemsGISTDA: Geo-Informatics and Space Technology Development AgencyGSFC: Goddard Space Flight CenterHYDRAFloods: Hydrologic Remote Sensing Analysis for FloodsIBAMA: Brazilian Institute of the Environment & Renewable Natural ResourcesIDEAM: Institute of Hydrology, Meteorology & Environmental StudiesINDECI: Instituto Nacional de Defensa CivilINPE: Instituto Nacional de PesquisasIPP: Indigenous Peoples PilotIUCN: International Union for Conservation of NatureLaRC: Langley Research CenterLIDAR: Light Detection & Ranging
MINAM: Ministerio del AmbienteMOU: Memorandum of UnderstandingMSFC: Marshall Space Flight CenterNASA: National Aeronautics & Space AdministrationNGO: Non-Governmental OrganizationPCD: Pollution Control DepartmentPI: Principal InvestigatorPSI: Project Strength IndexPRISM: Platform for Real-time Impact & Situation MonitoringRAPID: Routing Application for Parallel computation of DischargeRDCYIS: Regional Drought & Crop Yield Information SystemROSES: Research Opportunities in Space & Earth ScienceSAGE: SERVIR Annual Global ExchangeSAR: Synthetic Aperture RadarSCO: Science Coordination OfficeSEDAC: Socioeconomic Data Center SENAMHI: Servicio Nacional de MeteorologÍa e HidrologÍaSERFOR: Servicio Nacional Forestal y de Fauna SilvestreSME: Subject Matter ExpertSSAI: Science Systems and Applications, Inc.STEAM: Science, Technology, Engineering, Arts, MathematicsUN: United NationsUSAID: United States Agency for International DevelopmentUSGEO: U.S. Group on Earth ObservationsUTEC: Universidad de Ingeniería y TecnologíaUTTC: United Tribes Technical CollegeWFP: World Food ProgrammeWGCapD: Working Group on Capacity Building & Data DemocracyW-GDP: Women’s Global Development & Prosperity InitiativeWiSci: Women in Science

CAPACITY BUILDING PROGRAM 2020 ANNUAL REPORT18
V I I I . A P P ENDI X B. S TR ATEGIC TA R GE T S & INDICATOR S
ACTIVITY TARGET 2014 2015 2016 2017 2018 2019 2020
U.S. States Impacted 40+ 44 50 50 50 50 50 50
Countries Impacted 90+ 109 123 130 132 138 151 161
Total # of Individuals 1,500+ 1,014 2,877 3,277 4,864 6,362 12,370 27,425
Total # of Institutions 500+ 650 1,032 1,392 2,030 2,570 4,273 6,245
Application Areas 4 4 4 7 4 4 4 6
Trainings Varies 11 11 15 18 17 16 13
ACTIVITY TARGET 2014 2015 2016 2017 2018 2019 2020
U.S. States Impacted 35+ 46 50 42 49 46 48 43
U.S.: International <1:4 N/A 1:4 1:4 1:6 1:5 2:7 2:7
Total # of Individuals 200+ 379 393 359 342 308 269 217
Total # of Institutions 75+ 160 157 125 128 121 135 94
Application Areas All All (9/9) All (9/9) 8/9 All (9/9) All (8/8) All (8/8) All (8/8)
Feasibility Studies 60 83 93 77 70 65 56 43
ACTIVITY TARGET 2014 2015 2016 2017 2018 2019 2020
Countries Impacted 38 44 43 40 40 41 52 48
Custom Services 42 N/A 47 38 37 42 36 39
Total # of PI Leads 16 N/A 11 27 25 16 36 28
Total # of Individuals 283 425 834 623 1202 1,907 1,771 1,465
Total # of Institutions 27 159 128 143 150 249 195 199
ACTIVITY 2017 2018 2019 2020
US States Impacted 9 3 7 24
Total # of Participants 39 23 35 151
Total # of Organizations 19 12 11 135
Application Areas Covered 3 2 3 3
ACTIVITY TARGET 2014 2015 2016 2017 2018 2019 2020
U.S. States Impacted 40+ 44 50 50 50 50 50 50
Countries Impacted 90+ 109 123 130 132 138 151 161
Total # of Individuals 1,500+ 1,014 2,877 3,277 4,864 6,362 12,370 27,425
Total # of Institutions 500+ 650 1,032 1,392 2,030 2,570 4,273 6,245
Application Areas 4 4 4 7 4 4 4 6
Trainings Varies 11 11 15 18 17 16 13
ACTIVITY TARGET 2014 2015 2016 2017 2018 2019 2020
U.S. States Impacted 35+ 46 50 42 49 46 48 43
U.S.: International <1:4 N/A 1:4 1:4 1:6 1:5 2:7 2:7
Total # of Individuals 200+ 379 393 359 342 308 269 217
Total # of Institutions 75+ 160 157 125 128 121 135 94
Application Areas All All (9/9) All (9/9) 8/9 All (9/9) All (8/8) All (8/8) All (8/8)
Feasibility Studies 60 83 93 77 70 65 56 43
ACTIVITY TARGET 2014 2015 2016 2017 2018 2019 2020
Countries Impacted 38 44 43 40 40 41 52 48
Custom Services 42 N/A 47 38 37 42 36 39
Total # of PI Leads 16 N/A 11 27 25 16 36 28
Total # of Individuals 283 425 834 623 1202 1,907 1,771 1,465
Total # of Institutions 27 159 128 143 150 249 195 199
ACTIVITY 2017 2018 2019 2020
US States Impacted 9 3 7 24
Total # of Participants 39 23 35 151
Total # of Organizations 19 12 11 135
Application Areas Covered 3 2 3 3
ARSET
SERVIR
DEVELOP
INDIGENOUS PEOPLES PILOT

CAPACITY BUILDING PROGRAM 2020 ANNUAL REPORT 19
IR-1: Improved Awareness of – and Access to – Earth Observation Data, Products, and Tools
Sub-IR 1.1: Awareness Increased in New Geographic Regions & Different Sectors
1.1.1 The Number of States & Countries Reached through CBP Trainings & Projects
2019: 50 states; 158 countries 2020: 50 states; 162 countries
1.1.2 The number of Institutions (by type) Reached through Trainings & Projects
2019: Total: 4,556 – Academic Institution (38%); Consortium (<1%); Federal/ Central Government (19%);
Intergovernmental Organization (2%); Local Government (3%); Private Sector (For-Profit) (16%); Private Sector (Non-
Profit)/Voluntary or NGO (13%); Regional Agency (<1%); Research Institute (<1%); State/ Provincial
Government (5%); Tribal Entity (1%)
2020: Total: 6,457 – Academic Institution (43%); Consortium (<1%); Federal/ Central Government (15%);
Intergovernmental Organization (2%); Local Government (3%); Private Sector (For-Profit) (17%); Private Sector (Non-
Profit)/Voluntary or NGO (13%); Regional Agency (1%); Research Institute (<1%); State/ Provincial
Government (5%); Tribal Entity (<1%)
Sub-IR 1.2: Individual & Institution Needs Identified
1.2.1 The number of front end engagement activities 2019: 35,944 2020:46,385
Sub IR-1.3: Access to Data, Products, Tools & Trainings Enhanced
1.3.1 The number of CBP trainings & projects by AppSci National Application Area
2019: Projects – 127 Total: Agriculture (26); Disasters (8); Ecological
Forecasting (32); Energy (3); Health & Air Quality (3); Transportation &
Infrastructure (2); Urban Development (8); Water Resources (36)
Trainings – 163 Total: Agriculture (23); Disasters (18); Ecological Forecasting
(47); Energy (0); Health & Air Quality (8); Transportation & Infrastructure (0);
Urban Development (0); Water Resources (14)
2020: Projects – 112 Total: Agriculture (19); Disasters (8); Ecological
Forecasting (29); Energy (2); Health & Air Quality (5); Transportation &
Infrastructure (1); Urban Development (4); Water Resources (36); Weather &
Climate (8) Trainings – 93 Total: Agriculture (5);
Disasters (6); Ecological Forecasting (27); Energy (0); Health & Air Quality (6);
Transportation & Infrastructure (0); Urban Development (1); Water
Resources (17); Cross-Cutting (31)
1.3.2 The number of CBP products posted online 2019: 384 2020: 371
1.3.3 The number of NASA Earth observation platforms & sensors utilized in projects & highlighted in trainings
2019: 57 2020: 58
IR-2: Strengthened Capacity to Use Earth Observation Data, Products & Tools
Sub-IR 2.1: Individuals Engaged & Trainings Delivered
2.1.1 The number of trainings & workshops given or facilitated by CBP Elements
2019: 163 2020: 93
2.1.2 The number of individuals engaged in CBP activities 2019: 14,445 2020: 29,275
I N D I C AT O R S

CAPACITY BUILDING PROGRAM 2020 ANNUAL REPORT20
2.1.3 The number of policy & science conferences attended 2019: 101 2020: 67
Sub-IR 2.2: Tailored Products & Tools Co-developed
2.2.1 The number of products developed by/with support from CBP
2019: 478 2020: 406
Sub-IR 2.3: Number of Organizations Using NASA Earth Observations in Their Decision-Making Process
2.3.1 The number of individuals and/or institutions integrating Earth observations in their decision-making process (stories collected)
2019: 40 2020: 23
IR-3: Improved Capacity Building Practices & feedback to Earth Science Community
Sub-IR 3.1: Best Practices & Lessons Learned Collected & Shared
3.1.1 The number of best practice documents produced and/or presented by CBP
2019: 3 2020: 6
3.1.2 The number of outreach events for CBP activities 2019: 24 2020: 3
Sub-IR 3.2: Increased Capability to Monitor & Evaluate Impact of CBP Activities and Collect Feedback
3.2.1 The percent of individuals who completed pre-training/project surveys & assessments
2019: ARSET (100%); DEVELOP (Participants – 99%; Partners – 50%)
SERVIR (N/A); IP (N/A)
2020: ARSET (100%); DEVELOP (Participants – 99.5%; Partners – 67%)
SERVIR (N/A); IP (N/A)
3.2.2 The percent of individuals who completed post-training/project surveys & assessments
2019: ARSET (33%); DEVELOP (Partners – 22%; Participants – 97%); SERVIR (N/
A); IP (N/A)
2020: ARSET (42%); DEVELOP (Partners – 20%; Participants – 99%);
SERVIR (N/A); IP (38%)
3.2.3 The number of projects that achieved yearly ARL goal 2019: 8 out of 16 2020: 9 out of 20
3.2.4 The annual average PSI score for feasibility projects 3.1 2020: 3.0
Sub-IR 3.3: Feedback to Earth Science Community Delivered
3.3.1 The number of participation in Science Team Meetings 6 2020: 7
3.3.2 The number of DAAC engagement and feedback activities
7 2020: 9
I N D I C AT O R S
2019: 3.1
2019: 6
2019: 7

CAPACITY BUILDING PROGRAM 2020 ANNUAL REPORT 21
I X . A P P ENDI X C. P UBL ICATIONS
1. Aekakkararungroj, A., Chishtie, F. Poortinga, A., Mehmood, H., Anderson, E., Munroe, T., Cutter, P., Loketkawee, N., Tondapu, G., Towashiraporna, P., Saah, D. (2020) A publicly available GIS-based web platform for reservoir inundation mapping in the Lower Mekong region. Environmental Mod-elling and Software. Volume 123, January 2020; https://doi.org/10.1016/j.envsoft.2019.104552 [SERVIR]
2. Ahmed, B., Rahman, M. S., Sammonds, P., Islam, R., and Uddin, K. (2020) Application of geospatial technologies in developing a dynamic landslide early warning system in a humanitarian context: the Rohingya refugee crisis in Cox’s Bazar, Ban-gladesh. Geomatics, Natural Hazards and Risk. Volume 11(1), 446-468. https://doi.org/10.1080/19475705.2020.1730988 [SERVIR]
3. Anchang, J., Prihodko, L., Ji, W., Kumar, S. S., Ross, C. W., Yu, Q., Lind, B., Sarr, M. A., Diouf, A. A. and Hanan, N. P. (2020) Toward Operational Mapping of Woody Canopy Cover in Tropical Sa-vannas Using Google Earth Engine. Frontiers in Environmental Science. https://doi.org/10.3389/fenvs.2020.00004 [SERVIR]
4. Arévalo, P., Bullock, E. L., Woodcock, C. E., Olofsson, P. (2020). A Suite of Tools for Contin-uous Land Change Monitoring in Google Earth Engine. Frontiers in Environmental Science. https://doi.org/10.3389/fclim.2020.576740 [SER-VIR]
5. Becker-Reshef, I., Justice, C., Barker, B., Humber, M., Rembold, F., Bonifacio, R., Zappacosta, M., Budde, M., Magadzire, T., Shitote, C., Pound, J., Constantino, A., Nakalembe, C., Mwangi, K., Sobue, S., Newby, T., Whitcraft, A., Jarvis, I., Verdin, J. (2020) Strengthening agricultural decisions in countries at risk of food insecurity: The GEOGLAM Crop Monitor for Early Warn-ing. Remote Sensing of Environment. Volume 237, February 2020; https://doi.org/10.1016/j.rse.2019.111553 [SERVIR]
6. Chang, C.-H., Lee, H., Kim, D., Hwang, E., Hos-sain, F., Chishtie, F., Jayasinghe, S., and Basnayake, S. (2020) Hindcast and forecast of daily inundation extents using satellite SAR and altimetry data with rotated empirical orthogonal function analysis: Case study in Tonle Sap Lake Floodplain. Remote Sensing of Environment. Volume 241, May 2020; https://doi.org/10.1016/j.rse.2020.111732 [SERVIR]
7. Cherrington, E. A., Griffin, R. E., Anderson, E. R., Hernandez Sandoval, B. E., Flores-Anderson, A. I., Muench. R. E., Markert, K. N., Adams, E. C., Limaye, A. S., Irwin, D. E. (2020) Use of public Earth observation data for tracking progress in sustainable management of coastal forest ecosys-tems in Belize, Central America. Remote Sensing of Environment. Volume 245, August 2020; https://doi.org/10.1016/j.rse.2020.111798 [SERVIR]
8. Flores-Anderson, A. I., Griffin, R., Dix, M., Romero-Oliva, C. S., Ochaeta, G., Skinner-Al-varado, J., Ramirez Moran, M. V., Hernandez, B., Cherrington, E., Page, B., and Barreno, F. (2020) Hyperspectral Satellite Remote Sensing of Water Quality in Lake Atitlán, Guatemala. Frontiers in Environmental Science. https://doi.org/10.3389/fenvs.2020.00007 [SERVIR]
9. Herndon, K., Muench, R., Cherrington, E., and Griffin, R. (2020) An Assessment of Surface Water Detection Methods for Water Resource Manage-ment in the Nigerien Sahel. Sensors, 20(2), 431; https://doi.org/10.3390/s20020431 [SERVIR]
10. Hossain, F., Bonnema, M., Srinivasan, M., Beighley, E., Andral, A., Doorn, B., Jayaluxmi, I., Jayasinghe, S., Kaheil, Y., Fatima, B., Elmer, N., Fenoglio, L., Bales, J., Lefevre, F., Legrand, S., Brunel, D., Le Traon, P.-Y. (2020) The Early Adopter Program for the Surface Water Ocean Topography Satellite Mis-sion: Lessons Learned in Building User Engagement during the Prelaunch Era. Bulletin of American Meteorological Society (BAMS). 101 (3): E259–E264; https://doi.org/10.1175/BAMS-D-19-0235.1 [SERVIR]

CAPACITY BUILDING PROGRAM 2020 ANNUAL REPORT22
11. Kumar, A.S., Camacho, S., Searby, N.D., Teu-ben, J., Balogh, W. (2019). Coordinated Capacity Development to Maximize the Contributions of Space Science, Technology, and its Applications in Support of Implementing Global Sustainable Development Agendas – A Conceptual Frame-work. Space Policy. https://doi.org/10.1016/j.spacepol.2019.101346. [CBP]
12. Laverde-Barajas, M., Corzo, G. A., Poortinga, A., Chishtie, F., Meechaiya, C., Jayasinghe, S., ... & Solomatine, D. P. (2020). St-corabico: A spatio-temporal object-based bias correction method for storm prediction detected by satellite. Remote Sensing, 12(21), 3538. https://doi.org/10.3390/rs12213538 [SERVIR]
13. Laverde-Barajas, M., Perez, G. C., Chishtie, F., Poortinga, A., Uijlenhoet, R., & Solomatine, D. P. (2020). Decomposing satellite-based rainfall errors in flood estimation: Hydrological responses using a spatiotemporal object-based verification meth-od. Journal of Hydrology, 591, 125554. https://doi.org/10.1016/j.jhydrol.2020.125554 [SERVIR]
14. Macharia, D., Kaijage, E., Kindberg, L., Koech, G., Ndungu, L., Wahome, A., and Mugo, R. (2020) Mapping Climate Vulnerability of River Basin Communities in Tanzania to Inform Resilience Interventions. Sustainability, 12(10), 4102; https://doi.org/10.3390/su12104102 [SERVIR]
15. Markert, K. N., Markert, A. M., Mayer, T., Nau-man, C., Haag, A., Poortinga, A., Bhandari, B., Thwal, N. S., Kunlamai, T., Chishtie, F., Kwant, M., Phongsapan, K., Clinton, N., Towashiraporn, P., and Saah, D. (2020) Comparing Sentinel-1 Surface Water Mapping Algorithms and Radio-metric Terrain Correction Processing in South-east Asia Utilizing Google Earth Engine. Remote Sensing. 12 (15), 2469; https://doi.org/10.3390/rs12152469 [SERVIR]
16. Miller, S. E., Adams, E. C., Markert, K. N., Ndungu, L., Ellenburg, W. L., Anderson, E. R., Kyuma, R., Limaye, A., Griffin, R., and Irwin, D. (2020) Assessment of a Spatially and Temporally Consistent MODIS Derived NDVI Product for
A P P E N D I X C. P U B L I C AT I O N S
Application in Index-Based Drought Insurance. Re-mote Sensing. 12(18), 3031; https://doi.org/10.3390/rs12183031 [SERVIR]
17. Mishra, V., Ellenburg, W. L., Markert, K. N., and Limaye, A. S. (2020) Performance evaluation of soil moisture profile estimation through entropy-based and exponential filter models. Hydrological Sciences Journal, 65(6), 1036-1048; https://doi.org/10.1080/02626667.2020.1730846 [SERVIR]
18. Mishra, V., Limaye, A. S., Muench, R. E., Cher-rington, E. A., & Markert, K. N. (2020). Evaluating the performance of high-resolution satellite imagery in detecting ephemeral water bodies over West Af-rica. International Journal of Applied Earth Obser-vation and Geoinformation, 93, 102218. https://doi.org/10.1016/j.jag.2020.102218 [SERVIR]
19. Mugo, R., Waswa, R., Nyaga, J. W., Ndubi, A., Adams, E. C., and Flores-Anderson, A. I. (2020) Quantifying Land Use Land Cover Changes in the Lake Victoria Basin Using Satellite Remote Sensing: The Trends and Drivers between 1985 and 2014. Re-mote Sensing. 12(17), 2829; https://doi.org/10.3390/rs12172829 [SERVIR]
20. Nicolau, A. P., Flores-Anderson, A., Griffin, R., Herndon, K., and Meyer, F. J. (2021) Assessing SAR C-band data to effectively distinguish modified land uses in a heavily disturbed Amazon forest. International Journal of Applied Earth Observa-tion and Geoinformation. Volume 94. https://doi.org/10.1016/j.jag.2020.102214 [SERVIR]
21. O’Shea, K., LaRoe, J., Vorster, A., Young, N., Evange-lista, P., Mayer, T., Carver, D., Simonson, E., Martin, V., Radomski, P., Knopik, J., Kern, A., Khoury, C. K. (2020). Improved remote sensing methods to detect Northern Wild Rice (Zizania palustris L.). Remote Sensing. 12(18). 3023. https://doi.org/10.3390/rs12183023 [DEVELOP]
22. Ouko, E., Omondi, S., Mugo, R., Wahome, A., Kasera, K., Nkurunziza, E., Kiema, J., Flores, A., Ad-ams, E.C., Kuraru, S., and Wambua, M. (2020) Mod-eling Invasive Plant Species in Kenya’s Northern Rangelands. Frontiers in Environmental Science. https://doi.org/10.3389/fenvs.2020.00069 [SERVIR]

CAPACITY BUILDING PROGRAM 2020 ANNUAL REPORT 23
23. Poortinga, A.; Aekakkararungroj, A.; Kityut-tachai, K.; Nguyen, Q.; Bhandari, B.; Soe Thwal, N.; Priestley, H.; Kim, J.; Tenneson, K.; Chishtie, F.; Towashiraporn, P.; Saah, D. (2020) Predictive Analytics for Identifying Land Cover Change Hotspots in the Mekong Region. Remote Sens-ing. 12, 1472. https://doi.org/10.3390/rs12091472 [SERVIR]
24. Potapov, P., Hansen, M. C., Kommareddy, I., Kommareddy, A., Turubanova, S., Pickens, A., Adusei, B., Tyukavina, A., and Ying, Q. (2020) Landsat Analysis Ready Data for Global Land Cover and Land Cover Change Mapping. Re-mote Sensing, 12(3), 426; https://doi.org/10.3390/rs12030426 [SERVIR]
25. Spruce, J., Bolten, J., Mohammed, I. N., Srini-vasan, R., and Lakshmi, V. (2020) Mapping Land Use Land Cover Change in the Lower Mekong Basin From 1997 to 2010. Frontiers in Environ-mental Science. https://doi.org/10.3389/fen-vs.2020.00021 [SERVIR]
26. Thieme, A., Glennie, E., Oddo, P., McCartney, S., Ruid, M., Anand, A. (2020). Application of Remote Sensing for Ex ante Decision Support and Evaluating Impact. American Journal of Evalua-tion. https://doi.org/10.1177/1098214020962579 [DEVELOP]
27. Thieme, A., Yadav, S., Oddo, P. C., Fitz, J. M., Mc-Cartney, S., King, L., Keppler, J., McCarty, G. W., Hively, W. D. (2020). Using NASA Earth obser-vations and Google Earth Engine to map winter cover crop conservation performance in the Ches-apeake Bay watershed. Remote Sensing of Envi-ronment. 248. 111943. https://doi.org/10.1016/j.rse.2020.111943 [DEVELOP]
28. Thomas, E. A., Kathuni, S., Wilson, D., Muragi-jimana, C., Sharpe, T., Kaberia, D., Macharia, D., Kebede, A., Birhane, P. (2020) The Drought Resil-ience Impact Platform (DRIP): Improving Water Security Through Actionable Water Management Insights. Frontiers in Climate. 2:6. https://doi.org/10.3389/fclim.2020.00006 [SERVIR]
29. Tiwari, V., Matin, M. A., Qamer, F. M., Ellen-
A P P E N D I X C. P U B L I C AT I O N S
burg, W. E., Bajracharya, B., Vadrevu, K., Rushi, B. R., Yusafi, W. (2020) Wheat Area Mapping in Afghani-stan Based on Optical and SAR Time-Series Images in Google Earth Engine Cloud Environment. Frontiers in Environmental Science. https://doi.org/10.3389/fen-vs.2020.00077 [SERVIR]
30. Valenti, V., Carcelen, E. C., Lange, K., Russo, N. J., Chapman, B. (2020). Leveraging Google Earth Engine user interface for semiautomated wetland classifica-tion in the Great Lakes Basin at 10m with optical and radar geospatial datasets. IEEE Journal of Selected Topics in Applied Earth Observations and Remote Sensing. 13. 6008-6018. https://doi.org/10.1109/JSTARS.2020.3023901 [DEVELOP]
31. Zhang, X., Fichot, C. G., Baracco, C., Guo, R., Neu-gebauer, S., Bengtsson, Z., Ganju, N., Fagherazzi, S. (2020). Determining the drivers of suspended sediment dynamics in tidal marsh-influenced estuaries using high-resolution ocean color remote sensing. Remote Sensing of Environment. 240. 111628. https://doi.org/10.1016/j.rse.2020.111682 [DEVELOP]

CAPACITY BUILDING PROGRAM 2020 ANNUAL REPORT24
I X . A P P ENDI X D.S E R V I R C O - D E V E L O P M E N T P R O J E C T S U M M A R I E S
ROSES 2018 - SERVIR AST:
UNLOCKING THE POWER OF ACTIVE REMOTE SENSING FOR ECOSYSTEM SERVICES MODELING IN THE AMAZON’S FOREST-AGRICULTURE INTERFACE
AMERICAS: ECOLOGICAL FORECASTING [LAND COVER/LAND USE CHANGE & ECOSYSTEMS]
YEAR 1 HIGHLIGHTS: The team released the Amazon Dashboard & new individual fire data product (to classify fires in near-real time for science & situational awareness), in August 2020 (on GlobalFireData.org). Earth Observatory posted a story on the new Amazon Dashboard data product, which served as key resources for press interest in fires in the Amazon & surrounding biomes.
FORECASTING SEASONAL TO SUB-SEASONAL FIRE & AGRICULTURAL RISK FROM DROUGHT IN AMAZONIA
PRINCIPAL INVESTIGATOR: Douglas Morton, NASA
Goddard Space Flight Center
DESCRIPTION: This project will extend a seasonal fire forecast model to the entire SERVIR-Amazonia domain, develop regional fire products for enhanced situational awareness, & support regional interests in modeling fire progression/spread. Products will include near-real time classification of fire type & estimates of fire spread & CO2 emissions & a seasonal forecast of Fire Season Severity. START ARL: 3
CURRENT ARL: 4
GOAL ARL: 6
END USERS/STAKEHOLDERS: IBAMA, CEMADEN, Embrapa, MINAM, SERFOR, INPE, INDECI, SENAMHI, PNN
YEAR 1 HIGHLIGHTS: The team obtained initial field points from Alianza Cacao & Embrapa to initialize draft maps for Ucayali & Para. Oil palm & cacao maps have been produced by the target sites using manual delineation by agencies in Peru & Brazil. The availability of in situ data & co-developers’ willingness to participate in validation gives confidence that the application is feasible.
PRINCIPAL INVESTIGATOR: Naiara Pinto, NASA Jet
Propulsion Laboratory
DESCRIPTION: This project proposes to infuse active remote sensing observations into existing monitoring pipelines to improve land cover characterization in the Amazon, with a focus on forest-agriculture interfaces. The stakeholders are farmers enrolled in sustainable landscapes initiatives & decision makers in NGOs/govern-ment that support sustainable agriculture practices. The team plans to leverage subnational initiatives in Ucayali , Peru, & Pará, Brazil.
START ARL: 1
CURRENT ARL: 3
GOAL ARL: 6
END USERS/STAKEHOLDERS: PNCBMCC, SERNANP (Peru), Embrapa (Brazil), Alianza Cacao (Peru), Centro de Conservacion, Investigacion, y Manejo de areas Naturales (CIMA, Peru)

CAPACITY BUILDING PROGRAM 2020 ANNUAL REPORT 25
AMERICAS: ECOLOGICAL FORECASTING [LAND COVER/LAND USE CHANGE & ECOSYSTEMS]
END USERS/STAKEHOLDERS: Amazon Conservation Association, Borderland Indigenous Communities/Fed-erations, The Upper Amazon Conservancy, Regional Envi-ronmental Authority in Ucayali, SEMA, Acre Environmental Secretariat, Geospatial Transboundary Group of the South-western Amazon, Director of National Parks in Peru, Ucayali Regional Economic Development Unit, CPI-ACRE, OARU, ProPURUS, SOS Amazonia
QUANTIFYING THE EFFECTS OF FOREST COVER CHANGES ON PROVISIONING & REGULATING ECOSYSTEM SERVICES IN THE SOUTHWESTERN AMAZON
PRINCIPAL INVESTIGATOR: Stephanie Spera,
University of Richmond
DESCRIPTION: This project will characterize changes in forest cover in transboundary region (degradation & deforestation), attribute change to localized changes in hydrologic ecosystem services, generate maps that highlight areas that have undergone changes in micro-climatology & land use, and disseminate the information through trainings, workshops and conferences.
START ARL: 1
CURRENT ARL: 3
GOAL ARL: 7
YEAR 1 HIGHLIGHTS: LandTrendR (NDFI added) CODED & Machine Learning algorithms have been implemented in GEE. Once the team holds an initial mini-training on implementing the algorithm and gets a planned manuscript together, they expect that will get the project to ARL 4.
YEAR 1 HIGHLIGHTS: The team has held a number of virtual engagements with national stakeholder agencies, signed a MOU w/ Senamhi in Peru and are making progress towards MOUs with IDEAM in Colombia & CEMADEN in Brazil. An MOU was also signed with UTEC in Peru. The team helped Senamhi use RAPID and the same watershed and river net-work used by GEOGloWS to create their national hydrologic forecast, & have been working on methods for validation and bias correction that should allow comparisons w/their new model formulation. During 2020, the project team held ongoing discussion with IDEAM to integrate the forecasts in their national system, & expect to make progress there before the next rainy season.
PRINCIPAL INVESTIGATOR: Jim Nelson, Brigham
Young University
DESCRIPTION: This project will extend the team’s global streamflow forecasting techniques and tools to flood delineation & impact, & will focus on the goal of reducing loss of life & property due to flood damage. They will partner with developers across the SERVIR-Amazonia hub to apply these applications in the region.
START ARL: 3
CURRENT ARL: 5
GOAL ARL: 8
END USERS/STAKEHOLDERS: Senamhi (Peru), IDEAM (Colombia), CEMADEN (Brazil), Red Cross/Cruz Roja
A P P E N D I X C. P U B L I C AT I O N S
AMERICAS: WATER + DISASTERS [WATER & WATER-RELATED DISASTERS]
IMPROVING RESILIENCY & REDUCING RISK OF EXTREME HYDROLOGIC EVENTS THROUGH APPLICATION OF EARTH OBSERVATIONS & IN SITU MONITORING INFO

CAPACITY BUILDING PROGRAM 2020 ANNUAL REPORT26
ASIA & OCEANIA: WEATHER & CLIMATE
END USERS/STAKEHOLDERS: Nepal Department of Environment, India’s Central Pollution Control Agency, National Environment Commission of Bhutan, Pakistan Environment Protection Agency
ADVANCING AIR QUALITY MONITORING AND PREDICTION CAPABILITIES IN THE HINDU-KUSH HIMALAYAN (HKH) REGION
PRINCIPAL INVESTIGATOR: Emily Berndt, NASA
Marshall Space Flight Center. Science PI: Aaron Naeger
DESCRIPTION: This project will fuse information from state-of-the-art satellite sensors for developing compre-hensive aerosol and trace gas products that advance realtime monitoring capabilities over the HKH region; assim-ilate satellite products into a unique modeling framework for providing accurate AQ, fog and smog, and temperature and stability forecasts; will utilize the data-assimilated model analysis fields for initializing a lagrangian trajectory model to aid in rapid response to extreme aerosol and AQ events. The team will implement aerosol and AQ satellite datasets & model forecasts into applicable DSS for the region, and develop customized end-user training.
START ARL: 2
CURRENT ARL: 3
GOAL ARL: 7
YEAR 1 HIGHLIGHTS: Components of the Air Quality system have been developed with the data of interest and preliminary validation is underway. The team produced the AMI nighttime microphysics RGB product, conducted initial validation work and user guide development, completed development of baseline WRF-Chem configuration (no data assimilation), and test runs with a March 2020 dust event.
YEAR 1 HIGHLIGHTS: A full end-to-end Surface Water Mapping chain was implemented and validated. Flood Mapping supported the 2020 South Asia Monsoon event. The team has integrated prototype versions of all intend-ed products into the same platform so that they can be exercised and tested together. A prototype version of the flood depth product is also implemented and first valida-tions were performed for areas in Bangladesh. The flood extent product was used to support responses in Alaska (2020 Spring breakup flooding) and Bangladesh (Cyclone Amphan).
PRINCIPAL INVESTIGATOR: Franz Meyer, University of
Alaska, Fairbanks
DESCRIPTION: This project will build a cloud-based HydroSAR system, featuring automatic processing of SAR data from Sentinel-1 & NISAR; will implement hydrologyrelevant Level-3 products (RTC30, HYDRO30, FD30, AG100, AG100-IN); conduct performance assessments, & transi-tion HydroSAR to in-region partners.
START ARL: 3
CURRENT ARL: 4
GOAL ARL: 7
END USERS/STAKEHOLDERS: Department of Hydrology and Meteorology (DHM), Nepal; Ministry of Home Affairs (MOHA), Nepal; Flood Forecasting and Warning Centre (FFWC), Bangladesh; National Center for Hydrology & Meteorology (NCHM), Bhutan
A P P E N D I X C. P U B L I C AT I O N S
A CLOUD COMPUTING TOOLBOX FOR SAR-BASED MONITORING OF THE HYDROLOGIC CYCLE IN THE SERVIR HINDU-KUSH HIMALAYAN REGION

CAPACITY BUILDING PROGRAM 2020 ANNUAL REPORT 27
ASIA & OCEANIA: FOOD SECURITY & AGRICULTURE
END USERS/STAKEHOLDERS: Department of Agriculture, Nepal; Ministry of Agriculture (Bangladesh and Pakistan); CIMMYT, Individual Farmers.
REMOTE SENSING & AGRO-GEOINFORMATICS BASED PRODUCTS AND SERVICES FOR SUPPORTING AGRO-DECISION MAKING IN HINDU-KUSH-HIMALAYAN REGION
PRINCIPAL INVESTIGATOR: Liping Di, CSISS, George
Mason University
DESCRIPTION: The goal of the project is to transfer agro-geoinformatic technologies/service systems to the SERVIR-HKH hub, to enhance the capacity in agricultural & food security decision-making at national /regional levels in the HKH region, specifically Bangladesh, Nepal and Pakistan. The project is achieving its goal by adapting & migrating USDA operational products/services to the hub, improving accuracies in crop mapping, condition monitor-ing, & acreage/yield estimation with remote sensing data.
START ARL: 3
CURRENT ARL: 3
GOAL ARL: 9
YEAR 1 HIGHLIGHTS: The project’s GeoFairy app has been beta-tested/published in Apple & Google Play stores. The app has demonstrated significant improvement for obtaining useful EO information & for product validation & ground truth collection by users. It has been validated & ready to be used in the field, and other products/services have been prototyped for Nepal.
A P P E N D I X C. P U B L I C AT I O N S
END USERS/STAKEHOLDERS: Mekong River Commission, Vietnam Academy of Water Resources, Institute for Agricultural Environment (IAE), and the Institute of Water Resource Planning
ENHANCEMENT OF THE RHEAS CAPABILITIES FOR MONITORING/FORECASTING OF SEASONAL RICE CROP PRODUCTIVITY FOR THE LOWER MEKONG BASIN COUNTRIES
PRINCIPAL INVESTIGATOR: Narendra Das, NASA Jet
Propulsion Laboratory, now at Michigan State University
DESCRIPTION: This project is being implemented in the SERVIR-Mekong hub at the Asian Disaster Preparedness Center (ADPC). There are six specific tasks: 1) Increasing spatial resolution of the RHEAS framework from 25 km to 5 km; 2) Inclusion of the latest high-resolution GlobalSoil Grid250m data, 3) Calibration tool for the RHEAS M-DSSAT model; 4) GUI to ingest important farm management practice data, 5) Tool to determine thte rice planting date; 6) Tool to generate customized reports for stakeholders, and prepare training materials.
START ARL: 7
CURRENT ARL: 7
GOAL ARL: 9
YEAR 1 HIGHLIGHTS: All planned tasks are on schedule. Soil, vegetation, landcover, DEM, and snowband files were created at 5 km resolution, & a Python GUI was developed to create RHEAS Ancillary files, for the entire world. Test-ing was conducted successfully on the 5 km RHEAS Setup installed at ADPC, and this is being integrated with the ADPC website.
CAPACITY BUILDING PROGRAM 2020 ANNUAL REPORT28
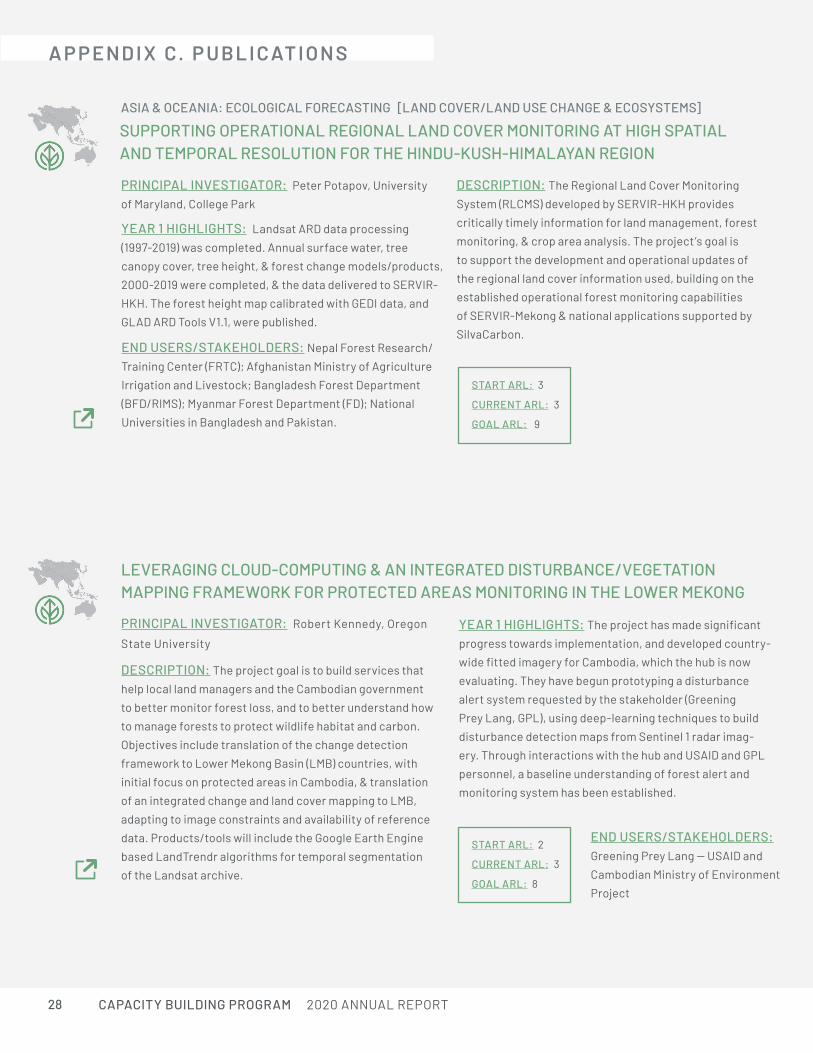
LEVERAGING CLOUD-COMPUTING & AN INTEGRATED DISTURBANCE/VEGETATION MAPPING FRAMEWORK FOR PROTECTED AREAS MONITORING IN THE LOWER MEKONG
ASIA & OCEANIA: ECOLOGICAL FORECASTING [LAND COVER/LAND USE CHANGE & ECOSYSTEMS]
YEAR 1 HIGHLIGHTS: Landsat ARD data processing (1997-2019) was completed. Annual surface water, tree canopy cover, tree height, & forest change models/products, 2000-2019 were completed, & the data delivered to SERVIR-HKH. The forest height map calibrated with GEDI data, and GLAD ARD Tools V1.1, were published.
SUPPORTING OPERATIONAL REGIONAL LAND COVER MONITORING AT HIGH SPATIAL AND TEMPORAL RESOLUTION FOR THE HINDU-KUSH-HIMALAYAN REGION
PRINCIPAL INVESTIGATOR: Peter Potapov, University of Maryland, College Park
START ARL: 3
CURRENT ARL: 3
GOAL ARL: 9
END USERS/STAKEHOLDERS: Nepal Forest Research/Training Center (FRTC); Afghanistan Ministry of Agriculture Irrigation and Livestock; Bangladesh Forest Department (BFD/RIMS); Myanmar Forest Department (FD); National Universities in Bangladesh and Pakistan.
YEAR 1 HIGHLIGHTS: The project has made significant progress towards implementation, and developed country-wide fitted imagery for Cambodia, which the hub is now evaluating. They have begun prototyping a disturbance alert system requested by the stakeholder (Greening Prey Lang, GPL), using deep-learning techniques to build disturbance detection maps from Sentinel 1 radar imag-ery. Through interactions with the hub and USAID and GPL personnel, a baseline understanding of forest alert and monitoring system has been established.
PRINCIPAL INVESTIGATOR: Robert Kennedy, Oregon
State University
DESCRIPTION: The project goal is to build services that help local land managers and the Cambodian government to better monitor forest loss, and to better understand how to manage forests to protect wildlife habitat and carbon. Objectives include translation of the change detection framework to Lower Mekong Basin (LMB) countries, with initial focus on protected areas in Cambodia, & translation of an integrated change and land cover mapping to LMB, adapting to image constraints and availability of reference data. Products/tools will include the Google Earth Enginebased LandTrendr algorithms for temporal segmentation of the Landsat archive.
START ARL: 2
CURRENT ARL: 3
GOAL ARL: 8
END USERS/STAKEHOLDERS: Greening Prey Lang -- USAID and Cambodian Ministry of Environment Project
A P P E N D I X C. P U B L I C AT I O N S
DESCRIPTION: The Regional Land Cover Monitoring System (RLCMS) developed by SERVIR-HKH provides critically timely information for land management, forest monitoring, & crop area analysis. The project’s goal is to support the development and operational updates of the regional land cover information used, building on the established operational forest monitoring capabilities of SERVIR-Mekong & national applications supported by SilvaCarbon.

CAPACITY BUILDING PROGRAM 2020 ANNUAL REPORT 29
END USERS/STAKEHOLDERS: Greening Prey Lang -- USAID and Cambodian Ministry of Environment Project
ASIA & OCEANIA: WATER + DISASTERS [WATER & WATER-RELATED DISASTERS]
YEAR 1 HIGHLIGHTS: The project started discussions with MRC toward potential implementation of Forecasting Inundation Extents using REOF analysis (FIER) in the Lower Mekong, conducted a SWOT Early Adopter virtual hackathon at the University of Washington, & implemented FIER over TSL through the Tethys Hackathon. Preliminary FIER results obtained over the entire Lower Mekong were presented at AGU Fall Meeting 2020.
PRINCIPAL INVESTIGATOR: Hyongki Lee, University
of Houston
DESCRIPTION: This project will continue building new & improved services to be co-developed with the SERVIRMekong hub (based on identified stakeholders’ urgent & real needs), in order to provide missing pieces of info on the real-time availability of water for the entire Lower Mekong & its inhabitants. Objectives include operational hindcast/forecast of inundation extents in the Lower Mekong, operational Real-time Reservoir Monitoring System for All Dams in Mekong, and updating the opera-tional Virtual Stream Gauge Data Service.
START ARL: 5
CURRENT ARL: 6
GOAL ARL: 8
END USERS/STAKEHOLDERS: RFDMC (MRC), Ministry of Water Resources & Meteorology (MOWRAM) of Cambodia, Vietnam Meteorological Hydrolog-ical Administration (VMHA)
A P P E N D I X C. P U B L I C AT I O N S
OPERATIONAL SERVICES FOR WATER, DISASTERS & HYDROPOWER APPLICATIONS FOR LOWER MEKONG POPULATIONS USING NASA EARTH OBSERVATIONS & MODELS
YEAR 1 HIGHLIGHTS: The project has made progress on the prototype of the LHASA-Mekong model and have two prototypes developed, and are working with the hub to demonstrate the potential options. The team will be implementing the model in a Google Cloud environment as well as a version accessible for training purposes through GEE. The landslide inventories continue to be an important part of model evaluation. The team has identi-fied new landslide mapping sites in Northern Vietnam, & produced four new landslide inventories of the Mekong region--in total there are now five inventories.
PRINCIPAL INVESTIGATOR: Dalia Kirschbaum, NASA
Goddard Space Flight Center
DESCRIPTION: This project aims to enable informed decision making on landslide hazard/risk, leveraging EO data, & will build the capacity of regional/national agencies & other stakeholders to increase situational awareness & support preparedness activities. The project will create a suite of products/services that will inform comprehensive landslide characterization/awareness in the region.
START ARL: 3
CURRENT ARL: 4
GOAL ARL: 8
END USERS/STAKEHOLDERS: Asian Disaster Preparedness Center (ADPC), Department of Mineral Resources (DMR), Thailand , Vietnam Institute of Geosciences and Mineral Resources (VIGMR), Regional Capacity Enhancement for Landslide Impact Mitigation
(RECLAIM) Network.
A LANDSLIDE HAZARD AND RISK ASSESSMENT SYSTEM FOR SERVIR-MEKONG

CAPACITY BUILDING PROGRAM 2020 ANNUAL REPORT30 30
YEAR 1 HIGHLIGHTS: The groundwater pumping data is presently being used by decision makers in Kenya & Ethiopia to allocate resources for groundwater system management. FEWS Net predictor, visualization of preliminary groundwater maps in Tethys were implement-ed. A prototype groundwater demand system has been demonstrated and integrated with remote sensing and sensor data with statistical cross validation.
PRINCIPAL INVESTIGATOR: Evan Thomas, University
Of Colorado, Boulder
DESCRIPTION: Millions of people living in the Horn of Africa face water insecurity as droughts are more severe and frequent. Drought-driven humanitarian emergencies can be prevented if groundwater is reliably made avail-able at strategic locations during cycles of water stress. DRIP - The Drought Resilience Impact Platform, combines early detection and planning with proactive groundwater management.
START ARL: 3
CURRENT ARL: 4
GOAL ARL: 6
END USERS/STAKEHOLDERS: Kenya National Drought Management Authority; Millennium Water Alliance; Ethiopia Ministry of Water, Irrigation and Energy; Intergovernmental Authority on Development Climate Prediction & Applications Center (ICPAC); Famine Early Warning Systems Network (FEWS NET)
A P P E N D I X C. P U B L I C AT I O N S
IN-SITU DATA COLLECTION WITH REMOTE SENSING FOR MACHINE LEARNING PARAMETER ESTIMATES AND IMPROVED HYDROLOGIC MODELS FOR FLOOD, DROUGHT AND AGRICULTURAL YIELD FORECASTING
YEAR 1 HIGHLIGHTS: Significant progress was made in Q2 2020. The water level mapper & GRACE subsetting apps are relatively mature. Modifications are being made to the water level mapping app to broaden its capabili-ties and customize it for users in West Africa, but have a strong foundation to build on.
PRINCIPAL INVESTIGATOR: Norm Jones, Brigham
Young University
DESCRIPTION: Proper management of groundwater resources is essential for regions like West Africa that are susceptible to drought. This project will assist local users in characterizing their groundwater resources & planning how to develop them sustainably going forward.
START ARL: 3
CURRENT ARL: 3
GOAL ARL: 8
END USERS/STAKEHOLDERS: Directorate General of Water Resources (DGRE): Ministry of Water Resources/Sanitation; Niger Basin Authority; National Water Partnership; rural communities, coopera-tives, farmers’ organizations.
GEOSPATIAL INFORMATION TOOLS THAT USE MACHINE-LEARNING TO ENABLE SUSTAINABLE GROUNDWATER MANAGEMENT IN WEST AFRICA
AFRICA: WATER + DISASTERS [WATER & WATER-RELATED DISASTERS]

CAPACITY BUILDING PROGRAM 2020 ANNUAL REPORT 31
SUPPORTING CONTINUOUS MONITORING & SAMPLE-BASED ESTIMATION OF LAND CHANGE & FOREST DEGRADATION IN WEST AFRICA
AFRICA: ECOLOGICAL FORECASTING [LAND COVER/LAND USE CHANGE & ECOSYSTEMS]
YEAR 1 HIGHLIGHTS: The project now has two good test cases/districts, with preliminary land cover classi-fication maps for the two Districts using Google Pro for ground truth, an inventory of existing remote sensing data is completed, with continued inventory of the existing District level data/processing & has completed the initial round of developing customized Processing Algorithms, which are essential for creating land use suitability models in QGIS.
LINKING DEFORESTATION, URBANIZATION, & AGRICULTURAL EXPANSION FOR LAND USE DECISIONS IN GHANA
PRINCIPAL INVESTIGATOR: Jasmeet Judge, University of Florida, Gainesville
START ARL: 2
CURRENT ARL: 3
GOAL ARL: 7
END USERS/STAKEHOLDERS: Land use and spatial planning authority (LUSPA); National Development and Planning Agency; Atiwa District Assembly; Twifo-Hemang Lower Denkyira Assembly; Ashanti Akim Central District
YEAR 1 HIGHLIGHTS: Version 1 of the NASA MEASURES (GLANCE) dataset of land cover and land cover change has been completed for the whole continent of Africa. Tools running in Google Earth Engine that allow users to extract maps & examine time series have been implemented and shared with the hub. In June, PI Olofsson gave a webinar on the GLanCe datasets and data access tools.
PRINCIPAL INVESTIGATOR: Pontus Olofsson,
Boston University
DESCRIPTION: The objective of this project is to enhance the capacity in West African countries to address obstacles to sustainability and effective decision-making by providing direct access to tools & datasets for consistent monitoring of deforestation, forest degradation, land cover and land change. The project will provide access to a global dataset of land cover & land change (NASA MEaSUREs/GLanCE) that is hierarchical and customizable via a set of tools in Google Earth Engine.
START ARL: 4
CURRENT ARL: 4
GOAL ARL: 9
END USERS/STAKEHOLDERS: Permanent Inter-State Committee for Drought Control in the Sahel (CILSS); the Agriculture, Hydrology & Meteorology(AGRHYMET) Regional Center; hub consortium partners, with support from Tetra Tech, Inc.; and governments of SERVIR-West Africa countries.
A P P E N D I X C. P U B L I C AT I O N S
DESCRIPTION: Ghana consists of 18% of the remaining Upper Guinean forest, that continue to be vulnerable to deforestation. The specific objectives of the project are to: (i) investigate linkages among deforestation, urbanization, and agricultural expansion in Eastern and Ashanti Regions, (ii) integrate these trends & linkages with a GIS-based, opensource land use planning framework (LUPMISPlus) in the two regions; & (iii) build local capacity in the use of remote sensing, GIS tools, and the land use planning framework for sustaining these efforts beyond the lifetime of this project.

CAPACITY BUILDING PROGRAM 2020 ANNUAL REPORT32 32
A P P E N D I X C. P U B L I C AT I O N S
END USERS/STAKEHOLDERS: Kenya Ministry of Agriculture; Kenya Agricultural & Live-stock Research Organization (KALRO); Office of the Prime Minister, Uganda Ministry of Agriculture; Tanzania Ministry of Agriculture; East Africa Grain Council; East Africa Com-munity; IGAD Climate Predictions and Applications Center (ICPAC).
EARTH OBSERVATION FOR NATIONAL AGRICULTURAL MONITORINGPRINCIPAL INVESTIGATOR: Catherine Nakalembe,
Department of Geographical Sciences, University of
Maryland, College Park
DESCRIPTION: This project will document the status of existing national agricultural monitoring systems and improve baseline datasets for in-season crop monitoring. Yield modeling using coarse resolution data sets will be complimentary to on-going work with RHEAS, and the team will coordinate with other Agriculture & Food Security ASTs to broaden impact. The team will develop a scalable field-data collection strategy for smallholder agriculture in E&SA, and establish a Joint Experiment for Crop Assess-ment and Monitoring (JECAM) site.
START ARL: 3
CURRENT ARL: 3
GOAL ARL: 7
YEAR 1 HIGHLIGHTS: Operational National Crop Monitors in Kenya, Uganda and Tanzania, as well as one in develop-ment in Rwanda, were implemented after clear character-ization of the decision-making process. A manuscript on the status of current systems is also in preparation, and the Kenya Cropland 2019 Map was completed. GEOCIF outputs have been implemented in the crop monitor for early warning and used for monthly monitoring and are now accessible for Kenya, Uganda, and Tanzania at the province level. There is strong support from the Kenya Ministry of Agriculture and Agricultural organizations for project products to support Food Balance Sheet calculations, yield modeling, and crop insurance programs. Continued collaboration with AST PI Davenport on yield model evaluation.
END USERS/STAKEHOLDERS: RCMRD, ICPAC, FEWS NET
USING EARTH OBSERVATIONS AND STATISTICAL MODELS TO ENHANCE DROUGHT, FOOD SECURITY, & AGRICULTURAL OUTLOOKS IN EASTERN & SOUTHERN AFRICA
PRINCIPAL INVESTIGATOR: Frank Davenport,
University of California, Santa Barbara
DESCRIPTION: Project objectives are to develop Decision Support Tools that translate Earth Observation Products into improved drought, agricultural mapping, and agricultural monitoring services; enable regional analysts to bridge the gap between EO products and grain production outcomes; & implement the tools and capacity building infrastructure within the regional hub.
START ARL: 3
CURRENT ARL: 4
GOAL ARL: 8
YEAR 1 HIGHLIGHTS: A prototype yield forecasting report was developed and shared with RCMRD and some select stakeholders (FEWS NET field scientists). Additional pro-totype elements are still being developed. The team began development of an interactive interface (modified RHEAS viewer), which is continuing & has expanded to new countries. The project began development of Somalia forecasts, and team members met with Catherine Nakalembe and her team to plan coordinated forecasts.
AFRICA: FOOD SECURITY & AGRICULTURE

CAPACITY BUILDING PROGRAM 2020 ANNUAL REPORT 33
A P P E N D I X C. P U B L I C AT I O N S
YEAR 1 HIGHLIGHTS: In collaboration with the hub, the project is conducting an analysis to examine the relationship between subseasonal climate and food insecurity in West Africa. Results were presented at the AGU Fall Meeting 2020. The project team has imple-mented climatology-based subseasonal forecasts as a benchmark and developed a prototype product for crop water stress forecasting, and are currently working on determining the potential of some of these products.
PRINCIPAL INVESTIGATOR: Shraddhanand Shukla,
University of California, Santa Barbara
DESCRIPTION: The objective of the project is to improve West African climate information services by co-developing a 21st century Agro-pastoral Water Deficit Prediction System (21cAWDPS) to improve: 1) agricultural and rangeland pro-ductivity, 2) agro-pastoral water usage, and 3) transhumant movement management in West Africa.
START ARL: 3
CURRENT ARL: 4
GOAL ARL: 9
END USERS/STAKEHOLDERS: AGRHYMET, ACMAD, CILSS, National Meteo rological agencies, Niger Basin Authority, ECOWAS; Ministries of Agricultural and/or Animal Husbandry and Water resources ministries; WA-WASH Project and Action Against Hunger; ICRAF, AfDB, UNECA, WFP, UNHCR, USAID and UNICEF.
CONNECTING WEST AFRICA USERS TO CUTTING EDGE RESOURCES: INTEGRATING EO & CLIMATE FORECASTS TO ENHANCE AGRICULTURAL/PASTORAL WATER-MANAGEMENT DECISION-MAKING USING AGRO-PASTORAL WATER DEFICIT PREDICTIONS
END USERS/STAKEHOLDERS: RCMRD, ILRI, Northern Rangelands Trust (NRT), Livestock/range sectors.
RANGE MONITORING FOR DECISION SUPPORT, PASTORAL LIVELIHOODS & FOOD SECURITY IN ARID & SEMI-ARID EAST AND SOUTHERN AFRICA
PRINCIPAL INVESTIGATOR: Niall Hanan, New Mexico
State University
START ARL: 3
CURRENT ARL: 4
GOAL ARL: 8
YEAR 1 HIGHLIGHTS: A virtual stakeholder workshop provided feedback on the alpha-version of a Sentinel-1 and -2 canopy cover mapping tool for Kenyan rangelands, using GEE and CEO derived plot data. The team developed a GEE tool and updated analysis using MODIS Collection 6 for LAI partitioning for improved wet season forage monitoring. A new workflow for efficient processing of large samples of VHR imagery, that provides critical calibration and validation data, has been developed. The dry season forage monitoring application, also being implemented in GEE, will inform dry season forage progression from green, to dry biomass and eventually to low biomass/bare soil—critical for livestock survival in the dry season.
DESCRIPTION: The team is mapping woody canopy cover in East and Southern Africa (E&SA) at medium-high (sub-100m) resolution. Objectives include wet season woody and herbaceous forage production and anomalies in E&SA rangelands, based on LAI partitioning algorithm; dry season dry forage dynamics and anomalies in E&SA range-lands, based on weekly green and dry (senescent) biomass monitoring; and forage forecasting, based on short-term weather forecasts, growth / senescence models.
AFRICA: WEATHER & CLIMATE

CAPACITY BUILDING PROGRAM 2020 ANNUAL REPORT34
CAPACITY BUILDING PROGRAM
For more Earth Observation Imagery, visit: https://earthobservatory.nasa.gov/