Embed Size (px)
Citation preview

National Aeronautics and Space Administration
A PUBLICATION OF THE EARTH OBSERVING SYSTEM DATA AND INFORMATION SYSTEM (EOSDIS), CODE 423
UpdateEOSDISSUMMER 2017
Earth Science Data and Information System (ESDIS) Project
TOP STORIESEvolving NASA Earth Science Data and Services to the Cloud ............................. 1
Collecting Data from the Ground Up: NASA’s Ground Validation Field Campaigns ............................................ 4
Enhancing the Discoverability of NASA Earth Science Data through Digital Object Identifiers (DOIs) .................................... 8
DATA USER PROFILESDr. Michael Dietze ................................ 13
Dr. Karen Seto ..................................... 13
Dr. Brian Mapes ................................... 13
ANNOUNCEMENTSNew Worldview Features make it Easier to Explore All of Fiji (and the Rest of the World) ............................................ 14
2017 NASA Space Apps Challenge a Huge Success ...................................... 15
EOSDIS Data and Services Begin Migration to the Cloud ........................ 17
NASA EARTHDATA WEBINARS .................................... 18
DATA RECIPES ............................. 19
LATEST NASA EARTHDATA IMAGES ................ 20
IN THIS ISSUE:TOP STORIES
Evolving NASA Earth Science Data and Services to the CloudNASA’s Earth Observing System Data and Information System (EOSDIS)
is in the middle of a critical project prototyping, testing, and evaluating a significant change in the way data users access and use NASA Earth Observation (EO) data. Ironically, data users likely will not even notice if this change is implemented. What they will notice is more efficient access to more data and the ability to do more with these data.
The change being considered is moving EOSDIS data to the cloud. This move would not only be a logical technical evolution for EOSDIS, but also a proactive effort to provide broader acces to a data archive that is expected to grow significantly over the next several years.
Between 2017 and 2022, the ingest rate of data into the EOSDIS archive is projected to grow from the current 3.9 petabytes (PB) per year to as much as 47.7 PB per year, according to esti-mates from NASA’s Earth Science Data Systems (ESDS) Program. As this
Between 2017 and 2025, the volume of data in the EOSDIS archive (blue area) is expected to grow dramatically, accompanied by an order of magnitude increase in the rate of data ingest (red area). To put the enormous amount of data represented by this figure into perspective, 1 petabyte (PB) has been described as the data equivalent of roughly 20 million four-drawer file cabinets filled with text. EOSDIS is continually evolving its data systems to accommodate these expanding data and user requirements. NASA EOSDIS graphic.
Unless otherwise noted, all articles written by Josh Blumenfeld, EOSDIS Science Writer.

EOSDIS UPDATE Summer 20172
ingest rate increases, the volume of data in the EOSDIS archive also is expected to grow—from nearly 22 PB to-day to more than 37 PB by 2020; by 2025, the volume of data in the EOSDIS archive is expected to be more than 246 PB.
This anticipated growth in both the EOSDIS data ingest rate as well as th overall archive volume pose new challenges for distributing and analyzing data that currently are stored and disseminated through physical servers on-premises at EOSDIS Distributed Active Archive Centers (DAACs). To address these challenges, EOSDIS is examining the effectiveness of using a commercial cloud to ingest, archive, process, distribute, and manage the anticipated large volumes of new mission data. Placing the EOSDIS archive collectively in the cloud will, for the first time, place NASA EO data “close to compute” and improve management and accessibility of these data while also expediting science discovery for data users. Key EOSDIS services such as the Common Metadata Repository (CMR) (CMR) and Earthdata Search already are in the cloud; moving EOSDIS data to the cloud is a logical next step in this evolution.
EOSDIS has numerous motivations for investigating the use of the cloud for NASA EO data, including:
• The expected significant growth of data in the EOSDIS archive and the NASA requirement to provide these data efficiently and rapidly to worldwide data users;
• The need for EOSDIS to have a cost effective, flexible, and scalable data system with ingest, archive, processing, and distribution solutions that can keep pace with mission advancements and capabilities; and
• The need for data users to efficiently access and process significantly larger data volumes from multiple sources.
The complexity of EO data makes it impossible to simply move these data en masse into the cloud. Rather, the EOSDIS is developing new technologies, services, and architectures—all of which must be thoroughly tested and evaluated—to ensure that these data can work seamlessly in this environment.
Before looking at the potential benefits the cloud brings to EOSDIS and EOSDIS data users, it is important to understand what is meant by “cloud computing.” The National Institute of Standards and Technology (NIST) defines cloud computing as “a model for enabling ubiquitous, convenient, on-demand network access to a shared pool of configurable computing resources (e.g., networks, servers, storage, applications, and services) that can be rapidly provisioned and released with minimal management effort or service provider interaction.” As NIST notes, cloud computing includes five essential characteristics: on-demand self-service, broad network access, resource pooling, rapid elasticity, and measured service.
The cloud can be commercial (i.e., a pay-per-use system provided through a public cloud provider such as Amazon Web Services [AWS] or Microsoft Cloud) or on-premises (e.g., a local system housed at a business, organization, or agency). A key aspect of a commercial cloud is the vast capacity this type of system provides over an on-premise system.
For NASA EO data, a commercial public cloud offers advantages to data users. For one, a commercial system allows non-NASA users to access NASA-managed archives without the need to download data—an important consideration for enabling research using the tremendous EOSDIS archive. In addition, having EOSDIS data in the cloud enables these data to be stored collectively and accessed more easily by users, who can then more efficiently use data from multiple DAACs.
Having EOSDIS data in the cloud will not change existing methods of user interaction with these data; it will, however, offer new methods of access not otherwise possible with on-premises platforms. To see how this might work, we will first look at how the current EOSDIS data system provides data archiving and dissemination and then examine the potential benefits the cloud provides.
Under NASA’s full and open data policy, all NASA mission data (along with the algorithms, metadata, and documentation associated with these data) must be freely available and provided to the public as soon as possible following a checkout period to ensure data accuracy and validity; there is no period of exclusive data use. NASA’s

EOSDIS UPDATE Summer 20173
EOSDIS provides end-to-end capabilities for managing NASA’s EO data, including data archive, management, and distribution; information management; product generation; and user support services. These services are managed by NASA’s Earth Science Data and Information System (ESDIS) Project.
EOSDIS data currently are stored on-premises at discipline-specific Distributed Active Archive Centers (DAACs), which archive and disseminate data. In addition, Science Investigator-led Processing Systems (SIPS) also process mission-specific data and deliver these data to the appropriate DAAC for archiving and dissemination.
EOSDIS is in the middle of a year-long effort testing various ways data might be archived and disseminated in the cloud. EOSDIS requires that any cloud system must be able to provide services in four key areas:
1. Data archive: The system must preserve and protect NASA EO data;
2. Data management: The system must meet the development and execution of information lifecycle needs of NASA mission-based Earth science data sets;
3. Data ingest: The system must support multi-mission, multi-discipline data ingest; and
4. Data distribution: The system must support distribution of data, subsetting, and visualization, and must be adaptable to future technologies.
5. Ideally, the system also will enable large-scale data analytics for data users.
NASA’s Office of the Chief Information Officer (OCIO) has chosen Amazon Web Services (AWS) as the source of general-purpose cloud services for NASA, and EOSDIS and the DAACs are building and testing prototypes to ensure that EOSDIS data and services will work successfully on this commercial cloud platform.
Having EOSDIS data in the cloud brings numerous benefits for both data users and EOSDIS, including:
• Easy access: Data users will be able to access data directly in the cloud, removing the need to download volumes of data for use;
• Rapid deployment: With an established EOSDIS cloud platform, data users can bring their algorithms and processing software to the cloud and work directly with the data in the cloud, simplifying procurement and hardware support while expediting science discovery;
• Scalability: The size and use of the archive can expand easily and rapidly as needed;
• Flexibility: Mission needs can dictate options for selecting operating systems, programming languages, databases, and other criteria to enable the best use of mission data; and
Cost effectiveness: EOSDIS and NASA pay only for the storage and services actually used. Along with scalability benefits, this allows the amount of storage or services to be continually adjusted to ensure that data and services are effectively provided at the lowest possible cost to NASA and EOSDIS.
With the expected significant growth of NASA EO data archived by EOSDIS, moving these data to a commercial cloud can provide greater efficiency for storing and disseminating these data. It’s important to note even if EOSDIS data are stored and disseminated in the cloud,
Over the next five years, the daily ingest of data into the EOSDIS archive is expected to grow significantly, to more than 131 terabytes (TB) of forward processing. Note that this illustration does not include bulk processing, which could create spikes of 400 TB or more per day. 1000 TB = 1PB. NASA EOSDIS image.

EOSDIS UPDATE Summer 20174
key aspects of EOSDIS data and services will not change. For example, the DAACs will still serve as gateways to these data and provide a wide range of support services for data users. In fact, it’s likely that EOSDIS data users will not notice any difference in their interactions with the DAACs when searching for and downloading data stored in the cloud. What data users will notice is improved access to data and the ability to more efficiently utilize larger data sets for a broader range of research.
EOSDIS is still evaluating the technical and architectural aspects of this significant evolution, and this will continue over the next several months. The needs of data users remain a top EOSDIS priority, and the innovative technologies being developed by EOSDIS to archive and disseminate data in the cloud may soon enable data users to do more with this valuable resource than ever before. n
Collecting Data from the Ground Up: NASA’s Ground Validation Field CampaignsGround validation campaigns connect the dots between what is being remotely-sensed by a satellite instrument and ongoing Earth processes.
What do a mule and a DC-8 jet aircraft have in common? Aside from the fact that both can be
difficult to manage, mules and NASA’s DC-8 played important roles in the success of the recent Olympic Mountains Experiment, or OLYMPEX, ground validation (GV) field campaign. Data from this campaign, conducted November 2015 to February 2016 in remote wilderness areas of Washington State’s Olympic Peninsula, are helping to validate data collected by the joint NASA/Japan Aerospace Exploration Agency Global Precipitation Measurement (GPM) Core Observatory. OLYMPEX data also are providing valuable insights into how complex topography affects mid-latitude precipitation produced in the large storm systems typical of the northeast Pacific Ocean and Pacific Northwest.
Almost 2,500 km southeast of the Olympic Peninsula, in the rolling farmland of Iowa, aircraft and field instruments were used to assess the accuracy of data collected by NASA’s Soil Moisture Active Passive (SMAP) satellite. Results from this May to August 2016 field campaign, called the SMAP Validation Experiment 2016, or SMAPVEX16, are helping improve SMAP’s soil moisture collection algorithms.
OLYMPEX, SMAPVEX16, and similar campaigns are vital components of NASA Earth observing missions. “I use the term ‘Rosetta Stone’ at times to talk about field campaigns,” says Dr. Walt Petersen, the NASA GPM Deputy Project Scientist for Ground Validation. “Like the Rosetta Stone, field campaigns give us the information we need to translate remotely-sensed satellite instrument data into what’s actually being observed on Earth.”
While GV campaigns can take years to prepare and coordinate, the time invested provides a valuable additional source of data about Earth processes and helps ensure that remotely-sensed data from orbiting missions are as accurate as possible. GPM and SMAP are two missions with ongoing GV campaigns and are examples of the challenges—as well as the numerous benefits—of conducting these field investigations.
The Olympic Mountains Experiment (OLYMPEX)
Few areas in the continental U.S. are more conducive for studying precipitation than the Olympic Peninsula. Sitting on the northwest coast of Washington State and jutting into the Pacific
Ocean, the peninsula is not only the wettest place in the contiguous U.S., but also home to the only temperate old growth rain forest in the contiguous U.S. According to research by Daly, et al., based on Parameter-elevation Relationships on Independent Slopes Model (PRISM) precipitation data, windward slopes near the Olympic crest can receive 6,000 to 7,000 mm of precipitation a

EOSDIS UPDATE Summer 20175
year—that’s more than 19 feet of precipitation.
The GPM Core Observatory launched on 27 February 2014 and collects precipitation data between roughly 65˚ north and south latitude from onboard instruments and helps calibrate precipitation data from multiple orbiting precipitation satellites. OLYMPEX was the last of several larger GPM GV campaigns.
The idea for a campaign like OLYMPEX was first proposed about 10 years ago by Dr. Robert A. Houze, Jr., Professor of Atmospheric Sciences at the University of Washington. Dr. Houze served as the OLYMPEX Principal Investigator (PI) and was one of three operations directors (along with Dr. Walt Petersen and Dr. Lynn McMurdie, Senior Research Scientist at the University of Washington). The years of planning for this three-month campaign included coordinating not only instrument installation locations, but also obtaining permissions from a variety of state, federal, and Native American agencies to gain access to remote field sites.
As Dr. McMurdie observes, calling the research area “challenging” might be an understatement. “The installation [of many instruments] was within national park boundaries and in a designated wilderness area,” she says. “This means you cannot take motorized vehicles in. Plus, there are very few roads, and the roads that do exist, like on the forest land, are pretty rugged. Of course, you also have to deal with pouring rain and blowing wind, which makes these few roads more like small rivers.”
This is where the mules come in. The Wilderness Act of 1964 prohibits motorized vehicles in designated wilderness areas. Since Dr. McMurdie and her team needed to transport instruments, electronic equipment, and solar panels to field sites in a designated wilderness area, mules or horses were one of the only options. Numerous batteries (each weighing 36 kg [about 80 pounds]) also had to be brought in to power the instruments. “The packers and handlers did an amazing job loading the mules,” says Dr. McMurdie. “We had a room full of equipment and they loaded everything into carriers and lined the mules up and off they went. My graduate students went to help install the instruments, but the mule handlers took care of the loading and unloading.”
OLYMPEX, like many field campaigns, involved multiple organizations, agencies, and academic institutions. NASA representatives from several centers and facilities were joined by researchers from organizations including Environment Canada, the National Science Foundation, the National Center for Atmospheric Research (NCAR), the National Weather Service, and the Center for Severe Weather Research. Since the campaign took place on federal and Native American land, the National Park Service, the U.S. Forest Service, and the Quinault Indian Nation also were involved.
For data collection, the OLYMPEX team utilized multiple instruments installed at 16 ground observation sites, imagery from multiple radars, balloon soundings, and three heavily-instrumented aircraft, including NASA’s four-engine DC-8 jet.
A typical OLYMPEX day that included a flight started with a 5am forecast briefing by the night forecaster. If the flight was a go, mission flight directors, Dr. McMurdie, and the morning forecaster were in the operations center between 6 and 7am to go over flight plans. Meanwhile, the radar operators were alerted and soundings were sent up. A main briefing took place around 10am, including a forecast, a status report from individual team members, and a review of the plan of the day. At the end of the day, data collected by the aircraft instruments were combined to produce a daily science report. Flight reports for other OLYMPEX aircraft and radar reports from each ground-based radar were also produced daily. If needed, an evening briefing was conducted at 9pm. “12-hour days, 7
Olympic National Park mule packer Daniel Boone Jones leads a team of mules carrying OLYMPEX ground instruments, batteries, and supplies to field sites. Photo by Bill Baccus, 8 October 2015, from OLYMPEX Flickr photostream, University of Washington, accessed 25 April 2017.

EOSDIS UPDATE Summer 20176
days a week for 6-8 weeks was pretty much my life during OLYMPEX,” says Dr. McMurdie.
OLYMPEX data are available through NASA’s Global Hydrology Resource Center Distributed Active Archive Center (GHRC DAAC), which is the home for hydrology data from NASA Earth observing missions, including precipitation, lightning, and severe weather. Data also are available through the University of Washington’s OLYMPEX website. Initial campaign data were released early in 2017, and additional data will be released publicly over the year.
Aside from verifying that a lot of rain falls on the Olympic Peninsula, Dr. McMurdie notes that OLYMPEX was a very successful field campaign that is providing the data necessary to validate what the GPM constellation satellites are detecting from space. “We were lucky with the weather—it was dark, it was stormy, it was perfect,” she says.
The Soil Moisture Active Passive Validation Experiment 2016 (SMAPVEX16)
SMAP launched on 31 January 2015 on a planned three-year mission to globally measure soil moisture in the top 5
cm (2 inches) of soil and assess freeze-thaw states in higher latitudes. These data are used to produce global soil moisture maps, which will help improve our understanding of the water and carbon cycles along with weather and climate.
The calibration/validation of SMAP data is divided into five main components: about 15 Core Validation Sites around the world where SMAP-related experiments take place; Sparse Networks that support the core sites, but have a lower station density and extend across a larger geographic area; non-SMAP satellite products that provide remotely-sensed soil moisture data at scales matching SMAP products; model products that provide soil moisture estimates at scales matching SMAP; and field campaigns that focus on specific items that can resolve isolated problems with SMAP data processing algorithms. “We go from the Core Sites to the Sparse Networks to the satellite and model products, going to a wider and wider scope. Finally, with the field campaigns, we go back to small-scale details and issues and try to resolve them,” says Dr. Andreas Colliander, Research Scientist at NASA’s Jet Propulsion Laboratory (JPL). Dr. Colliander coordinates the calibration/validation activities in the SMAP mission and served as the Science Lead for the Passive Active L- and S-band Sensor (PALS) airborne instrument during the SMAPVEX16 campaign.
During the summer of 2015, SMAP scientists noticed that SMAP’s soil moisture retrieval algorithm was having difficulty retrieving soil moisture over certain regions, generally agricultural areas where vegetation growth is very rapid during the growing season. “The decision was made to conduct [SMAPVEX16] over the sites where we were seeing these challenges, mainly in some of the core sites in Iowa and in Manitoba, Canada,” says Dr. Colliander.
Like OLYMPEX, SMAPVEX16 had both airborne and ground components. The ground component featured two intensive observation periods during the growing season, one at the beginning of the season with bare ground and one at the end of the season with mature
DC-8 flight track from 8 December 2015. Blue/green lines are the flight track. Colored areas indicate precipitation, with orange/red areas indicating heavy precipitation. This 7.2-hour flight sampled an atmospheric river event, which caused heavy flooding in areas over which the jet flew. NASA image.

EOSDIS UPDATE Summer 20177
biomass and maximum water content. Flights involving several types of aircraft were conducted at the same time as SMAP satellite overpasses. The field data were from well-defined areas that could be used to calibrate the airborne measurements. These airborne measurements were translated to the larger SMAP sensor observations. Vegetation water content and geometry also were assessed by drying vegetation samples and weighing them along with collecting data on variables including vegetation branch numbers and branch angles.
An additional measurement was surface roughness, which is known to affect the SMAP soil moisture algorithm (the rougher the ground surface, the greater the effect of this on ground emissions). “We don’t know surface roughness globally, so the global algorithm is based on roughness estimates,” says Dr. Colliander. “These campaigns give us a better idea of the actual surface and vegetation parameters, including roughness, which we feed into the field campaign data. The more field data we have, the better we can adjust the algorithm and improve the global soil moisture retrieval results.”
SMAPVEX16 featured an international research team comprising a number of agencies and organizations. Along with NASA and JPL, which were responsible for the PALS instrument flights, the U.S. Department of Agriculture led the Iowa ground segment. Students from several universities conducted manual sampling. The Manitoba campaign component was funded by the Canadian Space Agency, with local ground operations led by Agriculture and Agrifood Canada. Environment Canada and students from Canadian universities supported and conducted field measurements.
As Dr. Colliander notes, the major concerns in SMAPVEX16 were the weather and ground conditions. In general, the research team wanted a range of soil moisture. “When you have full-grown vegetation, it is better to have wet ground than dry ground because the vegetation is harder to separate from dry soil,” he says. “We had wet soils in the later parts of the experiment, which we were very happy to have. It would have been better to have a little more dry-down to give us some more variability, but this is nature so it’s hard to get optimal conditions.”
Another challenge was timing field measurements with overpasses of the SMAP satellite. With the satellite overpass occurring around 7am local time, the team had to be in the field by 4 or 5am. This was the same schedule for the airborne missions. Thanks to experienced ground and airborne teams, data collection ran smoothly in both Iowa and Manitoba.
SMAPVEX16 data are expected to be available later this year at the National Snow and Ice Data Center (NSIDC) DAAC, which, along with the Alaska Satellite Facility (ASF) DAAC, is responsible for archiving and distributing SMAP data. According to Dr. Colliander, the SMAPVEX16 team was able to collect the data necessary to implement improvements into the SMAP algorithms. “Field experiments like SMAPVEX16 are really critical to improving spaceborne observations,” he says. “They are part of the background work both pre-launch and post-launch that go into enabling satellite missions to make these retrievals for parameters of Earth systems.”
Connecting the dots from the ground up
Ground validation campaigns for GPM, SMAP, and other NASA Earth observing missions help ensure that the remotely-sensed data provided by the DAACs accurately represent real-world processes. Like all NASA data, GV campaign data are fully and openly available, with quality-controlled data publically available generally 6-9 months after the end of a campaign.
As Dr. Petersen, the NASA GPM Deputy Project Scientist for Ground Validation, observes, satellite instruments do not directly measure many components of weather or the Earth system that scientists and researchers actually are trying to observe, such as precipitation; these data
Assessing surface roughness using a grid board. The card in the upper left corner of the board is the site ID. Image from the SMAPVEX16 Iowa Experiment Plan.
EOSDIS UPDATE Summer 20178
are all remotely-sensed and interpreted indirectly using algorithms. Ground validation provides a necessary link. “The ground validation allows you to explicitly connect the dots—the physics between what is being remotely-sensed by instruments in space and what you are interested in measuring in the atmosphere or on the ground,” he says. “It’s important that NASA does these ground validation campaigns and takes advantage of its expertise to make these connections.” n
Additional resources and links to campaign data
Daly, C., Halbleib, M., Smith, J.I., Gibson, W.P., Doggett, M. K., Taylor, G.H., Curtis, J. & Pasteris, P.P. (2008). “Physiographically sensitive mapping of climatological temperature and precipitation across the conterminous United States.” International Journal of Climatology, 28: 2031–2064 [doi:10.1002/joc.1688].
GPM Ground Validation Data Archive: http://gpm-gv.gsfc.nasa.gov/
NASA GHRC OLYMPEX page: https://ghrc.nsstc.nasa.gov/home/field-campaigns/o...
NSIDC SMAP Validation Data: http://nsidc.org/data/smap/validation/val-data.htm...
SMAP Field Campaigns: http://smap.jpl.nasa.gov/science/validation/fieldc...
SMAPVEX16 page: https://smap.jpl.nasa.gov/science/validation/field...
University of Washington OLYMPEX website: http://olympex.atmos.washington.edu
Enhancing the Discoverability of NASA Earth Science Data through Digital Object Identifiers (DOIs)[Article originally published in The Earth Observer, 29(3): 4-8 and reprinted with permission.]
Introduction
NASA’s Earth Observing System Data and Information System (EOSDIS) currently is responsible for almost
22 petabytes (PB) of archived data and more than 10,000 unique research products, which are managed by NASA’s Earth Science Data and Information System (ESDIS)
Project.1 The volume of data in this vast archive is expected to grow significantly over the next several years, and may be almost 247 PB in size by 2025, according to estimates by NASA’s Earth Science Data Systems Program. A prime responsibility of EOSDIS and the ESDIS Project is ensuring that these data can be discovered easily and cited accurately by data users. A key response to addressing these needs is the addition of Digital Object Identifiers (DOIs) to EOSDIS data products.
DOIs were developed in the 1990s as a means for managing the identification and location of content over digital networks, and are internationally standardized through the International Organization for Standardization (ISO) standards 26324:2012.2 Two important attributes of DOIs are their permanence and their uniqueness, which are essential for facilitating the
1 To learn more about EOSDIS, the ESDIS Project, and other elements discussed in this article see “Earth Science Data Operations: Acquiring, Distributing, and Delivering NASA Data for the Benefit of Society” in the March-April 2017 issue of The Earth Observer [Volume 29, Issue 2, pp. 4-18].
2 ISO 2634.2012 contains information and documentation on the DOI system, which can be found at https://www.iso.org/standard/43506.html.

EOSDIS UPDATE Summer 20179
discoverability of DOI-assigned EOSDIS data products, as will be shown later in this article.
Of particular interest for readers of The Earth Observer is the adoption of DOIs for data products produced, archived, and distributed by the EOSDIS. These DOIs enable data users to not only rapidly locate specific EOSDIS data products for their research and applications, but also easily provide valid citations for these products.3
Once registered, a DOI can never be changed or deleted. This means that even if the Internet location of the object changes, the DOI remains unchanged and the object can still be located using the DOI. DOIs also serve as unique identifiers of objects in that they identify a specific object without ambiguity. In addition, DOIs enable data users to provide valid citations for the data they use in research since anyone using the research or replicating the research can use a DOI to locate the exact data and data products cited.
The ESDIS Project began assigning DOIs in 2010, and a formal process for assigning and registering DOIs was implemented in 2012.4 The more than 10,000 unique EOSDIS research products available to data users include not only standard products with the processing required for scientific research, but also near-real-time (NRT) products that are generally available within three hours after the raw data are collected. As of May 2017, a total of 5,161 EOSDIS data products have registered DOIs, and many more are on the way.
Since DOIs are becoming so prevalent in the realm of Earth Science data and information, it seems fitting to examine some of the “nuts and bolts” of their usage in this specific context. We begin with a review of the basic DOI structure and then proceed to specific details about assigning DOIs to EOSDIS data products.
Prefixes, Suffixes, and More—Understanding DOI “Grammar”
An object’s DOI has two parts: a prefix and a suffix. The prefix begins with the number 10 (which is called a handle and identifies the string of numbers and letters after the 10 as being part of a DOI) followed by a number identifying the organization or agency registering the DOI, called the registration agent.5 For example, the ESDIS Project has been assigned the registration agent number 5067. This means that DOIs for EOSDIS data products start with 10.5067. The DOI suffix (which is separated from the prefix by a forward slash) uniquely identifies the object, and its format is assigned and managed by the body or organization submitting the DOI for formal registration, such as the ESDIS Project.
A suffix is either opaque, that is, a string of seemingly random numbers and letters, or structured, implying that the suffix has some meaningful content that follows a specified format. As is explained in the previously referenced Data Science Journal article by Wanchoo, et al., one reason for data providers to use a structured DOI is that this may increase the ability of automated searches to identify articles citing specific mission, instrument, or program datasets. It is important to note that even if the DOI suffix is structured, the DOI is permanent and cannot be changed if the meaning of the suffix changes in the future. For example, a structured suffix might be written to contain the name of the specific data center originally responsible for the data product, but the data product could be moved to another data center. The use of content such as data center names or data locations in a DOI suffix is discouraged for this reason.
Both opaque and structured suffixes are used in DOIs for EOSDIS data products. The choice of using an opaque suffix or a structured suffix (along with the structured suffix model used) depends on the preference of the EOSDIS Distributed Active Archive Center (DAAC)6
3 Initial work on assigning DOIs to EOSDIS data has been detailed previously in “Digital Object Identifiers for NASA’s Earth Observing System” in the September-October 2012 [Volume 24, Issue 5, pp. 10-15] issue of The Earth Observer.
4 More technical information about EOSDIS DOI efforts can be found in the recently published article Wanchoo, L., N. James, and H. Ramapriyan, 2017. “NASA EOSDIS Data Identifiers: Approach and System.” Data Science Journal, 16, p. 15, doi:10.5334/dsj-2017-015. [Note the use of a DOI in this context—ED.]
5 Detailed information about the DOI numbering system is available through the International DOI Federation’s DOI Handbook, Chapter 2, Numbering (www.doi.org/doi_handbook/2_Numbering.html).
6 Information about EOSDIS DAACs and their datasets is available through the NASA Earthdata website at earthdata.nasa.gov/about/daacs.

EOSDIS UPDATE Summer 201710
providing the information for registering the data product DOI. The ESDIS Project recommends that a suffix be kept simple and short for ease of use, and suggests several suffix models that may be used, such as:
• [name of mission]/[name of instrument]/data[m][n]
• [name of campaign]/[name of platform]/data[m][n]
• [name of program]/[name of measurement group]/data[n]
Where [m] denotes the processing level of the data product (e.g., Level 1, Level 2, etc.) and [n] indicates a sequence number.
A specific example can help demonstrate the naming convention and the value of a DOI:
The structured DOI assigned to the MODIS/Terra Land Surface Temperature and Emissivity Monthly Level 3 Global 6 km Grid SIN Version 6 product at NASA’s Land Processes DAAC (LP DAAC) is 10.5067/MODIS/MOD11B3.006. The prefix 10.5067 indicates that this is an EOSDIS data product. The suffix MODIS/MOD11B3.006 indicates that this is a MODIS product, the product name is MOD11B3, and this is MODIS Version 6 data.
While a data user could use the Uniform Resource Locator (URL) for the LP DAAC landing page (lpdaac.usgs.gov/dataset_discovery/modis/modis_products_table/mod11b3_v006) to access this dataset, this URL could change or the data could be moved, resulting in the dreaded 404: Not Found error. However, by using the dataset’s DOI (dx.doi.org/10.5067/MODIS/MOD11B3.006), a data user always will be directed to this specific dataset—regardless of where it exists on the Internet—since a valid URL is required by the ESDIS Project as part of the DOI registration process. To further ensure the accuracy of URLs associated with EOSDIS data products, the ESDIS Project periodically checks the validity of URLs for registered DOIs and receives monthly broken links reports listing DOIs with 404:Page
Not Found errors. The ESDIS Project requests updated URLs from the DAACs for links that are not resolved.
A DOI is an integral component of a data product’s metadata. Metadata are data that help describe or identify data, such as when the data were collected or the instrument used to collect the data. Metadata also make it easy to find information about the creation and history of a data product, which is called the data’s provenance. EOSDIS DAACs are responsible for providing the ESDIS Project with data product metadata.
A DOI also has metadata associated with it, which are necessary for registering an EOSDIS data product DOI. One of the metadata elements required for DOI registration is the URL that provides the location of the data product’s landing page. One benefit of having the URL as part of a data product’s DOI metadata is that this enables the ESDIS Project to quickly and easily update a data product’s URL when necessary. Along with the URL for the data product’s landing page, additional metadata required by the ESDIS Project for registering a data product DOI are the DOI name, data product title or name, the data product creator, the name of the DAAC distributing the data product, the data product publication year, the type of digital object being registered (e.g., dataset, text, services, or software), the type of DOI (i.e., new or update), and whether the DOI is ready for registration (yes or no).
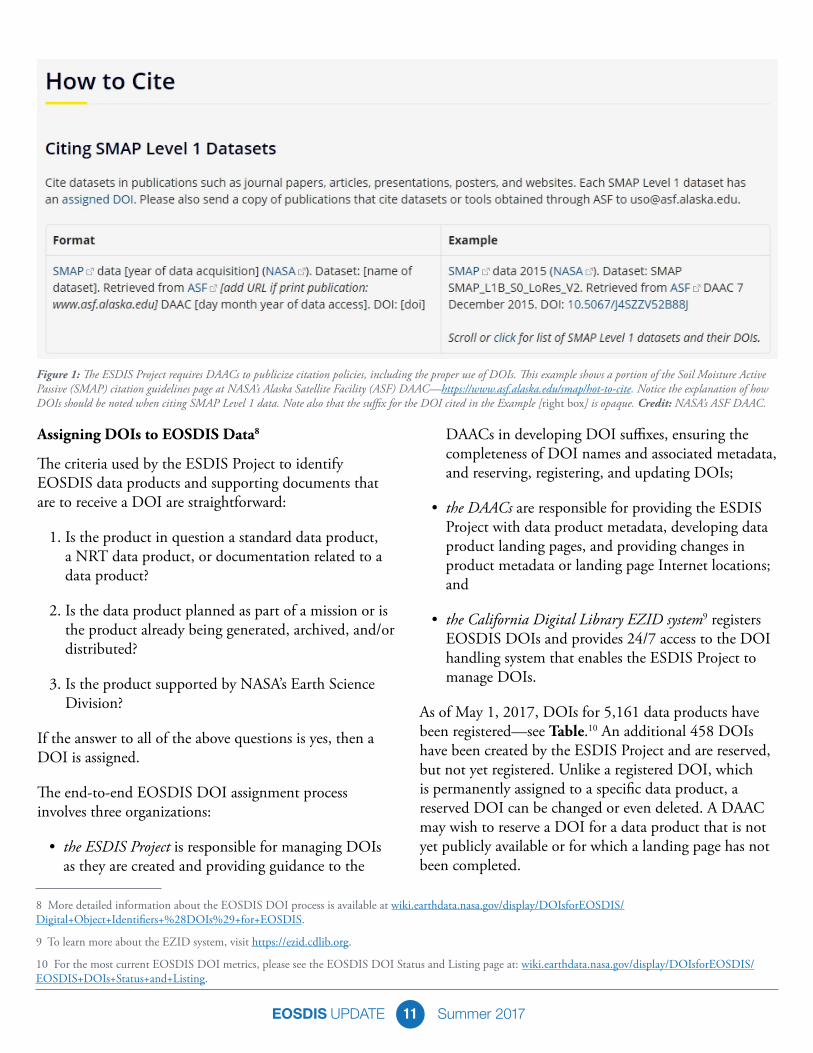
As noted earlier, DOIs also make it easy to properly cite data used for research.7 Since a DOI is assigned to a specific data product, there is no confusion about which data product or which version of the data product is being cited. The ESDIS Project requires DAACs to publicize citation policies on their websites and in communications accompanying data, including the proper use of DOIs in data citations—see Figure 1. Using DOIs in data citations helps data become more discoverable. This, in turn, helps increase data distribution and, through this, fosters new and additional research using the data.
7 For the EOSDIS position on the importance of proper data citations, please read “Open Data and the Importance of Data Citations: The NASA EOSDIS Perspective,” available online at earthdata.nasa.gov/open-data-and-the-importance-of-data-citations-the-nasa-eosdis-perspective.
EOSDIS UPDATE Summer 201711
Assigning DOIs to EOSDIS Data8
The criteria used by the ESDIS Project to identify EOSDIS data products and supporting documents that are to receive a DOI are straightforward:
1. Is the product in question a standard data product, a NRT data product, or documentation related to a data product?
2. Is the data product planned as part of a mission or is the product already being generated, archived, and/or distributed?
3. Is the product supported by NASA’s Earth Science Division?
If the answer to all of the above questions is yes, then a DOI is assigned.
The end-to-end EOSDIS DOI assignment process involves three organizations:
• the ESDIS Project is responsible for managing DOIs as they are created and providing guidance to the
DAACs in developing DOI suffixes, ensuring the completeness of DOI names and associated metadata, and reserving, registering, and updating DOIs;
• the DAACs are responsible for providing the ESDIS Project with data product metadata, developing data product landing pages, and providing changes in product metadata or landing page Internet locations; and
• the California Digital Library EZID system9 registers EOSDIS DOIs and provides 24/7 access to the DOI handling system that enables the ESDIS Project to manage DOIs.
As of May 1, 2017, DOIs for 5,161 data products have been registered—see Table.10 An additional 458 DOIs have been created by the ESDIS Project and are reserved, but not yet registered. Unlike a registered DOI, which is permanently assigned to a specific data product, a reserved DOI can be changed or even deleted. A DAAC may wish to reserve a DOI for a data product that is not yet publicly available or for which a landing page has not been completed.
8 More detailed information about the EOSDIS DOI process is available at wiki.earthdata.nasa.gov/display/DOIsforEOSDIS/Digital+Object+Identifiers+%28DOIs%29+for+EOSDIS.
9 To learn more about the EZID system, visit https://ezid.cdlib.org.
10 For the most current EOSDIS DOI metrics, please see the EOSDIS DOI Status and Listing page at: wiki.earthdata.nasa.gov/display/DOIsforEOSDIS/EOSDIS+DOIs+Status+and+Listing.
Figure 1: The ESDIS Project requires DAACs to publicize citation policies, including the proper use of DOIs. This example shows a portion of the Soil Moisture Active Passive (SMAP) citation guidelines page at NASA’s Alaska Satellite Facility (ASF) DAAC—https://www.asf.alaska.edu/smap/hot-to-cite. Notice the explanation of how DOIs should be noted when citing SMAP Level 1 data. Note also that the suffix for the DOI cited in the Example [right box] is opaque. Credit: NASA’s ASF DAAC.

EOSDIS UPDATE Summer 201712
Along with the DAACs, six additional NASA entities that are involved in the processing of ESDIS Project science data are part of EOSDIS DOI efforts. These are the Land, Atmosphere, Near real-time Capability for EOS (LANCE)11Fire Information for Resource Management System (FIRMS)12; NRT data from the Advanced Microware Scanning Radiometer 2 (AMSR2), which is available through LANCE; NRT data from the Moderate Resolution Imaging Spectroradiometer (MODIS), which are available through LANCE; the Land Product Validation Subgroup (LPVS)13; the Ozone Product Evaluation and Test Element (PEATE)14; and the Precipitation Processing System (PPS)15.
The DOI assignment process developed by the ESDIS Project is now largely automated—see Figure 2. After a data product is identified by a DAAC as needing a DOI, product metadata required for DOI registration is generated by the DAAC responsible for the data. The product metadata and data landing page are checked for completeness and any updates are incorporated. DOI information is then processed automatically and final DOI information is automatically sent to EZID for registration.
An upgraded system to fully automate this process is being tested at selected DAACs and will be made available for implementation at all DAACs in the next few weeks. This upgraded system features web-based submission of DOI metadata files, replacing the current approach of submitting a DOI metadata spreadsheet via email. Through this web-based submission upgrade, single of bulk DOI requests are processed in minutes with immediate email responses notifying the DAAC providing the information of any errors. The upgraded system also places a 72-hour hold on all new DOI requests before automatically registering the DOI for public use.
Summary and Conclusions
Since the implementation of the formal EOSDIS DOI process in 2012, approximately 50% of EOSDIS data products have registered DOIs. The establishment of an automated system to handle a majority of the process for evaluating, registering, and updating DOIs has greatly speeded up this effort and provides a system for organizing these data products that will become ever more important as the volume of data managed by the ESDIS Project continues to grow. n
Table: Registered and reserved EOSDIS DOIs as of May 1, 2017. All 12 EOSDIS DAACs are part of EOSDIS DOI efforts. The Oak Ridge National Laboratory (ORNL) DAAC and the Socioeconomic Data and Applications Center (SEDAC) are listed separately since they already were assigning DOIs to their data products before the EOSDIS effort began. ORNL and SEDAC continue to register DOIs for their own products directly with EZID. Credit: NASA’s ESDIS Project.
Figure 2: Programs written by the ESDIS Project (in the Perl programming language) handle automated processes, including reviewing and validating DOI metadata and checking for DOI name uniqueness within the ESDIS Project database and with EZID. An Oracle database is used to store DOI information along with some processing-related metadata (e.g., the dates of DOI submission, registration, and updates). Credit: NASA’s EOSDIS.
11 To learn more about LANCE, visit earthdata.nasa.gov/earth-observation-data/near-real-time.
12 For information about FIRMS, visit earthdata.nasa.gov/earth-observation-data/near-real-time/firms.
13 To learn more about the LPVS, visit https://lpvs.gsfc.nasa.gov/.
14 The Ozone PEATE is now the Suomi National Polar-orbiting Partnership (Suomi-NPP) Ozone Science Investigator-led Processing System (SIPS), but is still listed as Ozone PEATE on the EOSDIS DOI Status and Listing page for consistency with previous records.
15 For more information about the PPS, visit pps.gsfc.nasa.gov.
EOSDIS UPDATE Summer 201713
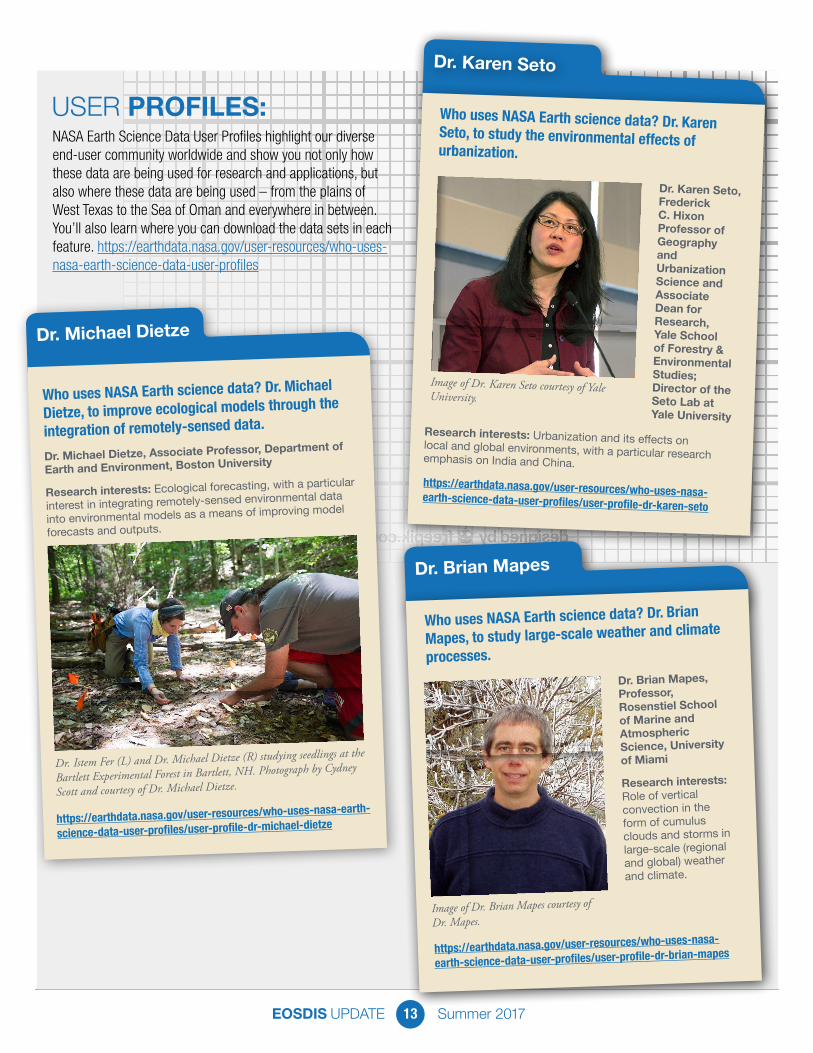
USER PROFILES: NASA Earth Science Data User Profiles highlight our diverse end-user community worldwide and show you not only how these data are being used for research and applications, but also where these data are being used – from the plains of West Texas to the Sea of Oman and everywhere in between. You’ll also learn where you can download the data sets in each feature. https://earthdata.nasa.gov/user-resources/who-uses-nasa-earth-science-data-user-profiles
Dr. Istem Fer (L) and Dr. Michael Dietze (R) studying seedlings at the
Bartlett Experimental Forest in Bartlett, NH. Photograph by Cydney
Scott and courtesy of Dr. Michael Dietze.
Dr. Michael Dietze
Who uses NASA Earth science data? Dr. Michael
Dietze, to improve ecological models through the
integration of remotely-sensed data.
Dr. Michael Dietze, Associate Professor, Department of
Earth and Environment, Boston University
Research interests: Ecological forecasting, with a particular
interest in integrating remotely-sensed environmental data
into environmental models as a means of improving model
forecasts and outputs.
https://earthdata.nasa.gov/user-resources/who-uses-nasa-earth-
science-data-user-profiles/user-profile-dr-michael-dietze
Dr. Karen Seto
Who uses NASA Earth science data? Dr. KarenSeto, to study the environmental effects ofurbanization.
Dr. Karen Seto, Frederick C. HixonProfessor ofGeographyandUrbanizationScience andAssociateDean forResearch,Yale Schoolof Forestry &EnvironmentalStudies;Director of the Seto Lab atYale University
Research interests: Urbanization and its effects on local and global environments, with a particular researchemphasis on India and China.
Image of Dr. Karen Seto courtesy of YaleUniversity.
https://earthdata.nasa.gov/user-resources/who-uses-nasa-earth-science-data-user-profiles/user-profile-dr-karen-seto
Dr. Brian Mapes
Who uses NASA Earth science data? Dr. Brian
Mapes, to study large-scale weather and climate
processes.Dr. Brian Mapes, Professor, Rosenstiel School of Marine and Atmospheric Science, University of Miami
Research interests: Role of vertical convection in the form of cumulus clouds and storms in large-scale (regional and global) weather and climate.
Image of Dr. Brian Mapes courtesy of
Dr. Mapes.
https://earthdata.nasa.gov/user-resources/who-uses-nasa-
earth-science-data-user-profiles/user-profile-dr-brian-mapes

EOSDIS UPDATE Summer 201714
ANNOUNCEMENTS
New Worldview Features make it Easier to Explore All of Fiji (and the Rest of the World)New features in Worldview 1.4.0 (along with new imagery to view using Worldview) allow you to more easily and completely explore the planet using NASA Earth science data.
The latest update to NASA’s Worldview data visualization application brings a wealth of new
features—including the ability to finally see the island nation of Fiji in its entirety. Enhancements include a continuous view of the Pacific Ocean across the International Date Line (which requires data from two different days), quick data value indications, and enhancements to the Events feed. Along with the added features, the availability of almost 20 new data sets to explore help make Worldview more useful than ever before.
Prior to this update, Fiji and other locations sitting along the 180th meridian could not be viewed completely using data from a single day since the 180th meridian (also called the antimeridian) is the approximate location of the International Date Line. Worldview now allows data
users to view a seamless Pacific Ocean by matching data collected over two consecutive days on either side of the 180th meridian.
Along with the ability to view a seamless Earth, Worldview users now can easily determine values indicated by color keys associated with a data layer. Simply place a cursor over a colored location on the Worldview map and the value represented by that color is indicated on the associated color key on the left side layer panel. This feature makes it easy to determine data values at a glance and rapidly assess conditions in an area.
The third major enhancement to Worldview are two additions to the Events feature. More than a dozen icons now differentiate events into event categories, such as weather, landslides, temperatures, and flooding, making it easy to quickly distinguish between types of events. Once an event is selected, new bold markers and bounding boxes highlight the specific location of the event.
A final enhancement to Worldview in this new release is something data users won’t see—the addition of an auto-disable function that prevents a data layer from being turned on if imagery is not available for a selected date.
The image to the right of the dashed line in the middle of this Worldview image is from 8 April 2017; the image to the left of the line is from 9 April 2017. The more than 300 islands comprising Fiji extend across these combined images in the South Pacific Ocean. NASA Worldview image.
Terra/MODIS Aerosol Optical Depth (AOD) off the western coast of Africa for 6 April 2017. Hovering over the spot indicated by the star automatically shows that the AOD in this area is between 0.230 and 0.235 (blue arrow). NASA Worldview image.

EOSDIS UPDATE Summer 201715
This helps eliminate confusion when layers for a selected date seemingly do not load.
Along with all the new features, Worldview also has more imagery to view. Among the almost 20 new data products available for viewing using Worldview are:
• Daily Moderate Resolution Imaging Spectroradiometer (MODIS) Normalized Snow Difference Index and Ice Surface Temperature
• Daily Soil Moisture Active/Passive (SMAP) Enhanced versions of Passive Brightness Temperature and Passive Soil Moisture, Freeze/Thaw
• Daily and Monthly Measurement of Pollution in the Troposphere (MOPITT) Carbon Monoxide
• Daily Special Sensor Microwave/Imager (SSM/I) Sea Ice Concentration for Worldview polar layers
In addition, Worldview offers an exciting new base layer: the Visible Infrared Imaging Radiometer Suite (VIIRS) Black Marble Nighttime Lights 2012 and 2016, which allows exploration of data over a nighttime globe.
Imagery available for viewing using Worldview come from NASA’s Global Imagery Browse Services (GIBS), which is part of NASA’s Earth Observing System Data and Information System (EOSDIS). GIBS clients, such as Worldview, allow users to interactively browse imagery and download underlying image data.
From Fiji to Finland, Fakarava to France, new Worldview features make it easier than ever to explore the planet using NASA Earth science data. n
New Worldview Event icons were developed by open source contributor CodeMacabre and appear next to event names.
The addition of markers (shown) and bounding boxes to Worldview Events make it easy to pinpoint an event location. NASA Worldview image.
2017 NASA Space Apps Challenge a Huge SuccessIn the world’s largest hackathon, an estimated 25,000 participants around the world worked collectively to create open-source apps addressing challenges posed by NASA.
Teams at 187 locations around the world participated in the 2017
NASA International Space Apps Challenge hackathon April 29-30. The result of the 48-hour hacking session was more than 1,900 open-source solutions to challenges
posed by NASA to design apps addressing global needs applicable to both life on Earth and life in space.
This year’s challenges were organized into five categories that made use of NASA Earth science data:
• Ideate and Create: Interpret NASA Earth science data creatively and design new means to experience NASA Earth Science data and technologies
• Our Ecological Neighborhood: Use NASA Earth science data to study ecological systems and generate solutions to better understand life on Earth
• The Earth and Us: Combine NASA Earth science data with sociological and economic information

EOSDIS UPDATE Summer 201716
to generate new understanding and perspectives on human-environment interactions
• Warning! Danger Ahead!: Analyze NASA data to assist in monitoring natural disasters and phenomena associated with health risks and assess their impacts on life and property
• Planetary Blues: Analyze and visualize NASA data related to Earth’s hydrosphere (liquid water) and cryosphere (frozen water)
Many of the challenges were related to Earth science data and services available through NASA’s Earth Observing System Data and Information System (EOSDIS). For example, 55 teams developed apps to address the Data Concierge challenge to create an artificial intelligence tool to help Earth science data users and enthusiasts find datasets and resources of interest (which could use imagery from the EOSDIS Global Imagery Browse Services [GIBS] or data from Earthdata Search); 93 teams took on the challenge to build a tool for beach-goers to monitor hazards and alert them of precautionary measures for protection on their swim- and surf-filled adventures (Let’s go to the Beach!), which might incorporate chlorophyll data from NASA’s Ocean Biology Distributed Active Archive Center (OB.DAAC) or Surface Meteorology and Solar Energy (SSE) data from NASA’s Atmospheric Science Data Center (ASDC); and 217 teams designed a fire-monitoring and crowdsourcing tool to allow local fire managers to respond to wildfires (And YOU can Help Fight Fires!), which likely used the Fire Information for Resource Management System (FIRMS) available through Land, Atmosphere Near real-time Capability for EOS (LANCE).
Of course, the NASA Space Apps Challenge is more than just a hackathon - it’s also a serious competition. Each Space Apps Challenge location selected entries that will be considered for Global Awards in five categories:
• Best Use of Data: The solution that best makes data accessible or leverages it to a unique application
• Best Use of Hardware: The solution that exemplifies the most innovative use of hardware
• Best Mission Concept: The solution with the most plausible solution concept and design
• Galactic Impact: The solution with the most potential to improve life on Earth or in the universe
• Most Inspirational: The solution that captures our hearts
Local award winners create 30-second project videos that are evaluated by a panel of NASA judges. Finalists will be announced the end of May with overall Global Award winners announced in early June. Many locations also selected an entry as a local People’s Choice award winner, and this team also is required to create a 30-second project video. Unlike the five Global Awards, the global People’s Choice award winner is decided by the worldwide community. Starting May 8, anyone anywhere in the world can vote once per day for their favorite project on spaceappschallenge.org. The five projects receiving the most votes become finalists, and voting only will be open to these five projects to determine the Global People’s Choice award winner.
All Global Award winners (along with the global People’s Choice award winner) will be invited to attend a NASA launch event at a date to be announced. n
For more information about this year’s competition and award winners, follow @spaceapps or check out the 2017 NASA Space Apps Challenge website.
EOSDIS UPDATE Summer 201717
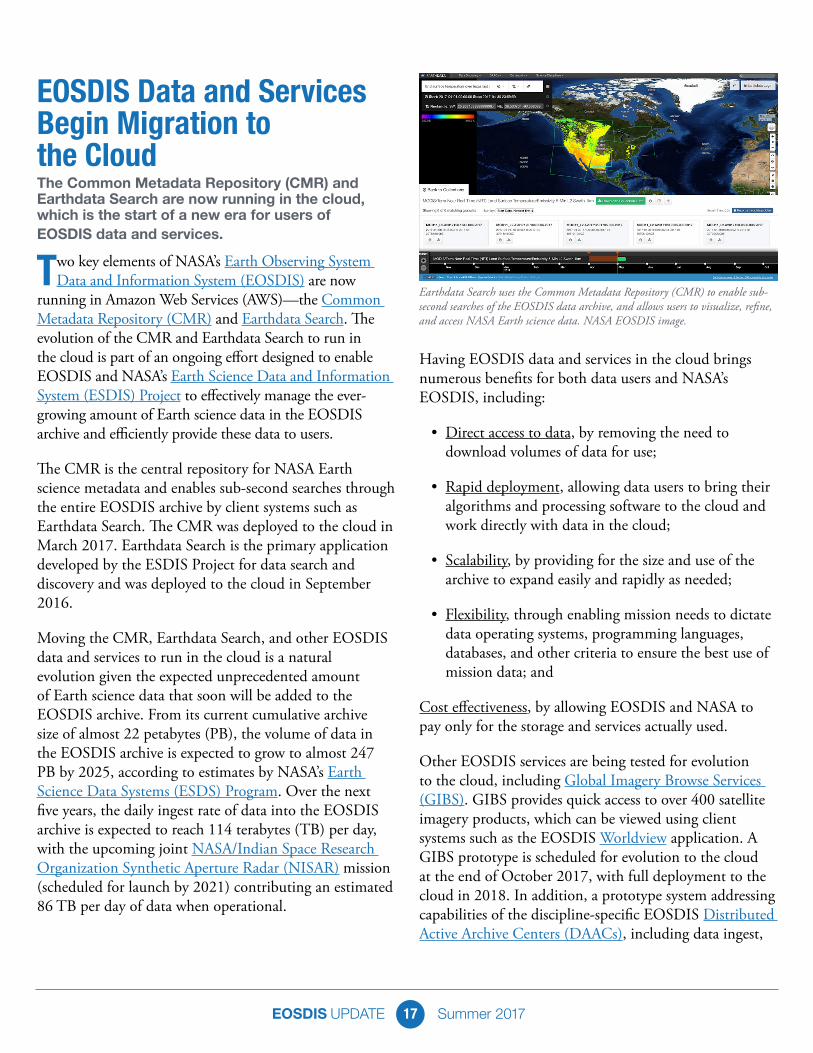
EOSDIS Data and Services Begin Migration to the CloudThe Common Metadata Repository (CMR) and Earthdata Search are now running in the cloud, which is the start of a new era for users of EOSDIS data and services.
Two key elements of NASA’s Earth Observing System Data and Information System (EOSDIS) are now
running in Amazon Web Services (AWS)—the Common Metadata Repository (CMR) and Earthdata Search. The evolution of the CMR and Earthdata Search to run in the cloud is part of an ongoing effort designed to enable EOSDIS and NASA’s Earth Science Data and Information System (ESDIS) Project to effectively manage the ever-growing amount of Earth science data in the EOSDIS archive and efficiently provide these data to users.
The CMR is the central repository for NASA Earth science metadata and enables sub-second searches through the entire EOSDIS archive by client systems such as Earthdata Search. The CMR was deployed to the cloud in March 2017. Earthdata Search is the primary application developed by the ESDIS Project for data search and discovery and was deployed to the cloud in September 2016.
Moving the CMR, Earthdata Search, and other EOSDIS data and services to run in the cloud is a natural evolution given the expected unprecedented amount of Earth science data that soon will be added to the EOSDIS archive. From its current cumulative archive size of almost 22 petabytes (PB), the volume of data in the EOSDIS archive is expected to grow to almost 247 PB by 2025, according to estimates by NASA’s Earth Science Data Systems (ESDS) Program. Over the next five years, the daily ingest rate of data into the EOSDIS archive is expected to reach 114 terabytes (TB) per day, with the upcoming joint NASA/Indian Space Research Organization Synthetic Aperture Radar (NISAR) mission (scheduled for launch by 2021) contributing an estimated 86 TB per day of data when operational.
Having EOSDIS data and services in the cloud brings numerous benefits for both data users and NASA’s EOSDIS, including:
• Direct access to data, by removing the need to download volumes of data for use;
• Rapid deployment, allowing data users to bring their algorithms and processing software to the cloud and work directly with data in the cloud;
• Scalability, by providing for the size and use of the archive to expand easily and rapidly as needed;
• Flexibility, through enabling mission needs to dictate data operating systems, programming languages, databases, and other criteria to ensure the best use of mission data; and
Cost effectiveness, by allowing EOSDIS and NASA to pay only for the storage and services actually used.
Other EOSDIS services are being tested for evolution to the cloud, including Global Imagery Browse Services (GIBS). GIBS provides quick access to over 400 satellite imagery products, which can be viewed using client systems such as the EOSDIS Worldview application. A GIBS prototype is scheduled for evolution to the cloud at the end of October 2017, with full deployment to the cloud in 2018. In addition, a prototype system addressing capabilities of the discipline-specific EOSDIS Distributed Active Archive Centers (DAACs), including data ingest,
Earthdata Search uses the Common Metadata Repository (CMR) to enable sub-second searches of the EOSDIS data archive, and allows users to visualize, refine, and access NASA Earth science data. NASA EOSDIS image.

EOSDIS UPDATE Summer 201718
archive, distribution, and management, is being tested for evolution to the cloud. For more detailed information about overall EOSDIS cloud efforts, please see Evolving NASA Earth Science Data and Services to the Cloud on the Earthdata website.
Evolving the CMR and Earthdata Search to the cloud is the beginning of a new era in providing access to EOSDIS data and services. As the EOSDIS archive grows significantly over the next few years, the result of this evolution will be the ability for data users to do more with this tremendous resource than ever before. n
WEBINARSN A S A E A R T H D ATA
Create Difference Maps for NASA Data with Giovanni, Panoply and ExcelCenter DAAC
4/5/17
Are you Ready to Python? Introduction to Working with Land Remote Sensing Data in R & Python
4/27/17
https://youtu.be/jDgn1ktZpBU
Discover and Access NASA’s Earth Science Data with Earthdata Search
5/31/17
https://youtu.be/eJFHMestpCo
Data Access and Visualization of Model Data at the NASA GES DISC
6/28/17
https://youtu.be/UzsYSzVDQIA
https://youtu.be/3BVzN0NqwdM
EOSDIS UPDATE Summer 201719
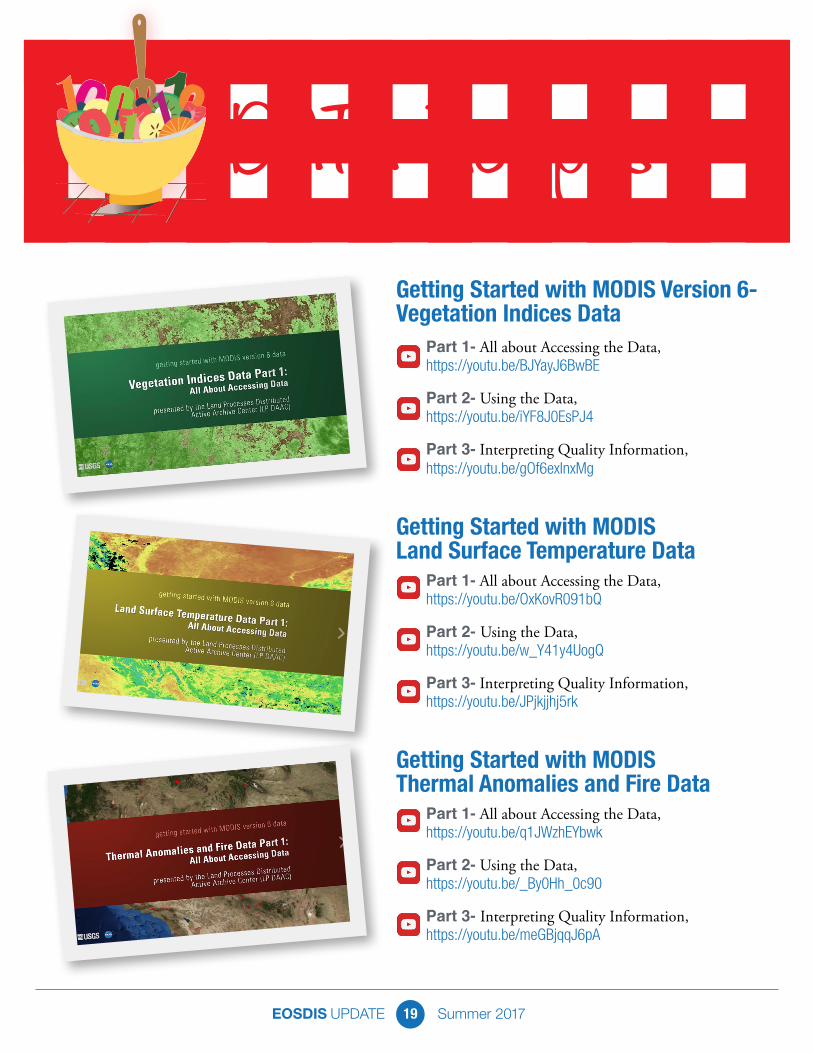
DATA RecipesGetting Started with MODIS Version 6- Vegetation Indices Data
Part 1- All about Accessing the Data, https://youtu.be/BJYayJ6BwBE
Part 2- Using the Data, https://youtu.be/iYF8J0EsPJ4
Part 3- Interpreting Quality Information, https://youtu.be/gOf6exInxMg
Getting Started with MODIS Land Surface Temperature Data
Part 1- All about Accessing the Data, https://youtu.be/OxKovR091bQ
Part 2- Using the Data, https://youtu.be/w_Y41y4UogQ
Part 3- Interpreting Quality Information, https://youtu.be/JPjkjjhj5rk
Getting Started with MODIS Thermal Anomalies and Fire Data
Part 1- All about Accessing the Data, https://youtu.be/q1JWzhEYbwk
Part 2- Using the Data, https://youtu.be/_By0Hh_0c90
Part 3- Interpreting Quality Information, https://youtu.be/meGBjqqJ6pA

EOSDIS UPDATE Summer 201720
Latest NASA Earthdata Images
About UsDiscover NASA Earth Observing System Data and Information System (EOSDIS) data, information, services and tools. Tap into our resources! To learn more, visit our website at https://earthdata.nasa.gov
Connect with UsFollow NASA Earthdata for Earth science data, services and tools, news, and updates on Facebook and Twitter
https://twitter.com/NASAEarthdata
https://www.facebook.com/NASAEarthdata
Subscribe to EOSDIS Newshttps://lists.nasa.gov/mailman/listinfo/eosdis-news
Feedback?Email: [email protected]
Webinars, Tutorials, and RecipesData discovery and data access webinars, tutorials and short data “how-to” recipes on YouTube at http://www.youtube.com/c/NASAEarthdata.
View schedule and sign-up to receive webinar announcements https://earthdata.nasa.gov/user-resources/webinars-and-tutorials
Mount Ruapehu, NewZealand
https://earthdata.nasa.gov/mount-ruapehu-new-
zealand
Nighttime Urban/Rural Temperature Differences
https://earthdata.nasa.gov/mastheads
(Published April 3, 2017)
Wildfire in Central Portugal
https://earthdata.nasa.gov/wildfires-in-central-portugal
Sensing Mangrove Canopy Height
http://earthdata.nasa.gov/mastheads
(Published May 1,2017)
Sea Ice in the Beaufort Sea
https://earthdata.nasa.gov/sea-ice-in-the-beaufort-
sea-2017-06-05
Volga River, Russia
https://earthdata.nasa.gov/volga-river-russia
Sensing Global Net Evapotranspiration
https://earthdata.nasa.gov/mastheads
(Published June 12, 2017)
Tropical Storm Merbok Approaches Hong Kong
https://earthdata.nasa.gov/tropical-storm-merbok-approaches-hong-kong
Wildfires in Chile
http://earthdata.nasa.gov/mastheads
(Published April 24, 2017)
Precipitation Anomalies in the U.S
https://earthdata.nasa.gov/mastheads
(Published May 22, 2017)