Embed Size (px)
Citation preview
Math/Science Nucleus © 2000 1
Objective: Identify landformsusing topographic maps.
Teacher noteThere are many different landforms that can be identified. Using a map of the
United States show the different landforms. The continental United States can be dividedinto three major parts, mountains in both west and east, with a plain in central U.S.
Maps with contours can help interpret these landforms. A mountain on atopographic map would have contours with high elevations. A steep mountain would havecontours that are very close together. The following reader helps students to learn aboutlandforms as they learn to identify them on a map.
EARTH SCIENCES - MAPS AS TOOLSTEACHER GUIDE
MATERIALS:
5 different topographic mapsclay, rolling pinwood board, scissorsknife or sharp edge
What is a landform?
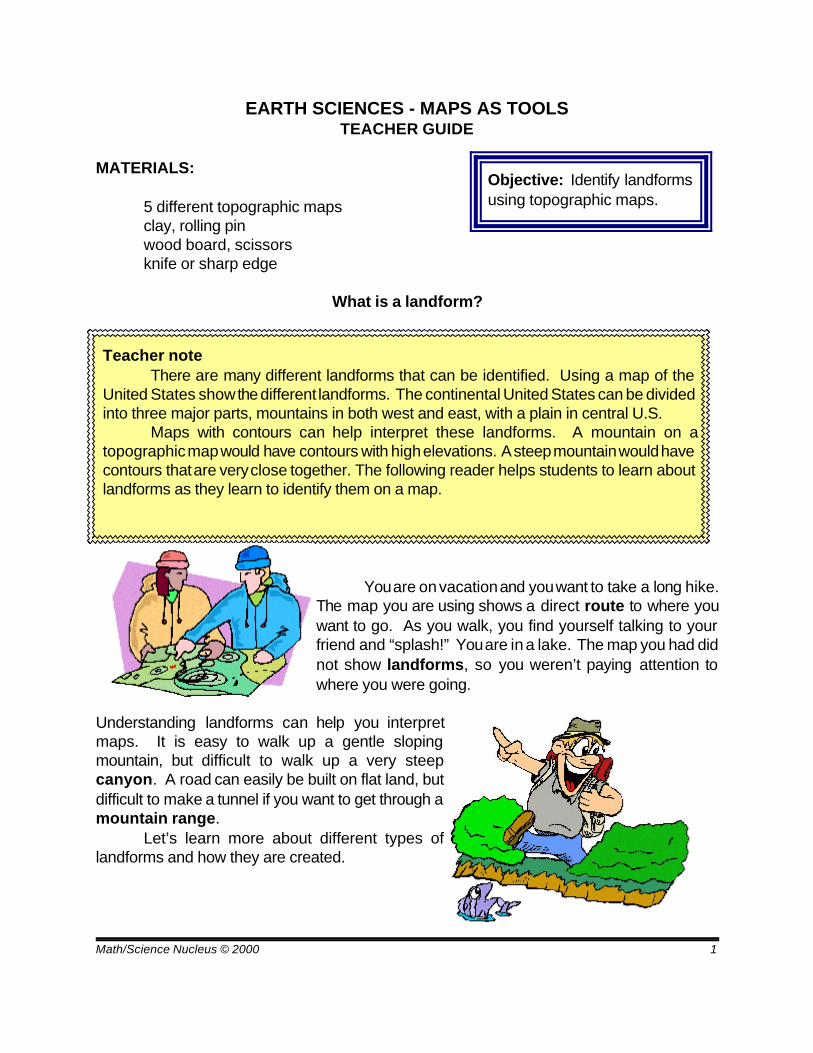
You are on vacation and you want to take a long hike.The map you are using shows a direct route to where youwant to go. As you walk, you find yourself talking to yourfriend and “splash!” You are in a lake. The map you had didnot show landforms, so you weren’t paying attention towhere you were going.
Understanding landforms can help you interpretmaps. It is easy to walk up a gentle slopingmountain, but difficult to walk up a very steepcanyon. A road can easily be built on flat land, butdifficult to make a tunnel if you want to get through amountain range.
Let’s learn more about different types oflandforms and how they are created.
Math/Science Nucleus © 2000 2
Teacher noteLandforms are created by two different types of forces acting on the land: (1)
those that affect the original surfaces and (2) erosional elements. Volcanic and tectonicforces are the major contributors to the changing or "refacing" of original surfaces. Theerosional elements (wind, water, ice, and heat) are responsible for dislodging,transporting, and depositing materials from the Earth. Most landforms are erosional.
You may want to discuss the different landforms in the United States in moredetails. The most notable in the west are the Cascades, Sierra Nevada, Basin andRange, Colorado Plateau, and rocky Mountains. The central part includes the GreatPlains and Central lowlands. The east has the Appalachian Plateau, the Piedmont andcoastal plains.
What creates landforms?
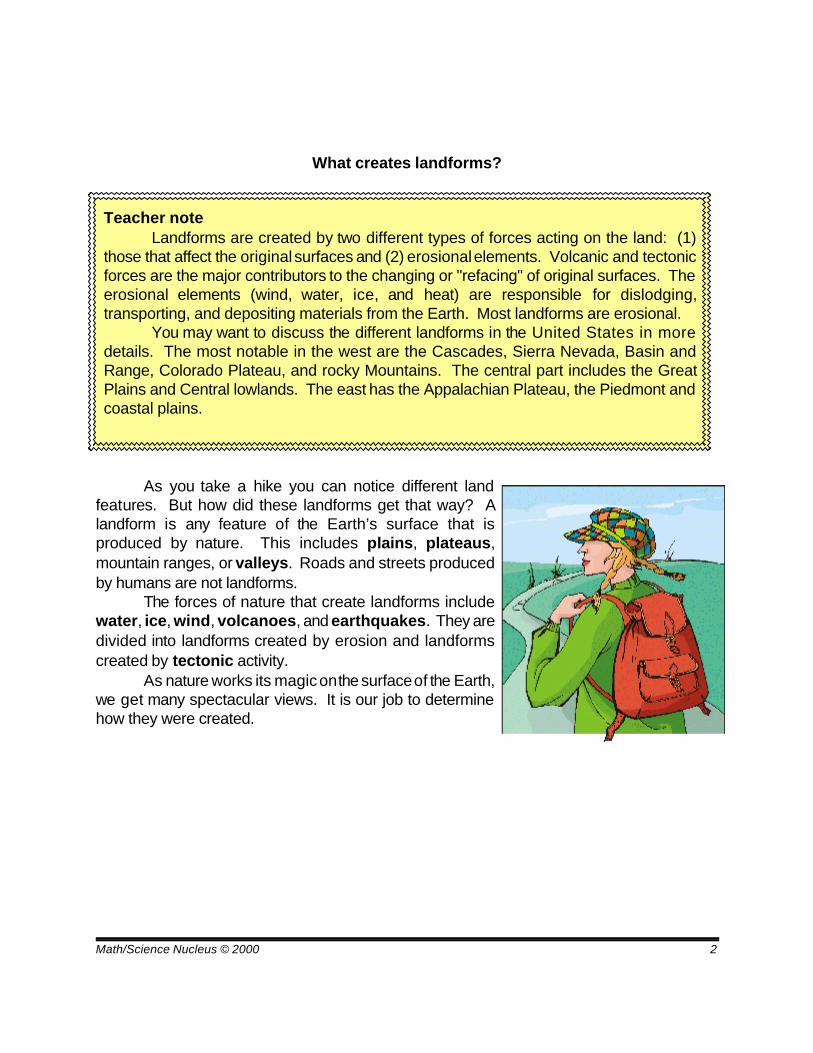
As you take a hike you can notice different landfeatures. But how did these landforms get that way? Alandform is any feature of the Earth’s surface that isproduced by nature. This includes plains, plateaus,mountain ranges, or valleys. Roads and streets producedby humans are not landforms.
The forces of nature that create landforms includewater, ice, wind, volcanoes, and earthquakes. They aredivided into landforms created by erosion and landformscreated by tectonic activity.
As nature works its magic on the surface of the Earth,we get many spectacular views. It is our job to determinehow they were created.
Math/Science Nucleus © 2000 3
Teacher noteContour maps can show many different landforms and can give you an insight on
how that landform was created. For instance, a river will form “V” shape valleys and youcan see this “V” pattern on the contours.
Water is a powerful erosional process that cuts through rocks and soil. A poorlysedimented sandstone will erode faster than an hard igneous rock. Flowing water ispowerful, but as we will see ice is more powerful at grinding away rocks.
The quick activity is for students to look at a topographic map and a picture of whatthey should see if they read the contours correctly. Recognizing landforms using contourstakes practice and imagination. This activity is from the U.S. Geological Survey.
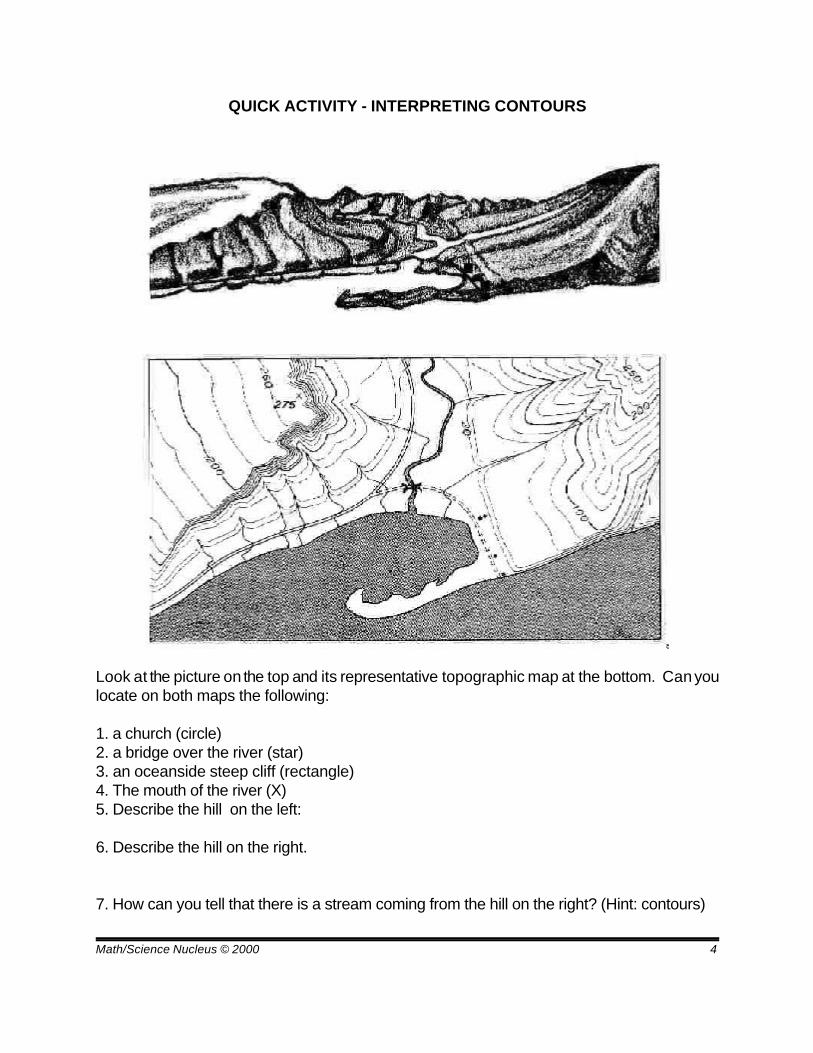
ANSWERS: 1. Church has a cross; 2. Bridge is at the mouth of the river; 3. Thesteep cliff is on the right with the very close contours; 4. Where the river meets the ocean;5. Hill is steep on the east side and gently sloping on the west. 6. Hill on the right is verysteep on the south face and less steep on the east side, with streams. 7. The contourshave a V shape.
Landforms and Topographic Maps
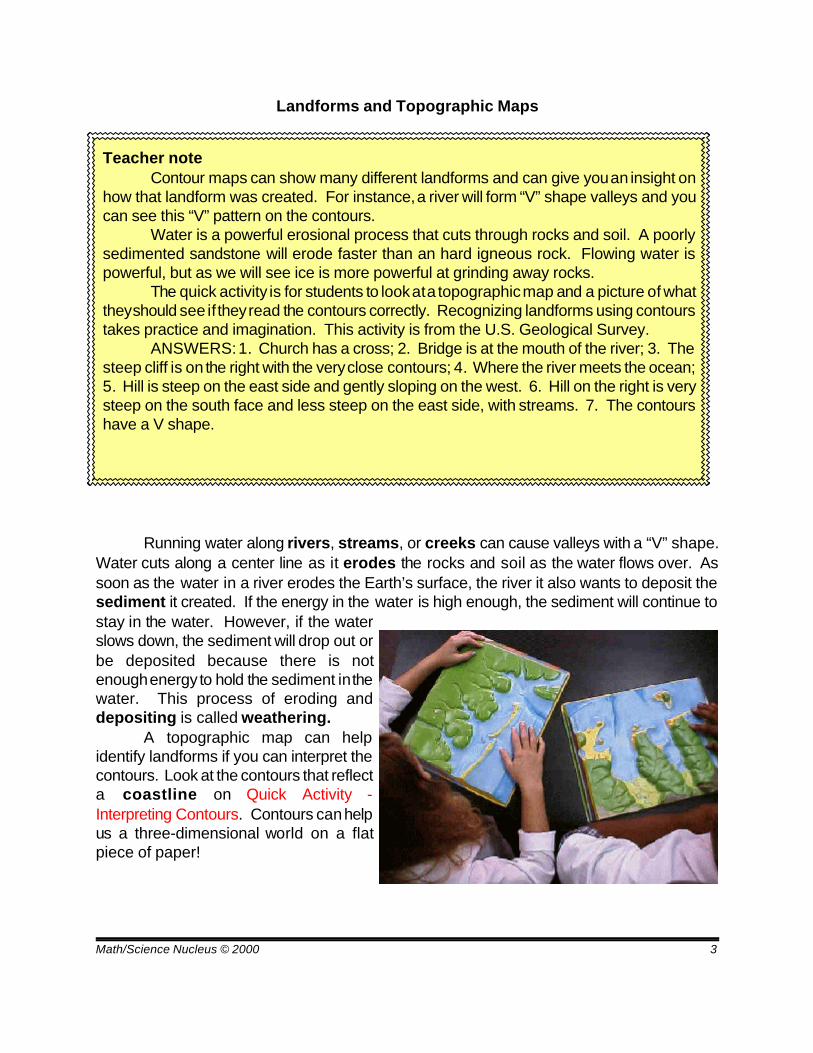
Running water along rivers, streams, or creeks can cause valleys with a “V” shape.Water cuts along a center line as it erodes the rocks and soil as the water flows over. Assoon as the water in a river erodes the Earth’s surface, the river it also wants to deposit thesediment it created. If the energy in the water is high enough, the sediment will continue tostay in the water. However, if the waterslows down, the sediment will drop out orbe deposited because there is notenough energy to hold the sediment in thewater. This process of eroding anddepositing is called weathering.
A topographic map can helpidentify landforms if you can interpret thecontours. Look at the contours that reflecta coastline on Quick Activity -Interpreting Contours. Contours can helpus a three-dimensional world on a flatpiece of paper!
Math/Science Nucleus © 2000 4
QUICK ACTIVITY - INTERPRETING CONTOURS
Look at the picture on the top and its representative topographic map at the bottom. Can youlocate on both maps the following:
1. a church (circle)2. a bridge over the river (star)3. an oceanside steep cliff (rectangle)4. The mouth of the river (X)5. Describe the hill on the left:
6. Describe the hill on the right.
7. How can you tell that there is a stream coming from the hill on the right? (Hint: contours)
Math/Science Nucleus © 2000 5
Teacher noteIce can be found in only cold places on Earth. In the high countries you can find
glaciers that last all year round. In Alaska there are many glaciers. In Antarctica you canfind sheet glaciers, which are so large, they cover the entire continent all year round. Themovement of glaciers occurs because of the pull of gravity on the mass of ice.
Erosion by glaciers can occur by plucking and abrasion. Plucking is when largeblocks of rock are carried by the moving ice. Abrasion or grinding is when the ice usesother rock fragments embedded in the ice to abrade the surface of other rocks.
LANDFORMS CREATED BY ICE
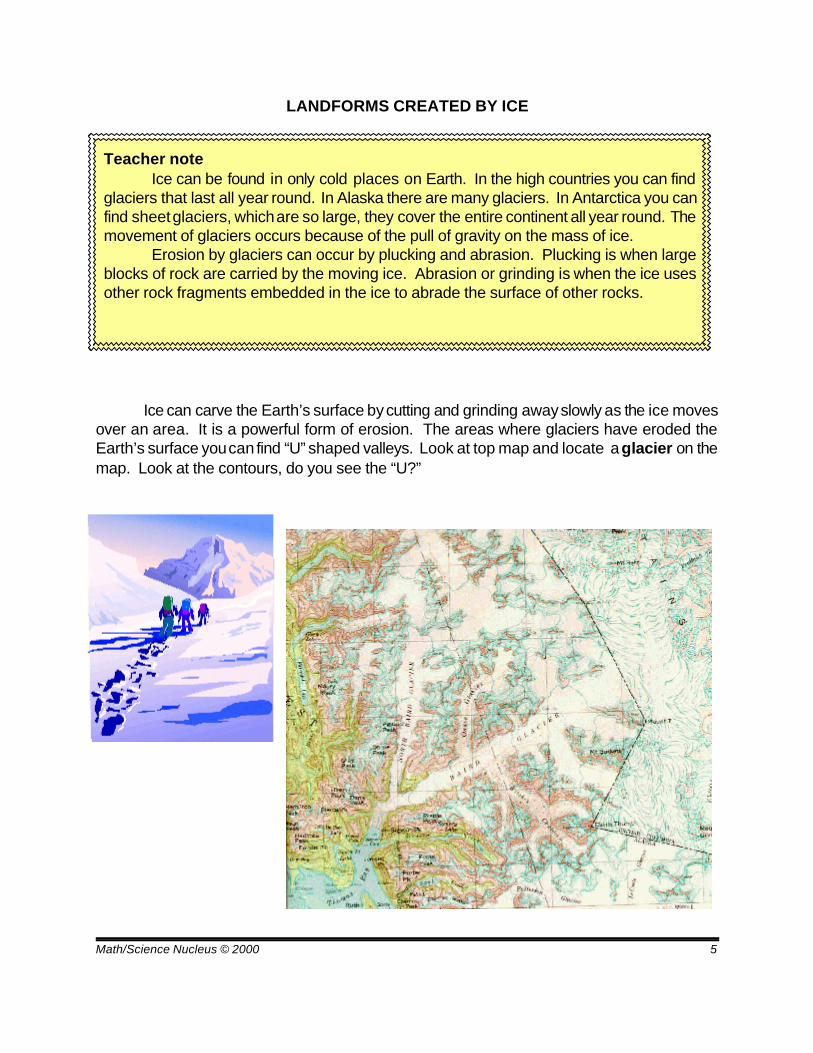
Ice can carve the Earth’s surface by cutting and grinding away slowly as the ice movesover an area. It is a powerful form of erosion. The areas where glaciers have eroded theEarth’s surface you can find “U” shaped valleys. Look at top map and locate a glacier on themap. Look at the contours, do you see the “U?”
Math/Science Nucleus © 2000 6
Teacher noteWind is a powerful erosive force in arid areas. The ability to “sandblast” an area
can carve different landforms. If the rock that the wind is blowing on is “soft” it can erodebizarre smaller features that can pot mark a rock.
Wind erosion can occur in many different climates, but it is the most powerful indesert conditions.
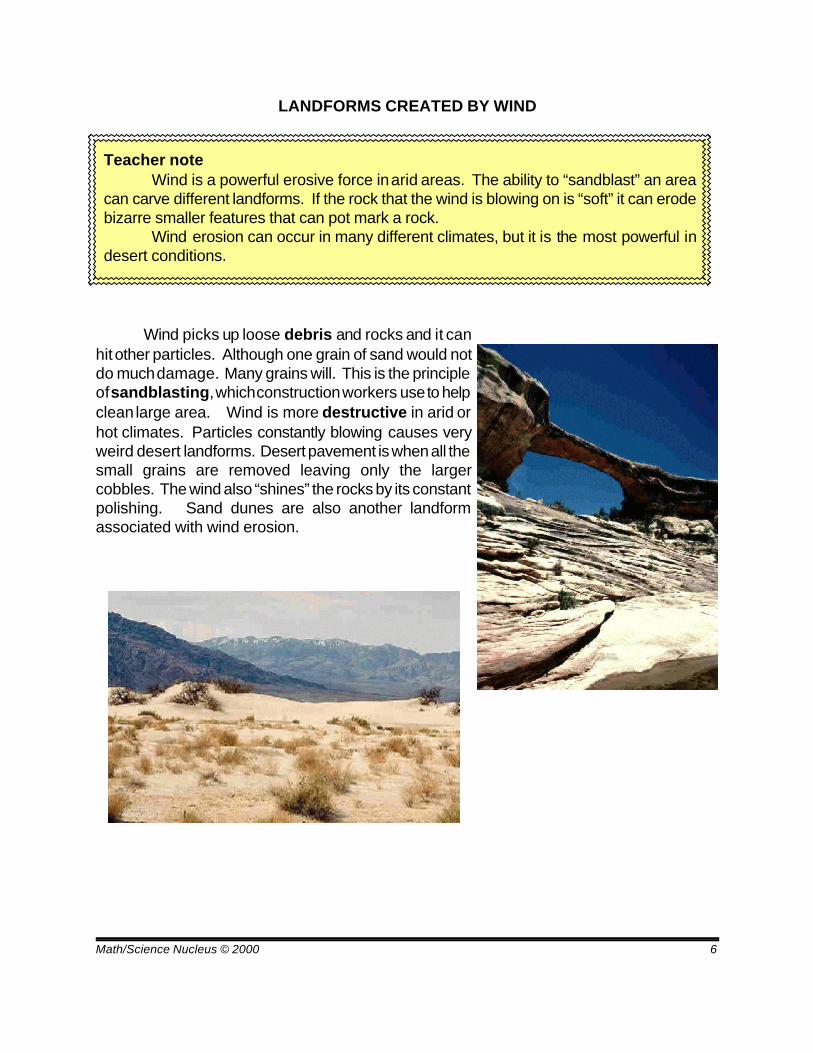
LANDFORMS CREATED BY WIND
Wind picks up loose debris and rocks and it canhit other particles. Although one grain of sand would notdo much damage. Many grains will. This is the principleof sandblasting, which construction workers use to helpclean large area. Wind is more destructive in arid orhot climates. Particles constantly blowing causes veryweird desert landforms. Desert pavement is when all thesmall grains are removed leaving only the largercobbles. The wind also “shines” the rocks by its constantpolishing. Sand dunes are also another landformassociated with wind erosion.
Math/Science Nucleus © 2000 7
Teacher noteTectonic activity causes a shifting of the Earth’s surface. Students will learn about
the processes in later chapters. Faulting due to earthquakes causes valleys, mountains,and offset rivers. Volcanoes can cause large flows of lava and sometimes ash flows.Sometimes volcanoes can “blow their top” and cause parts of the mountain to be blownaway.
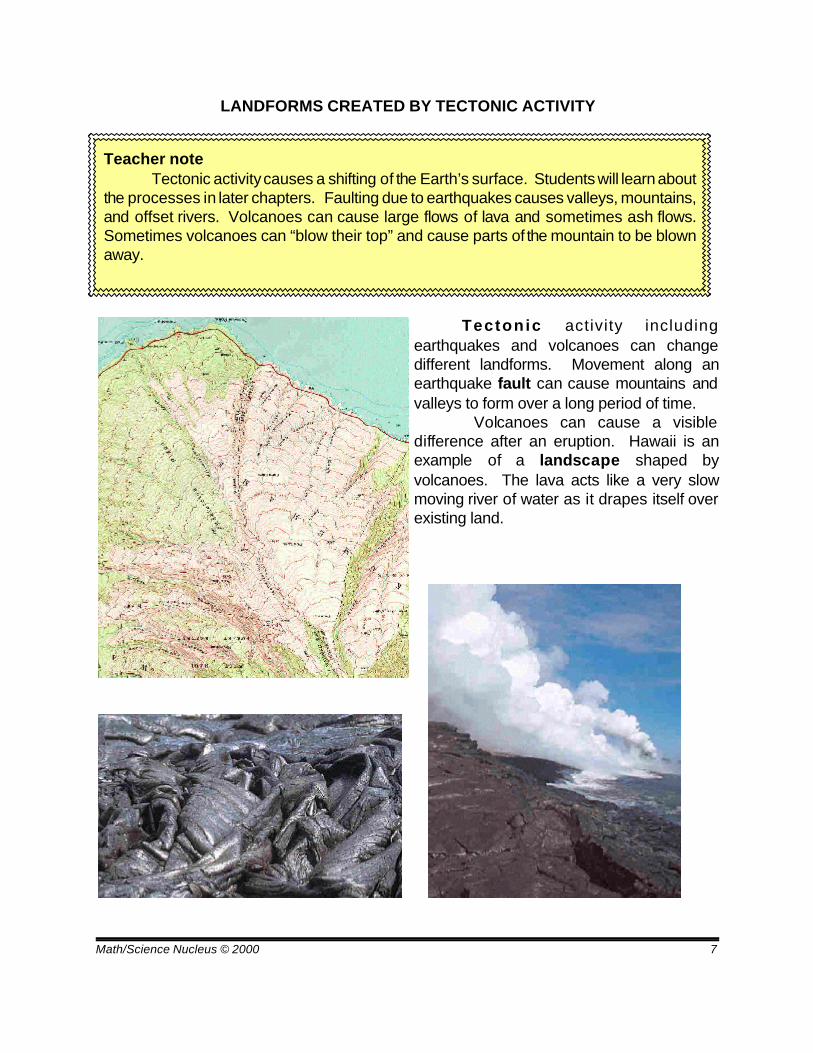
LANDFORMS CREATED BY TECTONIC ACTIVITY
Tectonic activity includingearthquakes and volcanoes can changedifferent landforms. Movement along anearthquake fault can cause mountains andvalleys to form over a long period of time.
Volcanoes can cause a visibledifference after an eruption. Hawaii is anexample of a landscape shaped byvolcanoes. The lava acts like a very slowmoving river of water as it drapes itself overexisting land.
Math/Science Nucleus © 2000 8
Teacher noteStudents are asked to look at different types of maps and globes. Make sure
that the maps show mountains and valleys, either through contours or through relief. If you have a hydrographic globe model or other relief maps, we suggest you use themalso. We suggest at least 5 different types of maps or globes so the students can seerelief. We highly suggest the paper versions of topographic maps so students cancompare and contrast. You may want to use the electronic maps included with thereader, but it is difficult to get the entire map electronically. If you purchase maps eitherfrom the Math/Science Nucleus or another U.S. Geological Survey dealer by visiting:http://usgs.gov.
Go over scales, legends, and other key portions of the lab that you may have notdiscussed in previous lectures.
INTERPRETING LANDFORMSLAB
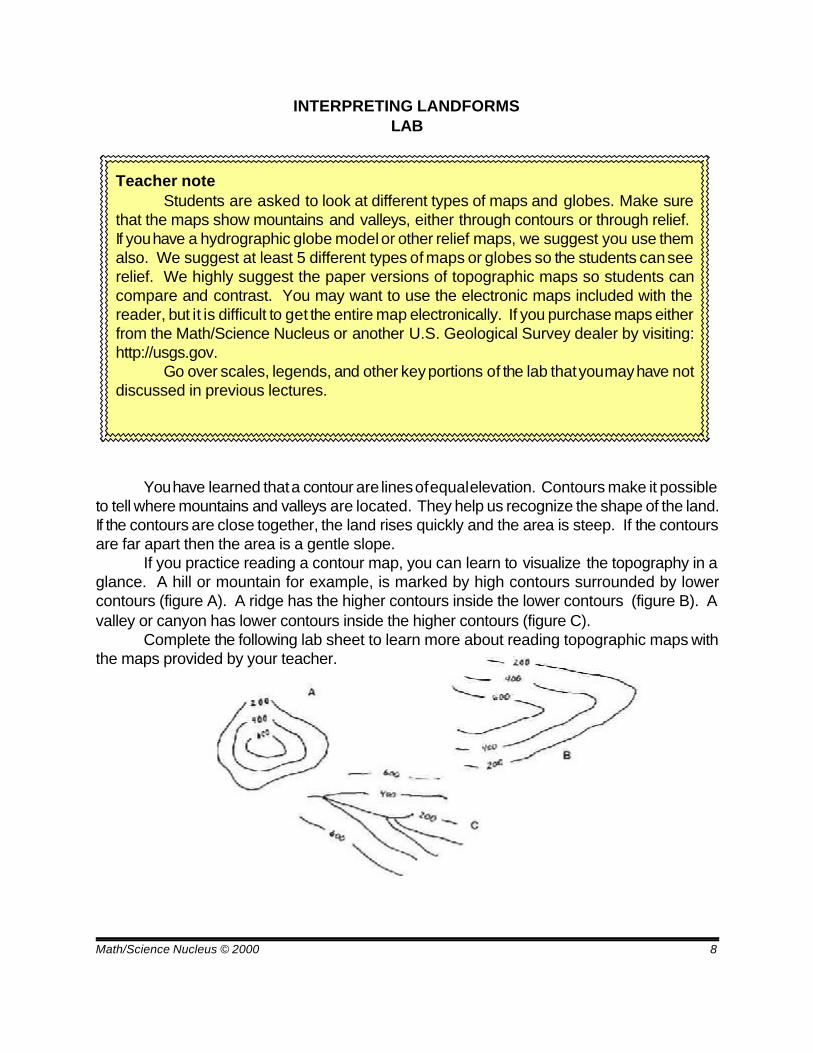
You have learned that a contour are lines of equal elevation. Contours make it possibleto tell where mountains and valleys are located. They help us recognize the shape of the land.If the contours are close together, the land rises quickly and the area is steep. If the contoursare far apart then the area is a gentle slope.
If you practice reading a contour map, you can learn to visualize the topography in aglance. A hill or mountain for example, is marked by high contours surrounded by lowercontours (figure A). A ridge has the higher contours inside the lower contours (figure B). Avalley or canyon has lower contours inside the higher contours (figure C).
Complete the following lab sheet to learn more about reading topographic maps withthe maps provided by your teacher.
Math/Science Nucleus © 2000 9
INTERPRETING LANDFORMSLAB
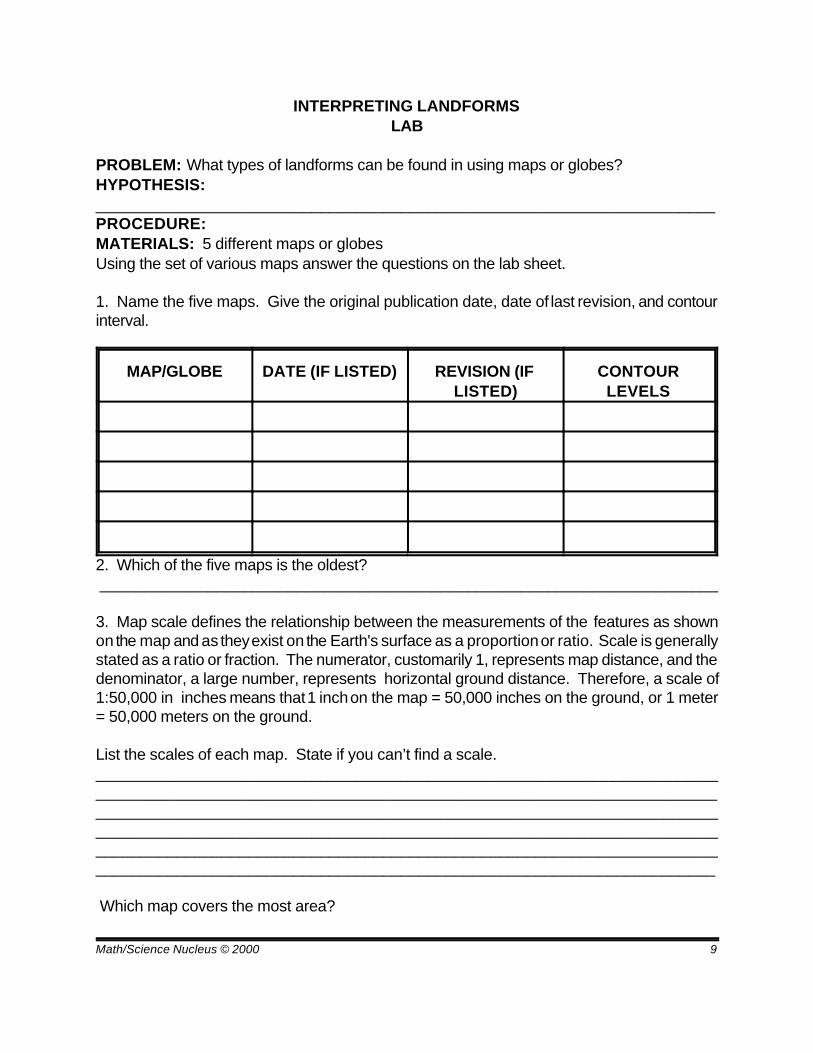
PROBLEM: What types of landforms can be found in using maps or globes?HYPOTHESIS:_____________________________________________________________________PROCEDURE: MATERIALS: 5 different maps or globesUsing the set of various maps answer the questions on the lab sheet. 1. Name the five maps. Give the original publication date, date of last revision, and contourinterval.
MAP/GLOBE DATE (IF LISTED) REVISION (IFLISTED)
CONTOURLEVELS
2. Which of the five maps is the oldest? _____________________________________________________________________ 3. Map scale defines the relationship between the measurements of the features as shownon the map and as they exist on the Earth's surface as a proportion or ratio. Scale is generallystated as a ratio or fraction. The numerator, customarily 1, represents map distance, and thedenominator, a large number, represents horizontal ground distance. Therefore, a scale of1:50,000 in inches means that 1 inch on the map = 50,000 inches on the ground, or 1 meter= 50,000 meters on the ground. List the scales of each map. State if you can’t find a scale. ______________________________________________________________________________________________________________________________________________________________________________________________________________________________________________________________________________________________________________________________________________________________________________________________________________________________ Which map covers the most area?
Math/Science Nucleus © 2000 10
_____________________________________________________________________
Which map covers the least area? _____________________________________________________________________ 4. What do you think the green and brown colors represent? _____________________________________________________________________5. What is the symbol for a forest?_____________________________________________________________________
Which map covers the most forest? _____________________ the least?__________________
6. What is the symbol for a mine shaft? ___________ Which map contains the most mineshafts? _____________________________________________________________________ 7. Which map covers the greatest amount of water? _____________________________________________________________________8. Is the water different colors? ________Why?________________________________________________________
_____________________________________________________________________ 9. Why are there contour lines in the ocean?
__________________________________________________________________________________________________________________________________________ 10. Which map has the most "relief." ______________________________________________________________________________ Why?____________________________________________________________________________________________________________________________ 11. How can you determine the type of area a topographic map covers by just glancing at it?
__________________________________________________________________________________________________________________________________________
12. Which map has the most rivers?
Math/Science Nucleus © 2000 11
_____________________________________________________________________
13. Compare all of the maps. How are they different?
14. Do highways and roads seem to follow the topography?
__________________________________________________________________________________________________________________________________________
How can topographic maps be useful for planning roads, building sites, and cities? _______________________________________________________________________________________________________________________________________________________________________________________________________________
15. Could a topographic map help you find your way through a city? __________ Why?_______________________________________________________________________________________________________________________________________________________________________________________________________________
16. How does a topographic map differ from a road map?
__________________________________________________________________________________________________________________________________________
17. If you were planning on going hiking, would you take a road map or a topographic map?
______________________________________________________________________________Why?_____________________________________________________________________________________________________________________________
Math/Science Nucleus © 2000 12
Teacher noteThere are different types of landforms in the U.S. Have students use clay to model
the surface of the different topographic maps. Have them try and figure out what thesurface would look like if the process that molded the land were rain, ice, heat, orvolcanoes.
Group students into 2 or 3 students to work on making a clay model of the differentlandforms. Give each group a topographic map and have them sketch the area that theyare going to model with the clay. By the end of the activity you should have examples ofthe following: glacial, river, wind, volcanoes, and shorelines.
Discuss with students the features that they created. Check the model to see if itreflects the topographic map. Students should draw a sketch of their model on their labsheet.
CREATING LANDFORMSLAB
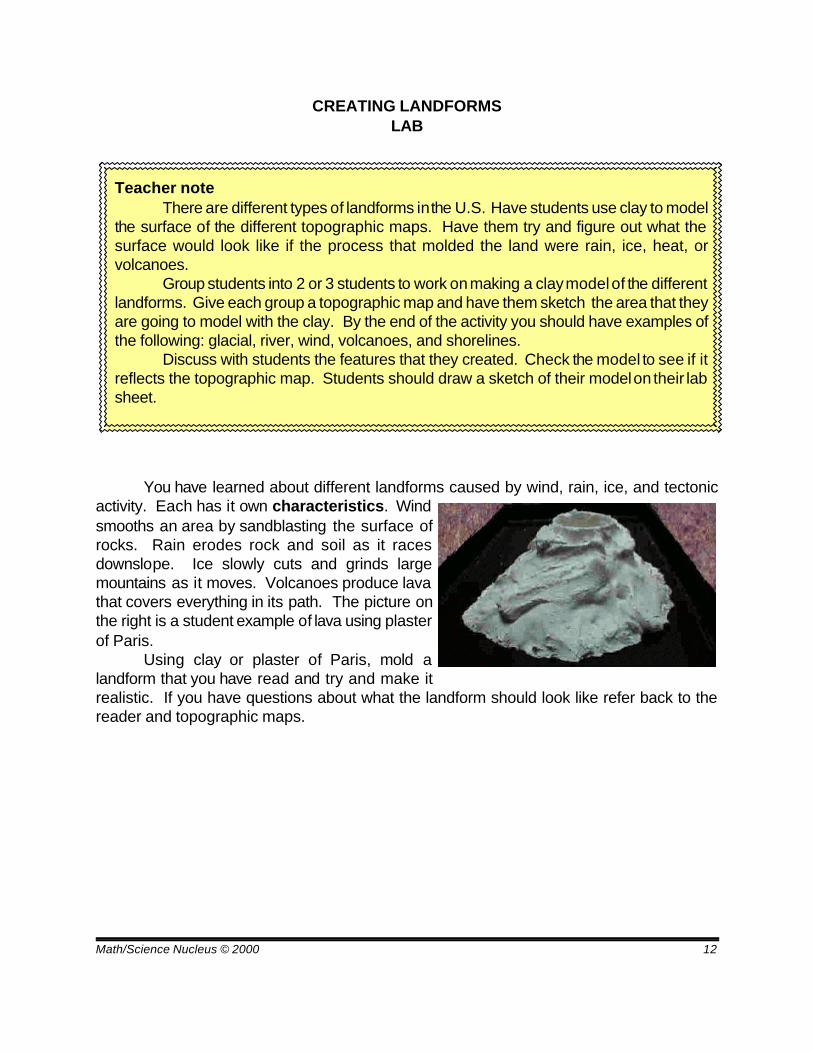
You have learned about different landforms caused by wind, rain, ice, and tectonicactivity. Each has it own characteristics. Windsmooths an area by sandblasting the surface ofrocks. Rain erodes rock and soil as it racesdownslope. Ice slowly cuts and grinds largemountains as it moves. Volcanoes produce lavathat covers everything in its path. The picture onthe right is a student example of lava using plasterof Paris.
Using clay or plaster of Paris, mold alandform that you have read and try and make itrealistic. If you have questions about what the landform should look like refer back to thereader and topographic maps.

Math/Science Nucleus © 2000 13
LANDFORMSLAB
PROBLEM: How do different landforms look as a topographic map? HYPOTHESIS: ________________________________________________________________
PROCEDURE:MATERIALS: topographic maps, clay
Look at the topographic map that your teacher has assigned to you from Lab 5. Drawa sketch of what you think your topographic map looks like, and then using the clay provided,try to model the topographic map. Note you do not have to make an exact replica, just close!DRAW SKETCH:
CONCLUSIONS: Compare your model with some other group that is modeling the sametopographic map. How does it compare?____________________________________________________________________________________________________________________________________________________________________________________________________________________________________________________________________________________
Math/Science Nucleus © 2000 14
Teacher noteThe lab revolves making a topographic model of Angel Island. This island is the
largest island in the San Francisco Bay and has had an exciting history over the last 6000years. We suggest you have the students read the story of Angel Island and then havethem make the topographic model.
For more information on Angel Island consult the official Angel Island website:
______________________________________________________________________
ANGEL ISLANDA STORY
EARLY HISTORY OF ANGEL ISLAND
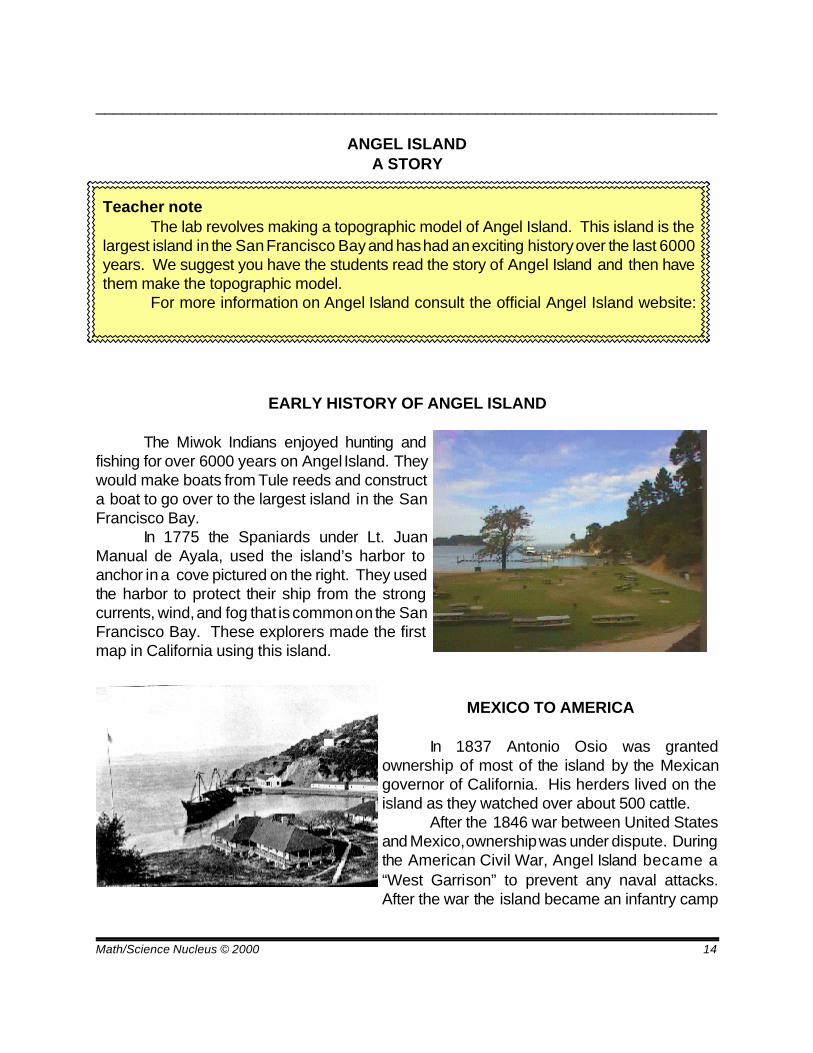
The Miwok Indians enjoyed hunting andfishing for over 6000 years on Angel Island. Theywould make boats from Tule reeds and constructa boat to go over to the largest island in the SanFrancisco Bay.
In 1775 the Spaniards under Lt. JuanManual de Ayala, used the island’s harbor toanchor in a cove pictured on the right. They usedthe harbor to protect their ship from the strongcurrents, wind, and fog that is common on the SanFrancisco Bay. These explorers made the firstmap in California using this island.
MEXICO TO AMERICA
In 1837 Antonio Osio was grantedownership of most of the island by the Mexicangovernor of California. His herders lived on theisland as they watched over about 500 cattle.
After the 1846 war between United Statesand Mexico, ownership was under dispute. Duringthe American Civil War, Angel Island became a“West Garrison” to prevent any naval attacks.After the war the island became an infantry camp
Math/Science Nucleus © 2000 15
for the U.S. military.
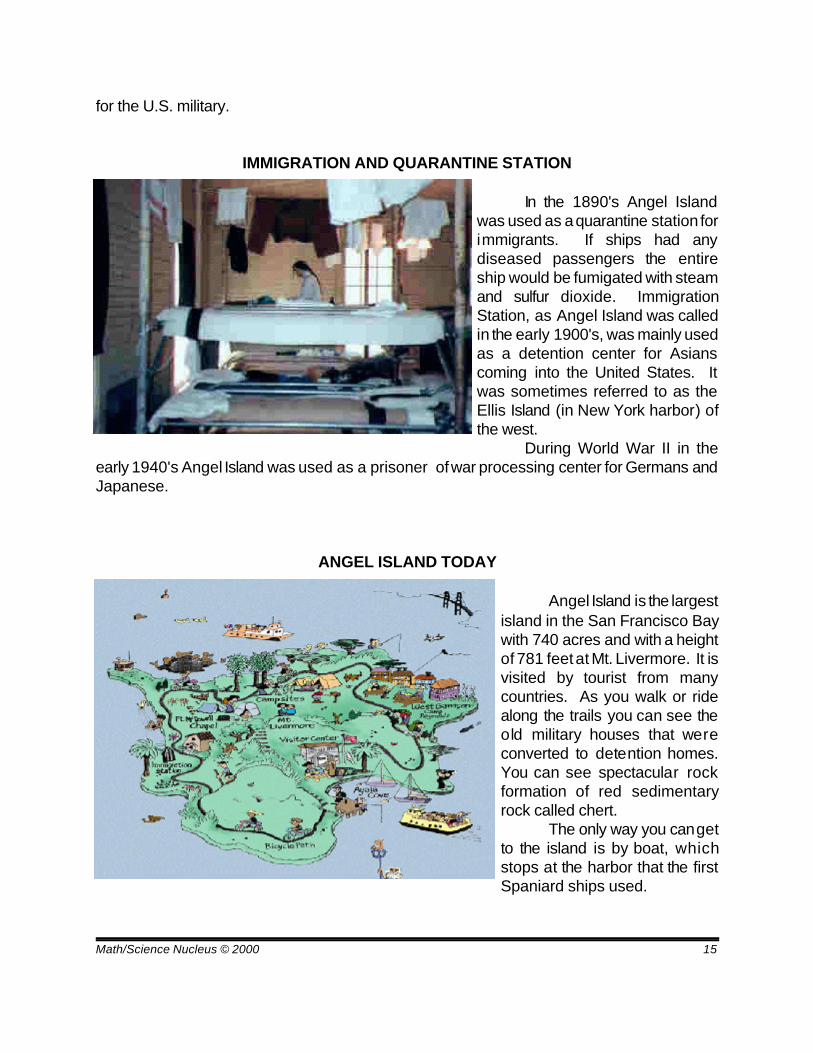
IMMIGRATION AND QUARANTINE STATION
In the 1890's Angel Islandwas used as a quarantine station forimmigrants. If ships had anydiseased passengers the entireship would be fumigated with steamand sulfur dioxide. ImmigrationStation, as Angel Island was calledin the early 1900's, was mainly usedas a detention center for Asianscoming into the United States. Itwas sometimes referred to as theEllis Island (in New York harbor) ofthe west.
During World War II in theearly 1940's Angel Island was used as a prisoner of war processing center for Germans andJapanese.
ANGEL ISLAND TODAY
Angel Island is the largestisland in the San Francisco Baywith 740 acres and with a heightof 781 feet at Mt. Livermore. It isvisited by tourist from manycountries. As you walk or ridealong the trails you can see theold military houses that wereconverted to detention homes.You can see spectacular rockformation of red sedimentaryrock called chert.
The only way you can getto the island is by boat, whichstops at the harbor that the firstSpaniard ships used.
Math/Science Nucleus © 2000 16
Teacher noteA topographic map can be used to make a relief map. The simplified
topographic map of Angel Island is ideal for this type of activity. Make at least 8copies of the simplified sheet, one for each contour. You can have up to 8 people ineach group to construct one relief map.
Have students roll out clay on a cutting boards with a rolling pin with two equalheight guides on either side of the board (thin wood). Cut out each contours and stackthem on each other to reflect the true topography of the area. You may want thestudents to make the contours more realistic by sculpting the sides to look morenatural.
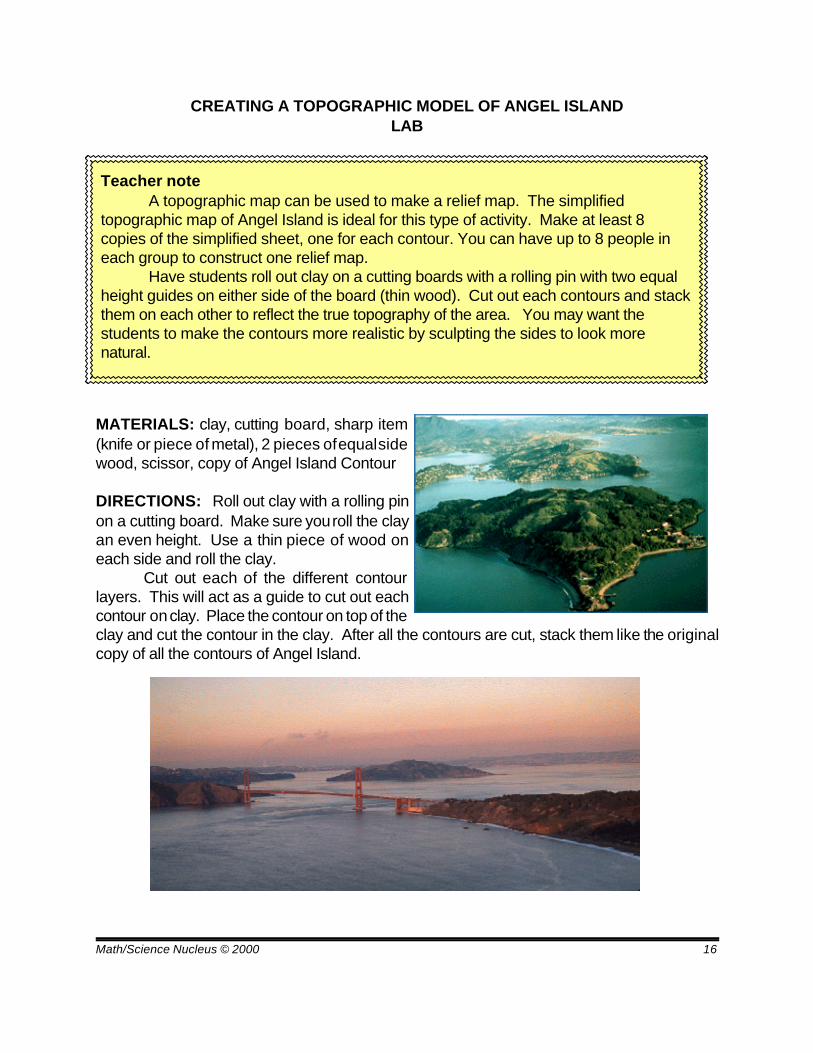
CREATING A TOPOGRAPHIC MODEL OF ANGEL ISLANDLAB
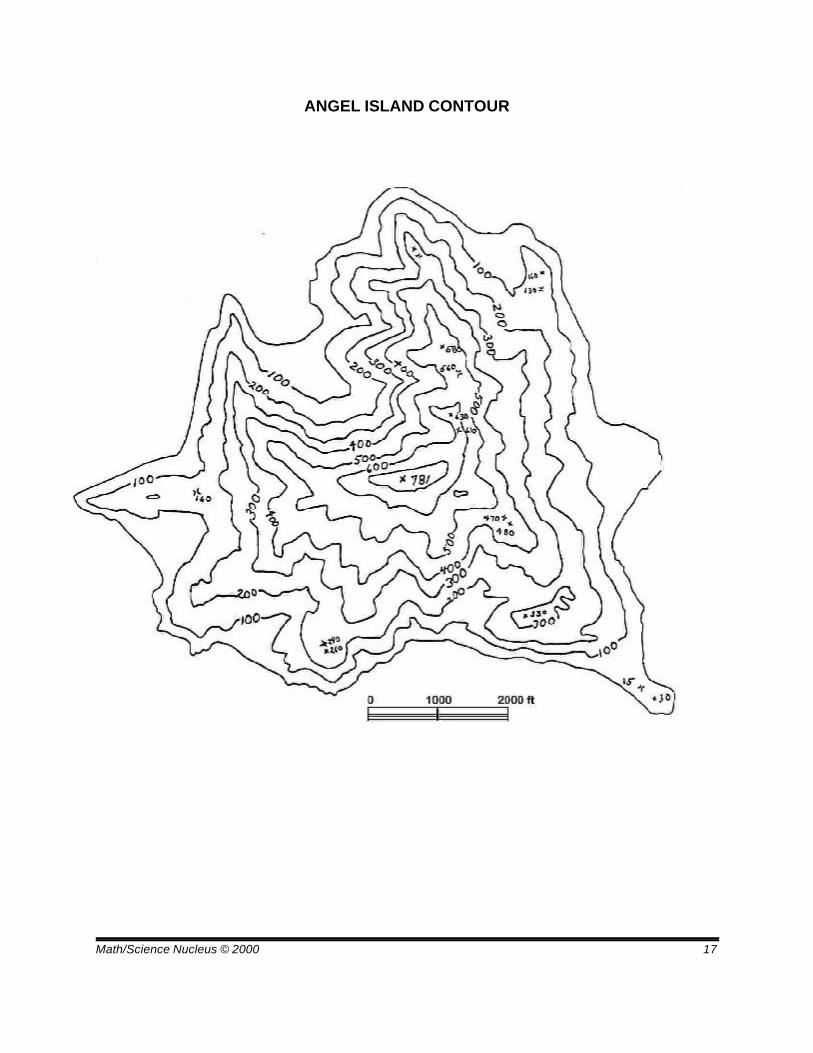
MATERIALS: clay, cutting board, sharp item(knife or piece of metal), 2 pieces of equal sidewood, scissor, copy of Angel Island Contour
DIRECTIONS: Roll out clay with a rolling pinon a cutting board. Make sure you roll the clayan even height. Use a thin piece of wood oneach side and roll the clay.
Cut out each of the different contourlayers. This will act as a guide to cut out eachcontour on clay. Place the contour on top of theclay and cut the contour in the clay. After all the contours are cut, stack them like the originalcopy of all the contours of Angel Island.
Math/Science Nucleus © 2000 17
ANGEL ISLAND CONTOUR
Math/Science Nucleus © 2000 18
MAPS AS TOOLS-INTERPRETING LANDFORMSTEACHER OUTLINE AND NOTES
I. What is a landform?
The shape of the Earth’s surface that has been accomplished by erosion or tectonicactivity.
A. Influenced by climate and rock type
B. Erosion includes water, ice, glaciers and heat
C. Tectonic includes earthquakes and volcanoes
II. Erosion and Weathering
Erosion is the process that loosens and moves sediment to another place on theEarth’s surface; weathering is the chemical and mechanical breakdown of rock with little orno transportation
A. Rocks erode at different rates so there are areas that are more resistant than others;this can produce different types of landforms with ridges, cliffs, or gentle slopes
B. Running water erodes areas in predictable stages depending on the amount of rainand the type of rock it is eroding; tectonic activity influences this erosion (i.e. Grand Canyonneeded uplifting of rocks for the water to keep eroding downward)
C. Almost every landform on the continent is related to a drainage system as waterfinds its way to large bodies of water
1. water is an overlay of other features caused by tectonics 2. rivers cause “V” shaped valleys because of the movement of the sediments
downstream
D. Ice is important feature in areas where it is cold throughout the year, but this isrestrictive to the northern and southern pole areas
1. Ice is more powerful than water for its erosive forces2. Glaciers can create U shaped valleys as they abrade the rocks around them;
their flow pattern is like a river3. Continental or sheet glaciers erode large area, contours are more difficult
to interpret with many different parameters
Math/Science Nucleus © 2000 19
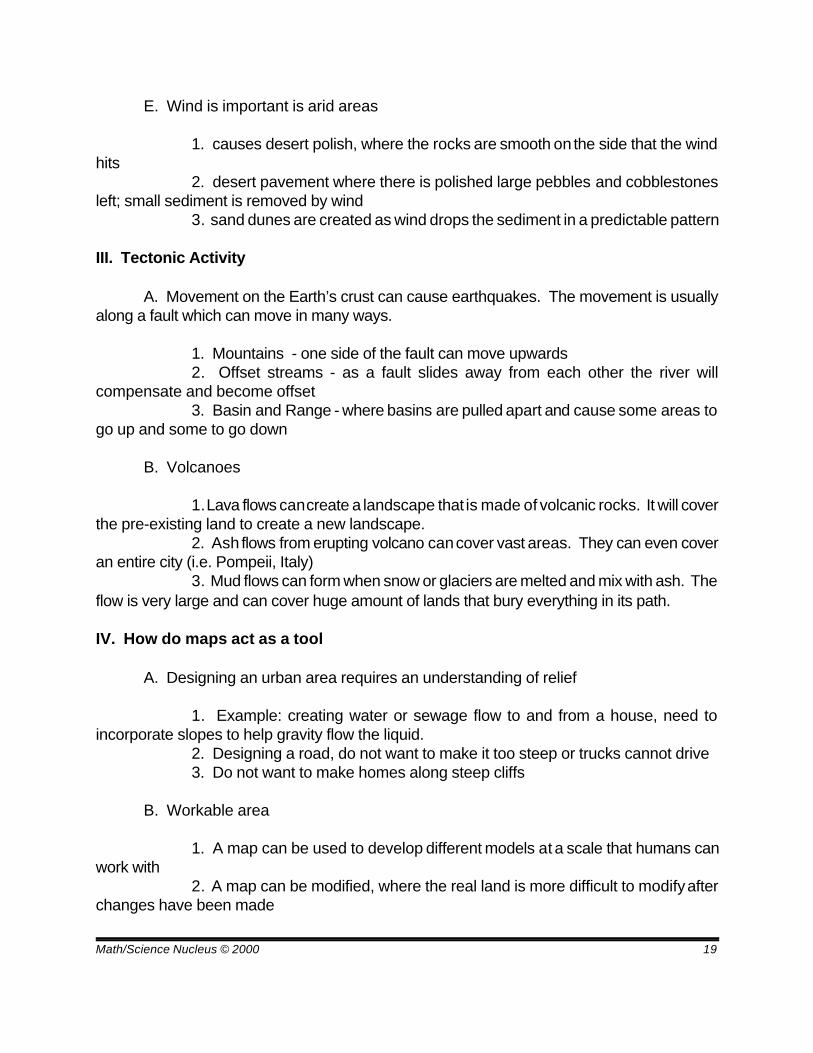
E. Wind is important is arid areas
1. causes desert polish, where the rocks are smooth on the side that the windhits
2. desert pavement where there is polished large pebbles and cobblestonesleft; small sediment is removed by wind
3. sand dunes are created as wind drops the sediment in a predictable pattern
III. Tectonic Activity
A. Movement on the Earth’s crust can cause earthquakes. The movement is usuallyalong a fault which can move in many ways.
1. Mountains - one side of the fault can move upwards2. Offset streams - as a fault slides away from each other the river will
compensate and become offset3. Basin and Range - where basins are pulled apart and cause some areas to
go up and some to go down
B. Volcanoes
1. Lava flows can create a landscape that is made of volcanic rocks. It will coverthe pre-existing land to create a new landscape.
2. Ash flows from erupting volcano can cover vast areas. They can even coveran entire city (i.e. Pompeii, Italy)
3. Mud flows can form when snow or glaciers are melted and mix with ash. Theflow is very large and can cover huge amount of lands that bury everything in its path.
IV. How do maps act as a tool
A. Designing an urban area requires an understanding of relief
1. Example: creating water or sewage flow to and from a house, need toincorporate slopes to help gravity flow the liquid.
2. Designing a road, do not want to make it too steep or trucks cannot drive3. Do not want to make homes along steep cliffs
B. Workable area
1. A map can be used to develop different models at a scale that humans canwork with
2. A map can be modified, where the real land is more difficult to modify afterchanges have been made
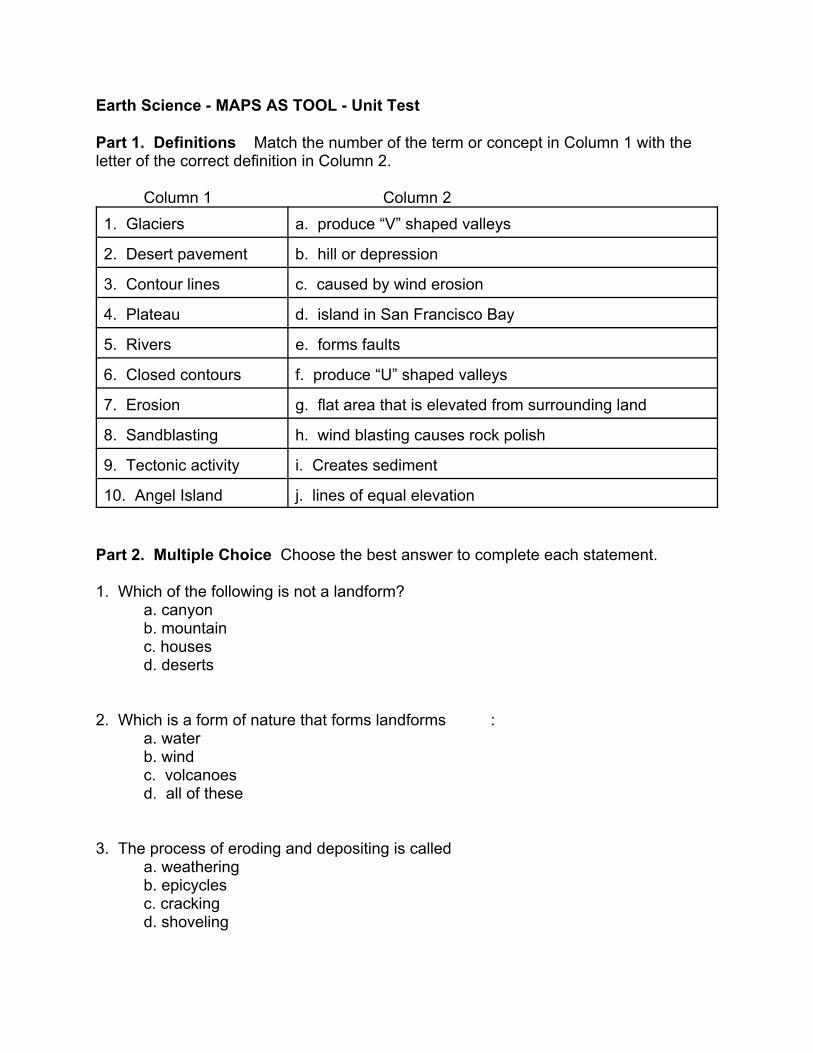
Earth Science - MAPS AS TOOL - Unit Test
Part 1. Definitions Match the number of the term or concept in Column 1 with theletter of the correct definition in Column 2.
Column 1 Column 21. Glaciers a. produce “V” shaped valleys
2. Desert pavement b. hill or depression
3. Contour lines c. caused by wind erosion
4. Plateau d. island in San Francisco Bay
5. Rivers e. forms faults
6. Closed contours f. produce “U” shaped valleys
7. Erosion g. flat area that is elevated from surrounding land
8. Sandblasting h. wind blasting causes rock polish
9. Tectonic activity i. Creates sediment
10. Angel Island j. lines of equal elevation
Part 2. Multiple Choice Choose the best answer to complete each statement.
1. Which of the following is not a landform?a. canyonb. mountainc. housesd. deserts
2. Which is a form of nature that forms landforms :a. waterb. windc. volcanoesd. all of these
3. The process of eroding and depositing is calleda. weatheringb. epicyclesc. crackingd. shoveling
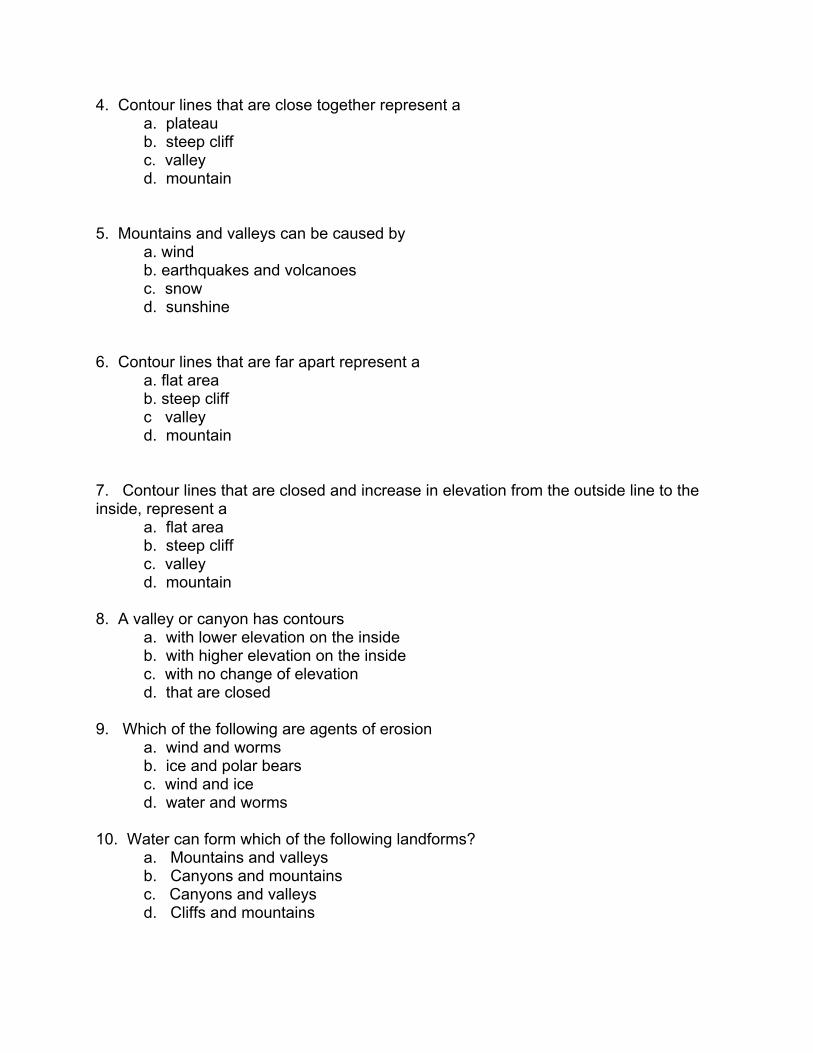
4. Contour lines that are close together represent a a. plateaub. steep cliffc. valleyd. mountain
5. Mountains and valleys can be caused bya. windb. earthquakes and volcanoesc. snowd. sunshine
6. Contour lines that are far apart represent a a. flat areab. steep cliffc valleyd. mountain
7. Contour lines that are closed and increase in elevation from the outside line to theinside, represent a
a. flat areab. steep cliffc. valleyd. mountain
8. A valley or canyon has contoursa. with lower elevation on the insideb. with higher elevation on the insidec. with no change of elevationd. that are closed
9. Which of the following are agents of erosiona. wind and wormsb. ice and polar bearsc. wind and iced. water and worms
10. Water can form which of the following landforms? a. Mountains and valleysb. Canyons and mountainsc. Canyons and valleysd. Cliffs and mountains
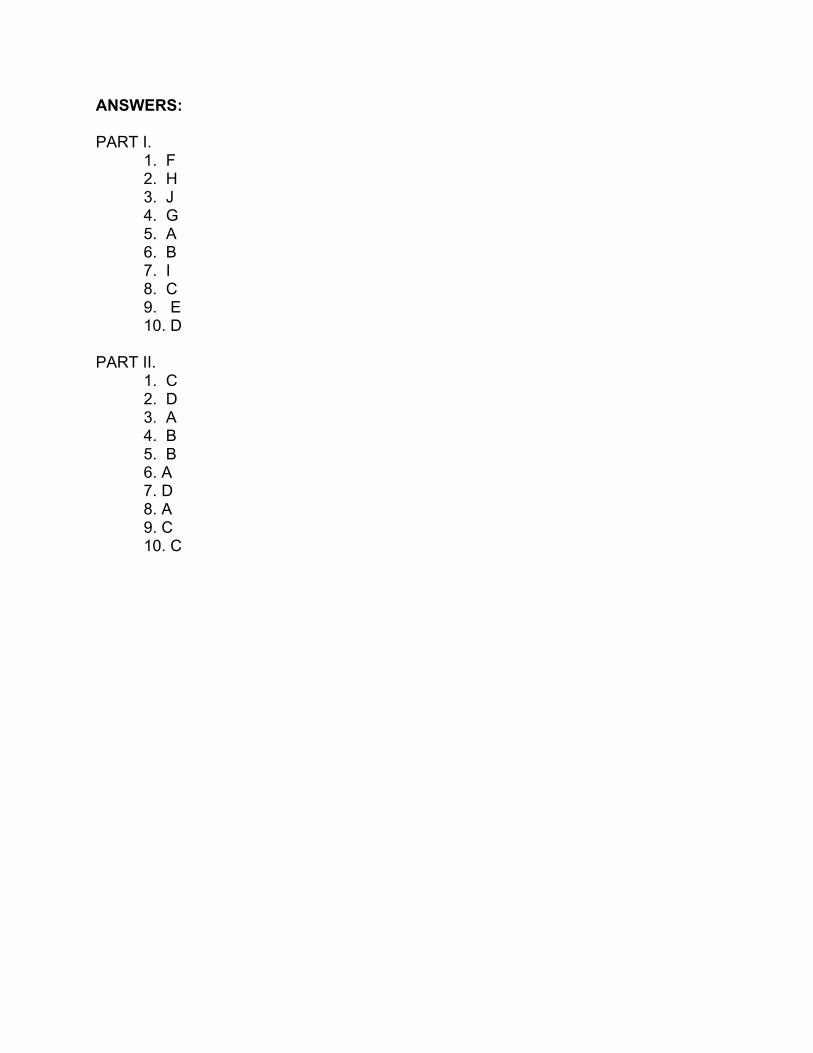
ANSWERS:
PART I.1. F2. H3. J4. G5. A6. B7. I8. C9. E10. D
PART II.1. C2. D3. A4. B5. B6. A7. D8. A9. C 10. C