Embed Size (px)
Citation preview

EARTH SURFACE PROCESSES AND LANDFORMSEarth Surf Process Landforms 34 1433ndash1445 (2009)Copyright copy 2009 John Wiley amp Sons LtdPublished online 1 July 2009 in Wiley InterScience(wwwintersciencewileycom) DOI 101002esp1840
John Wiley amp Sons LtdChichester UKESPEarth Surface Processes and LandformsEARTH SURFACE PROCESSES AND LANDFORMSEarth Surface Processes and LandformsThe Journal of the British Geomorphological Research GroupEarth Surf Process Landforms0197-93371096-9837Copyright copy 2006 John Wiley amp Sons LtdJohn Wiley amp Sons Ltd2006Earth ScienceEarth Science99999999ESP1840Research ArticleResearch ArticlesCopyright copy 2006 John Wiley amp Sons LtdJohn Wiley amp Sons Ltd2006
Assessing regional geodiversity the Iberian PeninsulaAssessing regional geodiversity the Iberian Peninsula
A Benito-Calvo12 A Peacuterez-Gonzaacutelez1 O Magri23 and P Meza2
1 Centro Nacional de Investigacioacuten sobre la Evolucioacuten Humana (CENIEH) Burgos Spain 2 Dipartimento di Scienze della Terra Universitagrave degli Studi di Modena e Reggio Emilia Modena Italy 3 Geography Division Mediterranean Institute University of Malta Msida Malta
Received 29 July 2008 Revised 10 April 2009 Accepted 6 May 2009
Correspondence to A Benito-Calvo Centro Nacional de Investigacioacuten sobre la Evolucioacuten Humana (CENIEH) Avda de la Paz 28 09004 Burgos Spain E-mail alfonsobenitoceniehes
ABSTRACT Geodiversity is a landscape characteristic related to the heterogeneity of the physical properties of the earth surfaceIn this work we quantify and compare geodiversity in several geodynamic zones of the Iberian Peninsula For this purpose we havedeveloped a geographic information system (GIS) procedure to carry out a regional terrain classification based on geodiversityfactors A classification process helped to produce a morphometric map (10 classes) a morphoclimatic map (five classes) and ageological map (15 classes) These three maps were combined using an overlay operation (union) to obtain the final terrainclassification (419 classes) which was then applied to calculate diversity landscape indices The latter were calculated usingcommon landscape diversity indices (Patch Richness Density Shannonrsquos Diversity Index Shannonrsquos Evenness Index SimpsonrsquosDiversity Index and Simpsonrsquos Evenness Index) provided by FRAGSTATS free software These indices were calculated for thewhole landscape of the main Iberian geological regions thus revealing a close relationship between some index values and thegeological and geomorphological characteristics The highest diversity values are associated with Alpine collisional orogens andreactivated chains of the Precambrian-Palaeozoic massif Intraplate orogen with sedimentary cover characterized by extensive planationsurfaces have lower values Mesozoic areas with no significant tectonic deformation and Cenozoic basins are characterized bythe lowest diversity values Amongst the latter the major diversity is associated with the most dissected basins which also presenthigher morphoclimatic variety Though depending on the chosen scale and the landscape classification criteria these indicesprovide an objective assessment of the regional geodiversity of Iberia Copyright copy 2009 John Wiley amp Sons Ltd
KEYWORDS geodiversity terrain classification spatial pattern analysis Iberian Peninsula GIS DEM DTM
Introduction
The appearance of a landscape is a complex concept influencednot only by several physical and biological factors but alsoby the observerrsquos subjective perception The physical factorssuch as lithology structure landforms processes and soilsconstitute the basis of a landscape and the key aspects todefine geodiversity In this way geodiversity can be expressedas the heterogeneity of the geological and geomorphologicalproperties of the earthrsquos surface (Nieto 2001 Gray 2004and references therein Kozlowski 2004 Carcavilla et al2007 Bruschi 2007 Serrano and Flantildeo 2007 Panizza andPiacente 2008) Physical unit characteristics and their spatialpattern on the earthrsquos surface control and interact withecological processes and biological elements (Barrio et al1997 Stallins 2006 Urban and Daniels 2006) georesourcesand abiotic heritage (Gray 2004 Carcavilla et al 2007Bruschi 2007) and human activity and culture (Panizza andPiacente 2003)
The mapping and spatial statistical analysis of the physical unitsenable to quantify describe and compare different landscapesproviding an objective and useful tool to understand the
singularity and geocomplexity of landscapes These analysiscan be carried out among coeval landscapes in several locations(Raines 2002) or throughout time facilitating the characteriza-tion of the landscape evolution in a region (Benito 2004)
The aim of this study is to assess the geodiversity of severalgeodynamic settings of the Iberian Peninsula through (1) thecharacterization and classification of its main physical propertiesand (2) the quantification of geodiversity considered as aspatial parameter which quantifies the amount of differentelements constituting the landscape and how such elementsare distributed throughout the landscape The quantification ofdiversity was carried out using the more representative diversityindices implemented in the FRAGSTATS spatial pattern program(McGarigal et al 2002) which we applied to a landscapeterrain classification The latter included the main geodiversityfactors and was elaborated through geographical informationsystem (GIS) techniques from the combination of morpho-metric geological and morphoclimatic maps These mapswere elaborated from datasets having a suitable resolution forthe different Iberian geological regions such as SRTM3 DEM(NASA Rodriacuteguez et al 2005) WorldClim Database (Hijmanset al 2005) and a geological map at a scale of 11 000 000
Copyright copy 2009 John Wiley amp Sons Ltd Earth Surf Process Landforms 34 1433ndash1445 (2009)DOI 101002esp
1434 EARTH SURFACE PROCESSES AND LANDFORMS
(Gabaldoacuten et al 1994) Climate and geological datasets wereclassified applying standard criteria based on morphogeneticregions (Chorley et al 1984) and litho-chronology respectivelySince there is not a standard method to classify morphometricareas (Guzzetti and Reichenbach 1994 Miliaresis and Argialas1999 Dragut and Blaschke 2006 Iwahashi and Pike 2007and references therein) we opted for a statistical classificationexploring the natural occurrence of morphometric parametersin order to include the natural variety of regional topographicareas in the Iberian regions From these classifications wecharacterized the major Iberian regions from a geomorpholo-gical perspective developing a method to quantify theirregional geodiversity
Study Area
The Iberian Peninsula constitutes a microplate situated in theconvergence zone between the Eurasian and African tectonic
plates which collided and joined with the MesomediterraneanPlate The Peninsula has an area of 582 480 km2 where fivemajor geological regions can be distinguished (Gabaldoacutenet al 1994 Vera et al 2004) In the west of the PeninsulaPrecambrian and Palaeozoic rocks of the Iberian Massif (firstregion Figure 1A) belong to the Variscan Orogeny A secondregion includes the Pyrenees and Cantabrian Range (Figures 1Aand 1B) which were formed by the collision of the Iberian andEuropean Plates deforming and uplifting Mesozoic-Cenozoicsediments and part of the Iberian Massif To the south andsoutheast of the Iberian Peninsula the Betic Chain defines a thirdregion which developed from the convergence of the Iberianand African plates It is composed of Triassic to Miocenesediments deposited in the Iberian foreland and sedimentarymetamorphic and magmatic rocks of the MesomediterraneanPlate A fourth major region comprises the intraplate orogens(Iberian Chain and Catalonian Coastal Range) formed by thetectonic inversion of an Upper Permian-Mesozoic rift systemduring the Cenozoic Alpine orogeny To the east of the Iberian
Figure 1 Geological and physiographic characteristics of the Iberian Peninsula (A) General geological map of Iberia simplified from Gabaldoacutenet al (1994) (B) Main topographic features of Iberia (shaded relief model derived from SRTM3 DEM)
Copyright copy 2009 John Wiley amp Sons Ltd Earth Surf Process Landforms 34 1433ndash1445 (2009)DOI 101002esp
ASSESSING REGIONAL GEODIVERSITY THE IBERIAN PENINSULA 1435
Massif and to the north of the Betic Chain areas of Mesozoicrocks with no substantial deformation are also present Thefifth region is represented by the Cenozoic Basins (Figure 1A)characterized mainly by intracratonic basins (Duero and TajoBasins) foreland basins (Ebro and Guadalquivir Basins) andintraorogenic basins (Betic and Iberian Ranges Pyrenees)Tectonic stress fields related to the convergence of the Eurasianand African plates caused reactivation of pre-existing tectonicstructures in the Iberian Massif forming several mountainchains without sedimentary cover during the Cenozoic Thesemountain ranges are located in the continental foreland area(North Portuguese Ranges Central System Montes de ToledoSierra Morena Figures 1A and 1B)
These major geological regions determine the geomorpholo-gical characteristics of Iberia (Gutieacuterrez 1994 Martiacuten-Serranoet al 2005) The relief is characterized by mean slopes of 7middot1degand a mean elevation of 647 m above sea level (asl) (sourceSRTM3 DEM 82 m times 82 m pixel size) caused by the predo-minance of the inland plateaux (Castilian Mesetas) and themountain ranges over the lowlands (coastal stretch or theGuadalquivir Depression Figure 1B)
Methods and Datasets
In order to estimate quantitatively geodiversity we started froman initial terrain classification so as to identify the physicalheterogeneity of the topography of Iberia This classificationwas elaborated using GIS techniques (ArcGIS 9middot2) and hasinvolved morphometric geological and morphoclimatic regionalclassifications The flowchart of this procedure is shown inFigure 2
The morphometric map was generated by applying statisticalclassification techniques to a multi-layer model (Miliaresisand Argialas 1999 Dragut and Blaschke 2006 Iwahashi andPike 2007 and references therein) which was composed ofmorphometric variables obtained from the SRTM3 DEM (ShuttleRadar Topographic Mission NASA Rodriacuteguez et al 2005 ftpe0srp01uecsnasagov) Using this digital elevation model(DEM) with a spatial resolution of 82 m (UTM H30N ED50projection) we obtained the main morphometric variableswhich were analysed using linear regression in order to assesstheir interdependence (Figure 2) From this analysis we selectedelevation slope tangential curvature and roughness (dispersion
Figure 2 Methodological procedure used to assess regional geodiversity in the Iberian Peninsula The geographical projection used in theprocedure is UTM H30N ED50
Copyright copy 2009 John Wiley amp Sons Ltd Earth Surf Process Landforms 34 1433ndash1445 (2009)DOI 101002esp
1436 EARTH SURFACE PROCESSES AND LANDFORMS
of unit vectors normal to the surface Hobson 1972 Feliciacutesimo1994) to construct the multi-layer model This was then classifiedusing the unsupervised ISODATA algorithm (Erdas Imagine 8middot6)In this unsupervised algorithm the number of classes wasdetermined using a previous clustering histogram (Figure 2)where we identified the natural occurrence of the major classesand their number (section 4middot1) The resulting map from thisclassification was analysed by studying the morphometric andgeomorphological definitions of the classes Such interpretationallowed us to obtain the final morphometric classification(Figure 2) composed of categories of homogeneous propertiesat the working scale
The geological classification was obtained from the geologicalmap of the Iberian Peninsula at a scale of 11 000 000 producedby the Spanish Geological Survey (IGME) in collaboration withthe Portuguese Geological Survey (Gabaldoacuten et al 1994)This geological map was simplified considering the generalgeological classes including also the types of rocks and theirages and then converted to a raster map (Figure 2)
The morphoclimatic regions of Iberia were determined usingthe criteria proposed by Chorley et al (1984) based on the meanannual temperature and precipitation considering also theseasonality The climatic data which we used in this classificationcorrespond to the precipitation and temperature surfaces ofthe WorldClim Database (httpwwwworldclimorg Figure 2)Hijmans et al (2005) elaborated these layers by means ofinterpolation from climatic records for the period 1950ndash2000and using as independent variables the latitude longitude andelevation (SRTM3 aggregated to 30 arc-second of spatial resolu-tion 1000 m) These precipitation and temperature raster surfaceswere converted to a point data layer which was plotted in themorphogenetic classification (Chorley et al 1984) assigninga morphogenetic region to every point
These three regional classifications (morphometric geologicaland morphoclimatic) were overlaid by performing a unionoperation which enabled us to obtain the final terrain classi-fication (Figure 2) Geodiversity measures from this classificationwere calculated using the landscape metric implemented inthe freely accessible software FRAGSTATS (Figure 2 McGarigalet al 2002 httpwwwumassedulandecoresearchfragstatsfragstatshtml) This software was developed to quantify thecharacteristics of landscapes and its components in the fieldof Landscape Ecology However there is a set of statisticalindices which are used for the description and comparisonof any categorical digital map (Raines 2002) Regardingdiversity a great variety of indices have been proposed toquantify the heterogeneity of categorical landscapes In thiswork we used and compared the results of the diversity indiceswhich are employed most extensively in landscape analysis(see McGarigal et al 2002) These indices include PatchRichness Density (PRD) Shannonrsquos Diversity Index (SHDI)Shannonrsquos Evenness Index (SHEI) Simpsonrsquos Diversity Index(SIDI) and Simpsonrsquos Evenness Index (SIEI) The definition andformulation of each index is explained in a later section Theanalysis was carried out for the whole Iberian Peninsula usingstandard methods provided by FRAGSTATS (McGarigal et al2002)
Regional Terrain Classification
Many definitions of geodiversity have been proposed (Nieto2001 see definitions in Gray 2004 Kozlowski 2004 Panizzaand Piacente 2008) where geology geomorphology andpedology are considered as the main geodiversity factors Inthis way we have developed a terrain classification whichconstitutes a model for the Iberian regional geodiversity based
on morphometric morphoclimatic and geological propertiesand indirectly soil properties (Schaetzl and Anderson 2006)
Morphometric classification
Morphometric classification has been carried out using a multi-layer model composed of height slope tangential curvatureand roughness which were derived from the free-accessSRTM3 DEM We selected these variables according to theirinfluence on natural processes and landforms (Tejero et al2006 Taud and Parrot 2005 Wilson and Gallant 2000 Mooreet al 1991 Moore et al 1993) and their low interdependence(linear correlation coefficients R between 0middot48 and 0middot05) Slopeaspect and tangential curvature were generated using ArcGIS9middot2 while roughness was estimated from the dispersion ofunit vectors normal to the surface (Hobson 1972 Feliciacutesimo1994) This method is based on the magnitude of vector sumR calculated considering the eight neighbours nearest toa given point i (3 times 3 square window) The magnitude of Rcan be obtained by its rectangular coordinates xi yi and zi
(Equation 1) which are defined by the slope (γ ) and aspect(Φ ) (Equation 2)
(1)
xi = sin γ i middot cos Φ i yi = sin γ i middot sin Φ i zi = cos γ i (2)
where R is reversibly proportional to the roughness in terrainsof minimum roughness where the vectors are parallel (minimumdispersion) the sum of vectors reaches its maximum valueand vice versa The magnitude of R normalized by a samplesize n is used to calculate the spherical variance υ (Band1989 Equation 3) where the roughness varies between zero(minimum roughness) and one (maximum roughness)
(3)
The classification of the multi-layer model was carried outusing ISODATA algorithm (Interactive Self-Organizing DataAnalysis Technique Erdas Imagine 8middot6) This algorithm performsclustering of the multivariate data to determine the charac-teristics of the natural groupings of cells The user must specifybeforehand the number of classes to perform this unsupervisedclassification In this study the number of classes was deter-mined by means of a clustering histogram analysis from aninitial clustering with a large number of classes (Figure 3) Thehistogram curve of this clustering shows nine major reachesseparated by natural breaks which constitute major changesin the generality of the clusters thus defining major classes(Figure 3)
Each of the nine major morphometric classes (Figure 4)defines a geometric signature (Pike 1988 Giles 1997 Iwahashiand Pike 2007) An initial analysis of these classes wascarried out from the morphometric parameter distributionsand from three-dimensional visual interpretation of the reliefusing a digital anaglyph generated from the SRTM3 DEM(Benito 2008) This analysis has allowed us to describe andinterpret the morphometric regions introducing a changewith regards to the class which includes the bottom of narrowvalleys and crests (Figure 4) characterized by maximum rough-ness and extreme curvatures This class was divided into twoclasses according to curvatures concave or negative valuesfor the narrow valleys (Unit VII) and convex or positive valuesfor the crests or ridges (Unit VIII) (Figure 5) In this way the
R x y zi i i= ( ) + ( ) + ( )sum sum sum2 2 2
υ = minus = minus1 1RRn
Copyright copy 2009 John Wiley amp Sons Ltd Earth Surf Process Landforms 34 1433ndash1445 (2009)DOI 101002esp
ASSESSING REGIONAL GEODIVERSITY THE IBERIAN PENINSULA 1437
final classification shows 10 terrain units (Figure 5) whichconstitute a model for the morphometric regions of Iberia
The distribution of these morphometric units conforms withthe topographical characteristics of the major regions of theIberian Peninsula (Gutieacuterrez 1994 Figure 5 and Table I) Themost extensive class corresponds to morphometric Class V(intermediate plateaux and plains) occupying 23 of theIberian surface (Table I) This class dominates the landscapeof the intracratonic basins (Duero Basin and Tajo Basin) incontrast to the Ebro and Guadalquivir foreland basins whereClasses I and II (lowest reliefs) cover more than 50 of theterritory (Table I) In the Pyrenees and the Cantabrian Range(Table I) the more extensive classes include steep and highterrains (Classes IV VI and X) whereas the landscape of theIberian Range and Central System intraplate orogens arecharacterized by the dominance of high plateaux (Class IXTable I) The Betic Chain characterized by extensional tectonics(Martiacuten-Algarra and Vera 2004) presents high percentages oflowlands (Classes I and II) although plateaux and steep landsappear as well (Table I Figure 5) The area of the Iberian Massifis occupied mostly by Classes I II III and V corresponding tolower and intermediate plains (Table I)
Morphoclimatic classification
Variations in latitude continentality and elevation cause a widevariety of climatic conditions in the Iberian Peninsula (Font1983 Ninyerola et al 2000 2005) Using the classificationproposed by Chorley et al (1984) and the climate surfacesof the WorldClim Database (Hijmans et al 2005 httpwwwworldclimorg) we could define the morphogenetic regionsof the Iberian Peninsula (ie Humid Mid-latitude Semi-aridArid and Dry Continental Figures 6A and 6B) except for twodata zones plotted outside of the conditions proposed by Chorleyet al (1984) (Figure 6A) These unclassified data belong tosome areas of the Pyrenees and the Serra da Estrela whereprecipitation is overestimated due to the uncertainty caused
Figure 3 Interpretation of the clustering histogram curve in order todetermine the natural of the terrain major classes (from one to nine)This histogram curve has been derived from an initial broad cluster ofthe multi-layer model composed of elevation slope tangential curvatureand roughness (dispersion of unit vectors normal to the surface)
Table I Distribution of the regional morphometric units in the Iberian Peninsula and its main geological regions See Figure 5 Values are inpercentages
Morphometric classes percentage of landscape ()
Class I Class II Class III Class IV Class V Class VI Class VII Class VIII Class IX Class X
Iberian Peninsula 15middot0 16middot3 11middot4 6middot6 23middot0 9middot5 1middot2 0middot9 10middot6 5middot4
Iberian Massif 11middot4 22middot2 17middot1 8middot6 18middot1 9middot1 1middot4 0middot9 5middot8 5middot3
Alpine OrogensPyrenees 2middot6 6middot6 7middot7 9middot9 7middot6 20middot1 5middot0 4middot7 4middot1 31middot6Cantabrian Range 6middot6 5middot0 13middot7 22middot2 8middot8 14middot7 4middot6 3middot6 6middot9 13middot9Betic Range 17middot1 12middot5 13middot0 8middot4 14middot7 12middot5 1middot5 1middot4 10middot7 8middot2Iberian Range 2middot4 2middot8 4middot8 5middot6 11middot1 17middot3 1middot9 1middot2 41middot3 11middot5Central System 0middot4 12middot4 10middot9 6middot8 12middot9 13middot1 1middot3 0middot7 28middot8 12middot8
Mesozoic cover with nosignificant deformation 35middot3 7middot0 11middot7 1middot8 25middot9 4middot6 0middot1 0middot1 13middot2 0middot2
Cenozoic BasinsDuero Basin 0middot0 0middot0 0middot0 0middot0 74middot3 5middot3 0middot0 0middot0 20middot2 0middot1Ebro Basin 10middot6 47middot9 15middot7 5middot4 11middot4 6middot7 0middot5 0middot6 0middot7 0middot4Tajo Basin 0middot1 19middot7 2middot2 0middot4 58middot0 9middot2 0middot1 0middot0 10middot2 0middot1Guadalquivir Basin 78middot9 14middot2 4middot4 0middot1 2middot0 0middot4 0middot0 0middot0 0middot0 0middot0
Figure 4 Morphometric parameter distributions of the nine classesderived from the application of the unsupervised classificationtechnique (ISODATA algorithm) to the multi-layer model
Copyright copy 2009 John Wiley amp Sons Ltd Earth Surf Process Landforms 34 1433ndash1445 (2009)DOI 101002esp
1438 EARTH SURFACE PROCESSES AND LANDFORMS
by the mountainous terrain (Hijmans et al 2005) Consequentlythese data were included in the Humid Mid-latitude Regionwhen the mean annual temperature is gt0 ordmC and in the Peri-glacial Region when the mean annual temperature is lt0 degC Inthis way we have obtained the final morphoclimatic classificationdefined by the five mentioned regions
Despite the uncertainty in some mountainous areas theapplication of these climatic data has improved significantlyprevious morphogenetic classifications where the whole Iberian
Peninsula was included in the Humid Mid-latitude Region(Chorley et al 1984) According to the WorldClim Databasemost of Iberia (70middot3) belongs to the Semi-arid morphoclimaticRegion (Figure 6B Table II) The Semi-arid zones occupy highpercentages in all of the geological units and constitutes 100of the Guadalquivir Basin (Table II) The Humid Mid-latitudeRegion extends mainly in the northern and north-western partsof the Iberian Massif and in the northern ranges (CantabrianRange and Pyrenees) whereas the Dry-continental Region is
Figure 5 Final morphometric classification and description of the 10 major morphometric units obtained after the interpretation of theunsupervised classification
Copyright copy 2009 John Wiley amp Sons Ltd Earth Surf Process Landforms 34 1433ndash1445 (2009)DOI 101002esp
ASSESSING REGIONAL GEODIVERSITY THE IBERIAN PENINSULA 1439
more characteristic of the inland high plateaux (Central SystemIberian Chain and Duero and Tajo Basins) Arid and Peri-glacial Regions are scarcely represented (Table II) being situatedrespectively in the south-eastern part of the Betic Chain (Almeriacutea)and at the highest peaks of the Pyrenees (Figures 6A and B)
Geological classification
In order to include the lithological chronological and structuralproperties in the geodiversity classification we used the Geolo-gical Map of the Iberian Peninsula (Gabaldoacuten et al 1994) Thismap is composed of 102 geological units which extend fromthe Precambrian to the Quaternary (Figure 1A) and includesthe main tectonic structures Due to the regional approachand scale of this work we have simplified this map using thegeneral type of rocks (sedimentary metamorphic plutonicand volcanic) combined with their general ages (QuaternaryTertiary Mesozoic Palaeozoic and Precambrian) This classifica-tion presents 13 litho-chronological units (Table III) besidestectonic structures and hydrological elements (main riversand water bodies)
The Peninsula is dominated by Cenozoic and Mesozoicsedimentary rocks (Table III Figure 1A) together with meta-
morphic and plutonic rocks located in the Iberian Massif andin some Alpine Orogens The volcanic units are less frequent(Table III) The rock age is dominated by the Cenozoic (Tertiarybasins and Quaternary) and Palaeozoic (Iberian Massif ) althoughMesozoic and Precambrian also have an important repre-sentation (Figure 1A Table III)
Final terrain classification
Once the morphometric morphoclimatic and geological mapswere elaborated the last step consisted in combining thesethree spatial datasets using an overlay union operation Fromthis operation we obtained a terrain classification representedby 419 discrete classes (Figure 7A)
The areal fractions of the derived classes are shown inFigure 7B The surface morphology of the most widespreadlithological materials in Iberia corresponding to sedimentaryrocks of Tertiary age (geological unit 11 Table III) is dominatedby the slopes of intermediate relief (morphometric unit IVFigure 7B-I) and to a lesser degree by coastal lands valleysand plains of low reliefs (morphometric units I and II) Thesemorphometric units predominate also on the Quaternarysediments while in the Mesozoic sedimentary rocks slopes
Figure 6 (A) Morphogenetic classes of the Iberian Peninsula using the classification proposed by Chorley et al (1984) The climatic datacorrespond to the WorldClim Database (Hijmans et al 2005) Some cities Al Almeria Av Aacutevila L Lisbon M Madrid O Oporto S Sevilla SCSantiago de Compostela Location of unclassified areas (see explanation in the text) Py Pyrenees SE Serra da Estrella (B) Distribution of themorphogenetic regions in the Iberian Peninsula
Table II Distribution of the morphogenetic types in the Iberian Peninsula and its main geologicalregions See Figure 6 and explanation in the text Values are in percentages
Morphogenetic types percentage of landscape ()
Arid Semi-aridDry
ContinentalHumid
Mid-latitude Peri-glacial
Iberian Peninsula 0middot3 70middot3 16middot0 13middot3 0middot1
Iberian Massif 0middot0 67middot6 7middot0 25middot4 0middot0
Alpine OrogensPyrenees 0middot0 48middot6 2middot1 47middot8 1middot4Cantabrian Range 0middot0 52middot2 2middot3 45middot5 0middot0Betic Range 2middot6 84middot7 12middot1 0middot6 0middot0Iberian Range 0middot0 57middot9 41middot4 0middot8 0middot0Central System 0middot0 39middot2 46middot6 14middot2 0middot0
Cenozoic BasinsDuero Basin 0middot0 38middot8 61middot2 0middot0 0middot0Ebro Basin 0middot0 79middot8 19middot8 0middot4 0middot0Tajo Basin 0middot0 80middot4 19middot6 0middot0 0middot0Guadalquivir Basin 0middot0 100middot0 0middot0 0middot0 0middot0
Copyright copy 2009 John Wiley amp Sons Ltd Earth Surf Process Landforms 34 1433ndash1445 (2009)DOI 101002esp
1440 EARTH SURFACE PROCESSES AND LANDFORMS
and plateaux of intermediate relief are the most frequent(Figure 7B-I) With regards to the remaining geological unitsthe morphometric units present a uniform distribution exceptfor the gaps associated mainly with the volcanic rocks (Figure7B-I) which are scarcely represented in the Iberian geology(Table III) Semi-arid conditions are dominant on most of thegeological units (Figure 7B-II) especially on the Tertiary sediments(Figure 7B-I) The latter also present a high percentage ofDry Continental morphoclimatic areas The plutonic and meta-morphic rocks of Precambrian and Palaeozoic age (geologicalunits 3 4 and 6) are characterized mainly by humid mid-latitude conditions (Figure 7B-II) characteristic of the northand northwest of Iberia The Semi-arid morphoclimatic Regiondominates over the low and intermediate reliefs (Figure 7B-III)while dry continental conditions are more frequent in the slopesand plateaux of the morphometric units IV and V The Humid
Mid-latitude morphoclimatic Region presents a uniform distribu-tion over the morphometric units (Figure 7B-III) HoweverPeri-glacial and Arid Regions show a more limited extent Theformer is associated exclusively with high reliefs in thePyrenees (morphoclimatic units VIII IX and X) whereas aridconditions are related to low relief and high relief of the BeticChain (Figure 7B-III)
Other terrain classifications could be carried out dependingon different research aims or working scales However thisclassification represents a model of the terrain variabilitywhich combines the properties and distribution of thegeomorphological features in Iberia at a regional scale (TablesIIndashIV Figure 7) The techniques used to classify the IberianPeninsula can be easily applied to other regions since theyare based on geological and morphoclimatic standard criteriaand the natural occurrence of morphometric parameters
Table III Proportion of the rock types and ages in the Iberian Peninsula landscape Values are in percentages
Ages Lithology
Sedimentary dagger Metamorphic dagger Volcanic dagger Plutonic dagger
Cenozoic (Quaternary) 14middot0 13 ndash 0middot1 12 ndashCenozoic (Tertiary) 30middot6 11 ndash 0middot1 10 ndashMesozoic 16middot7 9 ndash ndash 0middot2 8Palaeozoic 7middot5 7 9middot5 6 0middot5 5 10middot0 4Precambrian ndash 8middot4 3 0middot2 2 1middot1 1
dagger Litho-chronological units of the geological classification besides those of the tectonic structures (unit 14) and the main hydrological elements (unit 0)
Figure 7 Final terrain classification based on the overlay of the morphometric geological and morphoclimatic classifications (A) Map of thefinal terrain classification (B) Occurrences in the overlay operations (B-I) occurrences between the geological and the morphometric units (B-II)occurrences between the geological and the morphoclimatic units (B-III) occurrences between the morphometric and the morphoclimatic unitsThe description of the morphometric morphoclimatic and geological units is given in Figures 5 and 6 and Table III respectively
Copyright copy 2009 John Wiley amp Sons Ltd Earth Surf Process Landforms 34 1433ndash1445 (2009)DOI 101002esp
ASSESSING REGIONAL GEODIVERSITY THE IBERIAN PENINSULA 1441
Spatial Geodiversity Quantification
The geodiversity of the Iberian landscape has been estimatedusing FRAGSTATS (McGarigal et al 2002) This softwarequantifies the geometric and spatial configuration of landscapeclassifications operating at three information levels patch(an individual area of a map unit) class (a map unit) andlandscape (the map or mosaic) Patch metrics such as areaperimeter or density include low level information andconstitute the computational basis for several indices at highlevels (class and landscape) Diversity is considered a landscapeproperty defined by two components richness and evenness(Spellerberg and Fedor 2003) Richness constitutes the com-positional component of diversity and refers to the number ofdifferent classes in a categorical map Evenness correspondsto the structural component of diversity and quantifies thedistribution of the area among the different classes
There is a great variety of indices each of which measuresdiversity in a different way according to their weight in eitherone diversity component In order to assess geodiversity we haveapplied diversity landscape metrics which quantify richnessevenness and diversity using different formulations (Table IVMcGarigal et al 2002) Richness is a parameter partiallycontrolled by the scale since larger areas are generally moreheterogeneous than comparable smaller areas In an attemptto compare landscapes with different areas (Table IV) we haveapplied PRD which standardizes richness on a per area basis
Two very widely used diversity indices are SHDI and SIDISHDI is based on the Theory of Communication (Shannonand Weaver 1975) which considers diversity as equivalent tothe entropy or degree of uncertainty to predict a determinedpatch type in the landscape (Table IV) The SHDI absolutevalue is not particularly meaningful being used as a relativeindex for comparing different landscapes (McGarigal et al2002) SHDI is more sensitive to richness than evenness whileSIDI is less sensitive to the presence of rare types placing moreweight on the common patch types Specifically the value ofSIDI represents the likelihood that any two cells selectedrandomly would be different patch types (Table IV)
With regards to evenness we have applied the SHEI andthe SIEI These indices emphasize the evenness component oftheir respective diversity indices and are expressed as theobserved diversity divided by the maximum possible diversityfor a given patch richness (Table IV)
This set of quantitative indices has been applied to theproposed terrain classification and separately to each factorconsidered in this terrain classification In this way we havequantified the regional diversity of the landscape correspondingto the Iberian Peninsula and its main geological regions at the
scale considered for this study (Table V) This analysis wascarried out in order to compare the geodiversity variationsamong regions (Table V)
Results and Discussions
According to the proposed terrain classification PRD highestvalues occur in the Pyrenean Ranges and Central System andshow similar values in other Alpine orogens (Betic and IberianRanges) and the Cenozoic Basins Extensive geological regionssuch as the Iberian Massif (or the whole Iberian Peninsula)present the lowest values (Table V) In a first comparative analysisconsidering the area of these regions a substantial inversecorrelation between PRD values and area can be observed(Table V) This implies that the largest geological regions tendto have the lowest PRD values This high dependence of arealextent indicates that PRD is not a very suitable index to comparelandscapes with very different areas Similar to other richnessindices PRD is influenced by the number of classes and doesnot consider the relative abundance of classes or their spatialconfiguration Such characteristic suggests that richness indicesare insufficient to compare geological complexity amongdifferent landscapes since they do not provide informationabout the structure and are strongly influenced by the area
The geodiversity of the Iberian Peninsula has been estimatedas SHDI = 4middot5 or SIDI = 0middot98 (Table V) whereas its maingeological regions vary from 1middot4 to 4middot3 with regards to theSHDI and from 0middot68 to 0middot97 in the case of the SIDI Highestdiversity values are associated with reactivated old geologicalterrains (Iberian Massif ) followed by Alpine orogens systems(Figure 7) Collisional orogens present high values (SHDI =3middot2ndash4middot3 SIDI = 0middot96ndash0middot98) with the Cantabrian Range beingprominent (where Palaeozoic and Mesozoic rocks are widelyrepresented Figure 1A) and showing similar high values forthe Betic Chain and the Spanish part of the Pyrenees (Table Vand Figure 6) However intraplate orogens show disparatevalues The Iberian Range constitutes the orogen with the lowestdiversity values determined by a low diversity in morphometricclasses (Table V) extensively dominated by high plateaux(planation surfaces) However the whole landscape of theCentral System presents SHDI and SIDI values on the samelevel as collisional orogens (Figure 7) This high geodiversity inthe Alpine chains without sedimentary cover contributes signi-ficantly to the elevated diversity values of the Iberian Massif
Alternatively Cenozoic basins present the lowest diversityvalues (Table V and Figure 7) Foreland basins are characterizedby the extreme values controlled by different geomorphologicalevolution and climatic conditions the Ebro Basin reaches the
Table IV Set of landscape metrics selected to estimate geodiversity
Index Formulation Range Units
Patch Richness Density (PRD) PRD gt 0 without limit Number per 100 hectares
Shannonrsquos Diversity Index (SHDI) SHDI ge 0 without limit Information
Shannonrsquos Evenness Index (SHEI) 0 le SHEI le 1 None
Simpsonrsquos Diversity Index (SIDI) 0 le SIDI le 1 None
Simpsonrsquos Evenness Index (SIEI) 0 le SIEI le 1 None
Formulation parameters m number of patch units (classes) A total landscape area (in m2) Pi proportion of the landscape occupied by patch type i
PRD =mA
( )( )10 104 2
SHDI = minus=
sum( ln )P Pi ii
m
1
SHEI = minus=
sum( ln ) lnP P mi ii
m
1
SIDI = minus=
sum1 2
1
Pii
m
SIEI = minus minus ⎛⎝⎜
⎞⎠⎟=
sum1 112
1
Pmi
i
m
Copyright copy 2009 John Wiley amp Sons Ltd Earth Surf Process Landforms 34 1433ndash1445 (2009)DOI 101002esp
1442 EARTH SURFACE PROCESSES AND LANDFORMS
Tabl
eV
Geo
dive
rsity
mea
sure
s in
the
Iber
ian
Peni
nsul
a
Are
a(k
m2 )
PRD
SHD
ISH
EISI
DI
SIEI
MG
MG
CM
GM
GC
MG
MG
CM
GM
GC
MG
MG
C
Iber
ian
Peni
nsul
a58
248
10middot
0001
0middot00
000middot
0004
0middot71
11middot
974
4middot53
40middot
342
0middot72
90middot
751
0middot85
70middot
828
0middot98
10middot
952
0middot88
70middot
983
Iber
ian
Mas
sif
208
373
0middot00
000middot
0000
0middot00
072middot
047
1middot75
44middot
307
0middot88
90middot
665
0middot75
20middot
853
0middot79
00middot
978
0middot94
80middot
851
0middot98
1
Alp
ine
Oro
gens
Pyre
nees
2424
50middot
0002
0middot00
020middot
0036
2middot00
81middot
416
3middot74
30middot
872
0middot61
50middot
693
0middot82
60middot
644
0middot95
80middot
918
0middot71
60middot
963
Can
tabr
ian
Ran
ge43
256
0middot00
010middot
0001
0middot00
282middot
152
1middot71
54middot
286
0middot93
50middot
781
0middot78
90middot
868
0middot77
60middot
978
0middot96
50middot
873
0middot98
2B
etic
Ran
ge72
020
0middot00
010middot
0001
0middot00
132middot
144
1middot51
93middot
846
0middot93
10middot
592
0middot70
00middot
875
0middot73
30middot
968
0middot97
30middot
794
0middot97
2Ib
eria
n R
ange
4835
20middot
0001
0middot00
010middot
0011
1middot78
90middot
829
3middot16
40middot
777
0middot36
00middot
623
0middot76
60middot
367
0middot91
70middot
852
0middot40
80middot
923
Cen
tral S
yste
m28
836
0middot00
010middot
0001
0middot00
231middot
946
1middot52
14middot
006
0middot84
50middot
634
0middot72
90middot
835
0middot69
50middot
970
0middot92
80middot
765
0middot97
4
Mes
ozoi
c w
ith n
osi
gnifi
cant
def
orm
atio
n0middot
0000
0middot00
000middot
0004
1middot66
50middot
614
2middot33
80middot
723
0middot25
60middot
494
0middot77
00middot
286
0middot84
80middot
855
0middot31
50middot
855
Cen
ozoi
c B
asin
sD
uero
Bas
in49
186
0middot00
010middot
0001
0middot00
100middot
711
0middot67
52middot
018
0middot34
20middot
293
0middot42
20middot
404
0middot43
90middot
814
0middot46
20middot
487
0middot82
1Eb
ro B
asin
4099
80middot
0001
0middot00
010middot
0012
1middot58
30middot
649
2middot64
10middot
688
0middot28
20middot
533
0middot71
40middot
374
0middot89
00middot
793
0middot41
60middot
897
Tajo
Bas
in27
777
0middot00
020middot
0002
0middot00
181middot
218
0middot66
22middot
281
0middot52
90middot
287
0middot47
50middot
606
0middot38
60middot
804
0middot67
30middot
429
0middot81
1G
uada
lqui
vir
Bas
in15
780
0middot00
010middot
0001
0middot00
070middot
710
0middot82
51middot
439
0middot32
30middot
344
0middot36
20middot
356
0middot53
00middot
681
0middot40
00middot
583
0middot69
4
Res
ults
of t
he in
dice
s ca
lcul
atio
ns in
the
Iber
ian
Peni
nsul
a an
d its
mai
n ge
olog
ical
reg
ions
M m
orph
omet
ric
clas
sific
atio
n G
geo
logi
cal c
lass
ifica
tion
MG
C f
inal
terr
ain
clas
sific
atio
n ba
sed
on th
e ov
erla
y of
the
mor
phom
etri
c g
eolo
gica
l and
mor
phoc
limat
ic c
lass
ifica
tions
Copyright copy 2009 John Wiley amp Sons Ltd Earth Surf Process Landforms 34 1433ndash1445 (2009)DOI 101002esp
ASSESSING REGIONAL GEODIVERSITY THE IBERIAN PENINSULA 1443
highest SHDI and SIDI values among Cenozoic basins (Figure 7)mainly due to the deepest incision of drainage network duringthe Quaternary which increases the diversity of morphometricclasses (Table V) In the Guadalquivir Basin morphometricdiversity is lower (mostly lowlands of morphometric Class ITable I) in the same way as climatic variety represented byonly one morphogenetic region (Table II) The latter determinesthe lowest final diversity values of the Guadalquivir Basin(Table V Figure 7) Intracratonic basins present intermediatevalues although in this case SHDI and SIDI show differentdiversities The SHDI presents clearly higher values in theTajo Basin than in the Duero Basin (Figure 7) This may becontrolled by an important increase in the morphometricSHDI diversity in the Tajo Basin with respect to the DueroBasin (Table V) where 74middot3 of the surface is characterizedby intermediate plateaux (Class V Table I) Nevertheless withregards to the SIDI the Duero Basin presents slightly higher
diversity values than the Tajo Basin (Figure 7) In this casethe greater morphometric variety in the Tajo Basin has alower influence since SIDI is less sensitive to the presence ofrare types while the higher geological diversity and a moreregular distribution of the morphoclimatic regions in theDuero Basin have a greater weight (Table V and Figure 2)
The areas occupied by Mesozoic sedimentary cover withno deformation present similar low SHDI values as Cenozoicbasins (Figure 7A) in contrast to deformed terrains indicatingthat orogenic processes constitute a determining factor in theincrease of geodiversity
The results obtained from the application of evenness indicesshow limited relative variations regarding diversity values (Table VFigure 8) although the main relationships are maintained Thesevariations are related to the SHEI values of the largest arearegions (Iberian Massif and the whole Peninsula) which reducetheir relative values in relation to the other regions (Figure 9)
Figure 8 Diversity measures and geodynamic styles of the main geological regions of the Iberian Peninsula SHDI Shannonrsquos Diversity Index(units information) SIDI Simpsonrsquos Diversity Index (dimensionless)
Figure 9 Evenness measures and geodynamic styles of the main geological regions of the Iberian Peninsula SHEI Shannonrsquos Evenness Index(dimensionless) SIEI Simpsonrsquos Evenness Index (dimensionless)
Copyright copy 2009 John Wiley amp Sons Ltd Earth Surf Process Landforms 34 1433ndash1445 (2009)DOI 101002esp
1444 EARTH SURFACE PROCESSES AND LANDFORMS
In this case the highest diversity values correspond to theCantabrian Range (SHEI = 0middot79 SIEI = 0middot98) followed by theIberian Massif and the Central System The collisional ranges(Pyrenees and Betic Chain) show high evenness values toowhereas the Iberian Range presents again the lowest valueamong the Alpine orogens due to its lowest morphometricheterogeneity (Table I) The Mesozoic outcrops withoutsignificant deformation and the Cenozoic basins present thelowest SHEI and SIEI values showing similar proportionalrelations as the respective diversity values (Figures 8 and 9)
Diversity and evenness values present a clear relationship withthe geodynamic evolution of the analysed landscapes and theirvariations can be explained according to the particular geologicaland geomorphological characteristics of each region Thusthese indices represent a useful tool to compare geocomplexityin contemporary landscapes or throughout time (Benito2004) However some important aspects should be takeninto account when using these metric indices Diversity andevenness indices do not consider the importance of individualclasses or uniqueness quantifying exclusively the variety andarrangement of patch types in the landscape Thus metricindices are not absolute measures and the computed values area function of how the landscape is defined especially withregards to the classification criteria and the scale whichdetermine geodiversity at differents levels (Nieto 2001)Comparable landscapes must be defined using the sameresolution and criteria depending on the phenomena underanalysis In this way the assessment of geodiversity shouldstart by determining the heterogeneity of the factors used todefine the landscape (McGarigal et al 2002) We have useda model for regional geodiversity whose computed diversity valuescannot be extrapolated directly to be used for other detailedscales without further analysis but similar methodology couldbe employed to assess geodiversity at more detailed scales
Conclusions
In these last years several methodologies to assess geodiversityhave been developed (Carcavilla et al 2007 Bruschi 2007Serrano and Flantildeo 2007) in order to provide objectivetools for geoconservation and management of the abioticheritage In this work we have tested landscape diversity indices(MacGarigal et al 2002) to assess regional geodiversity inthe Iberian Peninsula The results indicate that these spatialdiversity indices may be very useful to assess geodiversity ifthey are applied in a comparative analysis for landscapes havingthe same criteria and spatial resolution
Using GIS techniques such as multi-layer statisticalclassification and dataset cross-tabulation we have developedan objective terrain classification for the Iberian Peninsulabased on morphometric geological and climatic criteria whichare applicable to other areas Morphometric and climatic datawere extracted from global databases (SRTM3 and WorldClimDatabase) which presented a suitable resolution to analyseregional areas while geological information was providedfrom a regional geological map The final terrain classificationrepresents a model of the regional earth surface variabilityand allowed us to categorize the mentioned properties in themain geological regions of Iberia The latter must constitutethe first stage to assess geodiversity since it is essential tounderstand landscapes and to interpret the diversity indexvalues
The terrain classification was applied to compute richnessdiversity and evenness indices in order to assess quanti-tatively the current regional geodiversity among the maingeological regions of Iberia Nevertheless the comparison of
landscapes of different origins and ages is also possible Richnessis a basic component of diversity but presents limitations toanalyse landscapes of diverse areal extent In this way PRDdid not allow us to perform a suitable comparison of Iberianlandscapes However the applied diversity and evenness indices(SHDI SHEI SIDI SIEI) showed similar results in most casespresenting a close association with the distribution of thegeological geomorphological and climatic characteristics ofthe Iberian regions In recent terrains with no significant tectonicsgeodiversity values increase mainly with higher morphoclimaticvariety and deeply incised regions causing a major morpholo-gical heterogeneity However the highest diversity and evennessvalues are related to deformed terrains In this case higherdiversities are mainly associated with ranges where reactivatedold massifs outcrop resulting in a large structural and litholo-gical complexity However the lowest diversity values arerelated to lower morphological variety in areas where planationsurfaces dominate
These results provide an objective approach to the relativeregional geodiversity in Iberia Nevertheless diversity indicesdo not provide information about uniqueness Thus in studieswhich focus on specific elements of geodiversity the informa-tion provided by these indices should be complemented withanalysis concerning the distinct elements in the landscapesIn the same way diversity index information can be combinedwith other spatial pattern indices in order to achieve a betterunderstanding of landscape spatial configuration
AcknowledgementsmdashThe authors would like to thank Professor MPanizza J Schmidt and three anonymous reviewers for their commentsand critical review of the manuscript Alfonso Benito Calvo was therecipient of a grant of the Spanish MEC postdoctoral programme
References
Band L 1989 Spatial aggregation of complex terrain GeographicalAnalyst 21 279ndash293
Barrio G Alvera B Puigdefabregas J Diacuteez C 1997 Response of highmountain landscape to topographic variables Central PyreneesLandscape Ecology 12(2) 95ndash115
Benito A 2004 Anaacutelisis geomorfoloacutegico y reconstruccioacuten depaleopaisajes neoacutegenos y cuaternarios en la Sierra de Atapuerca yel valle medio del riacuteo Arlanzoacuten Universidad Complutense deMadrid Madrid 381 pp
Benito A 2008 Anaglifo digital del relieve de la Peniacutensula IbeacutericaTierra y Tecnologiacutea 33 71ndash74
Bruschi VM 2007 Desarrollo de una metodologiacutea para lacaracterizacioacuten evaluacioacuten y gestioacuten de los recursos de lageodiversidad PhD Thesis Universidad de Cantabria Santander355 pp
Carcavilla L Loacutepez J Duraacuten JJ 2007 Patrimonio geoloacutegico ygeodiversidad investigacioacuten conservacioacuten y relacioacuten con losespacios naturales protegidos Cuadernos del Museo Geominero7 IGME Madrid 360 pp
Chorley RJ Schumm SA Sugden DE 1984 Geomorphology Methuenamp Co London 605 pp
Dragut L Blaschke T 2006 Automated classification of landformelements using object-based image analysis Geomorphology 81330ndash344
Feliciacutesimo AM 1994 Modelos Digitales del Terreno Introduccioacuten yAplicaciones en las Ciencias Ambientales Biblioteca de HistoriaNatural 3 Pentalfa Ediciones Oviedo 222 pp
Font I 1983 Atlas Climaacutetico de Espantildea Instituto Nacional deMeteorologiacutea Madrid 43 plates
Gabaldoacuten V et al 1994 Mapa Geoloacutegico de la Peniacutensula IbeacutericaBaleares y Canarias a escala 11 000 000 IGME Madrid
Giles PT 1997 Geomorphological signatures classification ofaggregated slope unit objects from digital elevation and remotesensing data Earth Surface Processes and Landforms 23 581ndash594
Copyright copy 2009 John Wiley amp Sons Ltd Earth Surf Process Landforms 34 1433ndash1445 (2009)DOI 101002esp
ASSESSING REGIONAL GEODIVERSITY THE IBERIAN PENINSULA 1445
Gray M 2004 Geodiversity Valuing and Conserving Abiotic NatureJohn Wiley amp Sons Chichester 434 pp
Gutieacuterrez M 1994 Principales rasgos fisiograacuteficos del territorioEspantildeol In Geomorfologiacutea de Espantildea Gutieacuterrez M (ed) RuedaAlcorcoacuten 1ndash9
Guzzetti F Reichenbach P 1994 Towards a definition of topographicdivisions for Italy Geomorphology 111 57ndash74
Hijmans RJ Cameron SE Parra JL Jones PG Jarvis A 2005 Veryhigh resolution interpolated climate surfaces for global lands areasInternational Journal of Climatology 25 1965ndash1978
Hobson RD 1972 Surface roughness in topography quantitativeapproach In Spatial Analysis in Geomorphology Chorley RJ (ed)Methuen amp Co London 221ndash245
Iwahashi J Pike RJ 2007 Automated classifications of topographyfrom DEMs by an unsupervised nested-means algorithm and three-part geometric signature Geomorphology 86 409ndash440
Kozlowski S 2004 Geodiversity The concept and scope of geodiversityPrzeglad Geologiczny 52(82) 833ndash837
Martiacuten-Algarra A Vera JA 2004 Evolucioacuten de la Cordillera Beacuterica InGeologiacutea de Espantildea Vera JA (ed) Geologiacutea de Espantildea SGE IGMEMadrid 437ndash444
Martiacuten-Serrano A et al 2005 Mapa Geomorfoloacutegico de Espantildea y delMargen Continental a escala 11 000 000 IGME Madrid
McGarigal K Cushman SA Neel MC Ene E 2002 FRAGSTATSSpatial Pattern Analysis Program for Categorical Maps Computersoftware program produced by the authors at the University ofMassachusetts Amherst httpwwwumassedulandecoresearchfragstatsfragstatshtml [last accessed 2008]
Miliaresis GCh Argialas DP 1999 Segmentation of physiographicfeatures from the global digital elevation modelGTOPO30Computers amp Geosciences 25 715ndash728
Moore ID Grayson RB Ladson AR 1991 Digital terrain modelling areview of hydrological geomorphological and biological applicationsHydrological Processes 5 3ndash30
Moore ID Turner AK Wilson JP Jenson SK Band LE 1993 GISand land-surface-subsurface process modelling In EnvironmentalModelling with GIS Goodchild MF Parks BO Steyaert LT (eds)Oxford University Press Oxford 196ndash230
Nieto LM 2001 Geodiversity proposal of an integrative definitionBoletiacuten Geoloacutegico y Minero 112(2) 3ndash12
Ninyerola M Pons X Roure JM 2000 A methodological approachof climatological modelling of air temperature and precipitationthrough GIS techniques International Journal of Climatology 201823ndash1841
Ninyerola M Pons X Roure JM 2005 Atlas Climaacutetico Digital de la
Peniacutensula Ibeacuterica Metodologiacutea y Aplicaciones en Bioclimatologiacutea yGeobotaacutenica Universidad Autoacutenoma de Barcelona Bellaterra
Panizza M Piacente S 2003 Geomorfologia Culturale PitagoraBologna 350 pp
Panizza M Piacente S 2008 La geodiversitagrave e una sua applicazionenel territorio emiliano Il Geologo dellrsquoEmilia-Romagna 29 35ndash37
Pike RJ 1988 The geometric signature quantifying landslide-terraintypes from digital elevation models Mathematical Geology 20(5)491ndash510
Raines GL 2002 Description and comparison of geological mapswith FRAGSTATS ndash a spatial statistics program Computers andGeosciences 28 169ndash177
Rodriacuteguez E Morris CS Belz JE Chapin EC Martiacuten JM Daffer WHensley S 2005 An Assessment of the SRTM TopographicProducts Technical Report JPL D-31639 Jet Propulsion LaboratoryPasadena CA 143 pp
Schaetzl RJ Anderson S 2006 Soils Genesis and GeomorphologyCambridge University Press Cambridge 817 pp
Serrano E Flantildeo P 2007 Geodiversity concept assessment andterritorial application The case of Tiermes-Caracena Boletiacuten de laAGE 45 389ndash393
Shannon CE Weaver W 1975 The Mathematical Theory ofCommunication University of Illinois Press Urbana IL 125 pp
Spellerberg I Fedor PJ 2003 A tribute to Claude Shannon (1916ndash2001) and a plea for more rigorous use of species richness speciesdiversity and the lsquoShannonndashWienerrsquo Index Global Ecology ampBiogeography 12 177ndash179
Stallins JA 2006 Geomorphology and ecology unifying themesfor complex systems in biogeomorphology Geomorphology 77207ndash216
Taud H Parrot J-F 2005 Measurement of DEM roughness usingthe local fractal dimension Geacuteomorphologie Relief ProcessusEnvironnement 4 327ndash338
Tejero R Gonzaacutelez-Casado JM Goacutemez-Ortiz D Saacutenchez-Serrano F2006 Insights into the tectonic topography of the present-daylandscape of the central Iberian Peninsula (Spain) Geomorphology76 280ndash294
Urban MA Daniels M 2006 Introduction exploring the links betweengeomorphology and ecology Geomorphology 77 203ndash206
Vera JA Ancochea A Barnolas A Bea F Calvo JP Civis J De VicenteG Feacuternandez-Gianotti J Garciacutea-Corteacutes A Peacuterez-Estauacuten A PujalteV Rodriacuteguez-Fernaacutendez LR Sopentildea A Tejero A 2004 Capiacutetulo 1In Geologiacutea de Espantildea Vera JA (ed) SGE IGME Madrid 3ndash17
Wilson JP Gallant JC 2000 Terrain Analysis Principles andApplications John Wiley amp Sons New York 1ndash27

Copyright copy 2009 John Wiley amp Sons Ltd Earth Surf Process Landforms 34 1433ndash1445 (2009)DOI 101002esp
1434 EARTH SURFACE PROCESSES AND LANDFORMS
(Gabaldoacuten et al 1994) Climate and geological datasets wereclassified applying standard criteria based on morphogeneticregions (Chorley et al 1984) and litho-chronology respectivelySince there is not a standard method to classify morphometricareas (Guzzetti and Reichenbach 1994 Miliaresis and Argialas1999 Dragut and Blaschke 2006 Iwahashi and Pike 2007and references therein) we opted for a statistical classificationexploring the natural occurrence of morphometric parametersin order to include the natural variety of regional topographicareas in the Iberian regions From these classifications wecharacterized the major Iberian regions from a geomorpholo-gical perspective developing a method to quantify theirregional geodiversity
Study Area
The Iberian Peninsula constitutes a microplate situated in theconvergence zone between the Eurasian and African tectonic
plates which collided and joined with the MesomediterraneanPlate The Peninsula has an area of 582 480 km2 where fivemajor geological regions can be distinguished (Gabaldoacutenet al 1994 Vera et al 2004) In the west of the PeninsulaPrecambrian and Palaeozoic rocks of the Iberian Massif (firstregion Figure 1A) belong to the Variscan Orogeny A secondregion includes the Pyrenees and Cantabrian Range (Figures 1Aand 1B) which were formed by the collision of the Iberian andEuropean Plates deforming and uplifting Mesozoic-Cenozoicsediments and part of the Iberian Massif To the south andsoutheast of the Iberian Peninsula the Betic Chain defines a thirdregion which developed from the convergence of the Iberianand African plates It is composed of Triassic to Miocenesediments deposited in the Iberian foreland and sedimentarymetamorphic and magmatic rocks of the MesomediterraneanPlate A fourth major region comprises the intraplate orogens(Iberian Chain and Catalonian Coastal Range) formed by thetectonic inversion of an Upper Permian-Mesozoic rift systemduring the Cenozoic Alpine orogeny To the east of the Iberian
Figure 1 Geological and physiographic characteristics of the Iberian Peninsula (A) General geological map of Iberia simplified from Gabaldoacutenet al (1994) (B) Main topographic features of Iberia (shaded relief model derived from SRTM3 DEM)
Copyright copy 2009 John Wiley amp Sons Ltd Earth Surf Process Landforms 34 1433ndash1445 (2009)DOI 101002esp
ASSESSING REGIONAL GEODIVERSITY THE IBERIAN PENINSULA 1435
Massif and to the north of the Betic Chain areas of Mesozoicrocks with no substantial deformation are also present Thefifth region is represented by the Cenozoic Basins (Figure 1A)characterized mainly by intracratonic basins (Duero and TajoBasins) foreland basins (Ebro and Guadalquivir Basins) andintraorogenic basins (Betic and Iberian Ranges Pyrenees)Tectonic stress fields related to the convergence of the Eurasianand African plates caused reactivation of pre-existing tectonicstructures in the Iberian Massif forming several mountainchains without sedimentary cover during the Cenozoic Thesemountain ranges are located in the continental foreland area(North Portuguese Ranges Central System Montes de ToledoSierra Morena Figures 1A and 1B)
These major geological regions determine the geomorpholo-gical characteristics of Iberia (Gutieacuterrez 1994 Martiacuten-Serranoet al 2005) The relief is characterized by mean slopes of 7middot1degand a mean elevation of 647 m above sea level (asl) (sourceSRTM3 DEM 82 m times 82 m pixel size) caused by the predo-minance of the inland plateaux (Castilian Mesetas) and themountain ranges over the lowlands (coastal stretch or theGuadalquivir Depression Figure 1B)
Methods and Datasets
In order to estimate quantitatively geodiversity we started froman initial terrain classification so as to identify the physicalheterogeneity of the topography of Iberia This classificationwas elaborated using GIS techniques (ArcGIS 9middot2) and hasinvolved morphometric geological and morphoclimatic regionalclassifications The flowchart of this procedure is shown inFigure 2
The morphometric map was generated by applying statisticalclassification techniques to a multi-layer model (Miliaresisand Argialas 1999 Dragut and Blaschke 2006 Iwahashi andPike 2007 and references therein) which was composed ofmorphometric variables obtained from the SRTM3 DEM (ShuttleRadar Topographic Mission NASA Rodriacuteguez et al 2005 ftpe0srp01uecsnasagov) Using this digital elevation model(DEM) with a spatial resolution of 82 m (UTM H30N ED50projection) we obtained the main morphometric variableswhich were analysed using linear regression in order to assesstheir interdependence (Figure 2) From this analysis we selectedelevation slope tangential curvature and roughness (dispersion
Figure 2 Methodological procedure used to assess regional geodiversity in the Iberian Peninsula The geographical projection used in theprocedure is UTM H30N ED50
Copyright copy 2009 John Wiley amp Sons Ltd Earth Surf Process Landforms 34 1433ndash1445 (2009)DOI 101002esp
1436 EARTH SURFACE PROCESSES AND LANDFORMS
of unit vectors normal to the surface Hobson 1972 Feliciacutesimo1994) to construct the multi-layer model This was then classifiedusing the unsupervised ISODATA algorithm (Erdas Imagine 8middot6)In this unsupervised algorithm the number of classes wasdetermined using a previous clustering histogram (Figure 2)where we identified the natural occurrence of the major classesand their number (section 4middot1) The resulting map from thisclassification was analysed by studying the morphometric andgeomorphological definitions of the classes Such interpretationallowed us to obtain the final morphometric classification(Figure 2) composed of categories of homogeneous propertiesat the working scale
The geological classification was obtained from the geologicalmap of the Iberian Peninsula at a scale of 11 000 000 producedby the Spanish Geological Survey (IGME) in collaboration withthe Portuguese Geological Survey (Gabaldoacuten et al 1994)This geological map was simplified considering the generalgeological classes including also the types of rocks and theirages and then converted to a raster map (Figure 2)
The morphoclimatic regions of Iberia were determined usingthe criteria proposed by Chorley et al (1984) based on the meanannual temperature and precipitation considering also theseasonality The climatic data which we used in this classificationcorrespond to the precipitation and temperature surfaces ofthe WorldClim Database (httpwwwworldclimorg Figure 2)Hijmans et al (2005) elaborated these layers by means ofinterpolation from climatic records for the period 1950ndash2000and using as independent variables the latitude longitude andelevation (SRTM3 aggregated to 30 arc-second of spatial resolu-tion 1000 m) These precipitation and temperature raster surfaceswere converted to a point data layer which was plotted in themorphogenetic classification (Chorley et al 1984) assigninga morphogenetic region to every point
These three regional classifications (morphometric geologicaland morphoclimatic) were overlaid by performing a unionoperation which enabled us to obtain the final terrain classi-fication (Figure 2) Geodiversity measures from this classificationwere calculated using the landscape metric implemented inthe freely accessible software FRAGSTATS (Figure 2 McGarigalet al 2002 httpwwwumassedulandecoresearchfragstatsfragstatshtml) This software was developed to quantify thecharacteristics of landscapes and its components in the fieldof Landscape Ecology However there is a set of statisticalindices which are used for the description and comparisonof any categorical digital map (Raines 2002) Regardingdiversity a great variety of indices have been proposed toquantify the heterogeneity of categorical landscapes In thiswork we used and compared the results of the diversity indiceswhich are employed most extensively in landscape analysis(see McGarigal et al 2002) These indices include PatchRichness Density (PRD) Shannonrsquos Diversity Index (SHDI)Shannonrsquos Evenness Index (SHEI) Simpsonrsquos Diversity Index(SIDI) and Simpsonrsquos Evenness Index (SIEI) The definition andformulation of each index is explained in a later section Theanalysis was carried out for the whole Iberian Peninsula usingstandard methods provided by FRAGSTATS (McGarigal et al2002)
Regional Terrain Classification
Many definitions of geodiversity have been proposed (Nieto2001 see definitions in Gray 2004 Kozlowski 2004 Panizzaand Piacente 2008) where geology geomorphology andpedology are considered as the main geodiversity factors Inthis way we have developed a terrain classification whichconstitutes a model for the Iberian regional geodiversity based
on morphometric morphoclimatic and geological propertiesand indirectly soil properties (Schaetzl and Anderson 2006)
Morphometric classification
Morphometric classification has been carried out using a multi-layer model composed of height slope tangential curvatureand roughness which were derived from the free-accessSRTM3 DEM We selected these variables according to theirinfluence on natural processes and landforms (Tejero et al2006 Taud and Parrot 2005 Wilson and Gallant 2000 Mooreet al 1991 Moore et al 1993) and their low interdependence(linear correlation coefficients R between 0middot48 and 0middot05) Slopeaspect and tangential curvature were generated using ArcGIS9middot2 while roughness was estimated from the dispersion ofunit vectors normal to the surface (Hobson 1972 Feliciacutesimo1994) This method is based on the magnitude of vector sumR calculated considering the eight neighbours nearest toa given point i (3 times 3 square window) The magnitude of Rcan be obtained by its rectangular coordinates xi yi and zi
(Equation 1) which are defined by the slope (γ ) and aspect(Φ ) (Equation 2)
(1)
xi = sin γ i middot cos Φ i yi = sin γ i middot sin Φ i zi = cos γ i (2)
where R is reversibly proportional to the roughness in terrainsof minimum roughness where the vectors are parallel (minimumdispersion) the sum of vectors reaches its maximum valueand vice versa The magnitude of R normalized by a samplesize n is used to calculate the spherical variance υ (Band1989 Equation 3) where the roughness varies between zero(minimum roughness) and one (maximum roughness)
(3)
The classification of the multi-layer model was carried outusing ISODATA algorithm (Interactive Self-Organizing DataAnalysis Technique Erdas Imagine 8middot6) This algorithm performsclustering of the multivariate data to determine the charac-teristics of the natural groupings of cells The user must specifybeforehand the number of classes to perform this unsupervisedclassification In this study the number of classes was deter-mined by means of a clustering histogram analysis from aninitial clustering with a large number of classes (Figure 3) Thehistogram curve of this clustering shows nine major reachesseparated by natural breaks which constitute major changesin the generality of the clusters thus defining major classes(Figure 3)
Each of the nine major morphometric classes (Figure 4)defines a geometric signature (Pike 1988 Giles 1997 Iwahashiand Pike 2007) An initial analysis of these classes wascarried out from the morphometric parameter distributionsand from three-dimensional visual interpretation of the reliefusing a digital anaglyph generated from the SRTM3 DEM(Benito 2008) This analysis has allowed us to describe andinterpret the morphometric regions introducing a changewith regards to the class which includes the bottom of narrowvalleys and crests (Figure 4) characterized by maximum rough-ness and extreme curvatures This class was divided into twoclasses according to curvatures concave or negative valuesfor the narrow valleys (Unit VII) and convex or positive valuesfor the crests or ridges (Unit VIII) (Figure 5) In this way the
R x y zi i i= ( ) + ( ) + ( )sum sum sum2 2 2
υ = minus = minus1 1RRn
Copyright copy 2009 John Wiley amp Sons Ltd Earth Surf Process Landforms 34 1433ndash1445 (2009)DOI 101002esp
ASSESSING REGIONAL GEODIVERSITY THE IBERIAN PENINSULA 1437
final classification shows 10 terrain units (Figure 5) whichconstitute a model for the morphometric regions of Iberia
The distribution of these morphometric units conforms withthe topographical characteristics of the major regions of theIberian Peninsula (Gutieacuterrez 1994 Figure 5 and Table I) Themost extensive class corresponds to morphometric Class V(intermediate plateaux and plains) occupying 23 of theIberian surface (Table I) This class dominates the landscapeof the intracratonic basins (Duero Basin and Tajo Basin) incontrast to the Ebro and Guadalquivir foreland basins whereClasses I and II (lowest reliefs) cover more than 50 of theterritory (Table I) In the Pyrenees and the Cantabrian Range(Table I) the more extensive classes include steep and highterrains (Classes IV VI and X) whereas the landscape of theIberian Range and Central System intraplate orogens arecharacterized by the dominance of high plateaux (Class IXTable I) The Betic Chain characterized by extensional tectonics(Martiacuten-Algarra and Vera 2004) presents high percentages oflowlands (Classes I and II) although plateaux and steep landsappear as well (Table I Figure 5) The area of the Iberian Massifis occupied mostly by Classes I II III and V corresponding tolower and intermediate plains (Table I)
Morphoclimatic classification
Variations in latitude continentality and elevation cause a widevariety of climatic conditions in the Iberian Peninsula (Font1983 Ninyerola et al 2000 2005) Using the classificationproposed by Chorley et al (1984) and the climate surfacesof the WorldClim Database (Hijmans et al 2005 httpwwwworldclimorg) we could define the morphogenetic regionsof the Iberian Peninsula (ie Humid Mid-latitude Semi-aridArid and Dry Continental Figures 6A and 6B) except for twodata zones plotted outside of the conditions proposed by Chorleyet al (1984) (Figure 6A) These unclassified data belong tosome areas of the Pyrenees and the Serra da Estrela whereprecipitation is overestimated due to the uncertainty caused
Figure 3 Interpretation of the clustering histogram curve in order todetermine the natural of the terrain major classes (from one to nine)This histogram curve has been derived from an initial broad cluster ofthe multi-layer model composed of elevation slope tangential curvatureand roughness (dispersion of unit vectors normal to the surface)
Table I Distribution of the regional morphometric units in the Iberian Peninsula and its main geological regions See Figure 5 Values are inpercentages
Morphometric classes percentage of landscape ()
Class I Class II Class III Class IV Class V Class VI Class VII Class VIII Class IX Class X
Iberian Peninsula 15middot0 16middot3 11middot4 6middot6 23middot0 9middot5 1middot2 0middot9 10middot6 5middot4
Iberian Massif 11middot4 22middot2 17middot1 8middot6 18middot1 9middot1 1middot4 0middot9 5middot8 5middot3
Alpine OrogensPyrenees 2middot6 6middot6 7middot7 9middot9 7middot6 20middot1 5middot0 4middot7 4middot1 31middot6Cantabrian Range 6middot6 5middot0 13middot7 22middot2 8middot8 14middot7 4middot6 3middot6 6middot9 13middot9Betic Range 17middot1 12middot5 13middot0 8middot4 14middot7 12middot5 1middot5 1middot4 10middot7 8middot2Iberian Range 2middot4 2middot8 4middot8 5middot6 11middot1 17middot3 1middot9 1middot2 41middot3 11middot5Central System 0middot4 12middot4 10middot9 6middot8 12middot9 13middot1 1middot3 0middot7 28middot8 12middot8
Mesozoic cover with nosignificant deformation 35middot3 7middot0 11middot7 1middot8 25middot9 4middot6 0middot1 0middot1 13middot2 0middot2
Cenozoic BasinsDuero Basin 0middot0 0middot0 0middot0 0middot0 74middot3 5middot3 0middot0 0middot0 20middot2 0middot1Ebro Basin 10middot6 47middot9 15middot7 5middot4 11middot4 6middot7 0middot5 0middot6 0middot7 0middot4Tajo Basin 0middot1 19middot7 2middot2 0middot4 58middot0 9middot2 0middot1 0middot0 10middot2 0middot1Guadalquivir Basin 78middot9 14middot2 4middot4 0middot1 2middot0 0middot4 0middot0 0middot0 0middot0 0middot0
Figure 4 Morphometric parameter distributions of the nine classesderived from the application of the unsupervised classificationtechnique (ISODATA algorithm) to the multi-layer model
Copyright copy 2009 John Wiley amp Sons Ltd Earth Surf Process Landforms 34 1433ndash1445 (2009)DOI 101002esp
1438 EARTH SURFACE PROCESSES AND LANDFORMS
by the mountainous terrain (Hijmans et al 2005) Consequentlythese data were included in the Humid Mid-latitude Regionwhen the mean annual temperature is gt0 ordmC and in the Peri-glacial Region when the mean annual temperature is lt0 degC Inthis way we have obtained the final morphoclimatic classificationdefined by the five mentioned regions
Despite the uncertainty in some mountainous areas theapplication of these climatic data has improved significantlyprevious morphogenetic classifications where the whole Iberian
Peninsula was included in the Humid Mid-latitude Region(Chorley et al 1984) According to the WorldClim Databasemost of Iberia (70middot3) belongs to the Semi-arid morphoclimaticRegion (Figure 6B Table II) The Semi-arid zones occupy highpercentages in all of the geological units and constitutes 100of the Guadalquivir Basin (Table II) The Humid Mid-latitudeRegion extends mainly in the northern and north-western partsof the Iberian Massif and in the northern ranges (CantabrianRange and Pyrenees) whereas the Dry-continental Region is
Figure 5 Final morphometric classification and description of the 10 major morphometric units obtained after the interpretation of theunsupervised classification
Copyright copy 2009 John Wiley amp Sons Ltd Earth Surf Process Landforms 34 1433ndash1445 (2009)DOI 101002esp
ASSESSING REGIONAL GEODIVERSITY THE IBERIAN PENINSULA 1439
more characteristic of the inland high plateaux (Central SystemIberian Chain and Duero and Tajo Basins) Arid and Peri-glacial Regions are scarcely represented (Table II) being situatedrespectively in the south-eastern part of the Betic Chain (Almeriacutea)and at the highest peaks of the Pyrenees (Figures 6A and B)
Geological classification
In order to include the lithological chronological and structuralproperties in the geodiversity classification we used the Geolo-gical Map of the Iberian Peninsula (Gabaldoacuten et al 1994) Thismap is composed of 102 geological units which extend fromthe Precambrian to the Quaternary (Figure 1A) and includesthe main tectonic structures Due to the regional approachand scale of this work we have simplified this map using thegeneral type of rocks (sedimentary metamorphic plutonicand volcanic) combined with their general ages (QuaternaryTertiary Mesozoic Palaeozoic and Precambrian) This classifica-tion presents 13 litho-chronological units (Table III) besidestectonic structures and hydrological elements (main riversand water bodies)
The Peninsula is dominated by Cenozoic and Mesozoicsedimentary rocks (Table III Figure 1A) together with meta-
morphic and plutonic rocks located in the Iberian Massif andin some Alpine Orogens The volcanic units are less frequent(Table III) The rock age is dominated by the Cenozoic (Tertiarybasins and Quaternary) and Palaeozoic (Iberian Massif ) althoughMesozoic and Precambrian also have an important repre-sentation (Figure 1A Table III)
Final terrain classification
Once the morphometric morphoclimatic and geological mapswere elaborated the last step consisted in combining thesethree spatial datasets using an overlay union operation Fromthis operation we obtained a terrain classification representedby 419 discrete classes (Figure 7A)
The areal fractions of the derived classes are shown inFigure 7B The surface morphology of the most widespreadlithological materials in Iberia corresponding to sedimentaryrocks of Tertiary age (geological unit 11 Table III) is dominatedby the slopes of intermediate relief (morphometric unit IVFigure 7B-I) and to a lesser degree by coastal lands valleysand plains of low reliefs (morphometric units I and II) Thesemorphometric units predominate also on the Quaternarysediments while in the Mesozoic sedimentary rocks slopes
Figure 6 (A) Morphogenetic classes of the Iberian Peninsula using the classification proposed by Chorley et al (1984) The climatic datacorrespond to the WorldClim Database (Hijmans et al 2005) Some cities Al Almeria Av Aacutevila L Lisbon M Madrid O Oporto S Sevilla SCSantiago de Compostela Location of unclassified areas (see explanation in the text) Py Pyrenees SE Serra da Estrella (B) Distribution of themorphogenetic regions in the Iberian Peninsula
Table II Distribution of the morphogenetic types in the Iberian Peninsula and its main geologicalregions See Figure 6 and explanation in the text Values are in percentages
Morphogenetic types percentage of landscape ()
Arid Semi-aridDry
ContinentalHumid
Mid-latitude Peri-glacial
Iberian Peninsula 0middot3 70middot3 16middot0 13middot3 0middot1
Iberian Massif 0middot0 67middot6 7middot0 25middot4 0middot0
Alpine OrogensPyrenees 0middot0 48middot6 2middot1 47middot8 1middot4Cantabrian Range 0middot0 52middot2 2middot3 45middot5 0middot0Betic Range 2middot6 84middot7 12middot1 0middot6 0middot0Iberian Range 0middot0 57middot9 41middot4 0middot8 0middot0Central System 0middot0 39middot2 46middot6 14middot2 0middot0
Cenozoic BasinsDuero Basin 0middot0 38middot8 61middot2 0middot0 0middot0Ebro Basin 0middot0 79middot8 19middot8 0middot4 0middot0Tajo Basin 0middot0 80middot4 19middot6 0middot0 0middot0Guadalquivir Basin 0middot0 100middot0 0middot0 0middot0 0middot0
Copyright copy 2009 John Wiley amp Sons Ltd Earth Surf Process Landforms 34 1433ndash1445 (2009)DOI 101002esp
1440 EARTH SURFACE PROCESSES AND LANDFORMS
and plateaux of intermediate relief are the most frequent(Figure 7B-I) With regards to the remaining geological unitsthe morphometric units present a uniform distribution exceptfor the gaps associated mainly with the volcanic rocks (Figure7B-I) which are scarcely represented in the Iberian geology(Table III) Semi-arid conditions are dominant on most of thegeological units (Figure 7B-II) especially on the Tertiary sediments(Figure 7B-I) The latter also present a high percentage ofDry Continental morphoclimatic areas The plutonic and meta-morphic rocks of Precambrian and Palaeozoic age (geologicalunits 3 4 and 6) are characterized mainly by humid mid-latitude conditions (Figure 7B-II) characteristic of the northand northwest of Iberia The Semi-arid morphoclimatic Regiondominates over the low and intermediate reliefs (Figure 7B-III)while dry continental conditions are more frequent in the slopesand plateaux of the morphometric units IV and V The Humid
Mid-latitude morphoclimatic Region presents a uniform distribu-tion over the morphometric units (Figure 7B-III) HoweverPeri-glacial and Arid Regions show a more limited extent Theformer is associated exclusively with high reliefs in thePyrenees (morphoclimatic units VIII IX and X) whereas aridconditions are related to low relief and high relief of the BeticChain (Figure 7B-III)
Other terrain classifications could be carried out dependingon different research aims or working scales However thisclassification represents a model of the terrain variabilitywhich combines the properties and distribution of thegeomorphological features in Iberia at a regional scale (TablesIIndashIV Figure 7) The techniques used to classify the IberianPeninsula can be easily applied to other regions since theyare based on geological and morphoclimatic standard criteriaand the natural occurrence of morphometric parameters
Table III Proportion of the rock types and ages in the Iberian Peninsula landscape Values are in percentages
Ages Lithology
Sedimentary dagger Metamorphic dagger Volcanic dagger Plutonic dagger
Cenozoic (Quaternary) 14middot0 13 ndash 0middot1 12 ndashCenozoic (Tertiary) 30middot6 11 ndash 0middot1 10 ndashMesozoic 16middot7 9 ndash ndash 0middot2 8Palaeozoic 7middot5 7 9middot5 6 0middot5 5 10middot0 4Precambrian ndash 8middot4 3 0middot2 2 1middot1 1
dagger Litho-chronological units of the geological classification besides those of the tectonic structures (unit 14) and the main hydrological elements (unit 0)
Figure 7 Final terrain classification based on the overlay of the morphometric geological and morphoclimatic classifications (A) Map of thefinal terrain classification (B) Occurrences in the overlay operations (B-I) occurrences between the geological and the morphometric units (B-II)occurrences between the geological and the morphoclimatic units (B-III) occurrences between the morphometric and the morphoclimatic unitsThe description of the morphometric morphoclimatic and geological units is given in Figures 5 and 6 and Table III respectively
Copyright copy 2009 John Wiley amp Sons Ltd Earth Surf Process Landforms 34 1433ndash1445 (2009)DOI 101002esp
ASSESSING REGIONAL GEODIVERSITY THE IBERIAN PENINSULA 1441
Spatial Geodiversity Quantification
The geodiversity of the Iberian landscape has been estimatedusing FRAGSTATS (McGarigal et al 2002) This softwarequantifies the geometric and spatial configuration of landscapeclassifications operating at three information levels patch(an individual area of a map unit) class (a map unit) andlandscape (the map or mosaic) Patch metrics such as areaperimeter or density include low level information andconstitute the computational basis for several indices at highlevels (class and landscape) Diversity is considered a landscapeproperty defined by two components richness and evenness(Spellerberg and Fedor 2003) Richness constitutes the com-positional component of diversity and refers to the number ofdifferent classes in a categorical map Evenness correspondsto the structural component of diversity and quantifies thedistribution of the area among the different classes
There is a great variety of indices each of which measuresdiversity in a different way according to their weight in eitherone diversity component In order to assess geodiversity we haveapplied diversity landscape metrics which quantify richnessevenness and diversity using different formulations (Table IVMcGarigal et al 2002) Richness is a parameter partiallycontrolled by the scale since larger areas are generally moreheterogeneous than comparable smaller areas In an attemptto compare landscapes with different areas (Table IV) we haveapplied PRD which standardizes richness on a per area basis
Two very widely used diversity indices are SHDI and SIDISHDI is based on the Theory of Communication (Shannonand Weaver 1975) which considers diversity as equivalent tothe entropy or degree of uncertainty to predict a determinedpatch type in the landscape (Table IV) The SHDI absolutevalue is not particularly meaningful being used as a relativeindex for comparing different landscapes (McGarigal et al2002) SHDI is more sensitive to richness than evenness whileSIDI is less sensitive to the presence of rare types placing moreweight on the common patch types Specifically the value ofSIDI represents the likelihood that any two cells selectedrandomly would be different patch types (Table IV)
With regards to evenness we have applied the SHEI andthe SIEI These indices emphasize the evenness component oftheir respective diversity indices and are expressed as theobserved diversity divided by the maximum possible diversityfor a given patch richness (Table IV)
This set of quantitative indices has been applied to theproposed terrain classification and separately to each factorconsidered in this terrain classification In this way we havequantified the regional diversity of the landscape correspondingto the Iberian Peninsula and its main geological regions at the
scale considered for this study (Table V) This analysis wascarried out in order to compare the geodiversity variationsamong regions (Table V)
Results and Discussions
According to the proposed terrain classification PRD highestvalues occur in the Pyrenean Ranges and Central System andshow similar values in other Alpine orogens (Betic and IberianRanges) and the Cenozoic Basins Extensive geological regionssuch as the Iberian Massif (or the whole Iberian Peninsula)present the lowest values (Table V) In a first comparative analysisconsidering the area of these regions a substantial inversecorrelation between PRD values and area can be observed(Table V) This implies that the largest geological regions tendto have the lowest PRD values This high dependence of arealextent indicates that PRD is not a very suitable index to comparelandscapes with very different areas Similar to other richnessindices PRD is influenced by the number of classes and doesnot consider the relative abundance of classes or their spatialconfiguration Such characteristic suggests that richness indicesare insufficient to compare geological complexity amongdifferent landscapes since they do not provide informationabout the structure and are strongly influenced by the area
The geodiversity of the Iberian Peninsula has been estimatedas SHDI = 4middot5 or SIDI = 0middot98 (Table V) whereas its maingeological regions vary from 1middot4 to 4middot3 with regards to theSHDI and from 0middot68 to 0middot97 in the case of the SIDI Highestdiversity values are associated with reactivated old geologicalterrains (Iberian Massif ) followed by Alpine orogens systems(Figure 7) Collisional orogens present high values (SHDI =3middot2ndash4middot3 SIDI = 0middot96ndash0middot98) with the Cantabrian Range beingprominent (where Palaeozoic and Mesozoic rocks are widelyrepresented Figure 1A) and showing similar high values forthe Betic Chain and the Spanish part of the Pyrenees (Table Vand Figure 6) However intraplate orogens show disparatevalues The Iberian Range constitutes the orogen with the lowestdiversity values determined by a low diversity in morphometricclasses (Table V) extensively dominated by high plateaux(planation surfaces) However the whole landscape of theCentral System presents SHDI and SIDI values on the samelevel as collisional orogens (Figure 7) This high geodiversity inthe Alpine chains without sedimentary cover contributes signi-ficantly to the elevated diversity values of the Iberian Massif
Alternatively Cenozoic basins present the lowest diversityvalues (Table V and Figure 7) Foreland basins are characterizedby the extreme values controlled by different geomorphologicalevolution and climatic conditions the Ebro Basin reaches the
Table IV Set of landscape metrics selected to estimate geodiversity
Index Formulation Range Units
Patch Richness Density (PRD) PRD gt 0 without limit Number per 100 hectares
Shannonrsquos Diversity Index (SHDI) SHDI ge 0 without limit Information
Shannonrsquos Evenness Index (SHEI) 0 le SHEI le 1 None
Simpsonrsquos Diversity Index (SIDI) 0 le SIDI le 1 None
Simpsonrsquos Evenness Index (SIEI) 0 le SIEI le 1 None
Formulation parameters m number of patch units (classes) A total landscape area (in m2) Pi proportion of the landscape occupied by patch type i
PRD =mA
( )( )10 104 2
SHDI = minus=
sum( ln )P Pi ii
m
1
SHEI = minus=
sum( ln ) lnP P mi ii
m
1
SIDI = minus=
sum1 2
1
Pii
m
SIEI = minus minus ⎛⎝⎜
⎞⎠⎟=
sum1 112
1
Pmi
i
m
Copyright copy 2009 John Wiley amp Sons Ltd Earth Surf Process Landforms 34 1433ndash1445 (2009)DOI 101002esp
1442 EARTH SURFACE PROCESSES AND LANDFORMS
Tabl
eV
Geo
dive
rsity
mea
sure
s in
the
Iber
ian
Peni
nsul
a
Are
a(k
m2 )
PRD
SHD
ISH
EISI
DI
SIEI
MG
MG
CM
GM
GC
MG
MG
CM
GM
GC
MG
MG
C
Iber
ian
Peni
nsul
a58
248
10middot
0001
0middot00
000middot
0004
0middot71
11middot
974
4middot53
40middot
342
0middot72
90middot
751
0middot85
70middot
828
0middot98
10middot
952
0middot88
70middot
983
Iber
ian
Mas
sif
208
373
0middot00
000middot
0000
0middot00
072middot
047
1middot75
44middot
307
0middot88
90middot
665
0middot75
20middot
853
0middot79
00middot
978
0middot94
80middot
851
0middot98
1
Alp
ine
Oro
gens
Pyre
nees
2424
50middot
0002
0middot00
020middot
0036
2middot00
81middot
416
3middot74
30middot
872
0middot61
50middot
693
0middot82
60middot
644
0middot95
80middot
918
0middot71
60middot
963
Can
tabr
ian
Ran
ge43
256
0middot00
010middot
0001
0middot00
282middot
152
1middot71
54middot
286
0middot93
50middot
781
0middot78
90middot
868
0middot77
60middot
978
0middot96
50middot
873
0middot98
2B
etic
Ran
ge72
020
0middot00
010middot
0001
0middot00
132middot
144
1middot51
93middot
846
0middot93
10middot
592
0middot70
00middot
875
0middot73
30middot
968
0middot97
30middot
794
0middot97
2Ib
eria
n R
ange
4835
20middot
0001
0middot00
010middot
0011
1middot78
90middot
829
3middot16
40middot
777
0middot36
00middot
623
0middot76
60middot
367
0middot91
70middot
852
0middot40
80middot
923
Cen
tral S
yste
m28
836
0middot00
010middot
0001
0middot00
231middot
946
1middot52
14middot
006
0middot84
50middot
634
0middot72
90middot
835
0middot69
50middot
970
0middot92
80middot
765
0middot97
4
Mes
ozoi
c w
ith n
osi
gnifi
cant
def
orm
atio
n0middot
0000
0middot00
000middot
0004
1middot66
50middot
614
2middot33
80middot
723
0middot25
60middot
494
0middot77
00middot
286
0middot84
80middot
855
0middot31
50middot
855
Cen
ozoi
c B
asin
sD
uero
Bas
in49
186
0middot00
010middot
0001
0middot00
100middot
711
0middot67
52middot
018
0middot34
20middot
293
0middot42
20middot
404
0middot43
90middot
814
0middot46
20middot
487
0middot82
1Eb
ro B
asin
4099
80middot
0001
0middot00
010middot
0012
1middot58
30middot
649
2middot64
10middot
688
0middot28
20middot
533
0middot71
40middot
374
0middot89
00middot
793
0middot41
60middot
897
Tajo
Bas
in27
777
0middot00
020middot
0002
0middot00
181middot
218
0middot66
22middot
281
0middot52
90middot
287
0middot47
50middot
606
0middot38
60middot
804
0middot67
30middot
429
0middot81
1G
uada
lqui
vir
Bas
in15
780
0middot00
010middot
0001
0middot00
070middot
710
0middot82
51middot
439
0middot32
30middot
344
0middot36
20middot
356
0middot53
00middot
681
0middot40
00middot
583
0middot69
4
Res
ults
of t
he in
dice
s ca
lcul
atio
ns in
the
Iber
ian
Peni
nsul
a an
d its
mai
n ge
olog
ical
reg
ions
M m
orph
omet
ric
clas
sific
atio
n G
geo
logi
cal c
lass
ifica
tion
MG
C f
inal
terr
ain
clas
sific
atio
n ba
sed
on th
e ov
erla
y of
the
mor
phom
etri
c g
eolo
gica
l and
mor
phoc
limat
ic c
lass
ifica
tions
Copyright copy 2009 John Wiley amp Sons Ltd Earth Surf Process Landforms 34 1433ndash1445 (2009)DOI 101002esp
ASSESSING REGIONAL GEODIVERSITY THE IBERIAN PENINSULA 1443
highest SHDI and SIDI values among Cenozoic basins (Figure 7)mainly due to the deepest incision of drainage network duringthe Quaternary which increases the diversity of morphometricclasses (Table V) In the Guadalquivir Basin morphometricdiversity is lower (mostly lowlands of morphometric Class ITable I) in the same way as climatic variety represented byonly one morphogenetic region (Table II) The latter determinesthe lowest final diversity values of the Guadalquivir Basin(Table V Figure 7) Intracratonic basins present intermediatevalues although in this case SHDI and SIDI show differentdiversities The SHDI presents clearly higher values in theTajo Basin than in the Duero Basin (Figure 7) This may becontrolled by an important increase in the morphometricSHDI diversity in the Tajo Basin with respect to the DueroBasin (Table V) where 74middot3 of the surface is characterizedby intermediate plateaux (Class V Table I) Nevertheless withregards to the SIDI the Duero Basin presents slightly higher
diversity values than the Tajo Basin (Figure 7) In this casethe greater morphometric variety in the Tajo Basin has alower influence since SIDI is less sensitive to the presence ofrare types while the higher geological diversity and a moreregular distribution of the morphoclimatic regions in theDuero Basin have a greater weight (Table V and Figure 2)
The areas occupied by Mesozoic sedimentary cover withno deformation present similar low SHDI values as Cenozoicbasins (Figure 7A) in contrast to deformed terrains indicatingthat orogenic processes constitute a determining factor in theincrease of geodiversity
The results obtained from the application of evenness indicesshow limited relative variations regarding diversity values (Table VFigure 8) although the main relationships are maintained Thesevariations are related to the SHEI values of the largest arearegions (Iberian Massif and the whole Peninsula) which reducetheir relative values in relation to the other regions (Figure 9)
Figure 8 Diversity measures and geodynamic styles of the main geological regions of the Iberian Peninsula SHDI Shannonrsquos Diversity Index(units information) SIDI Simpsonrsquos Diversity Index (dimensionless)
Figure 9 Evenness measures and geodynamic styles of the main geological regions of the Iberian Peninsula SHEI Shannonrsquos Evenness Index(dimensionless) SIEI Simpsonrsquos Evenness Index (dimensionless)
Copyright copy 2009 John Wiley amp Sons Ltd Earth Surf Process Landforms 34 1433ndash1445 (2009)DOI 101002esp
1444 EARTH SURFACE PROCESSES AND LANDFORMS
In this case the highest diversity values correspond to theCantabrian Range (SHEI = 0middot79 SIEI = 0middot98) followed by theIberian Massif and the Central System The collisional ranges(Pyrenees and Betic Chain) show high evenness values toowhereas the Iberian Range presents again the lowest valueamong the Alpine orogens due to its lowest morphometricheterogeneity (Table I) The Mesozoic outcrops withoutsignificant deformation and the Cenozoic basins present thelowest SHEI and SIEI values showing similar proportionalrelations as the respective diversity values (Figures 8 and 9)
Diversity and evenness values present a clear relationship withthe geodynamic evolution of the analysed landscapes and theirvariations can be explained according to the particular geologicaland geomorphological characteristics of each region Thusthese indices represent a useful tool to compare geocomplexityin contemporary landscapes or throughout time (Benito2004) However some important aspects should be takeninto account when using these metric indices Diversity andevenness indices do not consider the importance of individualclasses or uniqueness quantifying exclusively the variety andarrangement of patch types in the landscape Thus metricindices are not absolute measures and the computed values area function of how the landscape is defined especially withregards to the classification criteria and the scale whichdetermine geodiversity at differents levels (Nieto 2001)Comparable landscapes must be defined using the sameresolution and criteria depending on the phenomena underanalysis In this way the assessment of geodiversity shouldstart by determining the heterogeneity of the factors used todefine the landscape (McGarigal et al 2002) We have useda model for regional geodiversity whose computed diversity valuescannot be extrapolated directly to be used for other detailedscales without further analysis but similar methodology couldbe employed to assess geodiversity at more detailed scales
Conclusions
In these last years several methodologies to assess geodiversityhave been developed (Carcavilla et al 2007 Bruschi 2007Serrano and Flantildeo 2007) in order to provide objectivetools for geoconservation and management of the abioticheritage In this work we have tested landscape diversity indices(MacGarigal et al 2002) to assess regional geodiversity inthe Iberian Peninsula The results indicate that these spatialdiversity indices may be very useful to assess geodiversity ifthey are applied in a comparative analysis for landscapes havingthe same criteria and spatial resolution
Using GIS techniques such as multi-layer statisticalclassification and dataset cross-tabulation we have developedan objective terrain classification for the Iberian Peninsulabased on morphometric geological and climatic criteria whichare applicable to other areas Morphometric and climatic datawere extracted from global databases (SRTM3 and WorldClimDatabase) which presented a suitable resolution to analyseregional areas while geological information was providedfrom a regional geological map The final terrain classificationrepresents a model of the regional earth surface variabilityand allowed us to categorize the mentioned properties in themain geological regions of Iberia The latter must constitutethe first stage to assess geodiversity since it is essential tounderstand landscapes and to interpret the diversity indexvalues
The terrain classification was applied to compute richnessdiversity and evenness indices in order to assess quanti-tatively the current regional geodiversity among the maingeological regions of Iberia Nevertheless the comparison of
landscapes of different origins and ages is also possible Richnessis a basic component of diversity but presents limitations toanalyse landscapes of diverse areal extent In this way PRDdid not allow us to perform a suitable comparison of Iberianlandscapes However the applied diversity and evenness indices(SHDI SHEI SIDI SIEI) showed similar results in most casespresenting a close association with the distribution of thegeological geomorphological and climatic characteristics ofthe Iberian regions In recent terrains with no significant tectonicsgeodiversity values increase mainly with higher morphoclimaticvariety and deeply incised regions causing a major morpholo-gical heterogeneity However the highest diversity and evennessvalues are related to deformed terrains In this case higherdiversities are mainly associated with ranges where reactivatedold massifs outcrop resulting in a large structural and litholo-gical complexity However the lowest diversity values arerelated to lower morphological variety in areas where planationsurfaces dominate
These results provide an objective approach to the relativeregional geodiversity in Iberia Nevertheless diversity indicesdo not provide information about uniqueness Thus in studieswhich focus on specific elements of geodiversity the informa-tion provided by these indices should be complemented withanalysis concerning the distinct elements in the landscapesIn the same way diversity index information can be combinedwith other spatial pattern indices in order to achieve a betterunderstanding of landscape spatial configuration
AcknowledgementsmdashThe authors would like to thank Professor MPanizza J Schmidt and three anonymous reviewers for their commentsand critical review of the manuscript Alfonso Benito Calvo was therecipient of a grant of the Spanish MEC postdoctoral programme
References
Band L 1989 Spatial aggregation of complex terrain GeographicalAnalyst 21 279ndash293
Barrio G Alvera B Puigdefabregas J Diacuteez C 1997 Response of highmountain landscape to topographic variables Central PyreneesLandscape Ecology 12(2) 95ndash115
Benito A 2004 Anaacutelisis geomorfoloacutegico y reconstruccioacuten depaleopaisajes neoacutegenos y cuaternarios en la Sierra de Atapuerca yel valle medio del riacuteo Arlanzoacuten Universidad Complutense deMadrid Madrid 381 pp
Benito A 2008 Anaglifo digital del relieve de la Peniacutensula IbeacutericaTierra y Tecnologiacutea 33 71ndash74
Bruschi VM 2007 Desarrollo de una metodologiacutea para lacaracterizacioacuten evaluacioacuten y gestioacuten de los recursos de lageodiversidad PhD Thesis Universidad de Cantabria Santander355 pp
Carcavilla L Loacutepez J Duraacuten JJ 2007 Patrimonio geoloacutegico ygeodiversidad investigacioacuten conservacioacuten y relacioacuten con losespacios naturales protegidos Cuadernos del Museo Geominero7 IGME Madrid 360 pp
Chorley RJ Schumm SA Sugden DE 1984 Geomorphology Methuenamp Co London 605 pp
Dragut L Blaschke T 2006 Automated classification of landformelements using object-based image analysis Geomorphology 81330ndash344
Feliciacutesimo AM 1994 Modelos Digitales del Terreno Introduccioacuten yAplicaciones en las Ciencias Ambientales Biblioteca de HistoriaNatural 3 Pentalfa Ediciones Oviedo 222 pp
Font I 1983 Atlas Climaacutetico de Espantildea Instituto Nacional deMeteorologiacutea Madrid 43 plates
Gabaldoacuten V et al 1994 Mapa Geoloacutegico de la Peniacutensula IbeacutericaBaleares y Canarias a escala 11 000 000 IGME Madrid
Giles PT 1997 Geomorphological signatures classification ofaggregated slope unit objects from digital elevation and remotesensing data Earth Surface Processes and Landforms 23 581ndash594
Copyright copy 2009 John Wiley amp Sons Ltd Earth Surf Process Landforms 34 1433ndash1445 (2009)DOI 101002esp
ASSESSING REGIONAL GEODIVERSITY THE IBERIAN PENINSULA 1445
Gray M 2004 Geodiversity Valuing and Conserving Abiotic NatureJohn Wiley amp Sons Chichester 434 pp
Gutieacuterrez M 1994 Principales rasgos fisiograacuteficos del territorioEspantildeol In Geomorfologiacutea de Espantildea Gutieacuterrez M (ed) RuedaAlcorcoacuten 1ndash9
Guzzetti F Reichenbach P 1994 Towards a definition of topographicdivisions for Italy Geomorphology 111 57ndash74
Hijmans RJ Cameron SE Parra JL Jones PG Jarvis A 2005 Veryhigh resolution interpolated climate surfaces for global lands areasInternational Journal of Climatology 25 1965ndash1978
Hobson RD 1972 Surface roughness in topography quantitativeapproach In Spatial Analysis in Geomorphology Chorley RJ (ed)Methuen amp Co London 221ndash245
Iwahashi J Pike RJ 2007 Automated classifications of topographyfrom DEMs by an unsupervised nested-means algorithm and three-part geometric signature Geomorphology 86 409ndash440
Kozlowski S 2004 Geodiversity The concept and scope of geodiversityPrzeglad Geologiczny 52(82) 833ndash837
Martiacuten-Algarra A Vera JA 2004 Evolucioacuten de la Cordillera Beacuterica InGeologiacutea de Espantildea Vera JA (ed) Geologiacutea de Espantildea SGE IGMEMadrid 437ndash444
Martiacuten-Serrano A et al 2005 Mapa Geomorfoloacutegico de Espantildea y delMargen Continental a escala 11 000 000 IGME Madrid
McGarigal K Cushman SA Neel MC Ene E 2002 FRAGSTATSSpatial Pattern Analysis Program for Categorical Maps Computersoftware program produced by the authors at the University ofMassachusetts Amherst httpwwwumassedulandecoresearchfragstatsfragstatshtml [last accessed 2008]
Miliaresis GCh Argialas DP 1999 Segmentation of physiographicfeatures from the global digital elevation modelGTOPO30Computers amp Geosciences 25 715ndash728
Moore ID Grayson RB Ladson AR 1991 Digital terrain modelling areview of hydrological geomorphological and biological applicationsHydrological Processes 5 3ndash30
Moore ID Turner AK Wilson JP Jenson SK Band LE 1993 GISand land-surface-subsurface process modelling In EnvironmentalModelling with GIS Goodchild MF Parks BO Steyaert LT (eds)Oxford University Press Oxford 196ndash230
Nieto LM 2001 Geodiversity proposal of an integrative definitionBoletiacuten Geoloacutegico y Minero 112(2) 3ndash12
Ninyerola M Pons X Roure JM 2000 A methodological approachof climatological modelling of air temperature and precipitationthrough GIS techniques International Journal of Climatology 201823ndash1841
Ninyerola M Pons X Roure JM 2005 Atlas Climaacutetico Digital de la
Peniacutensula Ibeacuterica Metodologiacutea y Aplicaciones en Bioclimatologiacutea yGeobotaacutenica Universidad Autoacutenoma de Barcelona Bellaterra
Panizza M Piacente S 2003 Geomorfologia Culturale PitagoraBologna 350 pp
Panizza M Piacente S 2008 La geodiversitagrave e una sua applicazionenel territorio emiliano Il Geologo dellrsquoEmilia-Romagna 29 35ndash37
Pike RJ 1988 The geometric signature quantifying landslide-terraintypes from digital elevation models Mathematical Geology 20(5)491ndash510
Raines GL 2002 Description and comparison of geological mapswith FRAGSTATS ndash a spatial statistics program Computers andGeosciences 28 169ndash177
Rodriacuteguez E Morris CS Belz JE Chapin EC Martiacuten JM Daffer WHensley S 2005 An Assessment of the SRTM TopographicProducts Technical Report JPL D-31639 Jet Propulsion LaboratoryPasadena CA 143 pp
Schaetzl RJ Anderson S 2006 Soils Genesis and GeomorphologyCambridge University Press Cambridge 817 pp
Serrano E Flantildeo P 2007 Geodiversity concept assessment andterritorial application The case of Tiermes-Caracena Boletiacuten de laAGE 45 389ndash393
Shannon CE Weaver W 1975 The Mathematical Theory ofCommunication University of Illinois Press Urbana IL 125 pp
Spellerberg I Fedor PJ 2003 A tribute to Claude Shannon (1916ndash2001) and a plea for more rigorous use of species richness speciesdiversity and the lsquoShannonndashWienerrsquo Index Global Ecology ampBiogeography 12 177ndash179
Stallins JA 2006 Geomorphology and ecology unifying themesfor complex systems in biogeomorphology Geomorphology 77207ndash216
Taud H Parrot J-F 2005 Measurement of DEM roughness usingthe local fractal dimension Geacuteomorphologie Relief ProcessusEnvironnement 4 327ndash338
Tejero R Gonzaacutelez-Casado JM Goacutemez-Ortiz D Saacutenchez-Serrano F2006 Insights into the tectonic topography of the present-daylandscape of the central Iberian Peninsula (Spain) Geomorphology76 280ndash294
Urban MA Daniels M 2006 Introduction exploring the links betweengeomorphology and ecology Geomorphology 77 203ndash206
Vera JA Ancochea A Barnolas A Bea F Calvo JP Civis J De VicenteG Feacuternandez-Gianotti J Garciacutea-Corteacutes A Peacuterez-Estauacuten A PujalteV Rodriacuteguez-Fernaacutendez LR Sopentildea A Tejero A 2004 Capiacutetulo 1In Geologiacutea de Espantildea Vera JA (ed) SGE IGME Madrid 3ndash17
Wilson JP Gallant JC 2000 Terrain Analysis Principles andApplications John Wiley amp Sons New York 1ndash27
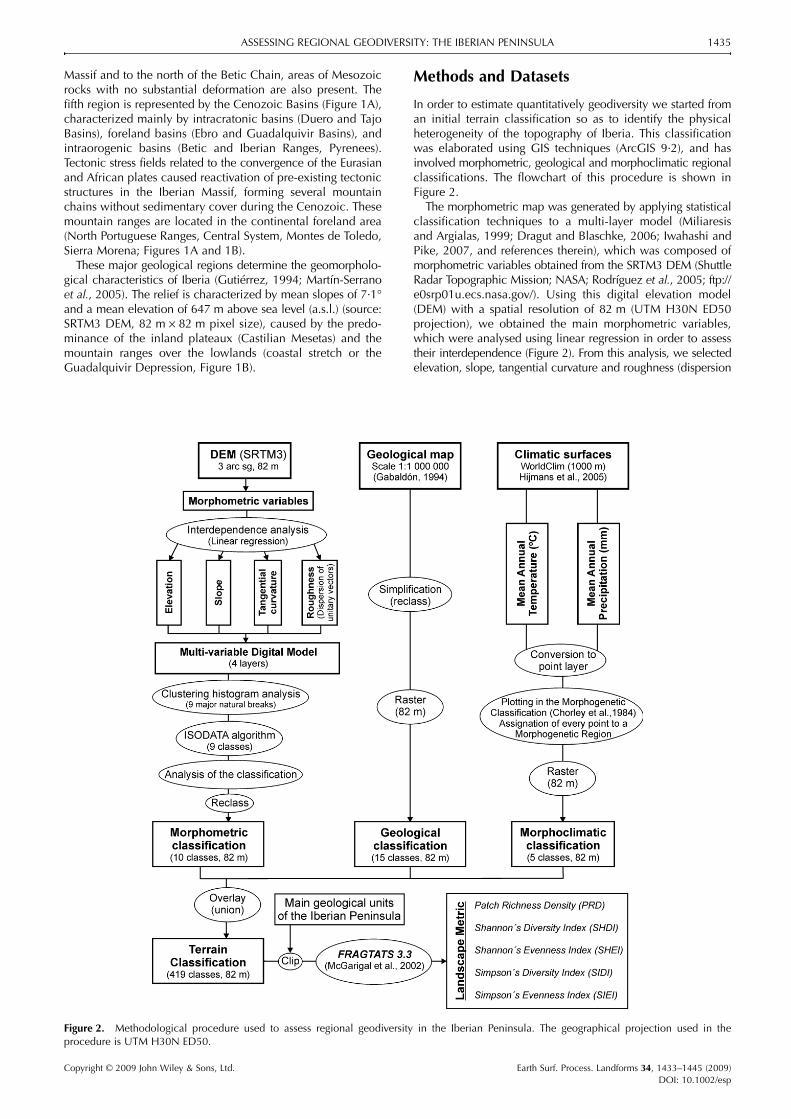
Copyright copy 2009 John Wiley amp Sons Ltd Earth Surf Process Landforms 34 1433ndash1445 (2009)DOI 101002esp
ASSESSING REGIONAL GEODIVERSITY THE IBERIAN PENINSULA 1443
highest SHDI and SIDI values among Cenozoic basins (Figure 7)mainly due to the deepest incision of drainage network duringthe Quaternary which increases the diversity of morphometricclasses (Table V) In the Guadalquivir Basin morphometricdiversity is lower (mostly lowlands of morphometric Class ITable I) in the same way as climatic variety represented byonly one morphogenetic region (Table II) The latter determinesthe lowest final diversity values of the Guadalquivir Basin(Table V Figure 7) Intracratonic basins present intermediatevalues although in this case SHDI and SIDI show differentdiversities The SHDI presents clearly higher values in theTajo Basin than in the Duero Basin (Figure 7) This may becontrolled by an important increase in the morphometricSHDI diversity in the Tajo Basin with respect to the DueroBasin (Table V) where 74middot3 of the surface is characterizedby intermediate plateaux (Class V Table I) Nevertheless withregards to the SIDI the Duero Basin presents slightly higher
diversity values than the Tajo Basin (Figure 7) In this casethe greater morphometric variety in the Tajo Basin has alower influence since SIDI is less sensitive to the presence ofrare types while the higher geological diversity and a moreregular distribution of the morphoclimatic regions in theDuero Basin have a greater weight (Table V and Figure 2)
The areas occupied by Mesozoic sedimentary cover withno deformation present similar low SHDI values as Cenozoicbasins (Figure 7A) in contrast to deformed terrains indicatingthat orogenic processes constitute a determining factor in theincrease of geodiversity
The results obtained from the application of evenness indicesshow limited relative variations regarding diversity values (Table VFigure 8) although the main relationships are maintained Thesevariations are related to the SHEI values of the largest arearegions (Iberian Massif and the whole Peninsula) which reducetheir relative values in relation to the other regions (Figure 9)
Figure 8 Diversity measures and geodynamic styles of the main geological regions of the Iberian Peninsula SHDI Shannonrsquos Diversity Index(units information) SIDI Simpsonrsquos Diversity Index (dimensionless)
Figure 9 Evenness measures and geodynamic styles of the main geological regions of the Iberian Peninsula SHEI Shannonrsquos Evenness Index(dimensionless) SIEI Simpsonrsquos Evenness Index (dimensionless)
Copyright copy 2009 John Wiley amp Sons Ltd Earth Surf Process Landforms 34 1433ndash1445 (2009)DOI 101002esp
1444 EARTH SURFACE PROCESSES AND LANDFORMS
In this case the highest diversity values correspond to theCantabrian Range (SHEI = 0middot79 SIEI = 0middot98) followed by theIberian Massif and the Central System The collisional ranges(Pyrenees and Betic Chain) show high evenness values toowhereas the Iberian Range presents again the lowest valueamong the Alpine orogens due to its lowest morphometricheterogeneity (Table I) The Mesozoic outcrops withoutsignificant deformation and the Cenozoic basins present thelowest SHEI and SIEI values showing similar proportionalrelations as the respective diversity values (Figures 8 and 9)
Diversity and evenness values present a clear relationship withthe geodynamic evolution of the analysed landscapes and theirvariations can be explained according to the particular geologicaland geomorphological characteristics of each region Thusthese indices represent a useful tool to compare geocomplexityin contemporary landscapes or throughout time (Benito2004) However some important aspects should be takeninto account when using these metric indices Diversity andevenness indices do not consider the importance of individualclasses or uniqueness quantifying exclusively the variety andarrangement of patch types in the landscape Thus metricindices are not absolute measures and the computed values area function of how the landscape is defined especially withregards to the classification criteria and the scale whichdetermine geodiversity at differents levels (Nieto 2001)Comparable landscapes must be defined using the sameresolution and criteria depending on the phenomena underanalysis In this way the assessment of geodiversity shouldstart by determining the heterogeneity of the factors used todefine the landscape (McGarigal et al 2002) We have useda model for regional geodiversity whose computed diversity valuescannot be extrapolated directly to be used for other detailedscales without further analysis but similar methodology couldbe employed to assess geodiversity at more detailed scales
Conclusions
In these last years several methodologies to assess geodiversityhave been developed (Carcavilla et al 2007 Bruschi 2007Serrano and Flantildeo 2007) in order to provide objectivetools for geoconservation and management of the abioticheritage In this work we have tested landscape diversity indices(MacGarigal et al 2002) to assess regional geodiversity inthe Iberian Peninsula The results indicate that these spatialdiversity indices may be very useful to assess geodiversity ifthey are applied in a comparative analysis for landscapes havingthe same criteria and spatial resolution
Using GIS techniques such as multi-layer statisticalclassification and dataset cross-tabulation we have developedan objective terrain classification for the Iberian Peninsulabased on morphometric geological and climatic criteria whichare applicable to other areas Morphometric and climatic datawere extracted from global databases (SRTM3 and WorldClimDatabase) which presented a suitable resolution to analyseregional areas while geological information was providedfrom a regional geological map The final terrain classificationrepresents a model of the regional earth surface variabilityand allowed us to categorize the mentioned properties in themain geological regions of Iberia The latter must constitutethe first stage to assess geodiversity since it is essential tounderstand landscapes and to interpret the diversity indexvalues
The terrain classification was applied to compute richnessdiversity and evenness indices in order to assess quanti-tatively the current regional geodiversity among the maingeological regions of Iberia Nevertheless the comparison of
landscapes of different origins and ages is also possible Richnessis a basic component of diversity but presents limitations toanalyse landscapes of diverse areal extent In this way PRDdid not allow us to perform a suitable comparison of Iberianlandscapes However the applied diversity and evenness indices(SHDI SHEI SIDI SIEI) showed similar results in most casespresenting a close association with the distribution of thegeological geomorphological and climatic characteristics ofthe Iberian regions In recent terrains with no significant tectonicsgeodiversity values increase mainly with higher morphoclimaticvariety and deeply incised regions causing a major morpholo-gical heterogeneity However the highest diversity and evennessvalues are related to deformed terrains In this case higherdiversities are mainly associated with ranges where reactivatedold massifs outcrop resulting in a large structural and litholo-gical complexity However the lowest diversity values arerelated to lower morphological variety in areas where planationsurfaces dominate
These results provide an objective approach to the relativeregional geodiversity in Iberia Nevertheless diversity indicesdo not provide information about uniqueness Thus in studieswhich focus on specific elements of geodiversity the informa-tion provided by these indices should be complemented withanalysis concerning the distinct elements in the landscapesIn the same way diversity index information can be combinedwith other spatial pattern indices in order to achieve a betterunderstanding of landscape spatial configuration
AcknowledgementsmdashThe authors would like to thank Professor MPanizza J Schmidt and three anonymous reviewers for their commentsand critical review of the manuscript Alfonso Benito Calvo was therecipient of a grant of the Spanish MEC postdoctoral programme
References
Band L 1989 Spatial aggregation of complex terrain GeographicalAnalyst 21 279ndash293
Barrio G Alvera B Puigdefabregas J Diacuteez C 1997 Response of highmountain landscape to topographic variables Central PyreneesLandscape Ecology 12(2) 95ndash115
Benito A 2004 Anaacutelisis geomorfoloacutegico y reconstruccioacuten depaleopaisajes neoacutegenos y cuaternarios en la Sierra de Atapuerca yel valle medio del riacuteo Arlanzoacuten Universidad Complutense deMadrid Madrid 381 pp
Benito A 2008 Anaglifo digital del relieve de la Peniacutensula IbeacutericaTierra y Tecnologiacutea 33 71ndash74
Bruschi VM 2007 Desarrollo de una metodologiacutea para lacaracterizacioacuten evaluacioacuten y gestioacuten de los recursos de lageodiversidad PhD Thesis Universidad de Cantabria Santander355 pp
Carcavilla L Loacutepez J Duraacuten JJ 2007 Patrimonio geoloacutegico ygeodiversidad investigacioacuten conservacioacuten y relacioacuten con losespacios naturales protegidos Cuadernos del Museo Geominero7 IGME Madrid 360 pp
Chorley RJ Schumm SA Sugden DE 1984 Geomorphology Methuenamp Co London 605 pp
Dragut L Blaschke T 2006 Automated classification of landformelements using object-based image analysis Geomorphology 81330ndash344
Feliciacutesimo AM 1994 Modelos Digitales del Terreno Introduccioacuten yAplicaciones en las Ciencias Ambientales Biblioteca de HistoriaNatural 3 Pentalfa Ediciones Oviedo 222 pp
Font I 1983 Atlas Climaacutetico de Espantildea Instituto Nacional deMeteorologiacutea Madrid 43 plates
Gabaldoacuten V et al 1994 Mapa Geoloacutegico de la Peniacutensula IbeacutericaBaleares y Canarias a escala 11 000 000 IGME Madrid
Giles PT 1997 Geomorphological signatures classification ofaggregated slope unit objects from digital elevation and remotesensing data Earth Surface Processes and Landforms 23 581ndash594
Copyright copy 2009 John Wiley amp Sons Ltd Earth Surf Process Landforms 34 1433ndash1445 (2009)DOI 101002esp
ASSESSING REGIONAL GEODIVERSITY THE IBERIAN PENINSULA 1445
Gray M 2004 Geodiversity Valuing and Conserving Abiotic NatureJohn Wiley amp Sons Chichester 434 pp
Gutieacuterrez M 1994 Principales rasgos fisiograacuteficos del territorioEspantildeol In Geomorfologiacutea de Espantildea Gutieacuterrez M (ed) RuedaAlcorcoacuten 1ndash9
Guzzetti F Reichenbach P 1994 Towards a definition of topographicdivisions for Italy Geomorphology 111 57ndash74
Hijmans RJ Cameron SE Parra JL Jones PG Jarvis A 2005 Veryhigh resolution interpolated climate surfaces for global lands areasInternational Journal of Climatology 25 1965ndash1978
Hobson RD 1972 Surface roughness in topography quantitativeapproach In Spatial Analysis in Geomorphology Chorley RJ (ed)Methuen amp Co London 221ndash245
Iwahashi J Pike RJ 2007 Automated classifications of topographyfrom DEMs by an unsupervised nested-means algorithm and three-part geometric signature Geomorphology 86 409ndash440
Kozlowski S 2004 Geodiversity The concept and scope of geodiversityPrzeglad Geologiczny 52(82) 833ndash837
Martiacuten-Algarra A Vera JA 2004 Evolucioacuten de la Cordillera Beacuterica InGeologiacutea de Espantildea Vera JA (ed) Geologiacutea de Espantildea SGE IGMEMadrid 437ndash444
Martiacuten-Serrano A et al 2005 Mapa Geomorfoloacutegico de Espantildea y delMargen Continental a escala 11 000 000 IGME Madrid
McGarigal K Cushman SA Neel MC Ene E 2002 FRAGSTATSSpatial Pattern Analysis Program for Categorical Maps Computersoftware program produced by the authors at the University ofMassachusetts Amherst httpwwwumassedulandecoresearchfragstatsfragstatshtml [last accessed 2008]
Miliaresis GCh Argialas DP 1999 Segmentation of physiographicfeatures from the global digital elevation modelGTOPO30Computers amp Geosciences 25 715ndash728
Moore ID Grayson RB Ladson AR 1991 Digital terrain modelling areview of hydrological geomorphological and biological applicationsHydrological Processes 5 3ndash30
Moore ID Turner AK Wilson JP Jenson SK Band LE 1993 GISand land-surface-subsurface process modelling In EnvironmentalModelling with GIS Goodchild MF Parks BO Steyaert LT (eds)Oxford University Press Oxford 196ndash230
Nieto LM 2001 Geodiversity proposal of an integrative definitionBoletiacuten Geoloacutegico y Minero 112(2) 3ndash12
Ninyerola M Pons X Roure JM 2000 A methodological approachof climatological modelling of air temperature and precipitationthrough GIS techniques International Journal of Climatology 201823ndash1841
Ninyerola M Pons X Roure JM 2005 Atlas Climaacutetico Digital de la
Peniacutensula Ibeacuterica Metodologiacutea y Aplicaciones en Bioclimatologiacutea yGeobotaacutenica Universidad Autoacutenoma de Barcelona Bellaterra
Panizza M Piacente S 2003 Geomorfologia Culturale PitagoraBologna 350 pp
Panizza M Piacente S 2008 La geodiversitagrave e una sua applicazionenel territorio emiliano Il Geologo dellrsquoEmilia-Romagna 29 35ndash37
Pike RJ 1988 The geometric signature quantifying landslide-terraintypes from digital elevation models Mathematical Geology 20(5)491ndash510
Raines GL 2002 Description and comparison of geological mapswith FRAGSTATS ndash a spatial statistics program Computers andGeosciences 28 169ndash177
Rodriacuteguez E Morris CS Belz JE Chapin EC Martiacuten JM Daffer WHensley S 2005 An Assessment of the SRTM TopographicProducts Technical Report JPL D-31639 Jet Propulsion LaboratoryPasadena CA 143 pp
Schaetzl RJ Anderson S 2006 Soils Genesis and GeomorphologyCambridge University Press Cambridge 817 pp
Serrano E Flantildeo P 2007 Geodiversity concept assessment andterritorial application The case of Tiermes-Caracena Boletiacuten de laAGE 45 389ndash393
Shannon CE Weaver W 1975 The Mathematical Theory ofCommunication University of Illinois Press Urbana IL 125 pp
Spellerberg I Fedor PJ 2003 A tribute to Claude Shannon (1916ndash2001) and a plea for more rigorous use of species richness speciesdiversity and the lsquoShannonndashWienerrsquo Index Global Ecology ampBiogeography 12 177ndash179
Stallins JA 2006 Geomorphology and ecology unifying themesfor complex systems in biogeomorphology Geomorphology 77207ndash216
Taud H Parrot J-F 2005 Measurement of DEM roughness usingthe local fractal dimension Geacuteomorphologie Relief ProcessusEnvironnement 4 327ndash338
Tejero R Gonzaacutelez-Casado JM Goacutemez-Ortiz D Saacutenchez-Serrano F2006 Insights into the tectonic topography of the present-daylandscape of the central Iberian Peninsula (Spain) Geomorphology76 280ndash294
Urban MA Daniels M 2006 Introduction exploring the links betweengeomorphology and ecology Geomorphology 77 203ndash206
Vera JA Ancochea A Barnolas A Bea F Calvo JP Civis J De VicenteG Feacuternandez-Gianotti J Garciacutea-Corteacutes A Peacuterez-Estauacuten A PujalteV Rodriacuteguez-Fernaacutendez LR Sopentildea A Tejero A 2004 Capiacutetulo 1In Geologiacutea de Espantildea Vera JA (ed) SGE IGME Madrid 3ndash17
Wilson JP Gallant JC 2000 Terrain Analysis Principles andApplications John Wiley amp Sons New York 1ndash27
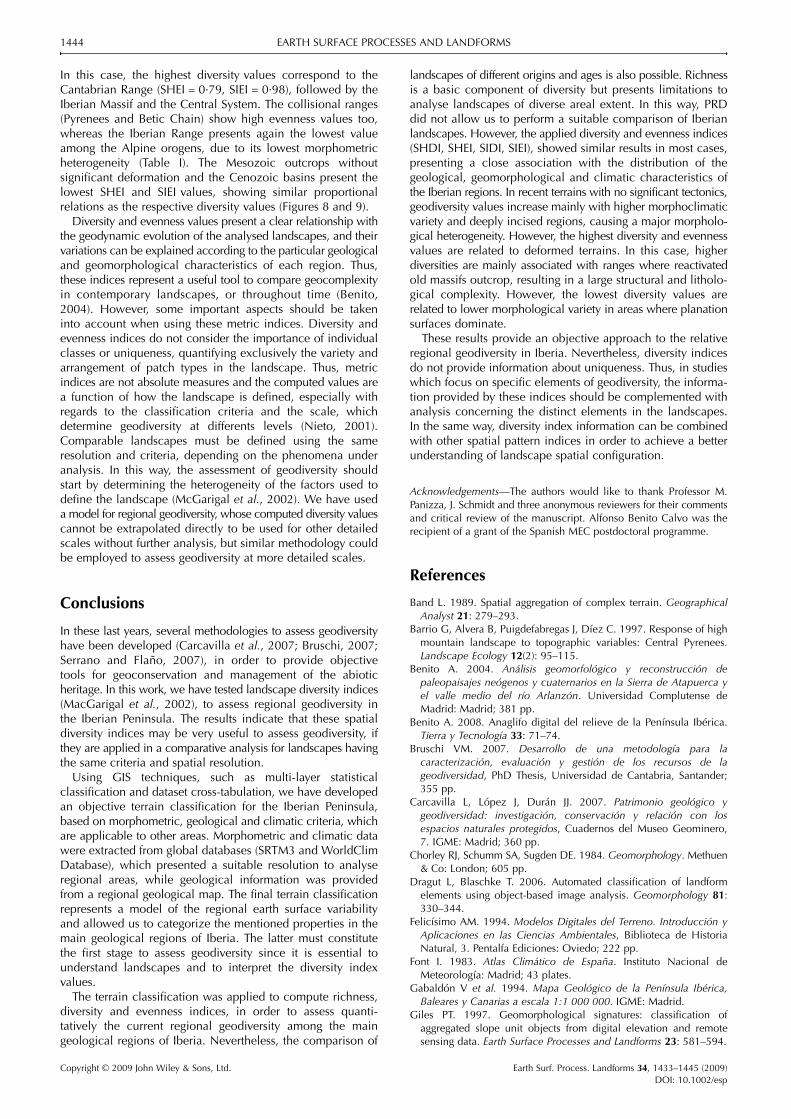
Copyright copy 2009 John Wiley amp Sons Ltd Earth Surf Process Landforms 34 1433ndash1445 (2009)DOI 101002esp
ASSESSING REGIONAL GEODIVERSITY THE IBERIAN PENINSULA 1445
Gray M 2004 Geodiversity Valuing and Conserving Abiotic NatureJohn Wiley amp Sons Chichester 434 pp
Gutieacuterrez M 1994 Principales rasgos fisiograacuteficos del territorioEspantildeol In Geomorfologiacutea de Espantildea Gutieacuterrez M (ed) RuedaAlcorcoacuten 1ndash9
Guzzetti F Reichenbach P 1994 Towards a definition of topographicdivisions for Italy Geomorphology 111 57ndash74
Hijmans RJ Cameron SE Parra JL Jones PG Jarvis A 2005 Veryhigh resolution interpolated climate surfaces for global lands areasInternational Journal of Climatology 25 1965ndash1978
Hobson RD 1972 Surface roughness in topography quantitativeapproach In Spatial Analysis in Geomorphology Chorley RJ (ed)Methuen amp Co London 221ndash245
Iwahashi J Pike RJ 2007 Automated classifications of topographyfrom DEMs by an unsupervised nested-means algorithm and three-part geometric signature Geomorphology 86 409ndash440
Kozlowski S 2004 Geodiversity The concept and scope of geodiversityPrzeglad Geologiczny 52(82) 833ndash837
Martiacuten-Algarra A Vera JA 2004 Evolucioacuten de la Cordillera Beacuterica InGeologiacutea de Espantildea Vera JA (ed) Geologiacutea de Espantildea SGE IGMEMadrid 437ndash444
Martiacuten-Serrano A et al 2005 Mapa Geomorfoloacutegico de Espantildea y delMargen Continental a escala 11 000 000 IGME Madrid
McGarigal K Cushman SA Neel MC Ene E 2002 FRAGSTATSSpatial Pattern Analysis Program for Categorical Maps Computersoftware program produced by the authors at the University ofMassachusetts Amherst httpwwwumassedulandecoresearchfragstatsfragstatshtml [last accessed 2008]
Miliaresis GCh Argialas DP 1999 Segmentation of physiographicfeatures from the global digital elevation modelGTOPO30Computers amp Geosciences 25 715ndash728
Moore ID Grayson RB Ladson AR 1991 Digital terrain modelling areview of hydrological geomorphological and biological applicationsHydrological Processes 5 3ndash30
Moore ID Turner AK Wilson JP Jenson SK Band LE 1993 GISand land-surface-subsurface process modelling In EnvironmentalModelling with GIS Goodchild MF Parks BO Steyaert LT (eds)Oxford University Press Oxford 196ndash230
Nieto LM 2001 Geodiversity proposal of an integrative definitionBoletiacuten Geoloacutegico y Minero 112(2) 3ndash12
Ninyerola M Pons X Roure JM 2000 A methodological approachof climatological modelling of air temperature and precipitationthrough GIS techniques International Journal of Climatology 201823ndash1841
Ninyerola M Pons X Roure JM 2005 Atlas Climaacutetico Digital de la
Peniacutensula Ibeacuterica Metodologiacutea y Aplicaciones en Bioclimatologiacutea yGeobotaacutenica Universidad Autoacutenoma de Barcelona Bellaterra
Panizza M Piacente S 2003 Geomorfologia Culturale PitagoraBologna 350 pp
Panizza M Piacente S 2008 La geodiversitagrave e una sua applicazionenel territorio emiliano Il Geologo dellrsquoEmilia-Romagna 29 35ndash37
Pike RJ 1988 The geometric signature quantifying landslide-terraintypes from digital elevation models Mathematical Geology 20(5)491ndash510
Raines GL 2002 Description and comparison of geological mapswith FRAGSTATS ndash a spatial statistics program Computers andGeosciences 28 169ndash177
Rodriacuteguez E Morris CS Belz JE Chapin EC Martiacuten JM Daffer WHensley S 2005 An Assessment of the SRTM TopographicProducts Technical Report JPL D-31639 Jet Propulsion LaboratoryPasadena CA 143 pp
Schaetzl RJ Anderson S 2006 Soils Genesis and GeomorphologyCambridge University Press Cambridge 817 pp
Serrano E Flantildeo P 2007 Geodiversity concept assessment andterritorial application The case of Tiermes-Caracena Boletiacuten de laAGE 45 389ndash393
Shannon CE Weaver W 1975 The Mathematical Theory ofCommunication University of Illinois Press Urbana IL 125 pp
Spellerberg I Fedor PJ 2003 A tribute to Claude Shannon (1916ndash2001) and a plea for more rigorous use of species richness speciesdiversity and the lsquoShannonndashWienerrsquo Index Global Ecology ampBiogeography 12 177ndash179
Stallins JA 2006 Geomorphology and ecology unifying themesfor complex systems in biogeomorphology Geomorphology 77207ndash216
Taud H Parrot J-F 2005 Measurement of DEM roughness usingthe local fractal dimension Geacuteomorphologie Relief ProcessusEnvironnement 4 327ndash338
Tejero R Gonzaacutelez-Casado JM Goacutemez-Ortiz D Saacutenchez-Serrano F2006 Insights into the tectonic topography of the present-daylandscape of the central Iberian Peninsula (Spain) Geomorphology76 280ndash294
Urban MA Daniels M 2006 Introduction exploring the links betweengeomorphology and ecology Geomorphology 77 203ndash206
Vera JA Ancochea A Barnolas A Bea F Calvo JP Civis J De VicenteG Feacuternandez-Gianotti J Garciacutea-Corteacutes A Peacuterez-Estauacuten A PujalteV Rodriacuteguez-Fernaacutendez LR Sopentildea A Tejero A 2004 Capiacutetulo 1In Geologiacutea de Espantildea Vera JA (ed) SGE IGME Madrid 3ndash17
Wilson JP Gallant JC 2000 Terrain Analysis Principles andApplications John Wiley amp Sons New York 1ndash27