Embed Size (px)
Citation preview

1
Earthquake Response Cooperation Program for
Energy Supply Systems
Phase 1 (SF01-10)
Earthquake DisasterManagement of Energy Supply System ofAPEC Member Economies
Report forAsia-Pacific Economic CooperationEnergy Working Group2002
Energy CommissionMinistry of Economic AffairsChinese Taipei
Industrial TechnologyResearch Institute

2
Earthquake Response Cooperation Program for Energy Supply Systems Phase 1 (SF01-10)
Earthquake Disaster Management of Energy
Supply System of APEC Member Economies
Report forAsia-Pacific Economic CooperationEnergy Working Group2002
Energy CommissionMinistry of Economic AffairsChinese Taipei
Published by
The Energy coommission, Ministry of Economic Affairs13th Floor, 2, Fu-Hsing North Road,Taipei, Taiwan 10440, Chinese TaipeiTel: (886) 2-2775-7710Fax: (886) 2-2776-2709
Copyright © 2002 by Energy Commission, MOEAAll rights reservedPrinted in the Chinese Taipei2002
ISBN 957-01-0265-9

i
FOREWORD
I am pleased to present the project report of Phase I of the Earthquake Response Cooperation
Program for Energy Supply Systems. This program was based on the Earthquake Response
Cooperation Initiative proposed by Chinese Taipei at APEC EWG 18.
Many APEC member economies are located in a region suffering from frequent earthquakes. In
the past decades, several member economies such as China, Japan, Mexico, Chinese Taipei, the
Philippines, Indonesia and the USA have experienced a series of severe earthquakes that resulted in
serious damage to energy supply infrastructure and economic development, in addition to loss of life
and property. In January 1995, a severe earthquake hit Kobe and Osaka, Japan. A large fire that
subsequently resulted from leakage of natural gas caused tremendous damage.
In the early morning of September 21, 1999, an earthquake struck the central region of Chinese
Taipei and resulted in tremendous destruction. Due to the collapse of transformer substations and
several extra-high voltage electricity transmission towers, the electricity supply over half of Chinese
Taipei was shut down for over one week. Furthermore, rotation of electricity supply lasted for another
two weeks. Many other energy supply systems were seriously damaged, including natural gas pipelines,
service stations and oil storage tanks. After this major disaster, Chinese Taipei realized that a cross-
economy cooperative mechanism for energy supply systems would benefit many APEC member
economies. Chinese Taipei also hoped to share its valuable experiences with other member economies.
Therefore, in April 2000, the APEC EWG 19 endorsed the Earthquake Response Cooperation
Initiative launched by Chinese Taipei to address earthquake preventative and response measures for
energy supply systems, noting that the program development should consider the existing APEC
framework for emergency preparedness. The initiative was also included in the APEC Energy Ministers
Declaration on May 12, 2000. Taking the above into consideration, a 3-year Implementation
Program— the Earthquake Response Cooperation Program for Energy Supply Systems — was
developed to meet the objectives of the initiative.
Mainly, this program is to establish a cooperative and information sharing mechanism among the
APEC member economies for energy supply systems in response to earthquakes. It is being
accomplished by establishing a comprehensive information system on the Internet, by exchanging
experiences of preventing collapse of energy supply systems during earthquakes, and by lessons from
restoration efforts after earthquake.
This report is an important result of Phase I of this three-year program. Its contents include:
energy security and earthquake disasters, past experience of energy supply system during earthquakes,
earthquake risk assessment and management, earthquake preparedness for energy supply systems, and

ii
earthquake disaster countermeasures and response plans.
I sincerely appreciate the efforts of all those who have been involved in this project. The experts
who have helped us through our conference and steering committee meeting, the domestic expert
groups, and many others who have provided useful comments. I hope APEC member economies that
suffer from earthquakes will benefit from this report.
Shih-Ming Chuang
Project Overseer
Earthquake Response Cooperation Program for Energy Supply Systems
Director, Energy Policy and International affairs Division
Energy Commission
Ministry of Economic Affairs
Chinese Taipei

iii
ACKNOWLEDGEMENTS
We would like to thank everyone who has worked very hard on the project. The development of this
report could not have been accomplished without the contributions of many persons. The full list of
people associated with the project is given in the following. We thank all members of steering
committee, seminar speakers, government officials, California Energy Commission, U.S.A. and other
experts for their assistance with the study. We wish to express our appreciation to the participants at
the APEC Earthquake Disaster Management of Energy Supply System seminar who met with us and
provided invaluable insight into the issues. The administrative support of Energy Commission,
Ministry of Economic Affairs (Chinese Taipei) is also gratefully acknowledged.
CHAIRMAN:
Mr Shih-Ming Chuang (Chinese Taipei)
STEERING COMMITTEE MEMBERS:(List in Alphabetical Order of Member Economies)
Mr Allan Gillespie (Australia)
Mr Qin He (China)
Dr Xing Jin (China)
Mr Tan Pham (New Zealand)
Dr Yi-Ben Tsai (Chinese Taipei)
Dr Chin-Hsiung Loh (Chinese Taipei)
Dr Ban-Jwu Shih (Chinese Taipei)
DOMESTIC EXPERT CONSULTATION GROUP:
Mr Biao-Sheng Chang
Mr Jei-Yuan Chen
Mr Tsung-Hsien Chen
Dr Wei-Ling Chiang
Dr Tien-Yin Chou
Mr Kai-Wen Kuo
Mr Chih Ping Hu
Mr Chien-Cheng Huang
Dr Chin-Hsiung Loh
Dr Shoung Ouyang
Dr Ban-Jwu Shih
Dr Yi-Ben Tsai

iv
SEMINAR SPEAKERS:
Dr Clive D. N. Collins (Australia)
Mr Allan Gillespie (Australia)
Mr Qin He (China)
Dr Xing Jin (China)
Mr Shanyou Liu (China)
Mr Akifumi Kawata (Japan)
Mr Masanobu Noda (Japan)
Dr Fumio Yamazaki (Japan)
Mr Jong-Rim Lee (Korea)
Mr Guillermo Camacho-Uriarte (Mexico)
Mr Francisco Santander V. (Mexico)
Mr David Brunsdon (New Zealand)
Dr Robin Falconer (New Zealand)
Mr Tan Pham (New Zealand)
Dr Nguyen Ngoc Thuy (Viet Nam)
Mr Biao-Sheng Chang (Chinese Taipei)
Mr Jei-Yuan Chen (Chinese Taipei)
Mr Shih-Ming Chuang (Chinese Taipei)
Mr Yuan-His Lee (Chinese Taipei)
Mr Chii-Wen Lin (Chinese Taipei)
Dr Chin-Hsiung Loh (Chinese Taipei)
Dr Ban-Jwu Shih (Chinese Taipei)
Dr Yi-Ben Tsai (Chinese Taipei)
Dr Chin-Hsun Yeh (Chinese Taipei)
Mr Masanobu Shinozuka (U.S.A.)
California Energy Commission:
Ms Mara M. Bouvier (U.S.A.)
EDITORS:
Dr Jyuung-Shiauu Chern (Chinese Taipei)
Dr Jhy-Ming Lu (Chinese Taipei)
Dr Ban-Jwu Shih (Chinese Taipei)

v
TABLE OF CONTENTS
Foreword…………………………………………………………………………..……………… i
Acknowledgement………………………………………………………………………………… iii
Table of Contents…………………………………………………………………………………. v
List of Figures…………………………………………………………………………………….. vii
List of Tables……………………………………………………………………………………. ix
List of Abbreviations……………………………………………………………………………… x
Chapter 1. Energy Security and Earthquakes…………………………………………………….. 1
1.1. Earthquake Disasters in APEC Economies………………..……………………………… 1
1.1.1. Tangshan Earthquake in China…………………………………………………….. 1
1.1.2. Great Hanshin Awaji Earthquake in Japan……………………….………………… 2
1.1.3. Manzanillo Earthquake in Mexico……………………………….………………… 4
1.1.4. Chi-Chi Earthquake in Chinese Taipei……………………………………………... 5
1.1.5. Northridge Earthquake in Unites State…………………………………………….. 7
1.2. The Project's Perspectives: Earthquake response cooperation system……………………. 9
1.3. Summary…………………………………………………………………………………... 9
Chapter 2. Past Experiences of the Energy Supply Systems during Earthquakes..……………… 10
2.1. The Damage of the Energy Infrastructure…………………………………………………. 10
2.1.1. Electricity Supply…………………………………………………………………. 10
2.1.2. Oil Supply………………………………………………………………………….. 13
2.1.3. Natural Gas Supply………………………………………………………………… 14
2.2. Restoration and Reconstruction of Damaged Facilities…………………………………… 16
2.2.1. Electricity Systems………………………………………………………………... 16
2.2.2. Oil Systems……………………………………………………………………….. 18
2.2.3. Natural Gas Systems……………………………………………………………… 19
2.3. Summary…………………………………………………………………………………... 20
Chapter 3. Earthquake Risk Assessment and Management………………………………………. 21
3.1. Probabilistic Seismic Hazard Analysis……………………………………………………. 21
3.1.1. Multi-hazard analysis of urban areas in Australia…………………………………. 21
3.1.2. A case study: Seismic Hazard Analysis in Taiwan………………………………… 24
3.1.3. Earthquake Loss Estimation Methodology in Taiwan……………………………... 31
3.1.4. Earthquake Risk Assessment Methods in New Zealand…………………………… 43

vi
3.2. Earthquake Risk Assessment in Lifeline …………………………………………………. 46
3.3. Seismic Performance Analysis in Electric Power System……………………………….. 51
3.4. Seismic Performance Analysis in Petroleum Supply System……………………………... 59
3.5. Earthquake Risk Assessment in Natural Gas System……………………………………... 62
3.5.1. A case Study in OSAKA Gas Company, Japan……………………………………. 62
3.6. Summary…………………………………………………………………………………... 66
Chapter 4. Earthquake Preparedness for Energy Supply System………………………………… 67
4.1. Institutional Framework for Emergency Response of Energy Supply System …………… 67
4.1.1. Emergency Management Australia and State Emergency Services Units…………. 67
4.1.2. China Seismological Bureau……………………………………………………….. 68
4.1.3. Energy Planning Committee in New Zealand……………………………………… 72
4.1.4. Energy Commission in Chinese Taipei…………………………………………….. 76
4.1.5. California Energy Commission……………………………………………………. 79
4.2. Summary…………………………………………………………………………………... 83
Chapter 5. Earthquake Disaster Countermeasure and Response Plan……………………………. 84
5.1. Electricity System…………………………………………………………………………. 84
5.1.1. A Robust, Electric Power Supply System against Disasters in Japan.…………….. 84
5.1.2. Seismic Safety Review of Electric Power Facilities in Korea…………………….. 86
5.2. Liquid Fuel System ……………………………………………………………………….. 95
5.2.1. Chinese Petroleum Cooperation Emergency Response Plan…….………………… 95
5.3. Natural Gas System……………………………………………………………………….. 96
5.3.1. Osaka Gas………………………………………………………………………….. 97
5.3.2. Seismic Disaster Prevention System in Chinese Taipei...…………………………. 99
5.4. Summary…………………………………………………………………………………... 104

vii
LIST OF FIGURES
Fig. 1.1 The Chelungpu fault and the epicenter of the Chi-Chi earthquake……… 7
Fig 3.1 The Australian National Seismograph Network. The contour line shows
the limit of location for magnitude 3 earthquakes……………………….. 23
Fig. 3.2 Estimated seismic hazard curves (plot of annual probability of
exceedance with respect to PGA value) at a site near Taipei basin………. 26
Fig. 3.3 Plot of iso-intensity map of PGA and Sa (T=1.0 sec) for return period of
475 year and 2500 year…………….……………………………………. 28
Fig. 3.4 Design response spectrum………………………………………………. 30
Fig. 3.5 Procedures to determine the seismic design base shear for buildings and
bridges……………………………………………………………………. 31
Fig. 3.6 Framework of hazard analysis, risk assessment and loss Estimation
methodology in Haz-Taiwan……………………………………………... 32
Fig. 3.7 Calculation of ground shaking estimates in deterministic approach…….. 34
Fig. 3.8 Comparison of peak ground accelerations in the Chi-Chi earthquake at
footing-wall and hanging-wall side of Che lungpu fault…………………. 35
Fig. 3.9 Distribution of stations of strong-motion network and TREIRS…………. 36
Fig. 3.10 Contour map of PGA modification factors in Taiwan area………………. 36
Fig. 3.11 Contour map of simulated PGA in Chi-Chi earthquake…………………. 37
Fig. 3.12 Contour map of measured PGA by TSMIP in Chi-Chi earthquake……… 37
Fig. 3.13 Distribution of the collected bore holes in Taiwan………………………. 38
Fig. 3.14 Liquefaction potential map of Taipei basin……………………………… 39
Fig. 3.15 Flowchart of damage assessment of general building stocks……………. 41
Fig. 3.16 Comparison of capacity spectra obtained by different methods for 12-
story steel moment resistant frames……………………………………… 41
Fig. 3.17 Flowchart on the transportation and utility network analysis……………. 43
Fig. 3.18 Modified Mercalli (MM) ground shaking intensity from the NZ
probabilistic seismic hazard model……………………………………….
44
Fig. 3.19 Ground accelerations versus frequency for several locations in New
Zealand…………………………………………………………………… 45
Fig. 3.20 Velocities from 1994, 95, 96 and 98 data. Reference frame is the Pacific
fixed………………………………………………………………………. 46
Fig. 3.21 Service area of Los Angeles Department Water and Power……………... 53
Fig. 3.22 Electric power output for service areas under intact conditions…………. 53
Fig. 3.23 Peak Ground Acceleration under Northridge earthquake………………… 53
Fig. 3.24 Relative average power output (damaged/Intact)…..……………………. 53
Fig. 3.25 Fragility curves…………………………………………………………… 54
Fig. 3.26 Fragility curves for bridges with and without base isolation…………….. 54

viii
Fig. 3.27 Acceleration reduction by EPS bearings…………………………………. 55
Fig. 3.28 LADWP’s system flowchart……………………………………………… 57
Fig. 3.29 Typical node configuration model……………………………………….. 57
Fig. 3.30 General flowchart………………………………………………………… 59
Fig. 3.31 GIS maps employed in SUPREME……………………………………… 65
Fig. 3.32 Acceleration response spectrum (a) and boring profile (b) at Shazoo and
Yenson stations…………………………………………………………… 66
Fig. 4.1 Frame of emergency response……………………………………………. 77
Fig. 4.2 Energy emergency organization chart……………………………………. 81
Fig. 5.1 Electric power supply system for the city that is strong against disasters... 85
Fig. 5.2 Communication systems via back-up operation bases…………………… 86
Fig. 5.3 Comparison of response spectra developed by empirical and synthetic
method…………………………………………………………………… 88
Fig. 5.4 Failure modes for fastenings under tensile loading……………………… 90
Fig. 5.5 Seismic hazard results according to the methods considering the
incompleteness of the earthquake catalog……………………………….. 91

ix
LIST OF TABLES
Table 1.1 The correlation of magnitude and intensity level on the China scale……. 1
Table 1.2 The correlation of magnitude and intensity level on the Mercalli scale….. 1
Table 1.3 Breakdown and recovery rate of lifelines in the Kobe earthquake………. 4
Table 2.1 Number of damaged transmission lines………………………………….. 12
Table 2.2 The loss of natural gas pipelines…………………………………………. 15
Table 3.1 Values of site coefficients Fa and Fv ……………………………………… 29
Table 3.2 Site classification………………………………………………………… 29
Table 3.3 Damping coefficients Bs and B1 …………………………………………. 30
Table 3.4 Coefficients of attenuation laws by Jean, et. al. (2000)………………….. 34
Table 4.1 Usage of energy sources in New Zealand………………………………... 72
Table 5.1 Performance goal of transmission and substation facilities……………… 93
Table 5.2 Seismic area factor……………………………………………………….. 93
Table 5.3 Seismic hazard factor…………………………………………………….. 94
Table 5.4 Technical criteria of transmission and substation facilities………………. 94

x
LIST OF ABBREVIATIONS
APEC Asia Pacific Economic Cooperation
AGSO Australian Geological Survey Organization
CCDTF Commonwealth Counter Disaster Task Force
CDEMB Civil Defense Emergency Management Bill
CPC Chinese Petroleum Corporation
CSB China Seismological Bureau
DOE Department of Energy
EC Energy Commission
EEIS Engineering Environmental Information System
EHV Extra High Voltage
EMA Emergency Management Australia
EOCs Emergency operations centers
EPRI Electric Power Research Institute
EWG Energy Working Group
FEMA Federal Emergency Management Agency
GIP Generic Implementation Procedure
GIS Geographic Information System
GPS Global Positioning System
HP High pressure
Hz Hertz
IAEA International Atomic Energy Agency
KANSAI Kansai Electric Power Company
KEPRI Korea Electric Power Research Institute
KISS Korea Integrated Seismic System
KL Kiloliter
kV Kilovolt
LADWP Los Angeles Department of Water and Power
LNG Liquefied Natural Gas
LP Low pressure
LPG Liquefied Petroleum Gas
LSST Large Scale Seismic Test
MCEER Multidisciplinary Center for Earthquake Engineering Research
MEA Ministry of Economic Affairs
MM Modified Mercalli
MP Medium pressure
MVA Mega volt amp
MW Megawatts (= 1,000 kilowatts)

xi
NDRA National Disaster Relief Arrangements
NCDP National Civil Defense Plan
NCREE National Center for Research on Earthquake Engineering
NEMC National Emergency Management Committee
NGC Natural Gas Corporation
NPP Nuclear Power Plant
NZ New Zealand
OES Office of Emergency Services
PADDs Petroleum Administration Defense Districts
PESH Potential Earth Science Hazard
PGA Peak Ground Acceleration
PGD Permanent Ground Deformation
PHS Personal Handy-phone System
PSHA Probabilistic Seismic Hazard Assessment
REOCs Regional Emergency Operations Centers
RS Remote Sensing
SEMS Standardized Emergency Management System
S.E.S./T.E.S. State & Territory Emergency Services
SHA Seismic Hazard Analysis
SIGNAL Seismic Information Gathering and Network Alert
SMA Seismic Margin Assessment
SOC State Operations Center
SOP standard operation procedure
SPSA Seismic Probabilistic Safety Assessment
SQUG Seismic Qualification Utility Group
SRC Seismological Research Center
SSB State Seismological Bureau
STIS Seismic Tectonic Information System
SUPREME Super-Dense Real-time Monitoring of Earthquakes
TREIRS Taiwan Rapid Earthquake Information Release System
TSMIP Taiwan Strong Motion Instrumentation Program
TWSC Taiwan Water Supply Corporation
US United State
WSCC Western Systems Coordinating Council

Earthquake Response Cooperation in APEC 1
Chapter 1
Energy Security and Earthquakes Energy supply system in the APEC economies are always under the threat of earthquakes. Since
earthquakes are unpredictable, they present a challenge to APEC economies to ensure that energy supply
systems remain secure even during a major earthquake. Governments and private businesses have worked hand-
in-hand to promote earthquake response cooperation to guarantee energy-supply security.
1.1. Earthquake Disasters in APEC Economies
Many APEC member economies are located in seismically active regions. In recent decades, member
economies including Australia, China, Japan, Mexico, Chinese Taipei, the Philippines, Indonesia and USA have
experienced severe earthquakes that have resulted in serious damage to energy supply infrastructures and
economic development, in addition to the loss of life and property. This section briefly reviews the major recent
earthquakes in APEC member economies.
1.1.1. Tangshan Earthquake in China
At 3:42 a.m. on July 28, 1976, a magnitude 7.8 earthquake hit the sleeping city of Tangshan, 160
kilometers east of Beijing in northeastern China. When the earthquake struck, totally unexpected, over a million
people lay sleeping. As the earth began to shake, a few people who were awake had the forethought to dive
under a table or other heavy piece of furniture, but most were asleep and did not have time. The earthquake
obliterated the city of Tangshan and killed over 240,000 people - making it the deadliest earthquake of the
twentieth century in China. The entire earthquake lasted approximately 14 to 16 seconds.
Ground Motion There were three kinds of ground motion observed in the Tangshan earthquake: vertical,
horizontal and rotational movements. The vertical and horizontal movement caused the massive destruction.
There were further ruptures in a NE-directed zone after the earthquake.
Damage Before the 1976 earthquake, seismographers did not think Tangshan was susceptible to a large
earthquake; thus, the area was zoned for an intensity level of VI on the Chinese intensity scale (similar to the
Mercalli scale). The 7.8 earthquake that hit Tangshan was given an intensity level of XI (out of XII). The
buildings in Tangshan were not built to withstand such a large shock.
Table 1.1 The correlation of magnitude and intensity level on the Chinese scaleIntensity Level Ⅳ Ⅴ Ⅵ Ⅶ Ⅷ Ⅸ Ⅹ ⅩⅠ ⅩⅡ
Magnitude 4 45 5 5.5 6.5 6.75 7.25 8 8.5
Table 1.2 The correlation of magnitude and intensity level on the Mercalli scaleIntensity Level Ⅴ Ⅵ-Ⅶ Ⅶ Ⅷ-Ⅸ Ⅹ ⅩⅡ
Magnitude 4 5.3 5.3~5.9 6.0~6.9 7~7.7 7.75~8.5

Earthquake Response Cooperation in APEC 2
During the earthquake, 93 percent of residential buildings and 78 percent of industrial buildings were
completely destroyed. Eighty percent of water pumping stations were seriously damaged and water pipes were
damaged throughout the city. Fourteen percent of sewage pipes were severely damaged. The foundations of
bridges gave way, causing thesse bridges to collapse. Railroad lines bent. Roads were covered with debris and
riddled with fissures. The earthquake knocked out power systems through the city, making shocked residents’
rescue efforts impossible in the dark. After the earthquake hit, 242,419 people lay dead or dying, along with
another 164,581 people who were severely injured. In 7,218 households, the earthquake killed all members of
the family.
Early Warning System Though scientific earthquake prediction is at a nascent stage, nature often gives
some advance warning of impending earthquakes. In a village outside Tangshan, well water reportedly rose and
fell three times the day before the earthquake. In another village, gas began to spout from the water well on July
12 and its volume increased on July 25 and 26. Other wells throughout the area showed signs of cracking.
Animals also gave warnings that something was about to happen. One thousand chickens in Baiguantuan
refused to eat and ran around excitedly chirping. Mice and yellow weasels were seen running around looking
for a place to hide. In one household in the city of Tangshan, a goldfish began jumping wildly in its bowl. At 2
a.m. on July 28, shortly before the earthquake struck, the goldfish jumped out of its bowl. Once its owner had
returned it to its bowl, the goldfish continued to jump out of its bowl until the earthquake hit.
Rescue and Recovery All but one of the roads into Tangshan was damaged. Unfortunately, rescue
workers inadvertently clogged the one remaining road, leaving them and their supplies stuck for hours in a
traffic jam. People needed help immediately; survivors could not wait for help to arrive. Survivors formed
groups to dig for others. They set up medical areas where emergency procedures were conducted with the
minimum of supplies. They searched for food and set up temporary shelters.
As injured people were saved from under the rubble, they were laid on the side of the road. Many medical
personnel were also trapped under debris or killed by the earthquake and medical centers were destroyed as well
as the roads to reach them. Though 80 percent of the people trapped under rubble were saved, a 7.1 magnitude
aftershock that hit in the afternoon of July 28 sealed the fate for many who had been waiting under the rubble
for help.
With such severe damage, it was not easy to recover quickly. Food was a high priority. Some food was
airdropped in this area, but distribution was uneven. Drinking water was extremely scarce. Many people
drankfrom pools or other sources that had been contaminated in the earthquake. Relief workers eventually got
water trucks and others means in to deliver clean drinking water to the affected areas. After the emergency care
was given, the rebuilding of Tangshan began almost immediately. Though it took time, the entire city was
rebuilt and is again home to over a million people.

Earthquake Response Cooperation in APEC 3
1.1.2. Great Hanshin Awaji Earthquake in Japan
Kobe, Japan’s sixth largest city, was struck by an Mw 7.2 earthquake at 5:46 a.m. on January 17, 1995.
Japan’s worst natural disaster in recent years caused serious damage because the epicenter of the earthquake
was shallow. 6,430 people were killed. In addition, railway lines and roads, as well as lifeline services such as
electricity, gas, water and telephones suffered substantial damage. Most of those killed were in traditional
Japanese houses. Traditional Japanese construction is based on a method with little lateral resistance,which is
vulnerable to earthquake. Furthermore, the practice of using thick mud and heavy tiles for roofing gave
houses little resistance to the horizontal sheer force of the earthquake. The earthquake destroyed 60,000 to
70,000 houses in Kobe City. An estimated 40,000 to 50,000 houses were partially-destroyed. Up to 235,000
people were left homeless in the affected region.
Ground Motion Ground motion was recorded in the Greater Kobe area. The strongest recorded
acceleration was 0.82 g, measured at the Kobe marine weather station. The period of strong shaking lasted
approximately 20 seconds. The strength of this shaking was similar to that observed in several recent
earthquakes worldwide and is typical of what can be expected. What was different in this case, and the main
factor behind the extent of the damage, was that the strong shaking occurred in the middle of a densely-
populated metropolitan area. The situation was worsened by the inadequacy of building codes. In Kobe, these
were based on observed strength of shaking which, until the mid-1980s, was believed by civil engineers to be at
the order of 50% of that observed in numerous recent earthquakes. This belief was based on a set of limited data
obtained with relatively few strong-motion instruments. Many more instruments have now been deployed, and
the conclusion from the numerous resulting near-field records is that near-field shaking is much stronger (at
least twice as strong) than previously believed. Building code design should be reviewed in light of this new
data.
Fault Formed by the Kobe Earthquake The Kobe earthquake produced near-vertical displacements. The
earthquake struck in a northeast-southwest direction, from the northern tip of Awaji Island towards Kobe along
the foot of Mount Rokko. The displacement on Awaji Island was approximately 0.5 m vertically and 1.2 m
horizontally. No surface ruptures were found in the Kobe area due to the depth of relatively soft alluvial
material present at the foot of the Rokko Mountains.
Liquefaction Because of a severe shortage of available land, much of modern urban Japan, including
Tokyo, is built on the worst soil possible for earthquakes. Much recent construction in Kobe, particularly of
larger buildings, is on very soft, recent alluvial soil and on recently constructed near-shore islands. Most of the
serious damage to larger commercial and industrial buildings and infrastructure, such as Kansai airport,
occurred in areas of soft soil and reclaimed land.
Lifeline Systems The lifeline systems broken by the Kobe earthquake included water system, wastewater

Earthquake Response Cooperation in APEC 4
system, gas system and communications. Power system performed well during this earthquake. Electricity
generation facilities suffered limited damage, with the exception of failures related to displacement of
suspended boilers and soil failures. The transmission lines skirting the heavily damaged region were OK. Major
financial losses came from expensive, extra high-voltage substation equipment that had to be replaced. The
maximum number of houses without power at any one time was one million; 98 percent of supply was restored
within 15 days of reconstruction.
The gas system in Kobe sustained major damage. Many gas pipelines were destroyed when buildings
collapsed. Gas leaks caused major problems for firefighters and fires lasted dozens of hours in several areas.
After the earthquake, local suppliers put much effort into reconstruction and reviewing gas systems in seismic
areas for potential damage.
Three major problems affected the water system in the Kobe earthquake. First, there was a lack of seismic
shutoffs at key locations in the distribution system. Seismic shutoffs at the reservoirs were also inadequate.
Second, the capacity of cisterns for use in fire fighting was insufficient. In the United States, cisterns provide a
1-hour supply, but there was typically only a 10-minute supply in Kobe. Third, Kobe needed large-diameter
hoses rather than its 65-millimeter hoses to relay the necessary amount of water.
Table 1.3 Breakdowns and recovery rates of lifelines in the Kobe earthquakeAfter earthquake After 15 days Recovery rate
Water system 1,277,000 392,000 69.3 %Gas system 856,000 808,000 5.6 %Power system 1,000,000 20,000 98.0 %Telecommunications 285,000 0 100.0 %
Transportation The collapse of bridges and elevated expressways is evidence of the impact on Kobe’s
transportation system. The Hanshin Expressway, built in the 1960s, was virtually destroyed along more than 20
kilometers. Many spans of the Wangan Expressway lost their bearing connections. Rail systems were severed
by the earthquake. Several stations and elevated rail structures, including the main north-to-south bullet train
line, failed.
1.1.3. Manzanillo Earthquake in Mexico
On Monday, October 9, 1995, an earthquake of magnitude 7.9 struck the subduction zone off the Pacific
coast in Mexico. The epicenter was just offshore, about 30 kilometers southeast of the port of Manzanillo. It is
estimated that 50 people died in the earthquake and over 10,000 were left homeless. No severe damage was
reported within the city center of Manzanillo itself, except in northern Manzanillo’s hotel district. The
earthquake did impact on the tourist industry in the area as tourists from the United States and elsewhere
cancelled their trips.

Earthquake Response Cooperation in APEC 5
Tectonic Setting The Manzanillo Earthquake was caused by the collision of the Cocos tectonic plate and
the North American plate with the Cocos plate being subducted beneath the North American plate. Such
subduction in the Pacific coastal region often releases vast amounts of energy and is often very destructive.
Seismologists have identified six seismic gaps along the 2,000 kilometer subduction belt. For example, the
Mexico City Earthquake of 1985 occurred in the Michoacan Gap, while the Manzanillo earthquake lies within
the Jaliso Gap. According to the theory of plate tectonics, similar subduction zones run offshore off the western
United States and Alaska.
Ground Motion The main shock of the Manzanillo earthquake on October 9 was preceded by a
magnitude 5.7 foreshock on October 5. The main shock in the morning of October 9 was followed by a
moderate aftershock that evening and a large aftershock three days later rated at magnitude 6.1 that caused
additional damage. People living in the affected areas generally described the motion in the main shock as
equally vertical and horizontal and lasting more than a minute. On-site analysis of accelerograph records
showed strong motion (cycles of acceleration at the order of 0.10g or greater) during the main shock of October
9 that lasted for a period nearly 30 seconds. In the most intense period, several cycles of motion occurred at
the order of 0.40g.
Loss of Property The areas affected by the Manzanillo Earthquake were coastal communities in the
states of Colima and Jalisco. In these states, most people are farmers and tradesman processing agricultural
products; tourism is the second largest industry. After the earthquake, some tourists from United States and
elsewhere cancelled trips planned for December. Under the earthquake intensity of MMI VI to VII (equivalent
Richter scale 5 to 6), effects of the earthquake were minimal elsewhere in Mexico. The most significant damage
in the area from northern Manzanillo to the Colima-Jalisco border was some house collapses and wall fractures .
Most buildings in the city center were more than 20 years old; many were built in the 1920s and 1930s.
Impact on Lifelines Lifelines in the region performed well: there were no long-term interruptions of
lifeline services. The power system in most districts recovered within 12 hours. In the most severely damaged
areas, such as Cihuatlan community, electricity was reportedly restored within 24 hours. Minimal damage to
local substations and transmission lines aided the fast recovery. The water system was maintained in most areas;
a limited number of failures in buried water pipeline halted water supply to certain neighborhoods. The
earthquake triggered no big fires, thus large quantities of water were not needed to fight fires.
1.1.4. Chi-Chi Earthquake in Chinese Taipei
On September 21, 1999 at 1:47 local time (September 20, 17:47 GMT), central Taiwan was hit by an
earthquake of ML magnitude 7.3. The Mw magnitude of the earthquake was 7.6. The epicenter was located at
120.82oE, 23.85oN. Focal depth was about 8 km. It is the largest earthquake to strike central Taiwan in the
twentieth century.

Earthquake Response Cooperation in APEC 6
The earthquake was caused by a sudden rupture of the Chelungpu fault. Unusually large surface fault
displacement and very strong ground shaking brought enormous destruction. The most severely devastated
areas were in Nantou and Taichung Counties and Taichung City in central Taiwan. The most strongly shaken
area has about 1.2 million residents. The earthquake also caused significant casualties and damage in other
cities and counties in both central and northern Taiwan. According to the latest official reports, a total of 2,489
people were killed or are still missing, 11,306 were injured, 50,753 households totally collapsed, 54,406
households partially collapsed. There are still 50 people missing. This was the second most disastrous
earthquake in Taiwan’s history, after the April 21,1935 ML 7.1earthquake of which struck just north of the Chi-
Chi earthquake and killed 3,276 people in Taichung and Miaoli Counties.
Surface Ruptures By dawn in the morning immediately following the earthquake, many geologists had
rushed to the epicenter area to make reconnaissance surveys of possible surface fault ruptures. It was soon
discovered that the Chelungpu fault had ruptured. It slipped almost continuously, although sinuously, along its
whole length for about 100 km, extending from Shihgang at the northern end to Tongtou at the southern end.
Splays of NE-directed surface fault ruptures were soon found extending northeastward from Shihgang toward
Cholan. The total length of the surface fault ruptures was estimated at about 100 km.
Both uplift and left-lateral strike-slip displacements were observed at most outcrop locations. It is clear
that the Chelungpu fault was an oblique thrust fault. This was consistent with the fault-plane solution obtained
by the first motion polarities and moment tensor inversions. It is remarkable that the amount of slippage
increased persistently from a little over one meter at the southern end to almost ten meters near the northern end
of the fault. The Chelungpu fault clearly marks the boundary between the Pliocene and Quaternary formations.
An E-W profile across the fault (see figure 1) shows a series of imbricated thrust faults dipping to the east. The
Chelungpu fault is just one of them. Figure 1 also shows these faults as well as the locations of background
seismicity and strong aftershocks of the Chi-Chi earthquake. It can be seen that most aftershocks took place far
away from the Chelungpu fault and fell in the curved zone of active background seismicity east of the Che
lungpu fault. Apparently, the zones of active background seismicity served as the boundary of the ruptured
crustal block. Figure 1 additionally shows the velocity waveforms of the E-W component integrated from
original acceleration records made at seven stations aligned along the fault traces. It is seen from the differential
timings of the big pulses that the fault rupture started from the hypocenter first and then propagated toward the
north and south. The rupture velocity can be estimated at about 2 km/sec. The big pulse near the northern end
was significantly enhanced due to rupture directivity.

Earthquake Response Cooperation in APEC 7
Figure 1.1 The Chelungpu fault, and the epicenter of the Chi-Chi earthquake. Also shown are background
seismicity (in red dots), strong aftershocks(orange dots) and E-W component velocity waveforms along the
fault line.
1.1.5. Northridge Earthquake in the United State
The Northridge Earthquake occurred at 4:30 a.m. local time on January 17, 1994. The epicenter of the Mw
6.7 earthquake was at 34°12’N, 118°32’W, about 30km west-northwest of downtown Los Angeles. The focal

Earthquake Response Cooperation in APEC 8
depth has been estimated at 15-20 km. . Strong shaking lasted about 15 seconds in the epicentral area. The
causative fault of the Northridge earthquake is part of a broad system of thrust faults that result from a 160-km
left step in the Pacific-North American plate boundary at the Big Bend of the San Andreas fault. The complex
deformations resulting from the compression associated with movement around the Big Bend has generated
many north-dipping and south-dipping subparallel faults, only some of which come to the surface. The
Northridge Earthquake occurred at the intersection of several mapped faults. The causative fault does not extend
to the surface and was not mapped before the earthquake. The earthquake began at the southeastern corner of its
fault plane and ruptured to the northwest for about 15 km. There is no evidence of the slip above a depth of 8
km. Had the rupture come closer to the earth’s surface, the shaking might have been more severe over a limited
area. There were no immediate foreshocks. The aftershock zone averaged 22 events per year from 1981 to1993
that were above Mw 1.7, which is typical of the dispersed background seismicity of the area. There were over
3000 aftershocks of Mw > 1.5 recorded in the first three weeks after the earthquake. The largest aftershock (Mw
5.9) occurred one minute after the main shock. Elastic strain released by the earthquake measurably deformed
the crust over 5000 km2 surrounding the epicenter. The region was lifted up as much as 70 cm and displaced
horizontally as much as 21 cm.
Geotechnical Setting No surface faulting was observed from the causal fault. This is in contrast with the
1971 San Fernando earthquake, which was located nearby and produced 15 km of well-defined surfaced
faulting. There were broad zones of secondary surface ruptures observed that are not readily attributable to
common modes of shaking-induced ground failure. They may in part be a response to tectonic deformation.
These zones were concentrated near the epicenter, in Granada Hills just east of the inferred rupture surface, and
along the north flank of the Santa Susana Mountains. Most of the surface displacements observed in natural
ground in these areas are extensional; cumulative displacements across the fracture zone rarely exceeded a few
tens of centimeters. Displacements on secondary ground ruptures were small, but the linear extent of these
zones is comparable to what might be expected for a surface-faulting earthquake of similar magnitude.
However, they did cause substantial damage in densely developed areas. Liquefaction produced sand blows and
other evidence of permanent ground deformation in alluvial deposits and filled land at several sites within 48
km of the epicenter. This deformation damaged pipeline, water supply channels, and flood control debris basins.
However, the Northridge Earthquake caused much less ground failure due to liquefaction than the 1971 San
Fernando earthquake.
Ground Motion The Northridge Earthquake produced strong ground motion across a large part of the
Los Angeles metropolitan area. More strong motion records were obtained within 25 km of the source than had
been recorded in any other event. The peak horizontal accelerations recorded were larger for its magnitude than
for other similar earthquakes. The vertical and horizontal ground accelerations and velocities were large, but the
average peak accelerations were no more than one standard deviation above the mean of the data from other
earthquakes. Directivity probably increased ground motion in the area north of the epicenter. In the area
estimated to have the largest ground motion for the fault geometry, a peak velocity of 170cm/s was recorded,

Earthquake Response Cooperation in APEC 9
the largest ground velocity recorded to date.
1.2. The Project’s Perspectives: Earthquake response cooperation system
This project aims to establish a cooperative contingency mechanism for energy supply systems among APEC
member economies. The project also provides an opportunity for all APEC member economies to share
experience in both preventing the collapse of energy supply systems during earthquakes and rebuilding these
systems after earthquakes. The project can be classified under the following five headings:
1. Information Sharing
Exchanging earthquake-related information and experiences through seminars and translation of relevant
information into English.
2. Policy Dialogue
Encourage discussion of related policies at the level of the EWG to raise awareness and harmonize institutional
measures to prevent severe damage.
3. Emergency Reactions
Set up contingency communication system to monitor rescue actions, and establish a database to aid
acquisition of resources needed for emergency energy supply.
4. Rescue Cooperation
Establish a database to access various emergency energy supply resources within the member economies.
Promote the exchange of necessary technologies for emergency energy supply.
5. Rehabilitation Programs
Collate information on rehabilitation programs for the reference of member economies. Develop
information acquisition and management system for use in earthquake aftermath.
1.3. Summary
Since many APEC member economics are located on the circum-pacific earthquake belt, energy security in
these member economics is always under the threat of earthquakes. In decades, member China, Japan, Mexico,
Chinese Taipei, the Philippines, Indonesia and the USA have experienced severe earthquakes that have resulted
in serious damage to our energy supply infrastructure and our economic development. In the recent decades,
members economies including China, Japan, Mexico, Chinese Taipei, the Philippines, Indonesia and the USA
have experienced severe earthquakes that have resulted in serious damage to energy supply infrastructures, in
addition to loss of lives and property. This chapter briefly describes the tectonic setting, ground motion, damage
and rescue and recovery from the devastating Tangshan, Hanshih Awaji, Manzanillo, Chi-Chi, and Northridge
Earthquakes.

Earthquake Response Cooperation in APEC 10
Chapter 2
Past Experiences of Energy Supply Systems
During EarthquakesThis chapter describes past experiences of the impact of earthquakes on energy supply systems. It is
intended to help APEC member economies foresee and prevent damage in future earthquakes. The chapter is in
two sections. The first part reports case-by-case on damage to energy infrastructure. The second part shares
experiences of restoration and reconstruction of damaged facilities. Each part is sub-divided into sections on
electricity, oil and natural gas..
2.1. Damage to the Energy Infrastructure
2.1.1. Electricity Supply
Power systems can be divided into generation, transmission and distribution subsystems. Transmission
and distribution facilities are more vulnerable to major earthquakes. Design of generation facilities adopts
higher earthquake design standards: generation equipment can usually withstand earthquakes of 0.4 g or higher
ground acceleration. Hence most reported damage is to substations, transmission lines and distribution lines.
Damage to Electricity Supply in Kobe Earthquake
Immediately prior to the earthquake, Osaka Gas Company’s total electric power demand was 12,700MW.
It lost 1,760MW of power generating capacity immediately after the earthquake. Loss of loadfollowing damage
to the power system, however, was greater than the loss of generating capacity. As a result, the frequency
increased by 0.45Hz and the voltage at the two 500 kV substations went up by 20 kV. Six 275 kV substations
and two 154 kV substations were damaged by vibration and completely stopped operating. The area affected by
the electric power outage represented total demand of 2,836 MW from approximately 2.6 million customers.
The earthquake took roughly 20% of the company’s total power system out of operation. Osaka Gas Company
operates 21 fossil-fired power generation plants, comprising 64 units. Among these, 20 units at 10 different
power stations suffered damage, typically to the boiler tubes. The earthquake did not damage any nuclear
powered generation plants or hydroelectric power plants. While the earthquake did not cause any damage to the
500 kV facilities that form the backbone of the power systems, there were numerous minor incidents: damage
occurred at 50 substations and along 112 transmission lines. Major damage to substations included 17
transformers that slipped out of place when the anchorage broke off, leakage from the bushing on 8 circuit
breakers, and breakage of the support insulators of 22 disconnecting switches. Twenty-three overhead
transmission lines were damaged. This included damage to the structure of the steel towers and the long-rod
insulators used to fix jumpers. Damage to the towers was not directly caused by the earthquake motion but by

Earthquake Response Cooperation in APEC 11
fissures and land slippage near tower foundations. Damage was observed along 102underground transmission
lines mainly on a flat area along the waterfront of Osaka Bay. This was caused by liquefaction, depression of
roads and cracks that opened up in the ground due to the earthquake.. In total, 649 distribution line circuits were
damaged. . Distribution poles fell over or were broken where houses or buildings collapsed. Elsewhere,
distribution poles tilted over and conductors broke off due to problems in the underlying soil structure including
liquefaction and subsidence. Approximately 11,000 poles were damaged; most of them were in the strong
vibration areas.
Damage to Electricity Supply in Manzanillo Earthquake
The most significant damage caused by the Manzanillo earthquake was to substation equipment. This
included total porcelain rupture of bushings on transformation units and shearing stress damage to the concrete
bases of breakers.In the Manzanillo II substation, A1120 "B" phase and A2030 "A" phase breakers were
destroyed. Three poles of 400 kV A3190 and A8190 breakers fell down and the high voltage insulation broke on
a "B" phase A1110 bracer. Bushing damage at the Manzanillo II substation was to the "B" phase of the 375
MVA, 20/400 kV main transformer of No.1 Generation Unit, and the "B" and "C" phases bushing of the 50
MVA, 400/6.9kV input transformer of No. 1 and 2 Generation Units.
In the Tapeixtles substation, high and low voltage bushings of the 225 MVA, 400/230 kV group
autotransformer were destroyed; shearing stress also damaged the 400 kV bracer concrete bases on "A" and "C"
phases. The control cabin sustained severe structural damage to columns and slabs, and was at high risk of
collapse.
Damage to Electricity Supply in Chi-Chi Earthquake
The loss of 28 345KV transmission lines (Table 2.1) and Chungliao Switchyard caused the disconnection
of EHV Substations Chiamin and Lungchi from the network, and consequent interruption of power transmission
from the South to North. The whole Central and North Taiwan was blacked out immediately.
1. Power Plants: Equipment in power plants was slightly damaged.
2. Substations: Ground shaking tore anchor bolts and damaged several transformers and circuit breakers in
substations. Switchyards and substations of hydro plants were damaged too, especially at the EHV
substation at Tienlun. In addition, strong ground motion and soil liquefaction at the Chungliao Switchyard
caused displacement and subsidence of foundations and severe damage to equipment.
3. Transmission Lines and Towers: Transmission lines were severely damaged, causing interruption of power
transmission from the South to North. Landslides and ground failures damaged transmission towers in
mountainous areas.
Table 2.1 Number of Damaged Transmission Lines

Earthquake Response Cooperation in APEC 12
Transmission Towers
LinesCollapsed Tilted Deformed
Foundationscracked orsubsided
Foundationsdisplaced Others Total
No. of LinesDamaged
345KV 1 9 55 271 19 0 355 28161KV 9 4 9 157 4 14 197 3069KV 3 16 3 60 2 0 84 21
Damage to Electricity Supply in Northridge Earthquake
Damage caused by the Northridge earthquake to high voltage equipment was generally consistent with
that observed in other recent earthquakes. There was more damage to high voltage (230 kV and 500 kV)
transformer bushings and damage to transmission-line tower foundations from liquefaction and on-ridge
shattering in this earthquake. This and other damage and the action of protective devices caused a loss of power
to a large part of the greater Los Angles area. The distribution of 1800 MW being exported to the Northwest
also caused power disturbances in the Denver, Salt Lake City, Boise, and Seattle areas, with the longest
disruption lasting about 3 hours. The direct losses were $138 million to Los Angeles Department of Water and
Power, and about $45 million to Southern California Edison.
Most of the generating capacity for the Los Angeles Basin is located outside of the heavily shaken region;
however, both ac and dc bulk power transmission lines for Los Angeles enter the region through the northern
San Fernando Valley, within a few kilometers of the epicenter. Generating stations within the affected region
were subjected to moderate levels of ground motion, while several substations and converter stations were
subjected to very strong ground motion. Earthquake damage to transmission towers, dc converter stations, and
substations resulted in widespread local and isolated remote power outages lasting from minutes to several days.
Power Plants Take the Valley Generating Station as an example. This station, located closest to the
epicenter (13 km away), includes two 95-megawatt (MW) units (Units 1 and 2) that were not operational at the
time of the earthquake and two 160-MW units (Units 3 and 4) that were on cold-standby when the earthquake
occurred. Preliminary strong-motion data and damage assessments indicate that the facility had about the same
level of shaking as during the 1971 San Fernando Earthquake, approximately 0.4g horizontal peak ground
acceleration. The facility had minor damage such as cracks in steel struts, a twisted wide flange, distorted
exhaust duct insulation panels, damaged piping insulation, inoperable combustion air instruments, leakage in a
welded condensation line, and superficial damage to building elements. Numerous relays had to be reset prior to
restart. The damage did not prevent plant operation, and Units 3 and 4 were successfully brought on-line several
hours after the earthquake. The plant continues to supply power to the region.
Substations High-voltage electrical transmission facilities affected by the earthquake. Damage sustained
by 230- and 500-kilovolt (kV) transmission apparatus ranged from minor to substantial, depending on the
severity of ground motion and the adequacy of seismic design features. Substation damage was the primary

Earthquake Response Cooperation in APEC 13
reason for widespread local power outages and isolated remote outages across seven western states and British
Columbia. Isolated instances of transmission tower structural failures caused by ground failures were also
reported. High-voltage substation apparatus designed after the 1971 earthquake and engineered for high-seismic
zones generally had substantially less damage than did older equipment. Observed and reported damage
indicates that additional research and engineering need to focus on the isolated failures of relatively new
apparatus, particularly in unique apparatus that convert bulk dc power to ac power for local transmission and
distribution.
Cogeneration Facilities Some cogeneration facilities were located within a few kilometers of the
epicenter; others were at more distant locations. A 6-MW gas turbine unit was subjected to 0.9g ground motion
and was operational within a few hours. A 25-MW gas turbine unit was located in the Santa Clarita Valley and
was also operational within a few hours. Some of the smaller facilities were in areas that had substantial
structural damage to surrounding buildings. Preliminary investigations indicated that control logic malfunctions
were a significant factor in delaying restart of the units that were undamaged after the earthquake. In one case,
automatic closure of a seismic gas shutoff valve isolated gas to the boiler. Backup power to restart the boiler
was provided by a manual-start diesel generator.
2.1.2. Oil Supply
Liquid Fuel System in Chi-Chi Earthquake
Liquid fuel systems performed well in the Chi-Chi Earthquake. Only some tank roofs and walls were
deformed, and some gas stations damaged. Some oil storage tanks were affected by the earthquake. One cone
roof tank with 25,000 KL capacity at Taichung Oil Terminal was damaged. The roof plate and upper first and
second course plates were left badly deformed. In addition, stair ladders ruptured and other course plates
twisted or slightly deformed. Another internal floating roof tank with 15,000 KL capacity at Taichung Harbor
Oil Terminal was also damaged: the floating pontoon sunk and the guide pole twisted and deformed.
The following damage to gas service stations was reported:
1. Ruined: 1 station.
The station was located on a main seismic fault of the quake. The folding of the ground floor led to the
collapse of the rain shelter and the rupture of filling pipes and facilities, leaving the station in debris.
2. Seriously damaged: 4 stations.
Rain shelter columns were left slanted and cracked , tipping the beam slab and exposing reinforcing steel
bars.
3. Damaged: 11 stations.
Rain shelter beams and columns were damaged; the ground floor was lifted at the tank area and refilling
pumps and pipes were ruptured.

Earthquake Response Cooperation in APEC 14
4. Slightly damaged: 4 stations.
Petroleum Pipeline Spills in Northridge Earthquake
Following standard operating procedure for hazmat liquid pipelines, all petroleum pipeline pumping stations
were shut down immediately after the earthquake was detected. The resulting reduction in pipeline pressure
limited, but could not eliminate, releases from the nine pipeline ruptures that were reported by the California
State Fire Marshal. One of these releases involved the UNOCAL Torrey line. A subsequent spill, only
tangentially related to the earthquake, occurred at Grasshopper Canyon/Castaic Lake on January 22 when
ARCO was pressure testing another pipeline for reopening after it had been shut down during the earthquake.
The UNOCAL Torrey Line, originally built in 1955, has a normal throughput of 806,400 gallons per day. The
pipeline failure released only about 100 gallons of crude oil into the soil in a remote area. No injuries were
associated with the release and all contaminated soil was recovered. The multiple breaches of the ARCO Four
Corners line – originally built in 1925 and relocated in 1959 – had significantly greater consequences. Even
though the pipeline was not in operation on the day of the earthquake, the California Fire Marshal’s Office
estimated that the total spills amounted to more than 230,000 gallons. Property damage and one injury to a
motorist were reported in connection with one spill when leaking crude oil was ignited. Early estimates placed
the amount of recovered material at one-third of the spill, while recently ARCO Pipeline sources placed the
amount recovered at nearly two-thirds. Most of the spills were on sections of the pipe under low pressure, so
only small quantities of oil were released and the product remained at close proximity to the release point.
However, emergency response and cleanup costs during the first two months after the spills exceeded $ 15
million. The greatest environmental impact was associated with an ARCO pipeline spill, 173,000 gallons of
light crude oil, from the Newhall Booste Pump Station in Santa Clarita. An estimated 67,500 gallons drained
from the pipeline itself, while another 105,500 gallons drained from an associated storage tank – about 6.7% of
the tank’s 1.6 million gallon capacity. The crude oil combined with wastewater from damaged sewage treatment
plants and contaminated approximately 12 miles of river. On March 2, more than six weeks after the earthquake,
the last river segment was approved for final cleanup and the last removal action was completed. The pipeline
operator’s final cost for the cleanup was approximately $12 million.
2.1.3. Natural Gas Supply
Natural Gas System in Kobe Earthquake
The gas system sustained at least 1,400 breaks in its underground distribution system, primarily on service
lines, with subsequent general curtailment of service by Osaka Gas Company to 834,000 households. Japanese
buildings and homes have automatic gas shutoff systems, but many failed to work because of building collapses,
other building damage, and broken pipes. The population in the heavily impacted areas was also notified to
expect no gas service for about two months. A large gas holder near the Port of Kobe did not have any obvious

Earthquake Response Cooperation in APEC 15
structural damage. There are a number of petroleum and other fuel tanks in the port area, the largest being
roughly 25 meters in diameter and 15 meters high. Only a few were observed to have any damage, and only one
collapsed. Many of these tanks were at-grade and freestanding, while some were bolted to their foundations.
Several liquefied petroleum gas (LPG) tanks exist in the port area, and one was reported to have cracked,
resulting in the temporary evacuation of 70,000 people. Two groups of three large spherical tanks along the
waterfront in Kobe were well braced with heavy diagonal pipe bracing between column supports and appeared
to have no damage. There were no reports of liquid fuel pipe breaks, with the exception of one line at Kansai
International Airport.
Natural Gas Systems in Chi-Chi Earthquake
There are 23 natural gas companies in Taiwan, all of which purchase natural gas from the government-
controlled Chinese Petroleum Corporation (CPC) and then distribute it to residential, commercial and industrial
customers in Taiwan. There are five major natural gas companies serving Central Taiwan and they were each
seriously affected by the Chi-Chi Earthquake.
Case Study: Shin-Chang Natural Gas Co.
Fengyuan City, Tungshih Township, Shihkang Township, and Hsinshe Township were among the hardest hit
area (all of them are located in Taichung County). As a result, Shin-Chang Natural Gas Company, the service
provider in these areas, suffered huge losses.
Extent of service interruption:
(1). Cut off from natural gas supply: 23,304 customers
(2). Length of medium pressure lines damaged: 50,090 meters
(3). Length of distribution lines damaged: 50,772 meters
(4). Pressure regulators damaged: 353
(5). Flow meters damaged: 2,636.
(6). Loss of natural gas: 8,442 m3.
Table 2.2 The Loss of Natural Gas Pipelines
CompanyTotal lengthof pipelines
(km)
Length ofpipelinesdamaged
(km)
Rate ofDamage (%)
Number ofgas utilitycustomersaffected
Percent ofcustomer
affected (%)
Loss (U.S.dollars)
Shin-ChungNatural GasCo.
1228 33 3% 15,047 7% $3,125,000
Shin-ChangNatural GasCo.
870 182 21% 23,304 34% $12,187,500
Shin-YunNatural GasCo.
173 12 7% 4,799 67% $2,500,000
Shin-LinNatural Gas 862 591 69% 60,288 69% $5,000,000

Earthquake Response Cooperation in APEC 16
Co.
Natural Gas Releases in Northridge Earthquake
Southern California Gas reported 35 breaks in its natural gas transmission lines and 717 breaks in
distribution lines. About 74% of the 752 leaks were corrosion related. As was the case with crude oil pipelines,
most other leaks were from cracked or ruptured oxyacetylene girth welds in pipes assembled before 1932. Two
of the larger incidents involved fires. One fire was located near the town of Fillmore where a ruptured
transmission line was ignited by a downed power line and burned a mobile home. In the other incident a 22-
inch transmission line was severed and the release was ignited by a passing motorist. Fire response was
impeded by the simultaneous rupture of a nearby water main, and the fire destroyed five adjacent homes.
There were 15,021 natural gas leaks at customer facilities. Many of these were small leaks, detected and
repaired at the time of service restoration (122,886 gas meters were closed by customers or emergency
personnel in the aftermath of the earthquake). Natural gas leaks in the Southern California Gas service area
resulted in three street fires, five structure fires, and the destruction by fire of 72 mobile homes. There was a
much greater incidence of fires in mobiles homes than in other structures. Many of the mobile home fires
erupted when inadequate bracing permitted them to fall from foundations, severing gas lines. Residents could
readily detect the danger and protect themselves by evacuating.
2.2. Restoration and Reconstruction of Damaged Facilities
2.2.1. Electricity systems
Restoration of Power System in Kobe
Restoration of power system Restoration of the power system was started immediately after the
earthquake by switching properly functioning equipment at disabled substations over to systems that were still
running. At about 7:30 a.m., two hours after the earthquake struck, the number of customers left without
electricity had been reduced to approximately 1.0 million, mostly in Kobe and Nishinomiya Cities. At the same
time, repairs were carried out to the damaged substations. By 8:00 a.m. on January 18, one day after the
earthquake, all substations had been restored to a temporary operating condition, and the number of customers
left without electricity was further reduced to about 0.4 million. Restoration works of distribution lines was
carried out under extremely difficult circumstances. Many roads were in poor condition, and it was necessary to
confirm which buildings had collapsed or were unoccupied. 3 days after the earthquake, at 6:00 a.m. on January
20, distribution lines had been temporarily restored to all but about 110,000 customers in the Sannomiya,
Hyogo, and the Nishinomiya districts. Temporary restoration was completed by 3:00 p.m. on January 23, just
over 6 days after the earthquake.
Key points for the rapid restoration of electricity supply Electricity supply was almost fully restored to
the entire disaster area within 7 days. Considering the extreme destruction caused by the earthquake in and

Earthquake Response Cooperation in APEC 17
around Kobe City, this was a considerable achievement for the electricity companies. The following six factors
played an important role in the rapid restoration of supply:
(1) A robust and flexible power system (linked system at a voltage of less than 77 kV): As main power system
itself is multiple, electricity companies are able to switch over from damaged transmission sections to
properly functioning systems. For example, the 275 kV system suffered extensive damage leading to power
outages over wide areas, but the 275 kV substations are also linked by the 77 kV system. By utilizing this
intact 77 kV system to form temporary links between 275 kV substations, the companies were able to
reduce the area without power within a relatively short period of time.
(2) Restoration by overhead distribution lines: Overhead distribution lines were used for temporary and swift
restoration of power. Power generation vehicles were used, and all undamaged equipment and materials
were left on-site as far as possible.
(3) Private communications system with strong seismic design: KANSAI has a microwave communications
system linking the Central Load Dispatching Center with each of the main power stations and substations.
The electricity companies also have their own independent telephone system using microwave transmission
and fiber optic cables. The earthquake did not affect these private communications systems so they could be
used to coordinate restoration work.
(4) Nationwide system to receive assistance from other electric power companies: KANSAI received
invaluable assistance from other utilities. In addition to dispatching 326 personnel, they provided diverse
material assistance including 52 power generation vehicles; 77 working vehicles; materials, food, and water
for the restoration works; and vehicles quipped with satellite communications facilities.
(5) Seismic design and other measures against earthquakes: The seismic design of KANSAI’s facilities,
developed on the basis of past earthquake experiences, effectively minimized damage. KANSAI has
systematically incorporated seismic design in its main facilities since the 1978 offshore Miyagi earthquake.
Although the Hanshin-Awaji Earthquake damaged some facilities, the company believes seismic design
averted major damage and aided the quick response.
(6) Emergency maintenance skills: Training for natural disaster preparedness is essential. Familiarity with
the necessary technologies and skills should be maintained at all times.
Damage Restoration in Manzanillo Earthquake
Damage Restoration The nine 400 kV power breakers at Manzanillo I and Manzanillo II substations
were initially restored on-site by taking existing spare parts from CFE warehouses. These breakers were back in

Earthquake Response Cooperation in APEC 18
service between 30 and 60 days after the earthquake. The power breakers had all been replaced by November
1996 with new breakers designed to be earthquake-resilient. During their installation, the column bases were
reinforced and the control wiring modified. The old breakers were designed to withstand acceleration of 0.20g;
in comparison, the new equipment is designed to withstand acceleration of 0.86g.
2.2.2. Oil Systems
Restoration of oil supply system in Chi-Chi earthquake
After the earthquake, power and telecommunications networks were severed immediately and several
main highways into the worst-hit area were impassable. This slowed the response and recovery of the oil supply
system. The following factors let to total suspension of oil supply in the region:
(1)Gas refilling stations with damaged facilities (buildings, rain shelters, pumping facilities and etc.) shut down.
(2) Gas refilling stopped as power supply was cut.(3) Oil & gas transfer and distribution network disintegrated as telecommunication services were interrupted.(4) Oil transportation services broke down as road links were severed.
Emergency relief measures were taken to restart the supply of oil and gas products after the earthquake. First,CPC(China Petroleum Company)mobilized all available emergency generators, and installed temporaryrefilling equipment on the vehicles. Second, mobile refilling vehicles were moved into the areas to help slightlydamaged stations maintain refilling services. Third, CPC altered delivery routes to access ravaged areas andextended business hours of gas service stations in quake-stricken area. Fourth, CPC brought in personnel fromother less-affected areas to assist in refilling operations. Refilling services were provided to all emergency reliefvehicles and machines on credit or by means of coupons. Due to these temporary measures, oil supply indisaster areas was revived and it was able to back up the rescue operations.
Restoration and Reconstruction of Damaged Facilities:Oil tanks CPC transferred oil stock from damaged tanks to replacements and routed gasoline through
pipelines to counter the disruption in supply.
Gas service stations CPC tore down and rebuilt seriously-damaged stations and repaired or reinforced slightlydamaged stations. CPC completed all restoration jobs by Jan.18, 2000, except for Yenping Gas Service Station,which was scheduled to be rebuilt later.
Pipelines CPC responded to the rupture of 8” and 4” gas pipelines and gas leakage caused by thecollapse of Wushi Bridge in Tsaotun Township by shutting the control valve to block the leakage. Thedownstream gas company and major industrial users were notified promptly to take necessary precautions. ThenCPC carried out emergency repairs. With the pipelines fixed, gas supply resumed the next day, Sept.22, 1999.
Prevent future disasters CPC’s trunk and loop pipelines for gas have been equipped with the SCADAsystem to monitor the flow, pressure, specific gravity, and heating value of transmitting fluid, and conditions at

Earthquake Response Cooperation in APEC 19
each automatic valve and governor, as well as the performance of various safety facilities. Any malfunction orabnormality will be transmitted instantly to the main control center at Neihu, Taipei. Leakage detectors areinstalled at key sections of pipelines to ensure optimum safety.To minimize the risks from future earthquakes, six sets of seismometer and seismic alarm indicators wereinstalled in CPC’s gas trunk line at Yungan terminal and major gas transmission and control centers in February,2001
2.2.3. Natural Gas Systems
Restoration of Natural Gas system in Kobe earthquake
The Great Hanshin Earthquake brought an unprecedented degree of devastation to the area - 6,400 deaths,
43,000 injuries and 490,000 buildings and houses totally or partially destroyed. The Osaka Gas network was
damaged in 12,000 pipe sections, causing suspension of gas supply to 860,000 customers, which accounted for
15% of the total number. It was the most severe and devastating damage Osaka Gas had ever suffered.
Osaka Gas supplies natural gas to six prefectures in the Kansai region, including major cities such as
Osaka, Kobe and Kyoto, serving a total of six million customers s[read across 3,000 square kilometers. Total
pipeline length is 49,000 kilometers. The company’s supply systems regulate gas pressure in four stages: a high
pressure stage, two medium pressure stages, A and B, and a low pressure stage.
The earthquake damaged 12,000 low pressure pipe sections. Fortunately, however, there was no major
secondary disaster caused by gas leakage. The company’s main facilities, such as LNG receiving terminals and
high pressure trunklines suffered no damage. New-type welded steel pipes and polyethylene pipes were also
hardly damaged. Intelligent gas meters with automatic shut-off devices installed for individual customers
functioned effectively. The repair of damaged pipelines and inspection of individual customers’ pipes for safety
was time-consuming work. Osaka Gas took 85 days to restore service to all 860,000 customers who had their
gas supply suspended by the earthquake.
Restoration of Natural Gas system in Chi-Chi earthquake
Gas pipeline damage was repaired within a month of the Chi-Chi earthquake. This took a total of
17,229 manpower hours: 672 “excavator hours,” 591 “backhoe hours,” 3,375 “utility truck hours,” 469 “air
compressor hours,” 1,689 “generator hours.”
Stages of Restoration Emergency response stage (1:47-6:00 A.M., 9/21/1999): An Emergency Response
and Recovery Center and staging areas was established for each service district, then engineers, technicians, and
outside contractors were called in . Storage facilities for natural gas were immediately inspected and pressure
checked. Pipelines were inspected and valves closed to isolate damaged areas.
Temporary restoration stage (9/21/99- 11/30/99): The gas company isolated damaged areas and restored natural
gas supply block-by-block. The company then increased customer visits to ensure safe supply to various

Earthquake Response Cooperation in APEC 20
buildings. Meanwhile, the company replaced damaged parts with more earthquake-resistant components and
constructed temporary bridges to carry natural gas pipelines. In addition, the company applied for emergency
aid from the government.
Post-quake reconstruction stage (beginning 12/1/99): The gas company continued to inspect pipelines and
selected new materials for the pipelines systems. It also computerized the natural gas management and
distribution system and constructed permanent pipelines in connection with the rebuilding of roads and bridges.
2.3. Summary
Energy supply systems cover electricity, liquid fuel and natural gas. Each consists of numerous complicated
facilities and enormous transmission networks. These energy supply infrastructures are very vulnerable to large
earthquakes. Since estimation of earthquake damage to energy supply is difficult, past experience of earthquake
damages, responses and energy supply system restoration is a vital part of earthquake preparedness. This
chapter outlines member economies’ experiences of emergency responses and restoration following recent
major earthquakes in order to provide other member economics more information to predict possible
earthquake damage to energy supply systems and to help them prepare better to cope with earthquakes.

Earthquake Response Cooperation in APEC 21
Chapter 3
Earthquake Risk Assessment and Management “How could the next big earthquake affect our energy supply systems?” To answer this question, we
must have a clear understanding of our potential seismic risk. A comprehensive earthquake risk assessment, in
conjunction with earthquake risk management, is the best way to protect energy supply systems. This chapter
introduces several techniques or methodologies that have been developed over a period in APEC member
economies for the assessment of risks due to earthquakes. In order to understand the earthquake risk, we firstly
discuss probabilistic seismic hazard analysis. Then we discuss earthquake risk assessment in lifelines, power
systems, liquid fuel systems and natural gas systems.
3.1. Probabilistic Seismic Hazard Analysis
The principal objective of a seismic hazard analysis is to estimate the likelihood of different levels of
ground shaking intensity being experienced at a site. The analysis must account for the spatial and temporal
randomness of earthquake occurrence. The methodology for performing probabilistic seismic hazard analysis is
well established in engineering practice. In general, the following steps are required:
(1) Seismic source zones surrounding the site are identified.
(2) The seismicity of each source zone is estimated on the basis of historical and instrumental records, geologic
data, and expert opinions.
(3) Regional attenuation equations are selected which relate strong ground motion intensity to earthquake
source size and distance.
(4) The seismic sources are assumed to be independent and earthquake occurrences are modeled as Poisson
process.
In the 1970s and early 1980s, seismic source characterization was typically based on historical
seismicity data using seismic zones. In regions with geologic information about faults, this geologic information
is used to compute the activity rate. The slip-rate is converted to an earthquake activity rate by requiring the
long-term seismic moment-rate on the fault to be in equilibrium.
3.1.1 Multi-hazard analysis of urban areas in Australia
This report is based on the “contact information” of the Geoscience Australia. And we gratefully
acknowledge generous assistance from Dr. Clive D. N. Collins. Detailed information about the
Geoscience Australia is avaliable at Web Site: http://wwwga.gov.au/.

Earthquake Response Cooperation in APEC 22
Australia is a resource-rich nation in the Southern Hemisphere. Many people think that Australia is a
very comfortable place to live. But the climate, geography, geology and vegetation of Australia make the
country also suffer some disasters and emergencies from such natural hazards as severe storms, floods, droughts,
cyclones, earthquakes, landslides and bushfires. Within Australian continent there are, on average, two
earthquakes of magnitude 5 and above every year, and one of magnitude 6 or more every five years. In 1989,
for example, the earthquake in Newcastle, the costliest disaster to strike Australia, was of magnitude 5.6 and
resulted in 13 deaths and damage of around $1.27 billion, including energy infrastructure. The Australia
Government wants to and mitigate the damages caused by disasters and have some projects to analyze firstly
the multi-hazard of urban areas in Australia. Here we introduce some projects executed by Australian
Geological Survey Organization (AGSO) and Geoscience Australia, the national agency for geoscience research
and information.
The Cities Project There is a significant seismic hazard in Australia. So since 1996 there is a program,
the Cities Project, which was applied research and technique development designed to improve Geoscience
Australia’s capacity to analyze and asses the risks posed by a range of geohazards to urban communities. As
such, it represents a key component in the Geohazards Risk Mitigation Group and its overall objective to
facilitate safer, more sustainable and, consequently, more prosperous Australian communities. Now there are
many place have had their risk assessment report, including Cairns in Queensland, Mackay, Gladstone. The
multi-hazard risk assessment’s items are community vulnerability, earthquake risk, landslide risk, flood risk,
cyclone risk and risk evaluation. Take the earthquake risk assessment in Cairns as an example. The AGSO have
constructed earthquake urban hazard zonation maps and, from the building database, produced an inventory of
buildings, by construction type and usage, in the zones in these maps.
Earthquake Alert Systems Project AGSO- Geoscience Australia maintains the national seismic
network (Figure 3.1) comprising 32 telemetred stations throughout the continent and Antarctica. A further 32
dial-up stations with both accelerometers and seismometers are located within the main cities and large towns.
An additional 16 stations are planned to be installed in the next year..
Using the national network, Geoscience Australia runs an alert system which notifies emergency managers if an
earthquake of magnitude 4 or greater occurs anywhere within Australia, or if an earthquake of magnitude 6 or
greater, and with shallow focal depth, occurs on the plate margins to the east or north in case it is tsunamogenic.
The alert system automatically locates and derives magnitudes of events when sufficient data are received from
the recording network, which may take up to about 20 minutes. The primary alert is sent to Emergency
Management Australia (EMA) who then relay it to appropriate local authorities. Alerts are also provided to the
media.
Alert systems are also run by the Seismological Research Centre (SRC) in Melbourne, who monitor
dams and other infrastructure along the east coast of Australia and in Tasmania. SRC has installed local
networks for this purpose. Regional networks or single stations are also owned and/or operated by the South
Australian government, the Hydroelectric Commission of Tasmania, and some universities. Geoscience

Earthquake Response Cooperation in APEC 23
Australia exchanges data with these bodies to improve location and other information.
Figure 3.1 The Australian National Seismograph Network. The contour line shows the limit of location for
magnitude 3 earthquakes.
Geoscience Australia Geoscience Australia is the national agency for geoscience research and
information. Their research and information contributes to enhanced economic, social and environmental
benefits to the community - by providing input for decisions that impact upon resource use, management of the
environment, and the safety and well-being of Australians. Their major planned outcomes are:
enhanced global attractiveness of Australia's offshore and onshore exploration.
improved resource management and environmental protection.
safer communities and transportation.
In order to meet the outcomes, Geoscience Australia undertakes several projects. Project activities include:
monitoring earthquakes and nuclear explosions, making earthquake and landslide risk-assessments,
studying risks faced by communities, and providing technical test-ban-treaty advice to a range of clients in
government and the community.
providing information on the Earth's magnetic field for navigation, mineral exploration, geological dating,
dealing with hazards related to geomagnetic disturbances, and many other applications.
mapping the outer limits of Australia's jurisdiction under the UN Convention on the Law of the Sea,
studying the environmental impacts of hydrocarbons, researching estuarine health and participating in the

Earthquake Response Cooperation in APEC 24
international Ocean Drilling Program.
identifying new prospective basins in Australia's offshore territory and promoting them as areas
appropriate for exploration investment.
producing national geoscientific maps, databases and information systems, conducting regional and
mineral-systems studies, advising on Australia's mineral resources for land-use planning and management,
and promoting opportunities for minerals exploration.
providing fundamental spatial information which relates to national mapping, maritime boundaries, remote
sensing and geodesy.
Every project progresses Geoscience Australia towards their overall aim by contributing to one or more of the
major outcomes, via a work program that builds on their solid achievements of previous years.
3.1.2. A case study: Seismic hazard analysis in Taiwan
Seismological and Geophysical Data for Taiwan The island of Taiwan is located at a complex junction
between the Eurasian and Philippine Sea Plates. North and east of Taiwan, the Philippine Sea Plate subducts
beneath the Eurasian Plate to the north, along the Ryukyu trench; while south of the island the Eurasian Plate
underthrusts the Philippine Sea Plate to the east, along the Manila trench. Taiwan can be divided into two major
tectonic provinces, separated be a narrow, linear feature known as the Longitudinal Valley. The eastern province
comprising the Coastal Range and two islands of Green Island and Orchid Island, is a remnant Neogene island
arc that is usually interpreted as the leading edge of the Philippine Sea Plate in this area. The western province,
which comprises the remainder of the island, is composed of the Tertiary sediments that have undergone
varying degree of metamorphism and induration and are associated with the Eurasian continental shelf. The
Longitudinal Valley therefore assumes the role of a suture between the two plates.
The recorded history of earthquake activity in the Taiwan region dates back to the seventeenth century.
At that time, records describe only disastrous earthquakes. Ninety-five earthquakes were documented in the
period 1644-1895. The documents only give information of the dates of the earthquakes. In 1897, seismographs
were first installed in Taiwan by the Central Weather Bureau. Prior to 1935, the record for small earthquakes
( i.e. M≤ 5.5) is incomplete because of the very limited number of seismographs on the island. After 1935 the
importance of seismological observations received greater emphasis. A catalog of earthquakes with magnitude
greater than 4.0 was compiled from 1936 to 1979. However, the seismographic instruments used during that
period were not sensitive enough to record all the smaller earthquakes. Therefore, the record is believed to be
complete only for earthquake with magnitude greater than 5.0. After 1980 the record is complete with
magnitude greater than 4.0.
The principal objective of seismic hazard analysis is to estimate the likelihood that specified levels of
ground shaking will be experienced at a site. To perform the seismic hazard analysis the following information
is needed: distribution of seismogenic zones; source type model; magnitude recurrence model; minimum and
maximum magnitude; focal depth; rupture length-magnitude relationship; and attenuation relationship.

Earthquake Response Cooperation in APEC 25
Seismogenic Zones. Based on the geological structure, subduction model and seismicity, a detailed
tectonic framework has been developed. The area source zones were also identified.
Source Type Model. Three types of source model were used for hazard analysis in Taiwan, i.e. point
source model (for source with depth greater than 35 km), Type 1 source (well-define linear source), and Type-3
source (area source with unknown fault rupture direction).
Rupture Length-magnitude Relationship. To estimate the rupture length magnitude relationship
isoseismal contours were used. The proposed M (magnitude) and L (rupture length) relationship was proposed
as: L = exp (1.006 M – 3.232).
Minimum and Maximum Magnitude. The minimum magnitude, mo , was determined as 4.5 because there
is no reliable record for magnitude less than M=4.5. The energy release method was used to calculate the
maximum magnitude (MLu). The energy-magnitude formula used in this study is: log E = 12.66 + 1.40 ML.
Magnitude Recurrence Relations. The Gutenberg-Richter magnitude recurrence relation was used to
determine the b-value in each subzone. The Young- Coopersmith characteristic model was also used to estimate
the magnitude distribution function (discussed later).
Focal Depth. Earthquakes in the Taiwan area may originate in the shallow zone (to a depth of 35km), or
in the deep subduction zone. In the shallow zone, the focal depth can be expected to be distributed uniformly
from 5 to 35 km, whereas in the deep subduction zone, the focal depth can be expected to be distributed uniformly
through the 50 km-thick Benioff zone dipping at an angle of 45o. A type-3 source model is used for shallow
zones, while for deep zones the point source model is used.
PGA (or Sa) Attenuation Relationship. The PGA attenuation form was developed based on data (from
1993).collected from hard site conditions. The regression model for the PGA attenuation form is:
Before evaluating the final seismic hazard curves at any particular site, attention was devoted to
sensitivity analysis of the seismic hazard parameters. A hazard model based on the Poisson occurrence
assumption was applied. Both the point source model and the fault rupture model were used. Specifically, in the
shallow zones where potential for long ruptures exists, the fault rupture model was used, while for the
subduction zones, the point source model was used. The point source model was considered adequate in the
case of deep zones and involved fewer assumptions on source geometry.
Generally, seismic sources within a 200 km radius around a site were considered in the hazard
calculation. A square grid size of 0.25o was used to calculate the hazard. To consider the sensitivity of maximum
magnitude in the results, the seismic hazard curve was generated with the fault rupture model using the
proposed PGA attenuation equation for values of specified MLu and the corresponding maximum values at the
MLu + 0.3 levels with triangular probability distribution. Fig. 3.2 shows the estimated typical seismic hazard
curve. The dispersion of the PGA attenuation form was also considered in the estimation of hazard curves. In
Fig. 3.2, hazard curves that account for one standard deviation and two standard deviations of PGA dispersion
are also shown.
( )( )1 )]69810(exp 640.14[
][1.20exp029680 PAGY73481 .-M.R
M .+∗
=

Earthquake Response Cooperation in APEC 26
( )3)()()( 0
.mfmNmn YC
m⋅=
)(4 ',
111
',11
1
)'(
)(
)'(
)(
0
0
0
0
≤≤−⋅
+
≤−⋅
+=
−−
−−
−−
−−
umm
mm
mm
mm
YCm
mmmee
c
mmee
cfc
β
β
β
β
β
β
)4( )1()
2)'(
)(
0
0
ame
ec mm
mm C
∆⋅−⋅
= −−
−−
β
ββ
Implication of Fault Slip Rates and Earthquake Recurrence Model to SHA
The link between fault slip rate and earthquake recurrence rates is made through the use of seismic
moment. The total rate of seismic moment can be related to the earthquake occurrence rate as follows:
Where Mo is the
seismic moment,
Mo = µArD, (µ is
the rigidity [3 x 10¹¹ dyne/cm/cm], Ar is the rupture area on the fault plane undergoing slip during the
earthquake, and D is the average displacement over the slip surface). The density function of earthquake
occurrence can be expressed as:
Where fmYC(m) is the magnitude density function for the generalized form of the Young and Coppersmith
characteristic model. fmYC(m) can be expressed as:
where
0.0 0.2 0.4 0.6 0.8 1.0 1.2Peak Ground Acceleration, (g)
1E-5
1E-4
1E-3
1E-2
1E-1
1E+0
Annu
al P
roba
bilit
y of
Exc
eeda
nce
Correct 2 Sigma
Correct 1 Sigma
UNCorrect
Fig. 3.2 Estimated seismic hazard curves (plot of annual probability of exceedance
with respect to PGA value) at a site near Taipei basin.
( )2)()(
.
0
..
∫∞−
=um
dmmMmnMT

Earthquake Response Cooperation in APEC 27
{ }
)(5
)101(10
1
)(
21220
00
0)(
2)()'(
0
.
−⋅
+−
⋅⋅
∆⋅⋅+−⋅
=
∆−∆⋅∆−∆−−−
−−−−
ceb
bcbMe
meeSA
mN
mcmmcummm
mmmmf
u
C
ββ
ββ βµ
Substituting Eqs.(3) and (4) into Eq.(2) one can obtain the cumulative number of occurrences of magnitude
greater than m (normalized to number of events per unit time):
Eq.(4) is used as the probabilistic density function of magnitude for characteristic earthquakes. Eq.(5) indicate
the relationship between the slip rate and earthquake occurrence.
Seismic Hazard Analysis of Taiwan. A seismic hazard analysis integrates the contributions of all possible
earthquakes and calculates the probability that selected ground motion parameters will be exceeded within the
specified exposure time. Based on the proposed peak ground acceleration model and the characteristic model,
the result of seismic hazard analysis all over the Taiwan area was estimated. Eight active faults were considered
as producing characteristic earthquakes. The slip rate for each fault is indicated in Table 3.1. ∆ mc=0.3 and
∆m’=1.0 are used for each active fault. The zoning scheme, upper bound magnitude, and b-value for seismic
hazard analysis are shown in the appendix. Fig. 3.3 shows the iso-intensity map of peak ground acceleration as
well as spectral acceleration (T = 1.0 sec) at return periods of 475 year and 2500 year.
Seismic Design Base Shear. For the current development of seismic design codes in Taiwan, elastic
seismic demand is represented by the design spectral response acceleration SaD corresponding to a uniform
seismic hazard level of 10% probability of exceedance within 50 years (return period of 475 years). Based onthe uniform hazard analysis, the mapped design 5% damped spectral response acceleration at short periods ( D
SS )
and at 1 second ( DS1) are determined and prepared for each administration unit of village, town or city level.
These spectral response acceleration parameters should be modified by site coefficients to include local site
effects; the site-adjusted spectral response acceleration at short periods ( DSS ) and at 1 second ( 1DS ) is
expressed as
DvD
DSaDS SFSSFS 11; == (6)

Earthquake Response Cooperation in APEC 28
120.00 120.50 121.00 121.50 122.0021.50
22.00
22.50
23.00
23.50
24.00
24.50
25.00
25.50
0.000.050.100.150.200.250.300.350.400.450.500.550.600.650.700.75
120.00 120.50 121.00 121.50 122.0021.50
22.00
22.50
23.00
23.50
24.00
24.50
25.00
25.50
0.000.050.100.150.200.250.300.350.400.450.500.550.600.650.700.75
Return Period = 475 years
PGA- Value
Return Period = 2500 years
PGA - Value
120.00 120.50 121.00 121.50 122.0021.50
22.00
22.50
23.00
23.50
24.00
24.50
25.00
25.50
0.000.050.100.150.200.250.300.350.400.450.500.550.600.650.700.75
120.00 120.50 121.00 121.50 122.0021.50
22.00
22.50
23.00
23.50
24.00
24.50
25.00
25.50
0.000.050.100.150.200.250.300.350.400.450.500.550.600.650.700.75
Return Period = 475 years
Sa (T=1.0 sec)
Return Period = 2500 years
Sa(T=1.0 sec)
Fig. 3.3 Iso-intensity map of PGA and Sa (T=1.0 sec) for return period of 475
years and 2500 years

Earthquake Response Cooperation in APEC 29
where site coefficients Fa and Fv are as defined in Table 3.1, and are functions of site class and ground shaking
level. Based on the soil structure in the 30 meters below the ground surface, sites can be classified into three
classes using the sV -method, N -method or us -method as shown in Table 3.2 . The site class parameters
sV
and N are defined respectively as the average shear wave velocity and average standard penetration resistance
for all soil layers in the top 30 m. On the other hand, if the us -method is adopted, chN is the average standard
penetration resistance for cohesionless soil layers (PI<20) while us is the average undrained shear strength for
cohesive soil layers (PI>20) in the top 30 m.
Table 3.1 Values of site coefficients Fa and Fv
Values of Fa Values of FvSite Class DSS ≤0.5 D
SS =0.75 DSS =1.0 D
SS ≥1.25 DS1 ≤0.2 DS1 =0.3 DS1 =0.4 DS1 ≥0.5S1 (Hard Site) 1.0 1.0 1.0 1.0 1.0 1.0 1.0 1.0S2 (Normal Site) 1.2 1.1 1.0 1.0 1.5 1.4 1.3 1.2S3 (Soft Site) 1.4 1.2 1.1 1.0 1.8 1.6 1.5 1.4
Table 3.2 Site classification
sV -method 1) N -method us -methodSite Class
sV (m/s) N chN us (kPa)
Type 1 (Hard site)sV >400 N >55 chN >55 us >100
Type 2 (Normal site) 200≤ sV ≤400 15≤ N ≤55 15≤ chN ≤55 50≤ us ≤100
Type 3 (Soft site)sV <200 N <15 chN <15 us <50
Based on DSS and 1DS , the design spectral response acceleration SaD can be developed by
( ) 5.1
10
03/2
1
00
00
with;
2.0;2.0;/34.0
=
>≤<
≤+=
DS
D
D
DS
DS
aD SST
TTTSTTTS
TTTTSS (7)
where T is the structure period in the unit of one second, and the associated design response spectrum curve is
indicated in Figure 3.4. Furthermore, if structures with an effective critical damping ratio other than 5% are
considered, two parameters, BS and B1, are introduced to modify the design spectrum. The spectral response
acceleration parameters DSS and 1DS , as shown in Eq.(7), are modified to become SDS/BS and SD1/B1,
respectively, and hence, the associated design spectral response acceleration SaD can be modified from Eq. (7) as
( ) ( )[ ]
( )
5.1
1
10
03/2
11
00
00
with;
2.0;2.0;2.04.014.0
=
>≤<
≤−+=
BSBS
TTTTBS
TTTBSTTTTBS
SDS
SD
D
SDS
SDS
aD (8)
The values of damping coefficients BS and B1 are defined in Table 3.3 .

Earthquake Response Cooperation in APEC 30
SD1
T0 1.0
SaD=SD1/T2/3
0.2T0
SDS
0.4SDS
Des
ign
spec
trum
SaD T0=(SD1/ SDS)1.5
Period (sec)
Table 3.3 Damping coefficients Bs and B1
Effective Damping ξ (%) BS B1
<2 0.8 0.8
5 1.0 1.0
10 1.3 1.2
20 1.8 1.5
30 2.3 1.7
40 2.7 1.9
>50 3.0 2.0
The structure system ductility capacity R for some basic types of seismic-force-resisting system can be found in
the seismic design code, and further, the allowable ductility capacity Ra can be defined by
5.1/)1(1 −+= RRa (9)
Based on the equal displacement principle between elastic and elastic-plastic systems for long periods, and the
equal energy principle for short periods, the structure system seismic reduction factor Fu can be defined by the
allowable ductility capacity Ra and structure period T as
( )
( )
≤−
×−−+−
≤≤−
≤≤−
×−−+−
≥
=
00
0
00
000
0
0
2.0;2.0
2.011212
6.02.0;12
6.0;4.0
6.01212
;
TTT
TTRR
TTTR
TTTT
TTRRR
TTR
F
aa
a
aaa
a
u
(10)
where T0 is the corner period of the design response spectrum as defined by Eq. (7) or Eq. (8), and the linear
interpolation is adopted between long and short periods. It is noted that the reduction factor becomes 1 if the
period approaches zero for a rigid body. Finally, the seismic design base shear can be expressed as
Bridges)(for 2.1
;Buildings)(for 4.1
uy
aD
uy
aD
FIWSV
FIWS
V
α
α
=
= (11)
where I is the important factor, W is the total gravity load of the structures, αy is the first yield seismic force
amplification factor that is dependent on the structure types and design method. The constant 1.4 (for buildings)
or 1.2 (for bridges) is the over-strength factor between the ultimate and first yield forces, and it is dependent on
the redundancy of the structural system. The procedures to determine the seismic design base shear are given in
Figure 3.5 .
Fig. 3.4 Design Response Spectrum

Earthquake Response Cooperation in APEC 31
Fig. 3.5 Procedures to determine the seismic design base shear for buildings and bridges
Furthermore, a vertical component response spectrum is also introduced. It may be constructed by taking one
half (general site) or two third (near-fault site) of the spectral ordinates, at each period, obtained for the
horizontal response spectrum (Eq. (7) or (8)). For seismic hazard analysis of Taiwan the characteristic
earthquake model was used to develop the iso-intensity map within a specified time period. Eight active faults
were identified and included in the hazard analysis. Fault slip rate for each active fault is being used to constrain
earthquake recurrence relationships for site-specific PSH assessment. The result will provide important
information for the PRA re-evaluation of nuclear power plants. With the proposed spectral value at T=0.3 sec
and T=1.0 sec a design response spectrum was generated from which earthquake design can be developed. The
state-of-the-art seismic hazard analysis (SHA) in Taiwan gives values for fault-slip rate and earthquake
recurrence. The results can be included in PRA re-evaluation of nuclear power plants.
3.1.3. Earthquake Loss Estimation Methodology in Taiwan
Earthquake loss estimation methodology evaluates risk as the probability of earthquake occurrence, the
exposure of people and property to the hazard, and the consequences of that exposure. Earthquake loss
Mapped Design Spectral Response
Acceleration Parameters: DSS , DS1
uchs sNNV or , ,
⇒ Site Classification
Site Coefficients: Fa, Fv
Adjusted Design Spectral Response
Acceleration Parameters:D
vDDSaDS SFSSFS 11, ==
Design Spectral Response
Acceleration: SaD
Structure Period:
T
Structure System
Ductility Capacity: R
Structure System Seismic
Reduction Factor: Fu
First Yield Seismic Force
Amplification Factor: αy
Seismic Design Base Shear:
Buildings: uy
aD
FIWS
Vα4.1
= ; Bridges: uy
aD
FIWS
Vα2.1
=
Structure Type
And Design Method
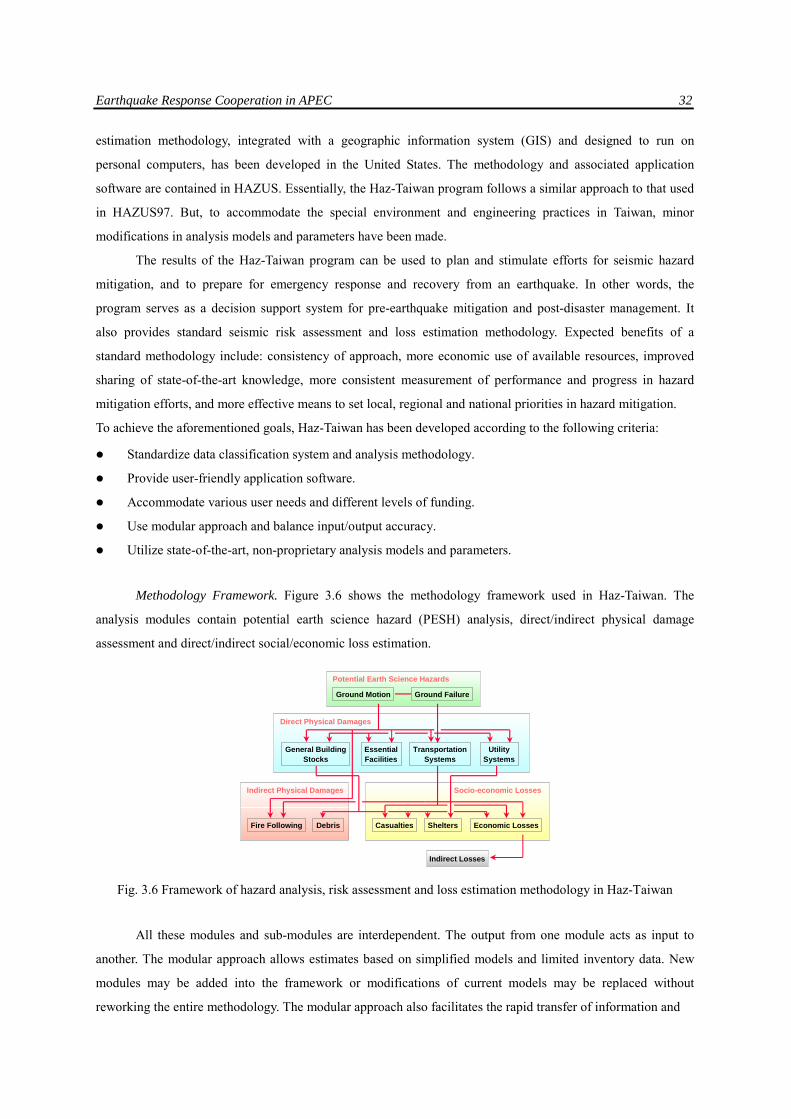
Earthquake Response Cooperation in APEC 32
estimation methodology, integrated with a geographic information system (GIS) and designed to run on
personal computers, has been developed in the United States. The methodology and associated application
software are contained in HAZUS. Essentially, the Haz-Taiwan program follows a similar approach to that used
in HAZUS97. But, to accommodate the special environment and engineering practices in Taiwan, minor
modifications in analysis models and parameters have been made.
The results of the Haz-Taiwan program can be used to plan and stimulate efforts for seismic hazard
mitigation, and to prepare for emergency response and recovery from an earthquake. In other words, the
program serves as a decision support system for pre-earthquake mitigation and post-disaster management. It
also provides standard seismic risk assessment and loss estimation methodology. Expected benefits of a
standard methodology include: consistency of approach, more economic use of available resources, improved
sharing of state-of-the-art knowledge, more consistent measurement of performance and progress in hazard
mitigation efforts, and more effective means to set local, regional and national priorities in hazard mitigation.
To achieve the aforementioned goals, Haz-Taiwan has been developed according to the following criteria:
Standardize data classification system and analysis methodology.
Provide user-friendly application software.
Accommodate various user needs and different levels of funding.
Use modular approach and balance input/output accuracy.
Utilize state-of-the-art, non-proprietary analysis models and parameters.
Methodology Framework. Figure 3.6 shows the methodology framework used in Haz-Taiwan. The
analysis modules contain potential earth science hazard (PESH) analysis, direct/indirect physical damage
assessment and direct/indirect social/economic loss estimation.
Ground Motion Ground Failure
Direct Physical Damages
EssentialFacilities
DebrisFire Following Economic LossesShelters
Indirect Losses
Potential Earth Science Hazards
Socio-economic Losses
TransportationSystems
General BuildingStocks
Casualties
Indirect Physical Damages
UtilitySystems
Fig. 3.6 Framework of hazard analysis, risk assessment and loss estimation methodology in Haz-Taiwan
All these modules and sub-modules are interdependent. The output from one module acts as input to
another. The modular approach allows estimates based on simplified models and limited inventory data. New
modules may be added into the framework or modifications of current models may be replaced without
reworking the entire methodology. The modular approach also facilitates the rapid transfer of information and

Earthquake Response Cooperation in APEC 33
technology between academic/research communities and end users. Specific regional analysis models and data
can be incorporated into the framework. Another advantage of a modular approach is that it enables users to
limit studies to certain selected losses, which may be desirable because of budget and inventory constraints. In
general, each module requires a comprehensive loss estimation study. However, the degree of sophistication
required and associated costs varies greatly by user and application. The modular approach has the capability to
extend the methodology to estimate losses due to other natural hazards or multiple hazards. Although additional
inventory databases and damage functions may be required, many inventory databases compiled for earthquake
loss estimation, such as general building stocks, essential facilities and lifelines, are also necessary for risk
assessment and loss estimation for other natural hazards.
Potential Earth Science Hazard (PESH) Analysis. The PESH module in Haz-Taiwan includes both
ground motion and ground failure estimation. Based on a scenario earthquake and the local geological
conditions, ground motion demands are calculated in terms of response spectra and peak values of ground
motion (such as PGA and PGV). For ground failure estimation due to soil liquefaction and landslide, the
permanent ground deformation (PGD) and associated probability of occurrence are estimated. Other related
earth science hazards, such as tsunami and inundation, are not considered in the current Haz-Taiwan framework.
The use of integrated GIS software allows Haz-Taiwan users to define graphically the scenario event, and to
quantify the site-specific ground shaking and ground failure hazards, which serve as the basis for evaluating
damages and losses of buildings and lifeline inventories.
Estimation of ground shaking intensities follows the three steps described below.
Select a scenario earthquake: The methodology provides three approaches for characterizing a scenario
earthquake, i.e., deterministic, probabilistic, or user-supplied seismic ground shaking maps. A deterministic
event is created using historical earthquake events and/or existing seismic sources, or any hypothetical event
defined by the user. In the probabilistic approach, contour maps of spectral response PGA and PGV for
different return periods are used to generate annualized estimates of damage and loss. Users can also replicate a
scenario event by supplying a digitized map representing ground shaking intensity that occurred in an
earthquake.
Determine input ground motion levels for baseline site-soil conditions using attenuation relationships:. A site-
specific response spectrum consists of four parts: PGA, a region of constant spectral acceleration 3.0SA =T , a
region of constant spectral velocity )2/(SA 0.1 π=⋅ TT , and a region of constant spectral displacement. Different
attenuation relationships are supplied for PGA and spectral response 3.0SA =T and 0.1SA =T .
Overlay high-resolution geologic information and modify ground motion demands using site amplification
factors based on local site conditions.

Earthquake Response Cooperation in APEC 34
SeismicSource
Attenuation
Local Site-SoilConditions
Chun-li
Site-SpecificResponse Spectrum
AS
VS
5.0=T
0.1=T
0.2=T
Amplification
Fig. 3.7 Calculation of ground shaking estimates in deterministic approach
Calculation of ground motion estimates in deterministic approach is demonstrated in Fig. 3.7. Revised
versions of attenuation laws of PGA and response spectral values for the Taiwan area have been developed. As
an example, Jean and Loh (2000) used strong motion records of fifteen seismic events to study the attenuation
laws of PGA, )3.0( =TSA and )0.1( =TS A , respectively. The data collected from the Chi-Chi earthquake in
1999 is also included in the regression analysis. The following Campbell form is used.
352 ][),( 41cMcMc ecRecRMfy −+== ,
where y is the peak ground acceleration or spectral acceleration (in g), M the local magnitude, and R the
hypocentral distance. The coefficients 1c , 2c , 3c , 4c and 5c are determined by least square error and are
listed in Table 3.4 .
Table 3.4 Coefficients of attenuation laws by Jean, et. al. (2000)
Ground Motion Parameters1c 2c 3c 4c 5c
PGA (g) 0.02653 1.19917 1.73443 0.14664 0.69659
)3.0( =TSA 0.05877 1.19074 1.73567 0.16578 0.68859
)0.1( =TSA 0.00095 1.42288 1.38711 0.17125 0.55194
The data from the Chi-Chi earthquake shows that the peak ground accelerations are significantly lower
in the footwall side of Chelungpu fault than those in the hanging-wall side, as shown in Fig. 3.8. The scatter of
data is larger for the near field. All these features should be taken into consideration in seismic design codes as
well as the seismic scenario simulations. Most studies on strong ground motion in Taiwan are based on data
collected by the Taiwan Strong Motion Instrumentation Program (TSMIP), which has been operated by the
Central Weather Bureau of Taiwan since 1990. So far, it has installed about 650 free-field strong-motion
stations and 40 sets of strong motion arrays in structures. In addition, an integrated seismic early warning

Earthquake Response Cooperation in APEC 35
system in Taiwan has also been developed to provide real-time information of seismic activities around Taiwan.
The distribution of the 650 strong-motion stations and 75 rapid information stations is shown in Fig. 3.9 . The
performance of the Taiwan Rapid Earthquake Information Release System. (TREIRS) was been tested in the
1999 Chi-Chi earthquake.
1E-1 1E+0 1E+1 1E+2Surface Ruptural Distance, (km)
2
3
4
5
6789
2
3
4
5
6789
2
10
100
1000
Peak
Gro
und
Acce
lera
tion,
(gal
)
Comparison for Chi-Chi Earthquake Data
ML=7.3, Mean+1S
ML=7.3, Mean
ML=7.3, Mean-1S
Hanging Wall, EW
Hanging Wall, NS
Foot Wall, EW
Foot Wall, NS
Fig. 3.8 Comparison of peak ground accelerations in the Chi-Chi earthquake on footwall and hanging-wall side
of Chelungpu fault Suppose that a site-dependent PGA modification factor, defined as the ratio of measured PGA to the
predicted PGA by attenuation laws, has been calculated for each strong-motion station. The contour map of
PGA modification factors is shown in Fig. 3.10. Then, combining the attenuation laws and the site-dependent
modification factors of PGA and the measured accelerations at TREIRS stations, it is possible to predict the
distribution of PGA in very short time after the occurrence of earthquakes. The simulated results and the
measured quantities in the Chi-Chi earthquake are shown in Fig. 3.11 and 3.12, respectively. As shown in the
figures, the semi-empirical method provides a very effective way of predicting PGA soon after the occurrence
of earthquakes, and thus can be provided as a reference in emergency response actions.

Earthquake Response Cooperation in APEC 36
120 121 122Longitude (E)
22
23
24
25
Latit
ude
(N)
75 TREIRS Stations650 Free-Field Stations
Fig. 3.9 Distribution of stations of strong-motion network and TREIRS
120 121 122Longitude (E)
22
23
24
25
Latit
ude
(N)
0.2
0.5
0.8
1.25
2
4
PGA Site Amplification Factor
Fig. 3.10 Contour map of PGA modification factors in Taiwan area

Earthquake Response Cooperation in APEC 37
120 121 122Longitude
22
23
24
25
Latit
ude
0
8
25
80
250
400
1200
Chi-Chi MainShockPGA Calculated
C
gal
Fig. 3.11 Contour map of simulated PGA in Chi-Chi earthquake
120 121 122Longitude
22
23
24
25
Latit
ude
0
8
25
80
250
400
1200
Chi-Chi MainShockPGA Observed
D
gal
Fig. 3.12 Contour map of measured PGA by TSMIP in Chi-Chi earthquake
Ground Failure Probability. Ground failures due to liquefaction, landslides and surface fault ruptures are

Earthquake Response Cooperation in APEC 38
quantified and the damage to buildings and lifelines is adjusted to account for the effects of ground failures.
Each type of ground failure is quantified in terms of median permanent ground deformation (PGD) and
probability of occurrence. Using the GIS, susceptibility maps of soil liquefaction and landslide and ground
motion contour maps are overlaid to determine the associated ground failure estimates. The expected PGD for
surface fault rupture is computed in case of deterministic scenarios, but not for probabilistic or user-supplied
scenario events. In order to estimate the susceptibility categories of soil liquefaction in various regions, data has
been collected from 8715 bore holes by many participants over the last four years. The distribution of these
boreholes is shown in Fig. 3.13. The borehole data was collected from geotechnical drilling reports, and saved
in a unified digital format to facilitate data processing and analysis. Basic borehole information (coordinates,
elevations, water table depths and participants), physical descriptions (SPT-N values, soil classification, grain
size distribution, etc.) and mechanic descriptions (unconfined strength, triaxial strength, consolidation index,
wave velocities, elastic modulus and consonant frequency) are all included in the database.
Three simplified liquefaction evaluation methods are employed in the analysis. Safety factors at each
depth for the three liquefaction evaluation methods are also evaluated. The final results include liquefaction
potential index and minimum safety factor for each borehole. According to the evaluation results, all the
borehole spots were painted in green, yellow and red colors to indicate high, medium and low liquefaction
potential, respectively, as shown in Fig. 3.14.
Liquefaction potential maps for metropolitan areas are very useful in hazard mitigation as well as in
emergency response. Schools, hospitals and other emergency response facilities should avoid areas with high
liquefaction potential. On the other hand, if these essential facilities are already in areas with high liquefaction
potential, they should be examined and retrofitted.
40
Kilometers
800
∗finished area
under collecting area
) borehole

Earthquake Response Cooperation in APEC 39
Fig. 3.13 Distribution of the collected bore holes in Taiwan
) )))) ))
) )) )))))))))))))))
)))
))
) ) )
)))))
)))))) )))))))
)))
)))
))))
)) )))
))))))
)))))))))))))))))
)))))) ))) )))) )))))))))))))))))
) ))) )))) ))))) )) )) ))))))
))))) )) )))))))))))
))
))
)
) ))
)
) )
) )
)
)) ) ) )) ) )) )))))) ))
))
)
)
)))
)) )))
)))))
) )) )) ))) )))) )))))))
) )
)
)))) ))) )) )
) ))))) )))
))
))) ))) )))) ))
)
))) )))))
)) ))))))
))))))) )) ))
))) ))))) )) ))))))
) )))))) )
)
))) ))) ) ))) )) ) )) )))))) ))) ) )) )) ) )) )))
)))))))))))))))))
)
)))
))))
)) )))
)))) ))))) )) ))) ) )))) ))) ) ) ))) )) )
))))) ) ) )) ) )) ))))) )) ))) ) )) )))
))
))))) ) )) ) ))
)))))
))
)
)
)
)))
)))) )
)
)
)
)))
)
) ) )) ) )
)))) )
) )))
)) ))
))
)) )
)))))))
))
)))
))
))
))))
)) )))
))
))
) ))))) ))))))) )))) ) ))) ))
) )) )))) )))
)))))) ))))
)) )
))
)))) )) )) )))))))) )) )
))) ) ))
) ))) )))
)
)
)) )
)
)
))
)
)
))
)
))
)) )
)
)))
) )))) ) ) )
) ) ))))
)
) ))))) ) ) )))) )
) )
)) )
) ) )
) )))) ) ))))) ) )))) ) ) ))) ) )) )))) ) )) ) )
)))
)) ) ) ))) ))) ) )))))) ) ))))))) )
))))))))))))))))
) )))))))))))))))))
))))
)))
)) ))
)))
)))))
))))))))))
)))))))))))))
))))))
)))))))))))))))
))))
))))
))))
)
))
)
)))))
))
)
) ) ))))) ) )
))
))))))))))) ))) )
))
)) )
) )))
)))))
))
)
)
)) )
))
)
)
))
) )
)
) ) ))))
)
)
)))
))))
))
)
)
)))
))))
)
)
) ))
)
))
)))
) )
)))
))
)
) )
)
)
)
) )
) ) )) )
)
))
)
)
)
))
))
)) ))) ) ) )) )) ) ))
)
)
))) ) )))))) ) ))
)
4
Kilometers
0 2
信義區大安區
南港區萬華區
中正區
松山區
內湖區
大同區中山區
蘆洲鄉
新莊市
文山區
永和市板橋市
中和市
士林區
北投區
土城鄉
五股鄉
三重市
泰山鄉
樹林鎮
∗
灰色為平原區
● PL > 15 ( high risk )
● 5 < PL ≦ 15 ( medium risk )
● PL ≦ 5 ( low risk )
Fig. 3.14 Liquefaction potential map of Taipei basin
Seismic Risk Analysis of Civil Infrastructure. The modules for direct physical damage assessment
provide damage estimates for four distinct groups: general building stock, essential facilities, transportation and
utility systems. To facilitate damage assessment, the groups are classified into several general and specific types
according to their analysis models and seismic resistance characteristics. Differentiating by structural type and
analytical models, the inventory data are roughly divided into buildings, roads/tracks, bridges, tunnels, drift-
sensitive/acceleration-sensitive facilities, and pipelines. These are the major types and have different analysis
models and evaluation procedures in damage assessment. The estimates are presented in terms of probabilities
with a specific damage state, given a specified intensity of ground motion and a specified level of ground failure.
For essential facilities and lifelines, damage estimates also include loss of function, restoration time, and the

Earthquake Response Cooperation in APEC 40
anticipated service outages for potable water and electric power.
General Building Stocks. Since the number of buildings in a large study region may be huge and
structural type, height, construction year, design quality, etc., are different for each building, it is not practical to
evaluate the seismic resistance capacity and associated damage probability for each individual building under
the specified scenario event. To overcome difficulties in collecting the huge amount of data, buildings are
divided into 37 specific types in the Haz-Taiwan program. Each specific building type is defined according to
its material, lateral load-resistance system, fundamental period, and other seismic resistance characteristics.
According to seismic design levels, each specific building type is further divided into high-code, moderate-code,
low-code and pre-code. There are likely to be statistics for total floor area in each specific occupancy class. The
total floor area in each specific building type can be estimated through the usage of a reasonable mapping
scheme for each chun-li, which is the smallest geographic unit in the loss estimation methodology in Haz-
Taiwan. The mapping schemes of specific occupancy classes to model building types may be established by
survey or expert judgment.
Both inelastic building capacity and site-specific response spectra are used to determine the expected
building responses to the scenario earthquake. The predicted building responses, in terms of the spectral
displacement and the spectral acceleration, are used to determine damage state probabilities of the structural and
nonstructural components of the model building type. The damage state probabilities are further modified to
account for site-specific probable PGD, estimated using the ground failure model. Because losses from damage
to structural and nonstructural building components are different, Haz-Taiwan separately estimates structural
and nonstructural damage. Damage to nonstructural components is considered to be independent of building
type. Descriptions of damage states are developed for common nonstructural systems rather than for building
types. Developing fragility curves for each possible nonstructural component is not practical. Therefore,
nonstructural components are also grouped into drift-sensitive and acceleration-sensitive components.
In summary, building damage assessment follows a five-step process, as shown schematically in Fig. 3.15
Based on structural characteristics and local design codes, the incremental pushover curve, representing
nonlinear capacity of a building, is computed.
The site-specific elastic response spectra (ADRS curve), generated by the PESH module, are modified to
account for the effects of both increased damping at higher response levels and system degradation during
long duration ground shaking.
The modified site-specific response spectra are overlaid on the capacity curve of a building to determine
the performance point. The intersection point defines the expected building response in terms of spectral
displacement and spectral acceleration.
For the expected building response, structural and nonstructural fragility curves are evaluated to
determine damage state probabilities.
The damage state probabilities are modified to account for site-specific probable ground failure. Based on
the level of damage, loss-of-function estimates, expressed as a percentage of full capacity, and restoration-

Earthquake Response Cooperation in APEC 41
time estimate - the time needed to recover to full capacity - are computed.
AS
DS
DS DS AS
StructuralDrift-SensitiveNon-structural
Accel.-SensitiveNon-structural
N S M E C N S M E C N S M E C
P[D
S ≥
d s|S
D o
r SA]
P[D
S =
d s|S
D o
r SA]
Model building Type:Capacity CurveFragility Curve
PESH Spectral ResponseReduced for Damping/Duration Effects
Damage States: N-None, S-Slight, M-Moderate, E-Extensive, C-Complete
Fig. 3.15 Flowchart of damage assessment of general building stocks
The capacity spectra of some model building types have been studied by both simplified code procedure
and nonlinear static pushover analysis. Fig. 3.16 shows the analysis results for a 12-story steel building. It is
noted that the strength estimated by the code procedure is too conservative and the over-strength factors for
yield/design and ultimate/yield strength have larger values in pushover analyses. To make the results consistent
in these two approaches, the ultimate strength should be raised 30% for the 12-story steel prototype building
and even more for other low-rise buildings.
0.0 0.2 0.4 0.6 0.8 1.0Spectral Displacement, Sd(m)
0.0
0.1
0.2
0.3
Spec
tral A
ccel
erat
ion,
Sa
(g) 12FL(X)
12FL(Y)Td=1.982 Sec.
Td=1.855 Sec.
X: Push-Over Test
Y: Push-Over Test
X: Simplified Procedure
Y: Simplified Procedure
Fig. 3.16 Comparison of capacity spectra obtained by different methods
for 12-story steel moment resistant frames
Transportation Systems. Transportation systems include highway systems, railway systems, bus systems,
ports, ferries and airports. Most of the transportation system components, such as bridges, tunnels, buildings
and facilities, are vulnerable to both ground shaking and ground failure, while highway roads, railway tracks
and airport runways are significantly affected by ground failure alone. Damage state probabilities of

Earthquake Response Cooperation in APEC 42
transportation system components are estimated with appropriate fragility curves, evaluated at site-specific
ground shaking intensity and/or ground failure levels. The amount of damage and the restoration time are
evaluated for each of the system components.
Fragility curves of sub-components (e.g. columns, abutments, connections, decks and approaches in a
highway bridge) are combined using fault tree logic to develop an overall fragility curve for the system
component. Loh and Huang (2000) have studied the damage assessment of highway bridges subjected to
earthquake excitation. Both nonlinear dynamic analysis of prototype bridges and statistical analysis of historical
damage data may be used to obtain fragility curves of prototype bridges. Evaluation of the impact to the whole
transportation system when certain components fail requires an understanding of the interactions between
components and the potential for alternatives. Although the interdependence of components on overall system
functionality is not addressed in the current methodology, network system analysis can be performed separately.
Given knowledge and performance of individual system components, an estimation of impact on highway
transportation system was developed in Loh and Yeh, 2000. The results can be applied in setting the priority of
retrofit after the occurrence of earthquakes and in selecting the most important route to strengthen first.
Utility Systems. Utility systems are roughly divided into six categories: potable water, wastewater,
natural gas, oil, communication and electricity. The damage assessment of utility system components, such as
buildings and facilities, is similar to that of transportation system components. However, the extent and severity
of damage for buried pipelines is indicated by the repair rates due to leaks or breaks. Both peak ground velocity
(PGV) and permanent ground displacement (PGD) are used to assess the repair rate of buried pipelines during
earthquakes. In order to verify the default repair rates used in Haz-Taiwan, Shih and Chen (2000) selected four
cities along the Chelungpu fault - two for water pipelines (Tantz and Douliou) and two for natural gas pipelines
(Dali and Nantou) - to study the repair rates of buried pipelines subjected to the Chi-Chi earthquake. In order to
study the damage patterns of these pipelines caused by the Chi-Chi earthquake, a GIS database has been
established. Repair statistics were obtained from the Taiwan Water Supply Corporation (TWSC) and the five
major natural gas companies serving the disaster area. Damage ratios or repair rates were calculated by dividing
the number of damage locations by the total length of pipelines in the study areas. In the absence of a water
pipeline database, the street length multiplied by 0.75 is used as an approximation.
Comparing the repair rates of pipelines and PGV in the Chi-Chi earthquake, the derived empirical
formula for water pipelines is given by837.00299.0 PGVRR ×= .
The derived formula for gas pipeline is given by377.1144 −×= PGVRR .
Fig. 3.17 shows the procedures for performing seismic network analysis of the transportation and utility systems.
Starting from the estimation of spatial distribution of ground motion intensity, the probability of ground failure,
the damage state probability of each facility and the damage ratio of a pipeline segment can be obtained. Using
topological transformation, each transportation and utility system can be viewed as a SSP network. System
reliability analysis is then conducted on the transformed network and the critical links and paths are identified.

Earthquake Response Cooperation in APEC 43
The results are valuable data for hazard mitigation and emergency response management.
GIS-based Decision Support System. With experience and research, the integrated application of
geographical information systems (GIS), remote sensing (RS) technology and global positioning systems (GPS)
may significantly improve the effectiveness of disaster management and the accuracy of data collection.
Through application of integrated 3S technology, it can rapidly provide information on disaster spatial
distribution and degree of damage. It can also estimate quickly direct or indirect losses by using a pre-
established knowledge base, and information inference technology. The application software of Haz-Taiwan is
GIS-based and runs on personal computers. All of the inventory database, geological database, historical
seismic activities, and socioeconomic statistics are stored in digital format, so that the information can be
readily searched, queried and calculated. The spatial locations of the related objects are stored in the
geographical information system, so the user can easily identify the location and distribution of objects and
visually interpret and compare the simulated results. For example, the total floor area of specific building type,
the distribution of schools, hospitals and fire stations, and the pattern of disaster distribution can be displayed on
screen in a few mouse clicks.
Transportation and Utility Network Analysis
Spatial Distributionof Ground Motion
Method for EstimatingGround Acceleration
Phase Spectrum
Site Condition
Scenario Earthquake
Attenuation
Soil condition
Source model
Fragility for EachFacility and Pipeline
System Reliability ofNetwork
Identification of CriticalLink and Critical Path
System Managementand
Emergency Response
Liquefaction and RelatedGround Failure
Topological Transformation(Develop SSP Network)
Buried pipeline(Aoki Spectrum)
Bridge structure
Fig. 3.17 Flowchart on transportation and utility network analysis
3.1.4. Earthquake Risk Assessment Methods in New Zealand
To handle risk assessment it is possible to integrate observed seismicity and fault data into a
probabilistic seismic hazard assessment (PSHA) model. These models combine distributed seismicity (i.e. that
not associated with known faults) with fault information. Estimates of the recurrence intervals and magnitude of
earthquakes on the faults are derived from geological records. The type of faulting may vary, producing
different types of earthquakes. Typically, data on any one fault will be sparse and comparisons with regional or
global data are required. To assess the ground shaking produced by an event far away at a particular site one has
to take account of the seismic energy attenuation over the path from source to site. If seismicity data are
plentiful in an area, regions of different attenuation may be defined. Alternatively curves of attenuation versus
Earthquake Response Cooperation in APEC 44
distance for different types of geology can be used.
To account for uncertainty in source, path and site effects, logic tree analysis is used to define the
probabilities of rupture of different faults and of the magnitude of events on them. Frequency and magnitude
distributions are associated with zones of distributed seismicity. Probabilities and uncertainties are assigned to
different attenuation functions. Monte Carlo simulation then allows one to run thousands of models to derive
probabilities for chosen return periods. The models can provide a full description of likely ground shaking at all
the frequencies required for engineering design.
Fig 3.17 illustrates, for a return period of 475 years (or 10% in 50 years), the distribution of ground
shaking probability, expressed in Modified Mercalli (MM) intensities, based on the standard New Zealand
probabilistic hazard model (Stirling et al 2000). . This map illustrates that all the Alpine fault area of the South
Island has a much higher hazard than would have been inferred if just the historical seismicity was used.
Fig. 3.18 Modified Mercalli (MM) ground shaking intensity from the NZ probabilistic seismic hazard model
Risks at individual sites can be examined from the PSHA model. Fig 3.19 illustrates the ground shaking
at different frequencies for a range of locations in New Zealand. Otira, which is close to the Alpine Fault, is on
the major highway and coal railway connecting the eastern and eastern sides of the South Island. The high risk
in Wellington has already been noted. Auckland, Christchurch and Dunedin are important urban centres, with
Auckland the largest in New Zealand. A PSHA model takes into account all known faults and distributed
seismicity. However it is possible at any site to deaggregate the sources of ground shaking.
Earth deformation measurements, most commonly done now by GPS repeat measurements provide an
10 9 8 7 6 5 4
MM Intensity withMean Return Periodof 475 years
40�
35訕
45訕
170蚩 175�
DUNEDIN
CHRISTCHURCH
WELLINGTON
ROTORUA
AUCKLAND

Earthquake Response Cooperation in APEC 45
important additional tool for risk studies. Fig 3.20 shows the direction and amount of movement of a series of
points in the South Island. This is based on repeat GPS measurements over the 1994 to 1998 interval. The
movements reflect the plate movement, with the region west of the Alpine fault (Australian Plate) moving
north-eastward at up to 50mm/year relative to the eastern, Pacific plate, side. From the velocity vectors, the
strain can be calculated through the region. Much of the deformation has not been released in the form of
earthquake rupture over the period. This may provide an indication of what areas might rupture in the future.
GPS provides deformation data over periods of a few years or even shorter. It therefore complements the
seismicity observed over periods of decades and the geological record over periods of thousands of years. The
integration of deformation measurements into PSHA models is not yet standard practice but is under
considerable study.
It is not always necessary to do detailed probabilistic risk analysis, particularly for distributed elements
of the supply chain such as transmission towers. The key risks are site effects and these can be often well
assessed by studying the local geology. In rugged terrain such as is common in New Zealand, particular risks for
transmission towers are either failure of the ground under the tower or the impact of landslides. Landsliding is
common in earthquakes. An added complication is that the impact will be greater if the ground is saturated in
wet seasons. Tsunamis can be a particularly severe hazard for facilities adjacent to the coastline. Risk analysis
for a
tsunami requires consideration of the earthquake source distribution and detailed consideration of the under
water topography of the area. Focussing in bays or harbours may significantly increase the impact relative to
an open coastline.
Many Pacific Rim countries are exposed to earthquake risk. Where there is also deep earthquake plate
subduction there are also likely to be volcanoes. Energy supply facilities in areas where there are both volcanoes
and earthquakes justify volcanic risk assessment done with the same rigour as earthquake risk assessment.
Volcanic risk assessment currently does not have the same probabalistic rigour as earthquake risk assessment
but many of the principles are the same.

Earthquake Response Cooperation in APEC 46
Fig. 3.19 Ground accelerations versus frequency for several locations in New Zealand
Fig. 3.20 Velocities from 1994, 95, 96 and 98 data. Reference frame is the Pacific fixed
3.2. Earthquake Risk Assessment in Lifeline
Lifelines are those essential services that support the life of communities. These are either utility
services such as water, wastewater, power, gas and telecommunications, or transportation networks involving
roads, rail, ports and airports.
Significant developments have occurred in the field of lifelines engineering over the past decade both in
New Zealand and internationally. In New Zealand, this period encompassed both the beginnings of lifelines
activity and its development into being an established discipline of earthquake engineering. The twin overall
objectives of Lifelines Engineering are to reduce damage levels following a major disaster event and to reduce
the time taken by these lifelines services to restore their usual level of service. This saving in time translates
directly into a saving for the community as a result of reduced disruption to homes, offices and industries.
The Natural Hazard Environment in New Zealand. New Zealand is a remote island nation with mountain
ranges, river valleys prone to flooding and landslides, and flat alluvial coastal plains. New Zealand sits astride
the boundaries of the Pacific and Australian Plates, and also has an active volcanic region. The seismic hazard
in the central part of New Zealand is high, and comparable to California. A recently completed study by Stirling
et al indicates that peak ground accelerations of greater than 0.8g corresponding to 10% probability of
occurrence in 50 years are expected along the Alpine Fault that runs along much of the South Island.
Since European colonization in the mid-1800s, there have been relatively few damaging earthquakes
and volcanic eruptions. The devastating Hawke’s Bay earthquake of 1931 caused the death of 256 people, and
represents the last earthquake to have affected a major metropolitan area in New Zealand. There were only four
-43�
-44�
169� 170� 171�
A L P I NE
F AU
L T

Earthquake Response Cooperation in APEC 47
earthquakes of magnitude Mw greater than 7 in the past 60 years, and none of these affected a significant urban
area. But although only 9 lives have been lost in earthquakes in NZ in the past 70 years, New Zealand
communities are generally well aware of the threat posed by earthquakes. This has led to a reasonable level of
preparedness by individuals in higher seismicity areas. The overall level of preparedness is however highly
variable, with many key organizations and businesses thought to have inadequate response plans in place.
Risk Management The process of risk management has matured significantly in New Zealand over the
past decade. During this period, Australia and New Zealand became the first countries in the world to formally
develop and adopt a general standard on risk management. The earlier focus on risk assessment has broadened
to encompass a six-step iterative and ongoing process. This process has been encapsulated in the national
standard AS/ NZS 4360:1999 Risk Management, which was first released in 1995, and is being applied as a
management framework in a wide variety of situations ranging from individual projects through to the
governance of large organizations. The Australian and New Zealand Risk Management Standard provides a
formalistic, systematic decision-making process with which to identify solutions to issues as diverse as a
nation’s vulnerability to natural hazards on the one hand, to an understanding of the competitive environment of
a small business on the other hand. The Standard defines the process of risk management as ‘the systematic
application of management policies, procedures and practices to the tasks of establishing the context,
identifying, analyzing, evaluating, treating, monitoring and communicating risk’.
The Lifelines Engineering Process. Lifelines engineering in New Zealand began as a separate discipline
with the undertaking in 1989 of the Lifelines in Earthquakes: Wellington Case Study. This project was initiated,
produced and largely funded by the Center for Advanced Engineering, and was completed in 1991. This project
has provided the impetus and a point of reference for all subsequent lifelines work in New Zealand. One of the
initial drivers was the growing realization that while considerable effort had been put into understanding the
seismic response of buildings, relatively little was known about the likely performance of utility services.
Similarly, in the case of transportation networks, while the individual structural response of major elements
such as bridges had been extensively studied, the post-disaster performance of the networks as a whole had not
been considered in anywhere near the same detail. There are currently 15 Lifelines Projects either planned or
underway across New Zealand. This essentially correlates to one Project for each of the country’s regions or
provinces.
NZ Approach. The New Zealand Lifelines process is based around the following risk management steps:
• Identifying the hazards that could affect each lifelines network.
• Compiling common inventories of the various utility and transportation networks.
• Assessing the vulnerability of the lifeline network to those hazards (the potential damage to andconsequences for each network).
• Identifying and implementing practical mitigation measures.
• Facilitating the preparation of comprehensive emergency response plans.

Earthquake Response Cooperation in APEC 48
With respect to hazards, the focus of lifelines work in New Zealand is on regional scale events that are
beyond the ability of individual organizations to respond to and control. The responsibility for taking
appropriate mitigation and preparedness steps however remains with the individual organizations. Assessment
of vulnerability takes account of the importance of the lifeline component - that is, the degree of disruption if
the element is lost to the network. This aspect typically highlights the redundancy (or lack of) in a system. The
process of assessing vulnerability involves the overlaying of hazard maps and utility network maps so the
vulnerability of each node and link can be established. This very simple step remains one of the cornerstones of
the overall lifelines engineering process. This aspect can now be done more directly with the use of
Geographical Information Systems (GIS) mapping software. The assessment of potential damage takes into
account of the impact of an earthquake - that is, the time and effort which is likely to be required to reinstate the
component in addition to the cost. The mitigation and preparedness (outcome) aspect of lifelines engineering is
embodied in the fourth and fifth bullet points above. A prime example of a practical mitigation measure is the
installation of automatic shut-off valves at water supply reservoirs, to stop the loss of vital water through broken
mains. This is not simply an engineering exercise, as it requires prior consideration of the post-earthquake
response of the fire service, and consultation with them.
The planning of emergency response essentially involves establishing frameworks for organized and
immediate responses to such situations. Response Planning acknowledges that full physical mitigation is
unattainable for most lifelines, and represents the vital first step in ensuring a rapid restoration of service. A
response plan defines the physical sequences to be followed in the event of a regional scale emergency, and
defines the roles, responsibilities and authorities of key personnel involved. The five key Lifelines steps
typically take from 3 to 6 years to work through, and result in a major report. A prime example of such a report
is Risks and Realities: A Multi-disciplinary Approach to the Vulnerability of Lifelines to Natural Hazards,
produced by the Christchurch Engineering Lifelines Group in 1998. The Lifelines process is however an
ongoing one, reflecting the iterative nature of risk management generally. Communication of the findings,
outcomes and recommended mitigation and response preparedness measures to stakeholder groups and the
wider community follows the completion of the initial report. This is a progressive and continuous process,
often leading to a review of asset management plans. The Lifelines Project team also typically conducts an
annual review of mitigation and preparedness progress and achievements across all organizations involved. This
important step maintains the momentum and information exchange achieved by the earlier work.
International Liaison. There has been a strong international input into the New Zealand Lifelines work
to date. United States experts in lifeline earthquake engineering (Don Ballantyne, Dennis Ostrom, Ian Buckle,
Tom O’Rourke and Ron Eguchi) provided peer review input into the initial projects covering the Wellington
and Christchurch metropolitan areas. This involvement has created a continuing conduit for the exchange of
information on lifelines work between New Zealand and the United States. In 1998, Ron Eguchi was engaged to
carry out a review of the methodologies developed in New Zealand. He found that the multi-hazard and multi-

Earthquake Response Cooperation in APEC 49
disciplinary basis of the New Zealand methodology represents a comprehensive and internationally unique
approach, and observed that AS / NZ 4360:1999 is very suitable for use as a foundation for lifelines work.
Major earthquakes in Northridge, California (1994) and Kobe, Japan (1995) have also consolidated the
momentum of lifelines work in New Zealand. These events generated a number of technical findings and
response lessons for those involved with the management of lifelines systems. NZ Lifelines Study teams visited
each of these areas approximately six months after the respective events and held detailed discussions with their
counterparts. These events also generated a high level of interest amongst the general public, and highlighted
the lack of regional scale emergencies that New Zealand has experienced. The key lessons learnt from these
events were:
• The importance of re-establishing transportation links as quickly as possible;
• The need to have an integrated response plan at national, regional and local levels;
• The indication of the time taken to restore the various utility services in each of these events.
Reports produced by the Wellington Earthquake Lifelines Group summarized these and other lessons.
The devastating Chi-Chi, Taiwan earthquake of 1999 once again highlighted the vulnerability of utility lifelines
to permanent ground deformation (fault rupture, liquefaction and landsliding). The New Zealand perspective on
the Lifelines lessons from this earthquake is presented in the Bulletin of the NZ Society for Earthquake
Engineering. Information on the service restoration times from these events has provided a good basis for
establishing likely scenarios following a major earthquake in New Zealand. In particular, the impact on
communities and other utilities of the extended loss of water supply sends an important signal for post-
earthquake planning.
Key Outcomes for the Energy Sector. In New Zealand, electricity is generated from a variety of energy
sources (geothermal, hydro, coal, oil, gas and wind) in various locations throughout the country. The electricity
industry has been devolved over the past decade into the elements of generation, national transmission, and
local distribution. From its original form as a national and local government controlled operation, the generation
and local distribution elements are now predominantly privately owned. The splitting up of the electricity sector
and the adoption of market-driven competitive models has significantly increased the challenges in undertaking
mitigation and preparedness measures for earthquake and other natural disasters in an integrated way.
The privately owned Natural Gas Corporation (NGC) supplies gas from fields in the western North
Island province of Taranaki. Gas originating from this source is distributed by NGC throughout the North Island,
with other companies responsible for its reticulation at local level. Bottled gas is distributed on a commercial
basis in the South Island.
The principal outcomes from the Lifelines process in New Zealand for the various elements of the
energy sector are summarized in terms of mitigation and response preparedness.
Mitigation. Considerable effort had been put into seismic mitigation by the state-owned generation and

Earthquake Response Cooperation in APEC 50
national transmission organizations prior to Lifelines Projects commencing. At national transmission level, the
main result from Lifelines Project work has been the enhanced quantified seismic hazard information produced
by each region. Previous seismic hazard information used by Transpower had typically only been in terms of
generic national seismic zones as used in the design of new structures. Much of the mitigation (or risk reduction)
work resulting from the Lifelines Process has been undertaken at the local distribution level. This has included:
Strengthening the mounting systems for some 33/11 kV supply transformers. This includes checking the
strength and stability of the foundation pads to these transformers.
Checking the strength of the radiator banks and oil conservator tanks on some 66/11 kV supply
transformers, and battery banks and fitting extra bracing where necessary.
Checking the strength of 33 kV outdoor switchgear support frames and strengthening where necessary.
Checking the stability of the auxiliary and voltage transformers mounted on the top of some units of 11 kV
switchgear, and improving the method of fixing where necessary.
Strengthening or replacing selected old network substation buildings where they have a critical role in the
security of supply.
Bracing and tying down control cabinets and computers in control rooms and substations.
Developing new systems of equipment and spare parts inventories and storage (eg. horizontal storage of
critical and brittle spares to minimize damage).
Major mitigation measures undertaken by the gas sector over the past decade include the relining of old
cast iron gas mains in the capital city of Wellington with modern PVC mains operating at higher pressures.
Observations from the Kobe earthquake have also led to improved sectoriation (i.e. the ability to isolate gas
distribution networks into smaller sectors) by the introduction of more valve.
Response Preparedness. The Lifelines Engineering process has led to greatly enhanced relationships
between the electricity supply agencies and the Civil Defense Emergency Management sector. This has led to a
significant improvement in the understanding of each other’s roles, demands and needs – both at national and
regional levels. In particular, appropriate relationships have developed between National Civil Defense and the
national transmission company (Transpower NZ Ltd) and Regional Civil Defense and the local distribution
(lines) companies. There has also been greater awareness of the dependence of the restructured companies on
their maintenance contractors. Maintenance contracts are now subject to more careful scrutiny to ensure that
appropriately experienced repair personnel are available on a stand-by basis and, more importantly, they are
available on an exclusive basis rather than being shared with other utility companies. This highlights the
principal thrust of the new Civil Defense Emergency Management arrangements in New Zealand, which is to
place greater emphasis on self-sufficiency by key utility organizations.
Benefits. The benefit for organizations participating in Lifelines Projects is Sharing of earthquake risk
information between organizations. Traditionally, seismic risk issues have been worked through in isolation by
utilities on an organization-by-organization basis. The main benefit of lifelines work is the sharing of technical
information relating to seismic hazard, mitigation and response planning between lifelines organizations. A

Earthquake Response Cooperation in APEC 51
major outcome of lifelines studies is the generation of a much clearer picture of what the real situation is likely
to be following a major earthquake. This has many benefits for both utility organizations and the wider
community. By working closely with emergency management agencies, Lifelines Projects address the key risk
management step of communicating and consulting with the wider community. Risk Management is an integral
part of Asset Management, and lifelines engineering provides the vehicle for collective risk management across
utilities at a regional level. From this platform, the individual organizations can then carry out their specific
mitigation and preparedness tasks and integrate this with their Asset Management plans.
3.3. Seismic Performance Analysis in Electric Power System
Here we introduce how to evaluate the seismic performance of the electric power system, particularly its
substations, and recommend appropriate rehabilitation measures. We will use the results from the inventory
survey and equipment rehabilitation study being performed concurrently primarily by the members of the
research team supported by Multidisciplinary Center for Earthquake Engineering Research (MCEER) to
examine the extent of mitigation enhancement such rehabilitation work can produce. The analysis requires a
somewhat elaborate systems analysis of LADWP’s power system with primary emphasis on the substation
performance under damaging earthquakes such as the 1971 San Fernando and 1994 Northridge earthquakes.
While emergency repair and power supply was accomplished rapidly in the aftermath of the 1994
Northridge earthquake (one day) and the 1995 Kobe earthquake (three days), the costs of full restoration of their
electric power systems was extremely high. Estimated direct costs were said to be approximately $500 million
and $4 billion for the Northridge and the Kobe earthquakes, respectively. Since the “big one” appears to be
imminent in California, a much longer and more costly interruption of electric power may have to be
anticipated, which could have overwhelming socioeconomic impacts in the affected region. This research will
help find rehabilitation measures to mitigate such impacts.
The MCEER research team on system performance evaluation has a unique capability of modeling
lifeline systems and carrying out a seismic performance evaluation, given inventory data, system configuration
and fragility information with or without rehabilitation. The evaluation requires the delicate coordination of
various technologies involving interpretation and manipulation of sophisticated and voluminous inventory data,
utilization of highly specialized computer codes for systems analysis, estimation of fragility enhancement
resulting from the advanced rehabilitation technology and integration of all the above into a GIS platform for
demonstration. This capability itself represents an advanced technology and the purpose of this research effort is
to make use of this technology for the system performance analysis on the Los Angeles Department of Water
and Power’s (LADWP’s) electric power system.
LADWP’s electric power service areas and the power supply under usual operating conditions in the
service areas are shown in Figs. 3.21 and 3.22. The area not colored is serviced by the Southern California
Edison. Fig. 3.23 is a PGA map under the Northridge earthquake developed on the basis of the contour map
provided by David Wald, U.S. Geological Survey and Fig. 3.24 demonstrates how the system deteriorates under
the ground shaking shown in Fig. 3.23 under the hypothesis that only the transformers are vulnerable to the

Earthquake Response Cooperation in APEC 52
earthquake with the fragility curves assumed in Fig. 3.25 . This is based on the observation that the transformers
represent one of the most critical equipment for the functionality of the power network system.
The effect of other equipment such as circuit breakers, disconnect switches and buses on the system
performance is currently being studied. The hypothesis is introduced to demonstrate the proof of concept in
relation to the analytical simulation work used in this research. Fig. 3.24 shows the system deterioration by
computing the average ratio of power supply relative to that associated with the system under undamaged
conditions for each service area. The system analysis utilizes a Monte Carlo simulation method under the
hypothetical fragility curves (Cases 1, 2, and 3) provided in Fig. 3.25 . Fragility curves (Case 1) were used by
Tanaka et al. (1996) for substation equipment. The sample size is equal to 20 for each Monte Carlo simulation
analysis. The increasingly improved system performance as fragility curves move to the right (Case 1 to Case 2
and to Case 3) indicates the extent to which the rehabilitation or retrofit of transformers as represented by
enhanced fragility curves contributes to improved system performance. This is conceptually not an
unreasonable approach for evaluation of the effect of the rehabilitation or retrofit. In fact, M. Shinozuka (1998)
gave an example (Fig. 3.26) of such fragility curve enhancement involving a typical Memphis bridge retrofitted
by a base isolator in which major damage was assumed to occur when the ductility demand at all the bridge
columns exceeded 2.0.
In the present research, reliable fragility curves for the transformers rehabilitated or not rehabilitated are
still in the process of being developed. The FPS (Friction Pendulum System) was considered for enhancing the
fragility of the LADWP’s transformers. Analytical simulations were performed for a typical transformer
weighing 230,000 lbs. subjected to the ground acceleration time histories observed at the Sylmar substation
during the 1994 Northridge earthquake. To evaluate the effectiveness of the FPS for a wide range of earthquake
intensities, time histories were linearly scaled up to achieve higher PGA values for the development of fragility
information.

Earthquake Response Cooperation in APEC 53
Fig. 3.21 Service Area of LADWPFig.3.22 Electric Power Output
Fig. 3.24 Relative AveragePower Output
Fig. 3.23 PGA under Quake

Earthquake Response Cooperation in APEC 54
Fig. 3.27 shows that the degree of reduction in the inertia exerted on the transformer depends on the
time histories with differing levels of PGA (0.5 g, 1.0 g, and 1.5 g). The trend observed from Fig. 3.27 is that:
(1) the FPS is more effective for earthquakes with larger PGA’s; (2) the reduction of acceleration exerted on the
transformer is more significant when FPS’ radius is larger at the expense of larger displacements. Since most
transformers are installed outside and have sufficient clearance with neighboring equipment and buildings,
larger displacements may not represent a serious obstacle in deploying FPS devices; and (3) in general, for a
reasonable size of radius (say 15 inches), the reduction ranges from 30% to 50% depending on the earthquake
intensity between 0.5 g to 1.5 g in terms of PGA. This result was generally consistent with hypothetical fragility
curve enhancement introduced in Fig. 3.24 . The more recent studies by Saadeghvaziri and Feng (2001) confirm
similar results.
Fig. 3.25 Fragility Curves
0
0 . 1
0 . 2
0 . 3
0 . 4
0 . 5
0 . 6
0 . 7
0 . 8
0 . 9
1
0 0 . 1 0 . 2 0 . 3 0 . 4 0 . 5 0 . 6 0 . 7 0 . 8
PGA(g)
Pro
ba
bil
ity
o
f E
xc
ee
din
g M
ajo
r D
am
ag
e
Sta
te
Not Isolated (dd=2)
Isolated (dd=2)
Fig. 3.26 Fragility Curves for Bridges with and without Base Isolation
LADWP’s Power System. There are two electric power networks serving the Los Angeles region
operated by different organizations, Los Angeles Department of Water and Power, and Southern California

Earthquake Response Cooperation in APEC 55
Edison. Basically, these networks are managed independently. However, for coping with the fluctuating power
demand, they cooperate with each other at several substations and operate the system from a regional point of
view. In addition, since the networks are a part of the very large Western Systems Coordinating Council’s
(WSCC’s) power transmission network covering 14 western states, two Canadian provinces and northern Baja
California, the analysis was performed by taking all the substations and transmission facilities covered by the
WSCC network into account. Indeed, the fact that a blackout condition was observed over several states after
the Northridge earthquake demonstrates the far-reaching impact of a local system failure throughout the
network.
Fig. 3.27 Acceleration Reduction by EPS Bearings
In analyzing the functional reliability of each substation, the following modes of failure were taken into
consideration: (1) loss of connectivity, (2) failure of the substation’s critical components, and (3) power system
imbalance. It was noted that most of the transmission lines of the LADWP’s power system are aerially
supported by transmission towers. While by no means this implies that the transmission lines are completely
free from seismic vulnerability, it was assumed in this study that they were, primarily for the purpose of
analytical simplicity. Fig. 3.28 shows an abbreviated system flowchart for LADWP’s power system with all the
substations identified together with the nodes, generators and transformers. Thick horizontal bars represent the
nodes (buses with all other associated equipment) in substations as described by a model shown in Fig. 3.28 . In
the systems analysis pursued here, however, substation data were taken from the WSCC’s database and used for
the systems analysis in conjunction with the computer code IPFLOW, (version 5.0), licensed by the Electric
Power Research Institute (EPRI) to the University of Southern California.
Monte Carlo Simulation Using the ARC/INFO GIS capability, the electric transmission network map
was overlaid with the PGA map (Fig. 3.23) to identify the PGA value associated with each substation under the
Northridge earthquake. The fragility curves assumed in Fig. 3.25 were then used to simulate the state of damage
involving the transformers at all the substations of the LADWP’s power system. For each systems analysis, the
connectivity and power flow were examined with the aid of IPFLOW, where LADWP’s power system was

Earthquake Response Cooperation in APEC 56
treated as a part of WSCC’s overall system.
Loss of connectivity occurs when the node of interest survives the corresponding PGA, but is isolated
from all the generators due to the malfunction of at least one of the nodes on each and every possible path
between this node and any of the generators. Hence, the loss of connectivity can be confirmed on each damage
state by actually verifying the loss of connectivity with respect to all the paths that would otherwise establish
the desired connectivity.
As for abnormal power flow, it was noted that the electric power transmission system was highly
sensitive to the power balance and ordinarily some criteria are used to judge whether or not the node continues
to function immediately after internal and external disturbances. Two kinds of criteria are employed at each
node for the abnormal power flow: power imbalance and abnormal voltage. When the network is damaged due
to an earthquake, the total generating power becomes greater or less than the total power demand. Under normal
conditions, the balance between power generation and demand is within a certain range of tolerance. Actually,
the total power generation must be between 1.0 and 1.05 times the total demand for normal operation even
accounting for power transmission loss.
In this study, it was assumed that if this condition was not satisfied, the operator of the electric system
must either reduce or increase the power generation to keep the balance of power. However, in some cases, the
supply cannot catch up with the demand because the generating system is unable to respond quickly enough. In
this case, it was assumed that the power generation of each power plant cannot be increased or reduced by more
than 20% of the current generating power. When the power balance cannot be maintained even after increasing
or reducing the generating power by 20%, the system was assumed to be down due to a power imbalance. In
this respect, the effect of the emergency management systems used for power flow management will be
incorporated in the systems analysis in the future study.
As to the abnormal voltage, voltage magnitude at each node can be obtained by power flow analysis.
Then, if the ratio of the voltage of the damaged system to the intact system is out of a tolerable range
(plus/minus 20% of the voltage in the intact system), it was assumed that a blackout would occur in the area
served by the substation.

Earthquake Response Cooperation in APEC 57
Fig. 3.28 LADWP’s System Flowchart
For the Monte Carlo simulation of system performance under the Northridge earthquake, each
substation was examined with respect to its possible malfunction under these three modes of failure for each
simulated damage state. Thus, each simulation identifies the substations that will become inoperational. The
simulation was repeated 20 times on the network. Each simulation provided a different damaged network
condition. Fig. 3.24 shows the ratio of the average power supply of the damaged network to that associated with
the intact network for each service area. The average was taken over the entire sample size equal to 20. It was
concluded from Fig. 3.24 that the rehabilitation that lead to the fragility curve labeled as Case 2 was good
enough to protect the transformers, and hence the entire power system, under the assumption that structures and
other equipment were not vulnerable to earthquake ground motion.
On-going Research Activities. Fig. 3.24 is based on the hypothesis that transformers are the only
vulnerable equipment under the earthquake and that their fragility curves are given by the three curves in Fig.
3.25 . Other equipment such as circuit breakers, buses, and disconnect switches are currently being incorporated
into the systems analysis.
In order to examine the adequacy of the fragility assumptions for transformers and other equipment, a
walk-down at LADWP’s Sylmar converter station was carried out on June 11, 1999 by M. A. Saadeghvaziri
of the New Jersey Institute of Technology, M. Shinozuka, X. Dong and X. Jin of the University of Southern
California, and N. Murota of the University of California, Irvine, and Bridgestone Corporation.
In cooperation with Professor C.H. Loh, Director of the National Center for Research on Earthquake
Engineering (NCREE) in Taipei, Taiwan, the MCEER team with Bridgestone Company as an industrial partner,
is participating in an experiment to verify the effectiveness of FPS and hybrid friction and elastometric base-
isolators designed, manufactured and tested by Bridgestone. The experiment will be performed in July 1999 on
a transformer model installed with a typical porcelain bushing. For the experiment, NCREE’s 5 m x 5 m triaxial
shaking table will be used.

Earthquake Response Cooperation in APEC 58
Fig. 3.29 Typical Node Configuration Moel
Future Research. Now that all the analytical tools are in place, the research will continue to proceed on
three fronts. The first is to refine the systems analysis methodology by incorporating other significant substation
equipment and validating the results of the analysis with data from power interruption experiences caused by
the Northridge and other earthquakes. Upon validation, other scenario earthquakes will be considered for the
systems analysis to examine the seismic performance of LADWP’s power system under a wide variety of
earthquake magnitudes, epicentral locations and seismic source mechanisms. Interaction between LADWP’s
power and water systems will also be considered. This requires, however, additional effort for inventory and
other database development.
The second is to further study seismic vulnerability of the equipment and develop their fragility curves.
In this regard, the results from the research carried out by the MCEER investigators on fragility information
will be used as they become available. Rehabilitation measures can then be expressed as fragility curve
enhancements, which can in turn be directly reflected on the systems analysis with the aid of Monte Carlo
techniques. In this connection, rehabilitation measures other than those by base isolation will be explored.
Possibilities include use of advanced semi-active dampers. The shaking table tests for transformers will be
completed and the continued MCEER-NCREE collaboration will lead to additional tests involving other
equipment to determine their fragility characteristics and enhancement measures.
The third area of future endeavor involves direct and indirect economic loss estimation arising from
physical damage to the system facilities and resulting possible system interruption. This endeavor expands the
MCEER team’s capability in this area demonstrated by the study of the seismic vulnerability of the Memphis
area’s electricity lifelines (see Shinozuka et al., 1998). To assist the MCEER investigators in loss estimation, the
Monte Carlo simulation will be performed in such a way that direct and indirect loss estimation will be pursued
by recording a specific inventory of equipment damage observed for each realization of system damage. As
detailed in Shinozuka and Eguchi (1997), this allows statistics on direct and indirect losses based on individual
states of damage associated with corresponding simulation to be obtained, rather than based on the average of
the power output taken over the entire sample of simulation.

Earthquake Response Cooperation in APEC 59
3.4. Seismic Hazard Assessment in Petroleum Supply System
To prevent the potential earthquake disasters and minimize the seismic losses the Daqing City
Government, the moderate size city with the biggest petroleum industry, launched a comprehensive program for
seismic disaster reduction. And then an earthquake emergency response system for Daqing City Government is
developed. The designed system is a GIS and AI based decision-making system. It can be used for seismic
hazard assessment, seismic damage forecast, quickly evaluation of seismic losses after earthquake and decision-
making for emergency response as well as post-quake recovering. Figure 3.30 illustrates the general structure of
the system in terms of its application in urban earthquake response.
Figure 3.30 General Flowchart
As a core part of the system, the Geographic Information System is composed of four sub-systems:
1. Data and Information Sub-System
The Data and Information Sub-System is designed for acquiring, archiving, displaying, updating,
processing and analyzing variety spatially distributed data and information in a quick and efficient mode. This
Sub-System is composed of Seismic Tectonic Information System (STIS) and Engineering Environmental
Information System (EEIS). Both STIS and EEIS are a kind of space database. The STIS is one of the
significant database covering all the data and information related with potential seismic hazard. Such as:
Geographical location coverage for the whole Daqing City as well as its sub-zones, Earthquake monitoring
network coverage, Historical destructive earthquake coverage, Instrumentally recorded earthquake coverage,
Seismic fault coverage, Seism-tectonic province coverage, Seismic zoning coverage. Each of above mentioned
coverage is composed of more detailed sub-coverage, as an example, the Seismic zoning coverage includes
seismic belts, potential seismic sources, attenuation of seismic ground motion and seismic intensity and so on.
The EEIS is another significant major database describing the geographical information and its coverage
Scenario earthquake effect
GeographicInformation
System
SSeeiissmmiicc hhaazzaarrdd aasssseessssmmeenntt
EEaarrtthhqquuaakkee iimmppaacctt
EEaarrtthhqquuaakkee lloossss
eevvaalluuaattiioonn
Seismic risk analysis
PPoosstt--qquuaakkee eemmeerrggeennccee ddeecciissiioonn--mmaakkiinngg

Earthquake Response Cooperation in APEC 60
of the entire engineering environment, such as buildings, infrastructures, lifeline systems, equipment and
facilities for petroleum production, etc. Based upon the objectives of this system, the coverage of the EEIS are
divided into many parts. Coverage: Individual Building, Coverage: Building in Group, Coverage: Lifeline
system, Site conditions coverage, Coverage for critical structures, Coverage for fire station, Coverage for
secondary disasters, Coverage for relieve goods, Coverage for communication, Coverage for security system,
and so on.
Every coverage listed here with also comprises more detail sub-coverage. For example, in the lifeline
coverage, there are erected pipeline system, ground pipeline system, underground pipeline system, electric
power supply system, water supply system, sewage system etc. And also in the individual building coverage all
buildings are divided into two categories: buildings designed with and without consideration of earthquake
resistance.
2. Analytical Module Sub-System
This system provides a comprehensive algorithm for assessing potential damage to existing structures as
well as seismic ground failure under the assumed earthquakes and evaluating the real damage to the structures
immediately after occurrence of earthquake in a near real-time mode. The formula used in the system is as
follows:
P[ jD ]=∑9
6j ]I/D[P ·P[I]
Where Dj (j=1,2,3,4,5) is a damage index matrix describing the severeness of damage to structures, while Dj =0,
0.2, 0.4, 0.6, 0.8 and 1.0 represents intact, light damage, moderate damage, severe damage and collapse
respectively; P[Dj/I] denotes the vulnerability matrix of structures in terms of the probabilities of damage at
various level to the concerned structures under the given earthquake intensity I(from 6 to 9), were obtained by
statistical and /or analytical process; P[I] is called seismic hazard matrix represented by exceedance
probabilities of seismic intensities and derived from seismic hazard analysis.
Assessment of seismic losses Regarding the seismic losses, economic losses and the losses of life,
including death and injured, are concerned in this system. Economic losses usually comprise direct economic
losses and indirect losses. Due to the extreme complexity of estimating indirect economic losses, only direct
losses are taken into consideration in this project.
Seismic economic losses assessment The direct economic losses include the repairing cost for
damaged buildings and facilities and cost of the indoor properties damaged during earthquake. Following
formula is applied in this system,
)()()()( tNFWjQBjbIL sj s
ssj s
s α++= ∑∑∑∑
where L(I) denotes the total economic losses for an area affected by an earthquake with intensity I; bS(j) is the

Earthquake Response Cooperation in APEC 61
losses ratio of the buildings of category s (as well as equipment and facilities) damaged at j-th level; BS is
defined as the total cost for the buildings of s category; QS(j) as ratio of the losses of the equipment, facilities
and other indoor properties damaged at j-th level in buildings of category s to their total cost WS ; N is defined as
the cost for normal daily production; α,the production reducing factor and F(t), production recovering
function, which could be approximately estimated. For example, in case it takes T days to recover the
production to full run, the losses from production can be approximately estimated as 12
aNT .
Assessment of life losses. The losses of life during earthquake depend largely on the severity of seismic
damage to the buildings, occurrence time of earthquake as well as the quality of rescue work and seismic
emergency response measurement. In this paper, a simple way is applied for a rough estimation of the seismic
death toll by using the following expression. In this paper, a simple way is applied for a rough estimation of the
seismic death toll by using the following expression.
ND A R A R A R= + +( )1 1 2 2 3 3 ρ
where ND means the total number of the death toll; 1A , 2A and 3A are total construction area( 2M ) of the
collapsed, seriously damaged and moderately damaged structures respectively; 1R , 2R and 3R are the death
rate for the buildings encountered collapse, serious damage and moderate damage respectively and ρ is the
density of population in the buildings.
3. Computer-Aided Decision-Making for earthquake response
The Decision-Making Sub-System for Seismic Emergency Response provides the whole system with
functions of Route Searching, Address Matching and Resource Allocating. These functions are extremely
significant to run the emergency response program that includes rescuing program, relief program, medical
treatment program, water and food supply program, transportation and communication program, shielding
program, public security program, recovering program and so on. For example, the medical treatment program
will provide information to government for making decision on how many physical doctors and where should
be sent to based on the number of injuries evaluated by the life losses assessment sub-system. And the water-
food supply system will advise the decision-makers how much drinking water and food are needed for a
specific field based on the result of the extent of the damage to buildings evaluated by the seismic damage
assessment system. The transportation program will envisage the distribution of damage to the road and decide
the optimum route for a quick and safe access to the target place.
4. System Integration and Users-Interface
It is no doubt that the seismic emergency response system will be useful and helpful to the local

Earthquake Response Cooperation in APEC 62
authority responsible for disaster management. However, the presented system has not been experienced from
any real earthquake and even not tested in a real case and therefore the examination of system’s effectiveness is
need in the recent future.
3.5. Earthquake Risk Assessment in Natural Gas System
3.5.1. A Case Study in Osaka Gas Company, Japan
Seismic Monitoring and Early Damage Assessment. The 1995 Kobe (Great Hanshin) Earthquake caused
serious infrastructure damage. The natural gas system in the Kobe area was seriously affected. Numerous breaks
in distribution and service pipes were reported. Osaka Gas stopped gas supply for 860,000 customers in hard-hit
areas. However it took 6 to 15 hours for the decisions to shutoff supply to be made because the collection of
information on the extent of damage was extremely difficult just after the earthquake. Due to the massive
damage to gas pipes and disruption of road networks, service restoration took about three months.
To cope with secondary disasters, e.g., fires and explosions, after earthquakes, city gas utilities in Japan
have promoted several safety countermeasures in the last decade. They are increasing seismic resistance of
facilities and pipelines, segmentation of gas networks into blocks, earthquake monitoring by seismometers,
installation of intelligent gas meters with a seismic sensor etc. As one such earthquake countermeasures, Tokyo
Gas Co., Ltd. introduced an earthquake monitoring and rapid damage assessment system, SIGNAL (Seismic
Information Gathering and Network Alert), with 331 SI-sensors in 1994. The SI sensors measure the peak
ground acceleration (PGA) and spectrum intensity at district regulator stations. The SI and PGA values are sent
by the radio system and used for damage estimation. Together with actual damage reports, the results of the
damage estimation are used for the decision-making, whether or not to shut off the gas supply.
More recently Tokyo Gas further developed new SI-sensors, having several new functions with a much
cheaper price. The new SI-sensor can store acceleration time histories in its IC memory and send monitored
strong motion indices to the Supply Control Center through public telecommunication lines. The new sensors
will be installed at all 3,700 district regulator stations within the next 7 years. The new SI-sensor network is
named SUPREME (Super-Dense Real-time Monitoring of Earthquakes), and may be the densest seismic
monitoring network in the world. The data from the network will be used for an early damage assessment of the
city gas network of Tokyo Gas and the results will serve as important information for the decision-making
abount gas supply suspension.
Safety Measures of Natural Gas Supply Systems Tokyo Gas Company has emergency shutdown
systems serving 8.7 million metered customers. The gas pressure and flow of production facilities and high-
pressure (HP) pipelines are always monitored for trouble. Primary facilities are equipped with remote-control
emergency shutoff valves. Segmentation of gas networks is carried out at two levels: one for medium-pressure
(MP) lines and another for low-pressure (LP) lines. Emergency shutoff of gas networks can be carried out for
these units, called K-blocks for medium-pressure lines and L-blocks for low-pressure lines. At each customer,
an intelligent gas meter stops the gas supply automatically if earthquake motion larger than 0.2 G is detected.

Earthquake Response Cooperation in APEC 63
For low-pressure lines, emergency shutoff occurs automatically based on measured SI values at district
regulator stations. However, for medium-pressure lines, an automated shutoff system is difficult to install
because the service areas and the effects of emergency shutoff are much bigger than those of low-pressure lines.
It is also not easy to detect pipe breaks just after an earthquake from the changes of gas flow and pressure
because pipe breaks and automated shutoffs have contrary effects. Thus, a rapid damage assessment system,
SIGNAL, was introduced.
The unique feature of SIGNAL is its extensive earthquake-monitoring network. The monitoring system
measures the PGA and SI at 331 locations in the service area via SI-sensors. Acceleration time histories at 5
locations and pore-water rises at 20 locations are also observed. Once an earthquake occurs, these values are
sent to the supply control center of the headquarters by the company's radio network. These are used in decision
making of the gas supply shutoff for medium-pressure trunk lines.
The early warning system consists of hypocenter estimation and damage estimation sub-systems. For the
damage estimation, data on the service area, e.g. soil conditions, customers' buildings and pipelines, are stored
on a workstation using GIS with pixels of 175 m ×250 m. The prototype of SIGNAL was completed in 1992
and the actual system has been operating since June 1994. Since seismic safety is a high priority for city gas
supply systems, other major gas companies in Japan have also developed earthquake monitoring and rapid
damage assessment systems like SIGNAL. Installation of the intelligent gas meters with a seismic sensor has
also been accelerated and almost all the customers of major gas companies have this kind of meter now.
Development of New SI Sensor Conventional SI sensors were deployed at all the district regulators of
Tokyo Gas about ten years ago. These SI sensors have been used for automated shutoff of gas valves at the
regulators by the detection of SI values equal or greater than 30cm/s or 40cm/s. However, the conventional SI
sensor cannot store acceleration time histories. In accordance with regular replacement of the SI sensors, Tokyo
Gas developed a new SI sensor with much higher performance than the conventional type. The new SI sensor
jointly developed by Tokyo Gas and Yamatake Co., Ltd. is very small and low-cost (1/2-1/3 with the cost of the
conventional one) due to the adoption of an ultra small acceleration pickup (manufactured by Sumitomo
Precision Products Co., Ltd.) and high performance CPU and RAM devices. The new SI sensor employs a
voltageless relay output for regulator shutoff, an analog output of SI value and PGA, and an alarm output for
liquefaction. The analog output accommodates telemeter equipment. The sensor is capable of measuring
acceleration up to 2.0 G with precision of at least plus or minus 5 percent. The new SI sensor can store three-
component acceleration time histories in its internal memory together with header information on the
occurrence time of earthquakes. The sampling rate is 1/100th of a second with a resolution of 1/8th of cm/s2.
The duration of one acceleration time history is set to be 50 seconds, centered around the motion with the
largest running SI value. If a long vibration exceeding 50 seconds is detected, the time history for another 50
seconds is also stored. Six sets of time histories, listed in the order of larger SI values, can be stored in the
memory. One of the unique features of the new SI sensor is its liquefaction detection capability. Using measured
acceleration time histories, occurrence of liquefaction is estimated. Studying the characteristics of the
acceleration records from the liquefied sites in Japan and the United States, the following conditions were
employed to judge the occurrence of liquefaction:

Earthquake Response Cooperation in APEC 64
1. PGA is larger than 100 cm/s2.
2. SI is larger than 20 cm/s.
3. the estimated maximum displacement D (D=2SI2/PGA) is larger than 10 cm.
4. the estimated predominant period T by the zero-crossing method is larger than 2.0 seconds.
If all the above conditions are satisfied by recorded horizontal accelerations, an alarm signal of liquefaction is
issued.
New Real-Time Disaster Mitigation System The replacement of the existing SI sensors to the new SI
sensors started 1997 and will end in 2007. By July 2001, the number of new SI sensors will reach 1,800. When
this replacement is completed, the operational status of all the about 3,700 district regulators, e.g., gas pressure
and regulator shutoff/open status, can be monitored as well as SI, PGA, and liquefaction alarm. Tokyo Gas
started the system design of SUPREME as an enhanced real-time earthquake monitoring and damage
assessment tool. The actual operation of SUPREME has started in July 2001. If an earthquake occurs, the data
from the regulators that are automatically shutoff will be sent to the supply control center via commercial
telephone lines. For a large magnitude earthquake with short distance, a maximum of about one thousand
regulator stations are expected to be shut-off, and even in such a case, all the data may be gathered within 20
minutes. Even after the new SI sensor network for SUPREME is established, the SI sensor network with 331
new SI sensors for SIGNAL will continue to be in operation. The seismic information (SI and PGA) from these
instruments is much faster (within about 10 minutes) because the company’s radio system is used for the
collection of these data. The remote monitoring units in SUPREME employ the public telephone lines and they
are used to monitor the pressure gauges and gas leak detectors even in the ordinary time. Heavy traffic
congestion is expected in the telecommunication lines, especially in case of large earthquakes. A newly
developed remote monitoring system (Disaster Mitigation DCX) incorporates a function that enables it to
assemble and transmit the alarms to reduce a number of dialing.
GIS Data and Seismic Zoning of SUPREME Since the number of seismometers in SUPREME will be
much larger than that in SIGNAL, more detailed GIS data and seismic zoning are desirable. A new geological
classification shown in Fig. 3.31(a) was developed as a base map of seismic zoning.
Furthermore, a new site amplification map shown in Fig. 3.31(b) was developed in order to estimate the
spatial distribution of SI values based on observed SI values from the new SI sensors. This map was made as
follows:
1. Utilizing a total of about 50,000 borehole logging data (SPT N-values), the shear wave velocities of
surface layers at the boring points were estimated.
2. The site amplification factors for SI values were estimated at the boring points using the relationship
between the average shear wave velocity (AVS) and the amplification factor, developed based on K-NET
records.
3. The spatial distribution of site amplification factor was estimated based on a weighted average of the
amplification factors of surrounding boring points.

Earthquake Response Cooperation in APEC 65
To estimate the spatial variation of SI value from observed SI values from the new SI sensors, a
weighted average scheme was again employed for the normalized SI values (converted to the outcrop base of
Vs=600m/s utilizing the amplification factor). The predicted surface SI distribution with 50m x 50 m mesh was
utilized to estimate seismic damage to buried pipes and customers’ buildings.
SI Sensors’ Performance in the 1999 Chi-Chi Earthquake. The Great Taipei Gas Co., Ltd., Taiwan’s
largest gas utility with 330,000 customers, introduced the new SI sensors to all 31 regulator stations in 1999.
These SI sensors were set to shut off the gas supply automatically if the SI value exceeded 40cm/s. Soon after
the installation of the SI sensors, the Chi-Chi Earthquake with Mw=7.6 occurred in the central part of Taiwan
on September 21, 1999. The epicenter was located about 160km southwest of Taipei and only limited damage
was reported in Taipei, apart from one collapsed building. In the main shock of the event, 16 SI sensors
recorded the strong motion successfully. Since the largest SI was 27.4cm/s (PGA=139.6cm/s2) at Shazoo station,
no shutoff occurred in the gas supply. The smallest recorded SI was 8.3cm/s (PGA=38.0cm/s2) at Yenson station,
within 2km of Shazoo station. The acceleration response spectra for the two records are compared in Fig.
3.32(a). The difference in the maximum acceleration and response spectra may be explained by the soil
conditions of the two sites, shown in Fig. 3.32(b). Yenson is located on hard rock while Shazoo is on weak
offshore deposits.
(a) Geological Classification (b) Estimated Site Amplification Ratio of SI
Fig. 3.31 GIS maps employed in SUPREME

Earthquake Response Cooperation in APEC 66
10
100
1,000
Max
imum
acc
eler
atio
n re
spon
se (c
m/s
2 )
0.1 1 10Period (sec)
Yenson
Shazoo
0 10 20 30 40 ≧50N
0 10 20 30 40 ≧50N
ShazooG04
EL.+0.90
YensonH18
EL.+4.20+10m
-10m
-20m
-40m
-30m
0m
-60m
-50m
Legend
Surface
Clay
Sand
Gravel
Rock
(a) (b)Fig. 3.32 Acceleration response spectrum (a) and boringprofile (b) at Shazoo and Yenson stations
The distribution of SI and PGA indicates that soil condition significantly affects the site amplification
factor. To investigate the site response characteristics in more detail, microtremor observation was also carried
out at all the SI sensor stations. The results of these investigations may provide useful information for the site
amplification and seismic zoning of Taipei.
3.6. Summary
Comprehensive seismic risk assessment, in conjunction with earthquake risk management, is the best way
to protect energy supply systems against large earthquakes. This chapter introduces various techniques and
methodologies by which some APEC member economics have developed or implemented earthquake hazard
simulations and emergency responses. Haz-Taiwan, earthquake loss estimation software used in Chinese Taipei,
is discussed in length from its methodological framework to the detailed mathematical model. Earthquake risk
assessments for electric power systems, petroleum supply systems, and natural gas systems are also presented in
detail. The excellent earthquake risk management of lifelines in New Zealand and Australia is so remarkable
that its institutional framework and standard processes are also included in this chapter.

Earthquake Response Cooperation in APEC 67
Chapter 4
Earthquake preparedness for Energy Supply System Earthquakes pose a significant hazard to life and property. Although earthquake cannot be prevented,
effective preparation can reduce loss of life and damage to property. Here we introduce several agencies
responsible for preparedness and emergency management matters of the energy supply systems in APEC
economies. In this chapter we focus on institutional frameworks for the emergency response of energy supply
systems. Earthquake preparedness guidance will be published in the next report.
4.1. Institutional Framework for Emergency Response of Energy Supply System
4.1.1. Emergency Management Australia and State Emergency Services Units
Emergency Management Australia (EMA) is a famous emergency management organization internationally.
They deal with all kinds of disasters in Australia, including earthquakes. In addition Australia has a large
number of agencies that respond to events might threaten lives or property. Each of the States and Territories
has its own emergency management system. Most have laws and regulations relating to emergency management
and these are supported by emergency or disaster plans and procedures. Although Australia government
administrative arrangements differ between States and Territories and emergency management systems, titles
and procedures vary to reflect those differences, the roles of these systems are very similar. Here we introduce
the authoritative structure of emergency management systems and the volunteer organization, State & Territory
Emergency Service.
The structure of emergency management system. In Australia there are four elements to this national system:
1. National Emergency Management Committee (NEMC)
The NEMC is the peak national consultative forum in emergency management. It is chaired by the Director
General, Emergency Management Australia (EMA) and comprises chairpersons and executive officers of State
and Territory emergency/disaster management organizations. The committee meets annually to coordinate
commonwealth and State and Territory interests in national emergency management.
2.State and Territory Emergency/Disaster Management Organizations
Each State and Territory has established its peak committee of senior members of appropriate departments and
emergency management matters. The following list the titles of the peak State and Territory emergency
management committees:
QLD State Counter Disaster Organization
NSW State Emergency Management committee
NT State Disaster Council
VIC Emergency Management Council

Earthquake Response Cooperation in APEC 68
SA State Disaster Committee
TAS State Disaster Committee
WA State Emergency Management Advisory Committee
3.Commonwealth Emergency Management Organization
The Commonwealth Minister responsible for disaster and emergency management matters is the Minister for
Defense. The agency through which the Minister exercise this responsibility is Emergency Management
Australia (EMA). EMA provides national leadership in the development of measures to reduce risk to
communities and manage the consequences of disasters. In addition, the senior interdepartmental body
responsible for providing policy advice and for overseeing interdepartmental arrangements for providing
recovery assistance to the States and Territories is the Commonwealth Counter Disaster Task Force (CCDTF).
4.Commonwealth Financial Assistance
In Australia, through a Commonwealth – States agreement for financial relief called the National Disaster Relief
Arrangements (NDRA), the Commonwealth reimburses States and Territories in accordance with a funding
formula for expenditure on agreed eligible measures.
State Emergency Services Units. The State & Territory Emergency Services (S.E.S./T.E.S.) is a volunteer
organization, established in 1974. The S.E.S./T.E.S. units made up of local people who have volunteered
prepare themselves and their communities to minimize the effects of a disaster. Their basic concept is to
encourage self-help and mutual assistance within each community. Members of the S.E.S./T.E.S. are well-
trained in Leadership skills, navigation, communications and can specialize in dozens of other duties available
in the service.
4.1.2. China Seismological Bureau
China’s government has paid much attention to earthquake disaster prevention and mitigation. It
established the China Seismological Bureau to deal with emergency matters for earthquake disasters.
Organizations In 1971 the State Seismological Bureau(SSB) was established in China; it was renamed
the China Seismological Bureau(CSB) in 1998, and is an organization directly under the State Council,
responsible for the management of earthquake affairs nationwide. With the authorization of the State Council it
has responsibility for administration and execution of the “Law of the People's Republic of China on Protecting
Against and Mitigating Earthquake Disasters”. When a serious earthquake occurs, CSB will become a relief
headquarters under the leadership of the State Council to deal with earthquake emergency response. CSB
consists of 6 functional departments and 48 institutions, including 31 provincial seismological bureaus. Some
earthquake-prone cities and counties have also set up their own seismological bureaus (or offices) subordinate
mainly to local government at the same level.

Earthquake Response Cooperation in APEC 69
Through development of more than 30 years, China has formed a comprehensive team of seismic
scientists and technologists which includes various professions, such as geophysics, seismic geology,
earthquake prediction, engineering earthquake, crustal deformation measurement, computer technology, radio
and information engineering. The total number of CSB staff is 13,340, including 9607 scientists and technicians.
Among them there are 9 academicians from the Chinese Academy of Sciences, 4 academicians from the China
Engineering Academy. Also there are total 6,793 staff under the administration of local government prefectures,
cities, towns or enterprises.
Management Functions CSB mainly carries out the following management functions:
1. To draft and implement development strategy, principles and policy, laws and regulations of the national
earthquake disaster prevention and reduction work and set professional standards.
2. To draw up a national plan for preventing and mitigating earthquake disasters, and national emergency
response plans for destructive earthquakes. To set up a mechanism for planning and provide guidance for
national earthquake forecasting. To put forward proposals for earthquake-stricken areas rebuilding plans
after earthquakes.
3. To draw up a national earthquake intensity zoning map or ground motion parameter zoning map. To
provide safety evaluations for big projects and those construction projects that may suffer serious disasters.
To examine earthquake safety evaluation results and to define the strengthening requirements.
4. To supervise work concerning the earthquake disaster prevention and reduction in accordance with the
regulations of the “Law of the People's Republic of China on Protecting Against and Mitigating
Earthquake Disasters”.
5. To undertake dual leadership with the provincial seismological bureaus directly under the central
government, set up and develop corresponding managerial and financial mechanisms. To provide guidance
to the earthquake institutions concerned.
6. To administer national earthquake monitoring and prediction work. To formulate national plans of
earthquake monitoring and prediction and make arrangements for their implementation.
7. To undertake the operations of earthquake emergency response for the command headquarters of the State
Council. To provide quick reports on earthquake disaster situations, investigate and evaluate loss and
damage. To make suggestions to the State Council on measures that should be taken.
8. To provide guidance on the reform of mechanism of seismic science and technology, draft the
development plan and strategy for seismic science and technology. To organize seismic research work on
key national projects, coordinate the research and development of earthquake emergency responses, rescue
technology and equipment. To provide guidance on development and application of the results of seismic
science and technology.
9. To undertake international exchange and cooperation on seismic science and technology, and seismic
inspection of the international ban on nuclear testing.
10. To provide guidance on publicity. To educate and spread knowledge of national earthquake prevention and
disaster reduction.

Earthquake Response Cooperation in APEC 70
Working Principle. Under the leadership of China’s various government levels, the bureau aims to
follow the principle of reducing earthquake disaster damage by addressing both prevention and relief, with
prevention as the priority. the bureau is striving to improve domestic understanding of earthquake disaster
prevention and reduction and actively mobilizing and organizing all kinds of forces. The bureau relies on the
legal system, science and technology, strengthening earthquake prevention, emergency response, relief and
recovery, and making comprehensive preparations to mitigate against earthquakes.. The above principle is
focused on following points.
1. Reducing the impact of earthquakes is a main duty of government at different levels.
2. To improve society’s understanding about earthquake disaster prevention and reduction.
3. To put the work of earthquake disaster prevention and reduction under the legal system.
4. To promote the progress and application of seismic science and technology, strengthen international
exchange and cooperation on science and technology.
Earthquake Monitoring Chinese scientists have put much effort into earthquake monitoring and
forecasting and protection against possible earthquakes, especially for medium and strong earthquakes. A large-
scale seismic monitoring system was been established after the Xingtai earthquake in 1966. At the same time,
more than 600 seismic stations run by local governments or enterprises and about 2000 observation points have
been set up.
Seismic Monitoring System in China The existing seismic monitoring system of the China
Seismological Bureau is as follows: Over 300 seismic observatories, 345 substations of regional telemetry
seismic networks, over 140 crust-deformation observatories, 54 strain and stress observation stations, nearly 90
hydro-chemical observation stations, 240 underground hydro-level observation stations, 140 geomagnetic
observatories, 80 geoelectric observatories, and 15 gravity base stations.
Earthquake Prediction Under certain circumstance, it is possible to make short-term prediction within
certain degrees for earthquakes with some special types. But due to the serious complication of earthquake
processes and types, up to now, mankind has not discovered how to monitor the birth and developing process of
earthquakes. Therefore, earthquake prediction is still an unsolved topic of science. Based on the scientific
investigation over several dozen years, Chinese seismologists believe that the scientific barrier of earthquake
prediction can be broken down sooner or later. Chinese professionals on earthquake prediction are working
diligently, analyzing seismic activity and other various seismic precursory data to estimate the possible
occurrence time, site and magnitude of potential earthquakes that are forecast to strike at some point in the
future.
Earthquake prediction can be divided into four types in terms of time period:
1. Long-term prediction: to predict the location of a potentially devastating earthquake within the future 10
years.

Earthquake Response Cooperation in APEC 71
2. Mid -term prediction: to predict the location and magnitude of a potentially devastating earthquake within
the future 1-2 years.
3. Short term prediction: to predict the time, site and magnitude of a high-potential earthquake within the
next 3 months.
4. Imminent prediction: to predict the time, site and magnitude of a high potential earthquake within the next
10 days.
After over 30 years’ hard work, much earthquake data has been accumulated. Chinese scientists have
had some experience of success and also learned a lot of lessons. It is very hard to understand the birth process
and possible warning signs of earthquakes. Chinese scientists believe however that with long-term effort,
earthquakes can be predicted. At present, different methods for earthquake prediction have been developed.
Chinese scientists have created scientific principles for "long-term, mid-term, short-term and critical"
earthquake prediction, step-by-step and phase-by-phase.
Earthquake Damage Prevention Three seismic intensity zoning maps of China were compiled in the mid
1950s, the mid 1970s and 1990 respectively. At present, a Chinese ground motion parameter zoning map has
been finished, promoting the modification from seismic intensity formulation to ground motion parameter
formulation for earthquake resistant fortification requirements. Research has also been done on the principles
and objectives for general anti-seismic projects, the fortification requirements for typical projects, and the
requirements and sample criteria for major projects and those with the possibility of secondary disasters.
Seismic safety assessments should be carried out to propose regional earthquake fortification resistance
requirements. In addition to theoretical and digital modeling studies of building structure, lifeline projects, rock
and clay mechanics, and applied studies of vibration have been strengthened in connection with housing and
utility equipment and bridge constructions. Research work on this subject has been increased in recent years,
comprising the foundation for important decisions, such as the institutional earthquake resistance project, city
planning, aid and support measures, and anti-seismic reinforcing of existing constructions and engineering
establishments.
Laws and Regulations Earthquake prevention and disaster reduction in China are under regulation.
The regulationshave been in effect since 1988. The following are the main earthquake laws and regulations:
“The Protection Act for Facilities of Earthquake Monitoring and Environmental Conditions of Earthquake
Observations” (1994)
“Emergency Response Act for Destructive Earthquakes” (1995)
“Law of The People's Republic of China on Protecting Against and Mitigating Earthquake Disasters”
(1998)
“Stipulations for Issuing Earthquake Predictions” (1998)

Earthquake Response Cooperation in APEC 72
Scientific Research. Fundamental research is believed to be crucial to enhancing the level of earthquake
prediction and resilience. CSB pays great attention to fundamental research, setting up the Joint Seismological
Science Foundation in 1984 to support seismologists carrying out fundamental research into seismology.
Laboratories have been established for tectonophysics, earthquake focus physics, seismic precursors,
earthquake engineering, geochemistry, new chronology, and so on. Geological surveys and seismological
observations are widely carried out. For example, the accumulated length of artificial seismic deep-sounding
profiles has reached as much as 40,000 km. Research has been widely carried out into the following fields:
dynamics of the earth, seismotectonics, seismic wave propagation and ground motion attenuation, time and
space distribution characteristics of various geophysical fields, time and space distribution characteristics of the
earth's crust movement and ground deformation on the mainland of China, tectonic stress field, the mechanism
of seismic precursors, and the process of earthquake development.
4.1.3. Energy Planning Committee in New Zealand
Earthquake response by Energy Suppliers in New Zealand has been drive by the legal requirements (the
Civil Defense Act 1983) (to be superseded by the Civil Defense Energy Management Bill), commercial interests
and social obligations.
New Zealand has a number of energy sources, including biomass, coal, gas, geothermal, hydro, oil, solar and
wind. (Table 4.1)
Table 4.1 Usage of Energy Sources in New Zealand
Energy Sources UsageBiomass Power generationCoal Heating & power generationGas Heating & power generation plus transport.Geothermal Heating & power generationHydro Power generationOil Transport & power generationSolar Heating & power generationWind Power generation
Energy is supplied by a number of energy suppliers with a mixture of private, government and
community trust ownership as follows:
Power generation companies, e.g. Contact Energy (private), Meridian Energy (government).
Power transmission company: Transpower (government).
Power distribution companies: e.g. United Networks (private), Powerco (trust).
Oil companies e.g. BP, Mobil, Caltex (private).

Earthquake Response Cooperation in APEC 73
Gas companies, e.g. Natural Gas Corporation (private).
Coal companies e.g. Solid Energy (government)
The Legal and Institutional Framework The Act dealing with earthquakes and other natural disasters
in New Zealand is the Civil Defense Act 1983. It is an Act to make better provision for the performance by
regional and territorial local government. Their functions and duties and the exercise of their powers are in
relation to national emergencies and civil defense. And to provide for planning and other responsibilities of
Departments of State and other organizations in relation to national emergencies and civil defense, to provide
for restoration and rehabilitation following civil defense emergencies and generally to consolidate, amend and
replace the Civil Defense Act 1962. The Act is administered by the Ministry of Civil Defense (now Ministry for
Emergency Management).
Energy suppliers’ responsibilities are covered in the National Civil Defense Plan (NCDP) that has been
prepared by the National Civil Defense Committee as required by the Act. The National Civil Defense
Committee is responsible to the Minister for the planning and preparation needed to maintain effective civil
defense. The committee is supported by a number of planning committees and advisory committees on science,
social studies and public education. One of these planning committees is the Energy Planning Committee.
Representatives of this committee are from Transpower (NZ) Ltd., Contact Energy Ltd., Genesis Power Ltd.,
Mighty River Power Ltd., Meridian Energy, Electricity Engineers’ Association, Natural Gas Corporation, Gas
Association of NZ Inc., Local Government New Zealand, Ministry for Emergency Management and the
committee is chaired by Ministry of Economic Development.
The NCPD deals with a whole range of issues from Government Response (responsibilities of
government) to Logistics, Fire Services and Energy. The above Energy Planning Committee has described the
responsibility of the energy suppliers under the Act as follows:
Principles. Primary responsibility for emergency measures in relation to energy rests with energy sectors
participants, who should undertake:
1. measures to identify the impacts from hazards and to reduce their consequences on the assets they manage;
2. measures to assure, as far as is practicable, the rapid reinstatement of critical supply;
3. emergency response planning to secure the safety of the public from damaged systems;
4. liaison with CDEM authorities in regard to priorities for restoration, the coordination of other critical
resources and securing assistance in supply system restoration.
In an emergency, electricity supply systems should be accorded high priority for restoration and
maintenance because of the life preserving and communications purposes to which electricity is put. Such
restoration must be done in a way which does not create new hazards to life and property. For example,
restoring power to any area in which fir hazards such as broken gas or LPP lines exist, needs to be carefully
coordinated. Restoration and maintenance of piped gas and LPP supply systems should be accorded priority
where these systems are used for fuelling power stations or form a major source of energy for a community.

Earthquake Response Cooperation in APEC 74
Planners should be alert to possible conflicts (for example gas may be used to heat hospitals and/or to make
electricity to light them). Regional and local civil defense plans should make reference to energy providers and
their emergency planning. CDEM systems may assist energy companies with identifying the location of
disruptions to electricity and piped gas and LPP supplies or provide access to resources to assist energy staff and
contractors to restore damage or operate and maintain available supply systems.
Priorities. The goal of civil defense measures is to save life and minimize suffering. In the event of an
emergency, energy supplies need to be made available where practicable and appropriate in the following
priority order.
(1) Medical centers (including hospitals).
(2) Emergency operations centers (EOCs) and other emergency coordination points.
(3) Energy control centers.
(4) Communications networks.
(5) Water and sewage pumping.
(6) Gas production facilities.
(7) Liquid fuel pumping and delivery.
(8) Essential domestic/commercial/.
(9) Industrial uses.
(10) Other purposes.
In November 2000, the Civil Defense Emergency Management Bill (CDEMB) was introduced to New
Zealand Parliament. It is expected, following the Select Committee considerations, to be enacted in September
2001. It will replace the Civil Defense Act 1983. Energy suppliers, under this Bill will be part of the lifeline
utilities that will encompass:
(1) Networks providing the basic necessities of life – power, water, sewage and transport of essential supplies.
(2) Networked services essential to limiting the extent of an emergency.
(3) Infrastructure essential to the basic operation of an export-led economy.
Duties of Lifeline Utilities Every lifeline utility must ensure that it is able to function to the fullest
possible extent, even though this may be at a reduced level, during and after an emergency. They must make
available to the Director in writing, on request, its plan for functioning during and after an emergency. They
must participate in the development of the national civil defense emergency strategy and civil defense
emergency management plans. They must provide, free of charge, any technical advice to any Civil Defense
Emergency Management Group or the Director that may be reasonably required by that Group or the Director.
Energy suppliers will continue to be involved under the CDEMB as they have been under the Civil
Defense Act 1983 but the CDEMB has been updated to take account of the modern business environment. The
CDEMB sets a minimum expectation but leaves considerable freedom for 3 energy suppliers to decide how best

Earthquake Response Cooperation in APEC 75
to meet that minimum expectation. A heavily regulatory approach is considered unnecessary as continued
operation of energy suppliers is an objective shared by communities, government and the owners and operators
of these businesses.
Emergency Management in New Zealand The proposed CDEMB reflects the shift in focus of
emergency management in New Zealand. The focus is shifted from “emergency” to “reduction” and “readiness”.
Emergency management is moved from a post-disaster, response-focused to a holistic, pre-disaster policy of
sustainable hazard management. Most energy suppliers adopt the risk management process in AS/NZS4360:
1999 Risk Management standard as part of their overall asset management plan.
Due to the changing business environment whereby private ownership of energy supply plus the
amalgamation of local governments has meant that coordination between various government agencies and
private companies has to be carefully planned. Lifeline projects and groups who are non-government, non-
private have increasingly played an important role in this coordination as well as raising awareness and actions
from energy suppliers in earthquake response planning.
All energy suppliers have Emergency Response Plans to varying degrees in detail. Most if not all energy
suppliers have taken actions to mitigate the risk of earthquake damage to their assets. Most, if not all, actively
participate in emergency response planning and studies, notably via the Lifelines Projects and Groups around
New Zealand (15 groups in total). Most electricity companies carry spares for emergencies. There is no strategic
oil reserve of oil in New Zealand. Currently, crude oil in NZ has about 1 week of stock. Petrol stock is about 20
days, stored at 12 or so tank terminals around NZ.
4.1.4. Energy Commission in Chinese Taipei
The Executive Yuan of Chinese Taipei announced the “Disaster Mitigation and Response Plan” on
August 4, 1994 to learn from the Northridge Earthquake which occurred on January 14, 1994. According to this
plan, the Ministry of Economic Affairs (MOEA) is the central authority in charge of energy supply systems for
disaster prevention and response. If a serious disaster such as a devastating earthquake happens, the Ministry is
responsible for coordinating repair and rescue efforts and providing consultation between different government
agencies. Thus, the MOEA asked its Energy Commission (EC) to establish its own “Professional Plan of
Disaster Prevention” and Central Emergency Response Center. As a consequence, the EC of MOEA asked all
the energy supply companies such as Taipower, China Petroleum Corporation (CPC) and local gas utility
companies to establish their own “Emergency Repairs, Supply and Recovery Plans “ and set up the required
equipment for each company’s Emergency Response Center. Due to these efforts, even though the loss and
disruption of 921 Chi-Chi Earthquake was great for energy supply system, the repair and recovery was quick
and effective compared to the earthquake in Kobe, Japan or Los Angeles, U.S.A. However, there is still some
room to improve. The Legislative Yuan passed the “ Disaster Mitigation and Response Act” to promote the
disaster mitigation preparedness, response and recovery to a legal level. A Meeting of the Executive Yuan on
disaster prevention subsequently announced the “Master Plan of Disaster Prevention,” which includes overall

Earthquake Response Cooperation in APEC 76
long-term disaster mitigation and response strategies. As a result, all energy supply-related authorities and
companies were obliged to establish new response plans.
Framework of the Emergency Plan Frameworks for emergency planning are required in order to
promote a consistent approach among governments and utility companies. To reduce the impacts of disasters,
the Legislative Yuan passed the “Disaster Mitigation and Response Act” on June 30, 2000. It mandated the
various levels of the government to follow this Act and formulate “Disaster Mitigation and Response Plans” to
form a complete disaster mitigation and response system from the central government to the local governments
and utility companies. If a disaster hits, emergency response centers will be established at various levels of the
government to coordinate the rescue efforts and facilitate the rescue and relief operations. Such planning is
especially important for energy supply systems. A sound emergency policy and response strategy will increase
preparedness for the disasters and provide the timely response of rescue actions to reduce casualties to prevent
secondary disasters.
The emergency response plan is the major job at the level of preparedness. Mitigation, Preparedness,
Response and Recovery are well known as the cyclic stages for hazard management. The framework for an
emergency plan addresses six important phases of earthquake response. They are:
1. Notification and assessment of the damage:
The energy supply companies need to judge the extent of damage and possibility of secondary disaster
according to the hazard intensity or site damage report by the public and their own company people. The
notification, if necessary, in both vertical (superiors-subordinates-the public) and parallel (among utility
companies) directions should have its standard operational procedure (SOP). The assessment should consider
the company’s ability to cope with hazards and its unique environment. Three classifications: awareness,
warning and emergency are usually the outcome.
2. Summoning of response personnel
Personnel will be summoned according to the extent of earthquake damage. They include engineers and
workers of the utility companies and their contractors, staff of principal agencies for emergency rescue,
including local fire and police departments, medical centers, local city government and organizations of
volunteers.
3. Immediate public safety
Severe damage to an energy supply system could cause an extremely dangerous situation for the
surrounding neighborhood. Thus, public safety must be secured immediately after an earthquake disaster. At the
early stage of this phase, public utility companies send out damage inspectors to evaluate the degree of hazard
and coordinate the rescue tasks. The utility should provide all required professional knowledge and judgment to
the local fire and police departments. With the help of utility personnel, fire fighters and police can thus
evacuate endangered people, set up traffic control and ask for more support from other authorities, such as the

Earthquake Response Cooperation in APEC 77
military force.
4. Emergency repairs
This phase activates the response that includes a more comprehensive assessment of damage and status
of the energy supply system, arrangement of the repair schedule and priority, and dispatching of repair teams.
To carry out emergency repairs effectively, the repair teams need to bring the manuals for inspection and quick
repairs that were prepared beforehand by the companies.
5. The restoration of partial service
The purpose of this phase is to achieve a minimum service for the community and thus to avoid the
chaos after a major earthquake disaster. The recovery of a basic service can also assist the rescue of the
endangered people and the living of the survivors.
6. The restoration of full service
Generally, there are two types of restoration to full service: rehabilitation and reconstruction.
Rehabilitation means that energy supply companies devote themselves to repairing and strengthening damaged
facilities according to the safety inspection and restoration plan to regain full function. If the damage is too
great to rehabilitate economically or the building code of the energy facilities changes, permanent
reconstruction might be necessary for a more hazard-resistant energy supply system.
Since earthquakes occur instantly and unexpectedly, the above phases might not occur in order. It is
obvious from the Chi-Chi earthquake that judgment on site is as important as a response plan. In order to
obtain an effective response plan, the energy supply companies need to formulate their “Engineering repairs,
Supply and Recovery Plan” and build up their companies’ Energy Response Center. The emergency repairs,
supply and recovery plan should at least contains the following topics:
1. Personnel list for emergency response, pipeline layout maps, 24-hour emergency notification and response
system to the local fire and police departments.
2. Estimation or scenario, if possible, of a major earthquake striking the neighborhood.
3. Standard operating procedure for response, task forces and assignments.
4. The drill plan of disaster response, especially for large- scale complex disasters, which are usually caused
by a major earthquake.
The company’s plan which is mandated by the Disaster Mitigation and Response Act needs approval
from the central government authorities, MEA, before its implementation. A brief framework for the emergency
response is given in Table 4.2 .
Table 4.2 Frame of Emergency Response

Earthquake Response Cooperation in APEC 78
4.1.5. California Energy Commission
This report is based on the “Energy Shortage Contingency Plan” of the California Energy Commission, and
gratefully acknowledges generous assistance from Ms. Mara M. Bouvier. Detailed information about the
California Energy Commission and their “Energy Shortage Contingency Plan” is available at Web Site:
http://www.energy.ca.gov/.
The earthquake response and preparedness of energy suppliers in California, U.S.A. is driven by
regulations from the Office of Emergency Services and assistance from their Standardized Emergency
Management System (SEMS) Infrastructure. The Energy Commission promotes additional efforts through
energy policy issues adaptive to the industry. This implementation infrastructure clearly guides the Director of
the Office of Emergency Services and the Executive Director of the Energy Commission, in coordinating issues
of priority and programs that perform with respect to emergency preparedness, response and recovery.
The California Energy Commission is defined as “the state’s response to a shortage of electrical energy
or fuel supplies to protect public health, safety, and welfare (Public Resources Code Sec. 25700). Also
incorporated in the translation of the Resources Code are shortages caused by natural disasters: such as
earthquakes, fire, flood, or geopolitical events such as war, terrorism, civil disturbance or embargo.
Emergency Response Plan In the “California Energy Shortage Contingency Plan”, emergency
response status is divided into four phases: readiness, verification, pre-emergency and emergency. Here we
would like to focus more on how response is outlined in the emergency protocols.
In an emergency phase, the “Energy Shortage Contingency Plan” states that: to impose mandatory
Prime Minister of Executive Yuan
Call for central government meeting for disaster prevention todetermine the opening of the Central Emergency Response Center
Open the Central Emergency Response Center
Members are summoned to the Center.Commander is the minister of MEA
Corresponding utility companies need to establish EmergencyResponse Task Team operating in company’s center to Provideany required effort to the Central Center

Earthquake Response Cooperation in APEC 79
programs, the Governor must first proclaim a State of Emergency, by filing an Executive Order with the Office
of the Secretary of State. The Executive Order will take effect immediately upon being filed. All mandatory
programs automatically terminate when the Governor rescinds the emergency proclamation.
Management and Information Coordination Management and information sharing is essential when a
disaster happens, especially in the initial stages. The California Energy Commission follows the Standardized
Emergency Management System (SEMS) to coordinate with different levels of government agencies to assist in
controlling disasters more effectively. The plan recognizes the need for multi-agency coordination, and uses the
Standardized Emergency Management System (SEMS) effectively to share the responsibilities of implementing
designated tasks. This management system provides a standard organizational framework and supporting
guidance which checklist operations at each level of the emergency system. It also provides the umbrella under
which response agencies at all levels may function together effectively in an integrated fashion. Under SEMS,
the Energy Commission’s staff operates as an agency representative. The role of an agency representative is to
coordinate with and provide support to the Office of Emergency Services (OES).
Effective communication with other state, federal and local agency jurisdictions is essential to
coordinating a state response to an energy shortage. Whatever the emergency situation and degree of
government involvement, the Energy Commission is responsible for assessing energy impacts in California and
serves as the central clearinghouse for energy information during an event which impacts energy price and
supply.
Coordination with Local Governments The established (official) line of communication for local
jurisdictions, particularly to request resources, is from city to county (also called Operational Areas) to Regional
OES to State OES. The Energy Commission staff firsts contact State OES for local incident information.
Certain situations may warrant direct contact if needed to determine specific local energy information. In the
event of mandatory conservation strategies, the Petroleum Fuels Set-Aside Program is implemented.
Applications for the Set-Aside are submitted directly to the Energy Commission.
In a natural disaster affecting specific areas, the local official in whose jurisdiction the event has
occurred "shall remain in charge (Government Code, Section 8618). The code also includes the direction of
such personnel and equipment provided to the affected region through mutual aid.
Coordination with Office of Emergency Services The Office of Emergency Services (OES) is the
operational entity within the Governor's Office that coordinates the emergency activities of all California State
agencies and departments (Emergency Services Act, Article 5, and Section 8587). In addition, the Governor
may delegate other emergency powers to the Director of OES, but may not delegate the authority to proclaim a
State of Emergency.
During a disaster, OES is the lead agency and other agencies (including the Energy Commission)
provide support. California currently has three OES emergency response regions. These regional Emergency
Operations Centers or REOC’s are located in Oakland (Coastal Region), Sacramento (Inland Region) and Los

Earthquake Response Cooperation in APEC 80
Alamitos (Southern Region). If a disaster affects more than one region, the next level of coordination is the
State Operations Center (SOC). When OES activates a REOC or SOC in response to a disaster, the Energy
Commission will act as an agency representative and provide staff support to assess the energy infrastructure
and analyze supply disruption impacts. Note that, depending on the emergency, the Energy Commission staff
support might be provided via computer and does not necessarily require a physical presence at the REOC or
SOC.
Although OES is the lead State agency during a disaster, if the energy emergency is the result of a non-
disaster related event (i.e. embargo), then the Energy Commission is the lead State agency. The Chairman will
work closely with the Director of OES to coordinate a statewide response to the emergency.
Coordination with Other State Governments The United States is divided into Petroleum
Administration Defense Districts or PADDS. The states within PADD V (Alaska, Arizona, California, Hawaii,
Nevada, Oregon and Washington) are closely linked by their oil supply network. PADD V is essentially a self-
contained oil supply system and because of this isolation recognizes the need for cooperation and coordinated
actions. The Energy Commission staff will notify any PADD V state of events, which have the potential to
affect energy supplies to that state.
Coordination with the Federal Government The Contingency Plan is designed to be compatible with
federal emergency planning activities. The U.S. Department of Energy (DOE), through its Office of Energy
Emergencies, is charged with protecting national interests in the event of foreign or domestic oil supply
disruptions. The Energy Commission’s staff responds to DOE requests for information, including Energy
Commission and OES Situation Reports. In addition, the Energy Commission’s staff remains knowledgeable
about the roles of the Federal Emergency Management Agency (FEMA) and the resources they provide in a
natural disaster. The Energy Commission is involved in ongoing planning meetings conducted by FEMA.
Emergency Management Structure When a crisis or disaster happens, the management infrastructure is
known in advance, therefore lessening panic allowing the rescue and restoration to start as soon as possible. The
organizational char below shows the relationships, lines of authority, communication and points of cooperation
among the Commissioners and staff involved in implementing the Contingency Plan.
The California Energy Commission’s management structure is as follow:
Table 4.3 Energy Emergency Organization Chart

Earthquake Response Cooperation in APEC 81
The California Energy Commission illustrates that the prime mea
knowing who is in charge, the lines of authority, and the process for pro
who need to delegate appropriate responses. The successful operation of
upon the management structure and comprehension by staff regarding t
Energy Commission's Operating Guidelines provide the structure
management and the assigned tasks were developed to closely reflect
positions.
Roles and Responsibilities In this capacity, the California En
responsibilities. The positions include Governor, Chairman, Fuels C
Director, Contingency Planning Manager, Public information Officer, G
Contingency Planning Staff. Clarification of assigned roles permits easier
defined responsibilities.
General Responsibilities
GOVERNOR
CHAIRMAN
EXECUTIVEDIRECTOR
CONTINGENCYPLANNINGMANAGER
CP STAFFANALYSISREPORTS
MITIGATION
OES DIRECTOR
FUELS COMMITTEE
COMMISSIONER
…………………
OTHER COMMISSIONER
GOVERNMENT
AFFIARS OFFICER
PUBLICINFORMATION
sure of management infrastructure is
viding essential information to those
their plan in an emergency depends
heir operational responsibilities. The
and specific responsibilities. Both
the usual day-to-day roles of those
ergy Commission regulates related
ommittee Commissioner, Executive
overnmental Affairs Officer, and the
transitions in operating schedules and

Earthquake Response Cooperation in APEC 82
Upon notification of an impending energy emergency, persons in the positions listed are to review operating
guidelines and begin activities as directed or appropriate to the situation. A summary follows which describes
the general responsibilities of each position.
Governor: Directs the public, as well as all State government agencies, in voluntary energy conservation
measures. When appropriate, proclaims a State of Emergency and signs Executive Orders necessary to
implement mandatory conservation programs deemed necessary upon recommendation by the Energy
Commission.
Chairperson: Directs staff to proceed with specific elements of the Commission’s goals. Using the data and
analysis provided by staff, the Chairman would present recommendations to the Governor on how best to
respond to the impacts of an energy problem.
Fuels Committee Commissioner: Oversees the activities of the Contingency Planning staff, and assists the
Chairman in briefing the Governor on the status of an energy shortage.
Executive Director: Oversees the activities of the Contingency Planning staff and the Commissions process as a
whole.
Contingency Planning Manager: The Contingency Planning Manager, when designated by the Chairman,
reports to the Executive Director and is responsible for specific staff assignments. The Manager initiates multi-
level communications with government and private industry. The Executive Director and Manager regularly
brief the Chairman and other Commissioners on the results of the staff's information gathering and analysis.
Public Information Officer: At the direction of the Executive Director, schedules briefings for the media and
coordinates with the Governor's Office. The Public Information Officer is also responsible for disseminating
accurate information, obtained from the Contingency Planning Manager, to the general public, advising them on
the status of the situation and providing guidelines for energy demand reduction and mandatory programs.
Governmental Affairs Officer: Responsible for delivering copies of Situation Reports to State Legislators;
prepares briefing packages for the Chairman to present in State Legislative sessions and Congressional
Delegation. They also respond to inquiries from state and local elected officials.
Contingency Planning Staff: Under the direction of the Contingency Planning Manager, is responsible for
situation monitoring, analysis of impacts, response planning, report preparation, and program implementation.
The staff also maintains a network of contacts with other government levels and private industry.
4.2. Summary

Earthquake Response Cooperation in APEC 83
The planning of emergency response and restoration procedures has an important role in reducing the
possible losses from major earthquakes. Response planning acknowledges that full physical mitigation is
unattainable for most lifelines due to economic restraints. Thus, sound preparedness to ensure a rapid
restoration of service and to avoid spread secondary damage from leakage or interruption of energy fuel is
essential for the government as well as utility companies. The institutional frameworks for energy supply
system emergency responses are introduced for China, New Zealand, Chinese Taipei, and California. An
institution framework defines the structure of emergency management, the legal requirements (laws or acts) for
energy planning, the roles and obligations of government authorities and energy supply companies, and the
responsibilities of key personnel involved.

Earthquake Response Cooperation in APEC 84
Chapter 5
Earthquake Disaster Countermeasure and Response Plan This chapter introduces an earthquake disaster countermeasure and response plan for electricity, oil, and
natural gas energy supply systems. The countermeasure and response plan provides both a means of minimizing
the impact of earthquakes, and a basis for the earliest possible restoration of services. Under electricity, we will
introduce Japan and Korea’s earthquake disaster management of energy supply systems; under oil, we will
introduce the Emergency Response Plan of Chinese Petroleum Cooperation of Chinese Taipei; under natural
gas, we will introduce the Emergency Response Plan of Osaka Gas and Chinese Taipei’s gas facility.
5.1. Electricity System
5.1.1. A Robust, Disaster-resilient Electric Power Supply System in Japan
A case study of Kansai Electric Power Co., Inc. The Hanshin-Awaji Earthquake was one of the greatest
earthquakes in the 20th century in Japan. The experience from this earthquake demonstrated the importance of
the following: electric power facilities designed to withstand natural disasters, Emergency Disaster Measures
headquarters on standby, system for acquisition and provision of information about disasters.
Design of the electric power supply system Electric utilities construct electric power supply facilities to
meet increasing electricity demand and maintain adequate reliability. Power supply facilities usually have a
multiplex (double) system in order to guard against blackouts from simple contingencies such as lightning.
Underground transmission/distribution lines are used out of concern for visual impact in urban areas. The
following are important steps to secure the reliability of the power supply in case of disasters such as
earthquakes.
Ensure sufficient seismic design of electric power supply facilities.
Decentralize power supply bases.
Make multi-route networks that have several power sources.
Kansai electric power systems are double circuited so that little electricity is lost even in an emergency.
Kansai power systems maintained their synthetic functions even after the strong earthquake.
Electric power supply system for the disaster-resilient city. Decentralized power supply bases are
effective for making cities more resilient to disasters. Transmission substations are normally located in suburban
areas. However, by introducing urban type transmission substations, the feeding points of distribution
substations are diversified and reliability of the power supply is much improved particularly in the case of a
devastating disaster such as an earthquake.

Earthquake Response Cooperation in APEC 85
Fig.5.1 Electric power supply system for the disaster-resilient city
Taking this into consideration, distribution substations with a single power source are interconnected
with several power sources to expand multi-route networks with several power sources.
Power stations are generally located far from the load center and supply generated power to urban areas through
long distance transmission systems. To protect cities from broad power interruption following disaster at power
stations or along transmission routes, the installation of urban-type power stations, which provide autonomous a
power supply, is suggested.
Power supply system formation that considers city planning. Collaboration among government and
utilities is essential to construct well-designed power supply facilities in urban areas that are robust against
disasters. Facing increasing power demand in urban areas, Kansai Electric Power Co. cooperated with local
communities to construct new substations when planning urban redevelopment, and considered additional
measures for existing substations. The use of underground transmission lines is considered a more
environmentally-sound way of introducing new power transmission lines into urban areasAdvantage is often
taken of common duct projects to secure space for underground lines. In urban areas where electricity demand
is stable and electric facilities can be constructed along roads,underground distribution lines are introduced.
However, overhead lines are far more easily restored than underground lines. This was demonstrated during the
Hanshin-Awaji Earthquake.. Post-disaster restoration plans should incorporate both approaches.
Robust Communications System Kansai Electric Power also adopted seismic designs for its
communications facilities. The company has dual-route communication lines. However, if several operations
bases, such as head and branch offices, suffer damage as the result of a disaster, the impact on work may still be
considerable. The company therefore has designated back-up operations bases to disperse communications
network. The head office, branch offices and computing center, each have designated back-up bases. One of the
two existing lines for load dispatching operations and telephone linkswill be rerouted via the back-up local
load-dispatching center. One of the two existing business telephones lines will be rerouted via the back-up
operation base.
:500kVTransmission Line
:275kVTransmission Line
:77kVTransmission Line
500kV TransmissionSubstation
TransmissionSubstation
TransmissionSubstation
PowerStation
Concept
UrbanArea
SuburbanArea
SeaDowntown Downtown
500kV TransmissionSubstation
TransmissionSubstationTransmission
Substation
TransmissionSubstation
TransmissionSubstation
Urban-typePower Station

Earthquake Response Cooperation in APEC 86
Fig. 5.2 Communication systems via back-up operation bases
Post-earthquake risk-management organization Before the Hanshin-Awaji earthquake, Kansai Electric
Power did not have definite standards for setting up a post-disaster Headquarters for Emergency Disaster
Measures. Consequently, if a disaster occurred in the night or during a holiday, it was difficult to smoothly
assemble such a response headquarters.. The company now has procedures established for the immediate
organization of a Headquarters for Emergency Disaster Measures. When an earthquake greater than seismic
intensity 6 on the Japanese scale occurs in a supply area, the head and branch office should immediately
establish a headquarters. Neighboring branch offices also have to establish Supporting Headquarters
immediately. At the same time, if an earthquake greater than seismic intensity 6 on the Japanese scale strikes a
supply area, employees should go immediately to the ordinary place of work. Each employee should select
and register the nearest place of work (designated place of work) in advance. They proceed directly to that
designated place in case communication is impossible or travel to the ordinary place of work is not possible.
Two managers at the head office are responsible for company-external correspondence if a large-scale disaster
ohits in the night and on a holiday. Since the public telephone network would be congested, the following
measures have been taken to reinforce communication.
Business telephone ad fax lines installed in executives’ homes.
Portable phones and PHS (Personal Handy-phone System) introduced.
Simultaneous information devices upgraded and replaced.
Acquisition of Information about Disaster Telephone and fax communication was previously vital in
disaster response. A Disaster Information System using LANs has now been installed to acquire and offer post-
disaster information. If an earthquake greater than seismic intensity 6 on the Japanese scale occurs in the
company’s supply area, or an earthquake causes blackouts over 1 million kW, the system offers information
within 30 minutes about the blackouts to central and local government.
5.1.2. Seismic Safety Review of Electric Power Facilities in Korea
Current Future
Head Office
Branch Office
Other Office
Back-up Operation BaseHead Office
Branch Office
Other Office
Back-up Operation Base
1st route
1st route 1st route
1st route2nd route
2nd route
2nd route
2nd route
2ndroute
2nd route

Earthquake Response Cooperation in APEC 87
In Korea, strict seismic design requirements have long been applied to Nuclear Power Plants (NPPs).
But, since 1999, seismic safety reviews has been required for all power facilities including not only fossil and
hydraulic power facilities but also transmission facilities and substations. Over 40% of total electricity
generation in Korea depends on 16 NPPs. Since the first commercial NPP operation in 1978, there have been
substantial developments in safety standards and practices. Operating experience has also improved analytical
methods.
Periodic Safety Review of NPPs The objective of a PSR is to determine by means of a comprehensive
assessment of an operational NPP whether the plant is safe as judged by current safety standards and practices,
and whether adequate arrangements are in place to maintain plant safety. A PSR for old NPPs in Korea has been
in process since 2000. It is expected that the results of the PSR will be of great use not only for design
improvement feedback for future NPPs but also for evaluation of extending the life of old NPPs. The present
status of PSR for NPPs with countermeasures and improvements are:
1. Evaluation of Capable Fault and Maximum Credible Earthquake
The NNE-SSW Yangsan fault is one of the major faults on the Korean peninsula. It is about 200km long
and located in the southeastern part of Korea. There have been arguments over whether the Yangsan fault can be
a seismic source, thus jeopardizing the safety of NPPs. Most Quaternary faults are very steep and found in or
near Quaternary alluvial deposits. Historical earthquake records are concentrated on Kyongju City in the central
part of the Yangsan fault. Kyongju was a capital city about 1,500 years ago and a well-populated area at that
time. Several geologists insist that the Yangsan fault is active, based on records of historical earthquakes near
Kyungju, but they failed to provide clear evidence.
The Ulsan fault trending NNW-SSE strike is about 50km long and located next to the Yangsan fault.
According to previous studies, the Ulsan fault was considered a long lineament rather than a fault because no
displacement was found along it. Recently, several quaternary faults were reported in the northeastern part of
the lineament. Some experts have investigated the activity of the Ulsan fault with reference to the seismic safety
of the Wolsung NPP located about 20km from the fault. Studies in recent years show reverse faults in
Quaternary deposits at several sites located in the eastern block of the Ulsan fault. The results also reported two
fault movements and liquefaction phenomena resulting from the MMI IX earthquake. At present there have
been some reports on Quaternary faults near the Ulsan fault but there is no direct evidence that the Ulsan fault is
a seismic fault.
These studies have only focused on age-dating of Quaternary faults at specific outcrops without
quantitative paleoseismic evaluation from the faults. Recently, a long-term research project has been launched
to interpret the segmentation of the fault, to analyze the development of the fault, to develop domestic active
fault criteria, and to evaluate quantitative seismic potential for the NPP sites.

Earthquake Response Cooperation in APEC 88
2. Evaluation of Design Ground Response Spectrum
Due to the lack of earthquake data, instead of using site-specific response spectra for the seismic design
of NPPs in Korea, the standard design ground response spectra of U.S. NRC reg. Guide 1.60 have been applied.
Research work is carried out to evaluate the design ground response spectrum on the assumption that the
geological and seismological characteristics of the Korean Peninsula are analogous to those of stable
continental regions.
Two methods, the empirical and the synthetic methods, are applied to develop the site-specific response
spectra of NPP sites. For the empirical method, comparable earthquakes from elsewhere in the world should be
selected because of the lack of domestic earthquake data. The criteria and procedures to select compatible
earthquake have been developed considering the source mechanism of earthquake, propagation property of
seismic wave and amplification properties of the site. For the synthetic method, a synthesizing program is made
and input data of the seismic source are defined. With the selected and synthesized earthquake data, the
procedures of developing site-specific response spectra are established. Compatible earthquakes detected in
stable continental regions are identified.
For the empirical method, firstly, the procedure and method to evaluate the similarity of earthquakes
elsewhere in the world are established. Secondly, the evaluating items are quantified. Lastly, several compatible
earthquakes are selected and their response spectra are calculated. The response spectra developed show that the
standard response spectra are conservative at the low-frequency range and peak responses are indicated around
10 Hz. It is known that similar results have been found in the eastern USA.
To make synthetic earthquake from the small earthquakes that have occurred in Korea, a method that
synthesizes a large earthquake from a small earthquake with seismic source data was developed. To predict the
large earthquake, data from measured large and small earthquakes that occurred at the same source is necessary.
Unfortunately, there have been very few applicable earthquake events in domestic data. As a result of applying
the synthetic method with one event, the response spectrum is similar to that of compatible earthquakes (See
Fig. 5.3). It may be noted that the results of the two methods indicate a consistency.
Fig. 5.3 Comparison of response spectra developed by empirical and synthetic method
For practical usage of the method, a proper theory should be developed and actual earthquake data
0 .1 1 1 00 .0 1
0 .1
1
1 0
em pir ical m ethod synthet ic m ethodSp
ectr
al A
ccel
erat
ion(
g)
Frequency( H z)

Earthquake Response Cooperation in APEC 89
should be accumulated. Stochastic method could be one alternative method to develop site-specific large
synthetic earthquakes.
The earthquake parameters such as peak ground acceleration, spectral acceleration and duration of
ground motion are obtained from data recorded for engineering purposes. To measure strong earthquakes,
earthquake observatory networks have been established, which consist of eight earthquake observatory stations
in the vicinity of the four NPP sites. Individual stations are equipped with a seismic accelerometer, a
velocisensor and a recorder. Recorded data from these stations are transmitted to the seismic monitoring center
of Korea Electric Power Research Institute (KEPRI) and analyzed on a real-time basis. KEPRI plans to install
five additional earthquake observatory stations near the Yangsan fault by 2002 and connect with Korea
Integrated Seismic System (KISS).
3. Improvement of SSI Analysis Technologies
It is difficult to accurately estimate the SSI effect because of many uncertainties of complicated soil
properties. Moreover, available techniques and computer codes for SSI analysis may give quite different results
depending on their different assumptions and limitations in spite of the remarkable development of SSI analysis
procedures and theories. To solve these kinds of essential SSI problems, KEPRI has actively participated in the
Hualien project under the leadership of Taipower and EPRI since 1990. The Hualien project was initiated to
obtain earthquake-induced SSI data, to identify nonlinear soil behavior due to strong motion and near field
earthquake characteristics, to verify the convolution and deconvolution methods considering soil stiffness
reduction, and to define input motion for SSI analysis. To verify the developed SSI analysis program, the
analytical results were compared with the actual data recorded in the Hualien large scaled seismic test (LSST)
model in Taiwan. On the basis of various SSI analysis experiences and obtained earthquake data, KEPRI has
developed an advisory software program to guide SSI analysis and improve the probabilistic approach for SSI
analysis to quantify the uncertainties of SSI input parameters. KEPRI will develop spatial variation functions,
which can provide a complete description of the statistical properties of the horizontal components of the
seismic wave based on the recorded earthquake data of the Hualien LSST model.
4. Seismic Capability Evaluation for Equipment
The seismic capability evaluation of equipment should demonstrate the equipment’s ability to perform
its required function during and after the time it is subjected to the forces resulting from the design basis
earthquake. IEEE 344 described the seismic test and analytical methods as seismic qualification methodologies
for mechanical as well as electrical equipment. There are three USI A-46 "Seismic Qualification of Equipment
in Operating Plants," and eight USI A-40 "Recommended Revisions to NRC Seismic Design Criteria" NPPs in
Korea. For USI A-46, EPRI has formed a seismic qualification utility group (SQUG) and developed the generic
implementation procedure (GIP), which is an alternative verification method for seismic adequacy of equipment.
For USI A-40, the Lawrence Livermore National Laboratory funded by the U.S. NRC has performed a long-

Earthquake Response Cooperation in APEC 90
term research program and a seismic safety margin research program. The current licensing process has been
developed on the results of this program. IAEA recommended that all operating plants, including A-46 plants,
should perform a PSR to comply with the current licensing requirements. For the resolution of the seismic
safety issue, the use of two approaches - seismic margin assessment (SMA) and seismic probabilistic safety
assessment (SPSA) - is allowed.
In order to resolve the above problems related to seismic safety issues, KEPRI joined the SQUG in 1998
and is developing efficient combined methodologies to evaluate the seismic capability of equipment for
operating NPPs. The new combined methodology requires both GIP and SMA simultaneously, which are based
on the seismic walkdown. The seismic walkdown is known to be the most effective tool to find seismic
deficiencies of existing plants and can achieve cost benefits for the seismic safety review.
The design of an anchor system for fastening the equipment and piping systems in Korean NPPs has
been based on ACI 349 (See Fig. 5.4). Recently, the concrete capacity design methods of the Euro-International
Committee for Concrete (CEB) Code, have indicated that the anchor system designed by ACI 349 may not
satisfy the required tensile and shear capacity. According to U.S. NRC standard review plan published in 1996,
NRC acknowledged that ACI 349 would overestimate the real capacity of the anchor system for fastening
equipment and recommended that the anchor system be designed by test results for each case. Therefore, in
order to evaluate the tensile and shear capacity of existing anchorage systems, KEPRI is carrying out actual
model tests.
(a) ACI 349 code (b) CEB code
Fig. 5.4 Failure modes for fastenings under tensile loading
5. Reduction of Uncertainty in Probabilistic Seismic Hazard Analysis
Much research was performed to reduce the excessive uncertainty involved in previous PSHAs by
improving the credibility of main PSHA input data such as ground motion attenuation relations, earthquake
catalogs, and seismic source characterization. A new PSHA methodology has been established not only to
incorporate state-of-the-art PSHA technologies but also to be compatible with revised regulation requirements.

Earthquake Response Cooperation in APEC 91
Revised PSHA inputs are obtained by employing a comprehensive technical approach to data collection
and analysis, experiments, theoretical study, etc., to explicitly account for and reduce the uncertainty in
scientific knowledge related to the PSHA input data. Using these new PSHA inputs, a PSHA is being performed
as a case study on the Wolsung NPP site to demonstrate the improved seismic hazard results.
The EQHAZARD software package developed by EPRI was modified to implement state-of-the-art
technologies and revised regulations relating to PSHA. Seismic source interpretations were collected for the
region of Korea for inputs to PSHA. A team approach to the EQHAZARD code was adopted.
Using revised PSHA inputs and the EQHAZARD code obtained from this research, the PSHA on the
Wolsung NPP site was performed considering the incompleteness of the Korean earthquake catalog. The new
PSHA result shows a reduced seismic hazard level compared with the previous PSHA result, which has the
effect of significantly reducing the level of core damage frequency (See Fig. 5.5).
0 100 200 300 400 500 600 700 800 900 1000Acceleration (cm/sec^2)
1.0E-8
1.0E-7
1.0E-6
1.0E-5
1.0E-4
1.0E-3
1.0E-2
1.0E-1
P(A>
a)Ye
ar
Incompleteness Corrected
Completeness above M 3.3 assumed
Completeness above M 3.9 assumed
Fig. 5.5 Seismic hazard results according to methods considering the incompleteness of the earthquake catalog
6. NPP Response to an Earthquake
Small earthquakes may exceed the OBE spectrum in the high-frequency range, without causing damage.
An analytical criterion for determining OBE exceedance should be set up. A comprehensive plan for NPP
response to an earthquake was developed in order to determine:
The effects of an earthquake on physical conditions of Korean NPPs.
Whether shutdown of the plant is appropriate based on observed damage to the plant or due to an
exceedance of the OBE.
The readiness of the plant to restart following a shutdown due to an earthquake.
Guidelines for nuclear plant response to earthquakes enable operators to quickly evaluate the need for
post-earthquake plant shutdown and provide procedures for evaluation of earthquake effects on the plant, as

Earthquake Response Cooperation in APEC 92
well as criteria for plant restart. The guidelines consist of short-term actions, post-shutdown inspections and
tests, and long-term evaluations. The short-term actions, which could be completed within four to eight hours of
the earthquake, consist of operator walkdown inspections, evaluation of ground motion records, and pre-
shutdown inspections. The long-term evaluations would normally be performed after the NPP has returned to
service. Restart of the plant following shutdown due to an exceedance of the OBE would be based on the results
of the post-shutdown inspections and the successful completion of surveillance tests and operability tests. The
NPP should be shutdown for inspections and tests prior to a return to power, if the earthquake exceeds the OBE.
The OBE at the computed CAV from the earthquake record is greater than 0.16g-sec. However, the CAV
criterion should be determined considering the seismic and structural characteristics of the plant. An
experimental study using shaking table is conducted to evaluate the intensity of the CAV criterion. An
appropriate level of CAV is evaluated based on the test results using the developed SDI model. The SDI model
consists of stacked acrylic cylinders and is developed to behave consistently for each directional seismic load.
The result of the experimental study indicates that a CAV criterion of 0.16g.sec is conservative enough to be
applied to Korean NPPs, since the CAV value of the seismic input motion of the Korean standard NPPs ranges
from 0.3 to 0.5 g-sec. The developed SDI is expected to be useful not only in easily determining OBE
exceedance but also in evaluating earthquake damage quantitatively to provide guidelines for better post-
shutdown inspection and test.
7. Evaluation of Tsunami Risk
A safety review for Ulchin NPP against tsunami was made on the basis of maximum earthquake
magnitude 7 3/4 and available tsunamigenic earthquake fault parameters. Recently, however, based on the
seismic gap theory, some geologists and seismologists have warned that the earthquakes with a larger
magnitudecould occur in the East Sea region. For the safety evaluation, an explicit finite difference model is
employed based on linear and nonlinear shallow water equations. Also, using earthquake fault parameters, the
vertical sea bottom displacement for earthquake events is estimated. It is assumed that the initial profile of
tsunamis is equal to the sea bottom displacement without any modification by hydraulic effect because the
horizontal scale of tsunami source area is large enough in most cases.
In Korea, the maximum run-up height of tsunamis was observed at the Imwon Harbor located about 20
km north of the Ulchin NPP in 1983 East Sea Tsunami. Therefore, the flooding of the 1983 East Sea Tsunami at
Imwon was simulated for verification of the model. General agreement was observed between the calculated
water surface profile and the observed wave heights. The water level rise and drop of the 1993 Hokkaido
Nansei-Oki Tsunami was also simulated. Finally, the effects of probable seismic gap faults were evaluated and
the conclusion that the site of Ulchin NPP is safe against disastrous tsunamis was obtained.
Seismic Evaluation of Fossil and Hydraulic Power Facilities According to current seismic design
criteria in Korea, fossil power plant facilities belong to the seismic I category. Of 68 units of fossil power plants

Earthquake Response Cooperation in APEC 93
in operation, in 26 cases it is not clear whether seismic design was considered or not. The remaining 42 units
need to be reviewed for their seismic resistance capacity. It is likely that fossil power facilities built before the
establishment of seismic design codes developed in 1988 may not meet current seismic design criteria.
Therefore, it is necessary to evaluate the seismic resistance capacities of main structures such as turbine
buildings, boiler buildings, and stacks using the national building and dam code. Research work is underway to
evaluate the likelihood of soil-liquefaction for the dyke structure. For now, no seismic monitoring system has
been installed for fossil power facilities. A seismic monitoring system is to be installed newly at the sites of 26
fossil power units and three hydraulic power units. This new seismic monitoring system shall transmit both
recorded earthquake data and subsequent structural behavior to the seismic monitoring center by Internet.
KEPRI has been developing software and a network for operating the seismic monitoring system using the
Internet to send/receive the measured data.
Development of Seismic Design Criteria for Transmission and Substation Facilities. Transmission and
substation facilities are connected by a network system throughout the Korean peninsula. Power shutdown due
to an earthquake is expected to bring about social confusion and economic loss. Equipment damage due to
anchor and support break down including bushing breakage is the major vulnerability of transmission and
substation facilities to earthquakes. Based on the vulnerability of equipment and other important factors to be
considered, seismic criteria were categorized as shown in Table 5.1~5.4 .
In the future, attention will focus on applicability of the design criteria, guidelines for seismic evaluation,
retrofitting of existing facilities, and institutionalization of the developed criteria.
Table 5.1 Performance goals of transmission and substation facilities
LevelARP Serviceability Collapse
50 yrs Ⅱ
100 yrs Ⅰ
500 yrs Ⅱ
1000 yrs Ⅰ
Table 5.2 Seismic area factors
Zone Zone 1 Zone 2
Area Factor (g) 0.11 0.07

Earthquake Response Cooperation in APEC 94
Table 5.3 Seismic hazard factors
APR(yrs) 50 100 200 500 1000 2400
Hazard Factor 0.4 0.57 0.73 1 1.4 2.0
Table 5.4 Technical criteria of transmission and substation facilities
Facility Seismic category
Electric equipment &structures
- 345kV and above : Seismic category Ⅰ- 154kV to less than 345kV : Seismic category Ⅱ
Buildings - Seismic category Ⅰ
Transmission tower - not considered (wind load governed)
Underground cable structure - Seismic category Ⅰ& Ⅱ
PSRs for Korean NPPs have been implemented since 2000. Based on the research activities related to
seismic re-evaluation for the existing NPPs, several technical issues have been addressed with countermeasures
and improvements. For evaluation of capable faults and estimation of maximum credible earthquake for NPP
sites, it is necessary to develop capable fault criteria suitable for Korean geological environments. Based on the
new capable fault criteria, previously known Quaternary faults will be re-evaluated for the activity of faults and
its effect on NPPs. Historical earthquakes should be reevaluated to estimate maximum credible earthquake.
Based on the measured earthquake recorded, an attempt was made to develop a site-specific response spectrum.
It is expected that earthquake observatory networks installed on the outskirts of NPP sites will be of great use to
identify seismic activity. For reducing uncertainties of the PSHA, research work was performed. However,
uncertainties of the input parameters for PSHA should be reduced. For better PSHA, an attenuation curve based
on the strong earthquakes is required. Seismic qualification of equipments for the USI A-46 NPPs is being
undertaken. GERS for Korean NPPs are required and anchor system for equipments should be reevaluated with
seismic walkdown. The post-earthquake procedure including selection of base lines and a seismic damage
indicator has been developed to provide guideline for better post-shutdown inspection and testing. Further
investigation is required to develop guidelines for long-term evaluations. Seismic safety review for all power
facilities including not only fossil and hydraulic power facilities but also transmission and substations is in
progress. It is expected that old fossil and hydraulic facilities will be strengthened based on the results of the
seismic safety review.

Earthquake Response Cooperation in APEC 95
5.2. Liquid Fuel System
5.2.1. Chinese Petroleum Cooperation Emergency Response Plan
The state-owned Chinese Petroleum Cooperation (CPC)has been Taiwan’s sole petroleum product
supplier for the past 50 years. Their Emergency Response Plan is very well organized and outlines procedures
for forming a Crisis Management Commend Center, the Crisis Management Commend Structure, and the
practice and prevention plan.
Emergency Response Planning When there a disaster situation occurs that relates to Chinese
Petroleum Cooperation, CPC will set up a Crisis Management Commend Center to organize different CPC
departments and handle the disaster situation. Potential disasters include natural disasters (typhoon, flood,
drought, earthquake), accidental disasters (fire, explosion), leakage (oil, gas, wastewater), energy supply
shutdown, and others. The Crisis Management Commend Center has several groups to handle the emergency
situation, and when the emergency situation has passed, CPC will implement a series of follow-up activities.
CPC will conduct routine disaster prevention training, such as planning task force emergency response
procedures, planning and practicing natural disaster rescue procedures, preparing emergency rescue tools,
testing and modifying rescue tools, building up emergency contact channels and support systems, and
familiarizing personnel with the emergency response procedure.
When a disaster happens, the Crisis Management Command Center will have several groups handling
the situation. These include:
1. Rescue and Contamination Control
This group will focus mainly on rescue and reducing damage, isolating dangerous systems, and keeping
guard over developments. In addition, it will also need to maintain ordinary function, restore contaminated
areas, and move or clean up contaminated waste.
2. Contaminated Area Verification and Adjustment
This group needs to collect evidence, verify the condition of contaminated or damaged area, and set
reimbursement principles for the damaged or contaminated area or people in the area.
3. Investigation
This group will investigate the cause of disaster, identify responsibility, and focus on prevention of
future disasters.
4. Public Relations
The public relations group not only needs to disseminate correct information to the media , but also
needs to receive government authorities, and comfort/settle affected people.

Earthquake Response Cooperation in APEC 96
5. Supporting Group
This group needs to furnish the Crisis Management Command Center and back it up with supporting
material.
6. Report and Coordinate
This group needs to report emergency situations to government authorities and look for help from
government.
When the disaster is under control, follow-up work begins. This includes:
Emergency response pros and cons discussion.
Continual communication and negotiation with disaster-effected people, government, or companies.
Damage justification and restoration.
Attribution of responsibility.
Showing appreciation to support of government, police or army.
Show concern for damaged neighborhoods and build up positive image for media.
Practice and Prevention CPC has a well-organized training procedures to practice for emergency
situations. CPC conducts two oil leakdrills each year, 220 fire response drills, 18 no-advance-notice emergency
response practice drills, 35 Crisis Management Command Group organization drills as well as emergency
response practice discussion and improvement. Regarding disaster prevention, CPC believes there is still work
needed. This has been divided into two parts:
In System:
Construct a formal structure and reinforce security management.
Improve the security infrastructure.
Build up a completely management system in facilities and infrastructure.
Make a four-level modification system.
Reinforce security management of contractor companies.
Build up system of automated examination and maintenance.
Accelerate examination and test procedures on underground oil and gas pipeline replacement.
Review Standard Operation Procedures.
Execute security and sanitary education training.
Build up transportation security management system.
In Facility:
Integrate fire fighting system and oil leak prevention system.
Integrate a management system for oil and gas pipelines.
5.3. Natural Gas Systems

Earthquake Response Cooperation in APEC 97
5.3.1. Osaka Gas
The earthquake damaged 12,000 low-pressure pipe sections. Fortunately, however, there was no major
secondary disaster caused by gas leakage. The company’s main facilities, such as LNG receiving terminals and
high-pressure trunklines, suffered no damage. New-type welded steel pipes and polyethylene pipes were also
hardly damaged. Intelligent gas meters with automatic shut-off devices installed for individual customers
functioned effectively. The repair of damaged pipelines and inspection of individual customers’ pipes for safety
was time-consuming work. Osaka Gas took 85 days to restore service to all 860,000 customers who had their
gas supply suspended by the earthquake.
Osaka Gas plans three steps to prepare for future disaster:
1. Based on its experience, Osaka Gas needs to improve the existing automatic information collection and
display system. For emergency response, including gas supply suspension, Osaka Gas believes an
independent information gathering system is required, rather than the company waiting for information
from administrative organs or customers.
2. Osaka Gas would like to improve the existing automatic shut-off system of gas meters that stops gas flow
when earthquake motion reaches a certain preset level. Since it is difficult to reach to disaster-stricken
areas by vehicles quickly enough to operate individual controls, an automatic or remote control shut-off
system is necessary.
3. Osaka Gas would like to improve existing earthquake drills for employees in preparation for the worst
possible emergency case.
After the Great Hanshin Earthquake, Osaka Gas reviewed its countermeasures against earthquakes and
produced the “5-Year Anti-Earthquake Plan”(1995 to 1999). The Plan focuses on Preventive, Emergency and
Restoration measures.
Emergency measures refer to hardware and software that are necessary to take prompt emergency
response actions during the first several hours after an earthquake. In other words, emergency measures aim to
prevent secondary disasters in earthquake-stricken areas and ensure safe and continued gas supply to areas not
severely damaged by the earthquake. Osaka Gas has established the following five emergency measures.
1. Installation of additional seismometers
2. Installation of an earthquake damage prediction system
3. Subdivision of the isolation blocks into smaller units.
4. Establishment of an advanced gas supply shut-off system on pipelines
5. Reinforced information collection function, including Construction of Back-Up Control Center.
The basic actions to be taken in an emergency are to identify areas of severe damage quickly and
correctly and immediately stop the gas supply in those areas. With the installation of additional seismometers,

Earthquake Response Cooperation in APEC 98
Osaka Gas will be able to obtain accurate information of ground motion caused by an earthquake. Based on this
information collected, the company can conduct computer simulations to estimate pipeline damage in stricken
areas and determine their gas supply suspension. Values recorded by the seismometers are transmitted each five
minutes to the Distribution Control Center in the company head office and to its Back-Up Control Center
through a radio communication network system. Next, based on the values recorded by the seismometers, the
earthquake damage prediction system estimates the degree of pipeline damage and the number of collapsed
houses in each grid of a mesh chart (1 grid: 300 x 400 m). Simulation of damage for the entire service area with
a total of 25,000 grids will be completed in about 15 minutes after an earthquake occurs. According to the data
from the seismometers and the damage prediction system, the company can determine whether or not it should
continue gas supply in each block.
By subdividing the service area into smaller blocks, the company is able to have more precise control of
supply suspension operations. Individual blocks are isolated from each other and gas supply can be controlled
independently. The plan calls for subdivision of the entire service area from the current 55 blocks to 120, each
containing about 50,000 customers. By reducing the size of each isolated block by half, the company can
restrict gas supply suspension only to those areas, which are severely damaged.
When the Great Hanshin Earthquake occurred, Osaka Gas was using two types of shut-off control:
intelligent gas meters installed at individual user locations and the super-block shut-off system on pipelines that
controlled gas supply in the medium pressure A pipelines. After the earthquake, they added two more shut-off
systems. One is an automatic shut-off system incorporated in the low-pressure lines that is activated when a
preset earthquake motion is detected. The set value is an SI value of 60 kines (cm/sec). The system is built into
the 3,000 regulators of low-pressure gas pipes. The second system is a remote control device for medium
pressure B pipelines. This system can be operated from the Distribution Control Center at the head office and
the Back-Up Control Center by the radio network system.
With the use of this radio network system, the company can continuously monitor the pressure levels and
flow rates at both inlet and outlet sides of the regulators. This system not only allows abnormalities to be
detected during disasters but also continuously provides useful information for ordinary gas supply operations.
To strengthen the information-gathering function, Osaka Gas has improved its radio network system, thus
enhancing the communication infrastructure necessary for smooth execution of disaster preventive measures.
The company has also installed satellite communications equipment as a backup for telephone lines. The Back-
Up Center began operation in March 1998 located in Kyoto, which is 50 kilometers away from the head office
in Osaka. It immediately takes over control functions in case the Distribution Control Center at the head office
stops functioning due to an earthquake or other reasons. The Back-Up Control Center is attended by two
operators working around the clock. A total of seven persons including five in the Distribution Control Center
work together to monitor and control gas supply operations.
Should a large earthquake strike Osaka and prevent the Distribution Control Center from collecting
information, issuing instructions and controlling facilities remotely, the Back-Up Center takes over these
functions. Osaka Gas is striving to establish comprehensive disaster “preventive measures,” “emergency

Earthquake Response Cooperation in APEC 99
measures” and “restoration measures”.
5.3.2. Seismic Disaster Prevention System in Chinese Taipei
Taiwan is located in the Circum-Pacific Seismicity Belt, hence, earthquakes happen frequently. After
experiencing numerous earthquakes, the gas association realized that emergency response training and
restoration experience is vital to reduce the impact of disasters and to improve gas supply security. If an
earthquake destroys gas pipelines, life and property will be endangered.. Thus, there is a pressing need for gas
companies to be able to ascertain damage immediately and to control it. The Seismic Disaster Prevention
System for Gas Facilities is designed to: Reduce damage to gas facilities damage and prevent disaster. When an
emergency situation occurs, mitigate against secondary disasters, such as fire or explosion. If the gas supply is
stopped, follow the restoration plan and restore supply to customers as soon as possible. If damage is very mild,
supply should continue.
Earthquakes have the potential to crack ground pipelines through seismic dragging, or break pipelines
through building collapse. Gas facilities must implement preventative design. For instance, outdoor ground
pipelines and gas pressure regulators should use welding joins; indoor pipelines should be fixed on walls or
pillars to prevent shaking. Thus, the Seismic Disaster Prevention System in Gas Facilities can be reinforced in
the following three aspects: Prevention, Emergency Response, and Restoration.
Prevention
The program to reduce earthquake damagehas three dimensions. First, predicting the seismic disaster
scale. Second, setting earthquake mitigation measures. Third, setting an emergency response plan and
restoration plan.
Predicting earthquake scale. Prediction of the scale of seismological damage must start with geological
character and ground motion data, then evaluation of the seismic standard of facilities, pipelines and their join
materials. The information needed includes the geological structure of the ground, geological character and
faults of the ground, liquefaction data, geological data from bore holes, shaking of the ground, historic
earthquake data, fault fracture area data, and predictions of the likely scale of earthquakes over 50 years.
Re-evaluating the seismic standards of supply facility and pipeline:
Design different seismic standard policy and measures for different facilities.
Consider emergency shut down functions, fire fighting ability, and spare capacity electricity.
Seismic upgrading with new technology and new construction methods.
Investigation of the problem of ground liquefaction for high-pressure pipelines.
Strengthen fragile but important facilities.
Strengthen facilities that satisfy regulations.

Earthquake Response Cooperation in APEC 100
Replace the easily damaged facilities with new and seismically upgraded facilities.
Strengthen supporting and seismic standards for construction.
Use seismically-upgraded material.
Seismic tolerance evaluation of affiliated supply facilities, such as electricity facilities, meters , and support
materials.
Seismic standard evaluations of Emergency Repair Center, Monitoring Center, and Gas Pressure Regulator
Station.
Routine anti-earthquake countermeasures cannot only reduce secondary disasters but also can help with
rapid restoration. The routine anti-earthquake measures are as follow:
Follow standard design and construction methods.
The standard design and construction methods can refer to the standards of the Gas Association, Chinese
Taipei, and the standards of the Japan Gas Association.
Gas supply computer automated monitoring system.
Gas companies use the SCADA system, which incorporates earthquake monitoring to show earthquake
scale and offer this information for evaluation. When a severe earthquake strikes, the remote system will shut
down the entry emergency valve of storage ball tanks, high and medium pressure regulator stations and high
and medium pressure pipelines. When the seismic standard reaches 30-40 KINE, local gas pressure regulator
stations can automatically shut down the local gas supply.
Seismically upgrading gas storage tanks.
When designing gas storage tanks, seismic security should be considered in the tank structure. The
expansion joints that connect the storage tank and the pipeline should be able to absorb the displacement and
stress caused by an earthquake. The entry of the gas storage tank should incorporate an emergency shut down
valve, which can be shut down when the pressure is too high or too low. In addition the emergency shut down
valve can be remote controlled through the computer’s automatic monitoring system of gas supply. When the
pressure of the storage tank reaches the maximum permitted, the gas should be released outside.
1. Seismically upgrading measures in gas pressure regulator stations.
The design and construction of gas pressure regulator stations should follow the building code. The
pipelines of gas pressure regulator stations at the entry point will form a siphon three-D pipe to meet seismic
standards. Moreover, the pipeline should also incorporate an emergency shut down valve and this should be
coordinated with the earthquake scale meter and high-pressure shut off function. The affiliated facilities of gas
pressure regulator stations, such as: electricity equipment, communication equipment and meter equipment,
should also meet the seismic standards.

Earthquake Response Cooperation in APEC 101
2. Seismically upgrading pipelines.
Underground pipelines may be damaged due to many reasons; however, the main reason is earthquakes.
To cope with shaking, slip, and liquefaction, new pipelines should use high strength and tension steel pipelines
or PE pipelines to meet the seismic standards. Since changing old underground pipelines is expensive, the only
way is to strengthen old pipelines’ seismic standards, such as by increasing ESV, and separating the low-
pressure pipeline area. There are several ways to seismically upgrade original pipelines and offset pipelines.
High and medium pressure original pipelines and offset pipelines should use high strength and tension
steel pipeline or PE pipeline to meet the seismic standard. Low-pressure original pipeline and offset
pipelines should use PE pipeline.
Pipelines that hang on bridges should use loop pipeline.
Divergences of original pipeline and offset pipeline should use loop pipeline.
Emergency shut down valves should be installed in bridges, tunnels, and underpasses and connected with
earthquake scale sensors.
Emergency shut down valves should be installed in high and medium pressure pipeline.
Hand-operated emergency shut down valves should be installed in offset pipelines.
Hand-operated emergency shut down valves should be installed in the offset pipeline where it goes into the
firebreak.
A hand-operated shut down valve should be installed in the lead-in pipeline section of customer medium
pressure pipelines.
3. Adopt gas usage security equipment.
4. Set up a 24hr emergency repair center.
5. Regularly maintain and inspect.
The emergency response plan and restoration plan The gas company should have an emergency
response plan for “swift repairs, emergency supply, and restoration of the facility”. Since earthquakes usually
cause facility or pipeline damage and result in emergency situations such as gas leakage or supply shut down,
the gas company should be able to dispatch service people immediately to handle the emergency situation and
to secure the supply.
The steps in the response plan are as follows:
1. Set rescue timetable
2. Organize personnel and organization.
3. Contact the authorities/ government.
4. Request support from other gas companies or related organizations.
5. Establish crisis management center and communications.
6. Storage and replacement of emergency rescue material and tools.

Earthquake Response Cooperation in APEC 102
7. Set emergency response measures.
8. Set emergency response procedures.
9. Assign duties and rescue areas.
10. Train and practice emergency response measures.
The steps in the restoration plan as follows:(can be modify as is necessary)
1. Set the restoration scale and area.
2. Set the restoration manpower plan.
3. Organize the restoration manpower duties and groups.
4. Set the restoration time schedule.
5. Set priority of restoration.
6. Set restoration procedures.
7. Set temporary gas supply measures when the gas supply is halted.
8. Identify restoration materials and tools.
9. Set communication rules.
10. Organize support system.
11. Identify separate restoration areas.
12. Inform customers when the gas supply is stopped.
13. Start the restoration.
14. Customer service measures.
15. Organize restoration data.
Emergency Response Policy
In order to prevent secondary disaster following seismic damage, the gas company should have an
emergency response plan to secure gas supply and reduce damage. The plan should follow the principle of
“swift repairs, emergency supply, and restoration of the facility”.
1.Organize the Crisis Management Center
If there a level 5 earthquake occurs in the service area, the gas company should establish the Crisis
Management Center, contact related employees and ascertain the damage situation.
2.Organize personnel and set divisions
Assign different job functions and divisions (Head Office Division, Emergency Rescue Division, Gas
Pressure Regulator Station Division, Material Division, Customer Service Division, Supporting Division)
under the Crisis Management Center.
3.Contact related authorities/ government

Earthquake Response Cooperation in APEC 103
Report to Energy Commission, Bureau of Economic Development, Police Station, Fire Department, Gas
Association.
4. Request support from other gas companies or related organizations
Contact nearby gas companies for support; contact water company, Tai Power, Chunghwa Telecom
Company.
5. Storage and replacement of emergency response materials and tools
The materials include substitute fuel, food, medicine and water. The tools include vehicles for
emergency rescue and communication equipment. Spare power in needed for the Crisis Management Center.
6. Setting Emergency Response Measures
Collect the damage information.
Organize rescue people, material, and tools.
Separate emergency gas suspension area.
Make a judgement if gas supply should be suspended.
7. Setting Emergency Response Procedures
Setting the priority of restoration of gas supply.
The first priorities for restoration are hospitals and schools.
Restore gas supply area-by-area according to capacity.
8. Arrange assignment and rescue areas
Unify the command authority of the Crisis Management Center.
Separate different assignments and set up different divisions.
Job assignment according to restoration schedule; ensure replacement personnel and materials available.
Offer related information to rescue groups.
9. Segregate emergency gas supply suspension areas according to disaster situation
The judgment of suspending gas supply is very important. It depends on the changes of gas supply
pressure, the location of gas leakage, the number of gas leaks, the seismic scale from meters, and facility
damage reports. . Planning for restoration, should include the following:
The whole supply area should have a two-way gas supply.
The medium pipeline should be circle style.
Restoration areas should be separated to accelerate restoration.
Pipeline damagewill differ according to seismic scale, ground character, and pipeline materials. Gas
supply in seriously damaged pipelines should be stopped right away to prevent secondary disaster. Supply

Earthquake Response Cooperation in APEC 104
should be maintained for slightly damaged pipelines . Thus, it is very important to separate gas supply areas
and have shut-down valves. The low-pressure pipeline net is not divided for shutdown yet. If the whole area’s
gas supply is stopped, the situation will be very secure, but restoration time and the materials, and manpower
needed for restoration will be vastly increased and this will lead to a lot of complaints from customers. Thus, a
well-designed plan that keeps a balance between security, customer service, and restoration time is very
important.
The principle on which gas supply areas are separated for halting supply is based on geology (faults,
and the earthquake impact in different areas), gas supply systems (the form of gas supply and the gas pressure
station situation), number of customers, usage amount, the supply area’s size and environmental situation, fire
fighting ability, convenience and the seismic standard of pipelines.
When damage to gas supply areas is slight, supply cut-off areas can be further divided or modified into
several smaller areas to accelerate the restoration schedule. When the earthquake impact is severe, the gas
supply will be shut down immediately at the customer end, since the supply is controlled by the gas security
facilities of tall buildings, business style security facilities, or micro-computer gas meter security systems.
5.4. Summary
Earthquake disaster countermeasures and response plans for electricity, liquid fuel, and natural gas are
introduced in this chapter. Japan and Korea’s earthquake hazard management plans are taken as examples for
electricity emergency response planning. Chinese Petroleum Cooperation of Chinese Taipei is the example for
liquid fuel, and both Osaka Gas of Japan and Greater Taipei Gas of Chinese Taipei are given as examples of
earthquake disaster countermeasures and response plans for natural gas utilities. The following measures are
recognized as essential to secure reliability of energy supply: ensuring sufficient seismic design of energy
supply infrastructure, decentralizing and introduced redundancy of energy supply bases, and multi-route
networking with several supply sources.