Embed Size (px)
Citation preview

1
GSA DATA REPOSITORY 2016157 1
Earthquake-triggered increase in biospheric carbon export 2
from a mountain belt 3
Jin Wang1,2,3, Zhangdong Jin1,4*, Robert G. Hilton2*, Fei Zhang1, Gen Li5, Alexander L. 4
Densmore2,6, Darren R. Gröcke7, Xiaomei Xu8, and A. Joshua West5 5
1State Key Laboratory of Loess and Quaternary Geology, Institute of Earth Environment, 6
Chinese Academy of Sciences, Xi’an 710061, China 7
2Department of Geography, Durham University, Durham, DH1 3LE, UK 8
3State Key Laboratory of Vegetation and Environmental Change, Institute of Botany, Chinese 9
Academy of Sciences, Beijing 100093, China 10
4Institute of Global Environmental Change, Xi’an Jiaotong University, Xi’an 710049, China 11
5Department of Earth Sciences, University of Southern California, Los Angeles, California 12
90089, USA 13
6Institute of Hazard, Risk and Resilience, Durham University, Durham, DH1 3LE, UK 14
7Department of Earth Sciences, Durham University, Durham, DH1 3LE, UK 15
8Department of Earth System Science, University of California, Irvine, Irvine, California 16
92697-3100, USA 17
*Corresponding authors: Zhangdong Jin: [email protected] 18
Robert G. Hilton: [email protected]. 19
20
21
2
Methods 22
Study site and sample collection: The Zagunao catchment is characterized by steep slopes 23
with relief of more than 3000 m (elevation ranging from 1400 m to 4450 m) along its 126 km 24
length, with high rates of mass wasting and fluvial sediment transfer (Liu-Zeng et al., 2011). 25
The geology (Fig. DR1B) consists of Proterozoic granitoids and high-grade metamorphic 26
rocks, Paleozoic passive margin sequence, metamorphosed Triassic Songpan-Ganze flysch 27
intruded by granitic plutons, and Mesozoic detrital sediments (Burchfiel et al., 1995; Robert 28
et al., 2010). The sedimentary and meta-sedimentary rocks contain POCpetro (Fig. 1A). The 29
regional climate is dominated by the East Asian and Indian summer monsoons, with 70%–30
80% of the precipitation falling between May and October. As a result, water discharge and 31
suspended-sediment discharge of the Zagunao River are strongly seasonal, with the majority 32
of the discharge occurring from May to August (Liu-Zeng et al., 2011; Wang et al., 2015). 33
The main land use comprises native forest (43%) and shrub land (41%) with small areas of 34
agriculture (Fig. DR1C and Table DR2, Editorial Committee for Vegetation of China, 35
Chinese Academy of Sciences, 2007). Reforestation has occurred since 1990s following 36
large-scale land use change in the 1950s-1970s (Cui, 2013). Soils in the catchment mainly 37
consist of Matti-Gelic Cambisols, Mollic- or Umbri-Gelic Cambosols, Hapli-Udic Cambosols 38
and Hapli-Ustic Cambosols (He et al., 2006). 39
The Sangping station is located just above the confluence of the Zagunao River with 40
the Min Jiang main stem in Wenchuan town, ~30 km from the Yingxiu-Beichuan fault, and 41
~67 km from the 2008 earthquake epicenter (Fig. DR1). The Zagunao station is located in the 42

3
town of Lixian, 56 km upstream from the Sangping station. The Chinese Bureau of 43
Hydrology (CBH) collected suspended load samples (Wang et al., 2015) 1 to 8 times per day 44
at both stations from April to October over the 2005 to 2009 period. These samples were 45
collected by filtering 2 or 4 L water through ~1 μm paper filters (Ministry of Water Resources 46
of China, 2007). Suspended load samples were also collected weekly by CBH staff from 47
2009 to 2010, in this case optimizing collection procedure for geochemical analysis. For 48
those samples, 1 L water was passed through a 0.7 μm glass fiber (GF/F) filter which was 49
then dried at 60ºC and stored in a petri dish. We found that the SSC results are consistent for 50
samples collected using the two different methods (y = 1.02x, r2 = 0.88, n = 20), meaning that 51
the sampling methods are directly comparable. Sand-sized river bed materials were collected 52
at both stations at low flow in January 2014. Qw and SSC were measured daily by the CBH 53
(Liu-Zeng et al., 2011; Wang et al., 2015). 54
Geochemical analysis: 143 suspended load samples collected during 2005–2009 were 55
removed from the CBH paper filters using gentle agitation with a spatula. Among them, eight 56
large suspended load samples were wet sieved into clay and silt (<63 µm), fine sand (63–250 57
µm), and coarse sand (>250 µm)fractions. Samples collected with GF/F filters during 2009–58
2010 (n = 11) were rinsed from the membrane using deionized water in glass beakers and 59
then dried at 80ºC. All suspended sediments were homogenized using a mortar and pestle and 60
stored in vials. The bed materials (n = 2) were homogenized usingvibrationgrindingmill to 61
pulverize them into fine-grained size. Inorganic carbon was removed from all samples using a 62
4 M HCl leach for 4 h at 80ºC to remove all detrital carbonates phases (Galy et al., 2007; 63
4
Hilton et al., 2008, 2010). Samples were rinsed with deionized water and dried at 80ºC and 64
stored in glass vials.65
[OCtotal] was determined bycombustion at 1020°C in O2 within a Costech CHN 66
elemental analyzer (EA), normalized to standards and corrected for internal blanks. Stable 67
carbon isotopic composition (δ13Corg, ‰) was determined by continuous flow from the EA 68
coupled via CONFLO-III to a Thermo-Delta-V isotope ratio mass spectrometer (Hilton et al., 69
2008, 2010) in the Stable Isotope Biogeochemistry Laboratory, Durham University. Values 70
were normalized by measured values of standards, corrected for the full procedural blank 71
(including filter paper – see discussion below) and reported in δ13Corg notation relative to 72
VPDB (Table DR2). 73
Radiocarbon (14C) activity of 33 POC samples was measured by accelerator mass 74
spectrometry (AMS) after carbonate removal and graphitization at the Keck-Carbon Cycle 75
AMS Facility at the University of California, Irvine, USA. Sample preparation backgrounds 76
were subtracted based on measurements of 14C-free coal. Radiocarbon activity is reported as 77
the ‘fraction modern’ (Fmod) (Table DR2) following convention (Stuiver and Polach, 1977). 78
Because the suspended load samples from 2005–2009 were collected on paper filters, 79
we quantified the filter blank in detail to estimate the contribution of C from the paper to the 80
samples. To do this, torched (>600ºC) quartz sand replicates of five different masses 81
representative of the sample set (duplicates at 0.1 g, 0.2 g, 0.5 g, 1.0 g, 3.0 g and 5.0 g, total n 82
= 12) were mixed with 1 L deionized water and processed following the same sample 83
filtering procedure as used by the CBH. The C contribution from the filter (mgC) was 84

5
quantified as a function of sediment sample size (mg) (Fig. DR5). In the samples from 2005–85
2009, the blank C mass represented < 5% of the organic carbon content (mgC) of the samples 86
and [OCtotal] was corrected as a function of sample mass. The correction for stable isotope 87
composition was negligible, i.e., within the 0.2‰ precision. We also quantified the Fmod of 88
the blank to be 0.91, based on a mixture of 4 blank samples (to gain enough C for 14C 89
analysis). The Fmod measurements of suspended load samples collected on paper filters 2006–90
2009 were corrected for this blank. However, the absolute Fmod values were modified by 91
<7%, which does not impact the subsequent analysis and interpretation, nor the comparison 92
between these samples and those collected with the GF/F filters (2009-2011). 93
End-member mixing analysis: Following the approach of Galy et al. (2008), we assessed 94
the mixing of POCbiosphere and POCpetro in a river sediment mixture using: 95
OC OC F OC (1) 96
OC OC OC (2) 97
where Fmod, Fmod-bio, and Fmod-petro are the radiocarbon compositions of the total, biospheric, 98
and petrogenic POC, respectively; and [OCtotal], [OCbiosphere], and [OCpetro] are the contents of 99
POCtotal, POCbiosphere, and POCpetro in the bulk river sediment mass (expressed as % of dry 100
weight). Because we can assume that Fmod-petro = 0 (radiocarbon-dead), equations (1) and (2) 101
are simplified as: 102
OC OC OC (3) 103
When the ‘modern POC’ (Fmod × [OCtotal]) is plotted as a function of [OCtotal], a linear trend 104
indicates that samples have similar [OCpetro] and 14C activity of the POCbiosphere component. 105

6
This has been demonstrated for river depth profiles (Galy et al., 2008) and for temporal 106
collection of samples from well mixed, small mountain rivers in Peru (Clark et al., 2013), 107
suggesting that it should be applicable to the analogous Zagunao River. The Fmod-bio is given 108
by the slope of (Fmod × [OCtotal]) vs. [OCtotal] relationship, while the average [OCpetro] is 109
determined from the intercept. The linear trends for suspended sediments at both stations (P < 110
0.01) (Fig. DR3) suggest that the samples can be well described by this mixture, with a 111
relatively constant [OCpetro] and Fmod-bio. 112
At the Sangping station, we calculated the mean [OCpetro] = 0.33% ± 0.05% (±1σ, n = 113
18), similar to that calculated for the Zagunao ([OCpetro] = 0.31% ± 0.10%, n = 9). These 114
values are similar to the carbon content of river bed materials, which have a very low Fmod 115
(Fig. 1A) and [OCtotal] between 0.18% and 0.52%, supporting the results of the mixing 116
analysis. Our mixing analysis suggests that Fmod-bio is younger and less variable at Sangping 117
(Fmod-bio = 0.99 ± 0.04) when compared to the upstream site (Fmod-bio = 0.91 ± 0.11). This may 118
suggest input of pre-aged soil in the upstream, higher elevation parts of the catchment, in 119
analogy with other studies of POC in rivers draining the Tibetan Plateau (Galy and Eglinton, 120
2011; Tao et al., 2015). This observation is worthy of further investigation but lies outside the 121
scope of the current study. After obtaining the Fmod-bio for each station, we determined the 122
[OCbiosphere] and [OCpetro] for each sample with 14C analysis by equations (2) and (3). 123
POCbiosphere discharge: Using the daily Qw and SSC, the daily, 6 monthly and annual 124
suspended-sediment discharge (Qss, Mt yr-1) were calculated (Wang et al., 2015). The 125
standard deviation of daily repeat SSC measurements (10%, Wang et al., 2015) was used as 126

7
the error of SSC and was propagated into estimates of Qss (Table DR3). The POCtotal 127
concentration and SSC show a power-law relationship (Fig. 1B, Table DR1). The daily 128
POCtotal discharge was estimated based on this relationship, applied to the daily Qw. The 129
annual POCpetro discharge was calculated by multiplying the [OCpetro] at each station from the 130
end-member mixing model (Fig. DR3) times the annual Qss. The difference between POCtotal 131
discharge and POCpetro discharge is the POCbiosphere discharge. Errors were propagated from 132
the uncertainties on Qss (Wang et al., 2015), [OCpetro] (see previous section), and the 133
relationship between SSC and POCtotal concentrations (Fig. 1B). Because the daily water 134
discharge and suspended sediment concentration are not available in 2005 but are available in 135
2011, we calculated the sediment and POC discharge from 2006 to 2011. 136
Erosion of POCbiosphere by earthquake-triggered landslides: The organic carbon stock in 137
vegetation and soil in the Longmen Shan range varies from 10.5 ± 0.7×10³ tC km-2 for 138
grassland to 62.9 ± 5.4×10³ tC km-2 for fir forest (Xian et al., 2009). Using the land cover of 139
the Zagunao catchment (Fig. DR1C, Editorial Committee for Vegetation of China, Chinese 140
Academy of Sciences, 2007), we estimated an average POCbiosphere stock on hillslopes of 30.0 141
± 2.0×10³ tC km-2, of which 47% is present as soil organic matter (Table DR2). These carbon 142
stocks were combined with the mapped landslide areas (Li et al., 2014) to quantify the 143
landslide input of POCbiosphere, following published methods (Restrepo et al., 2009; Hilton et 144
al., 2011; West et al., 2011). 145
Model of POCbiosphere export and degradation: To assess the fate of earthquake-mobilized 146
POCbiosphere beyond the timescale of sample collection (Fig. 2), we modeled the combination 147

8
of geomorphic POCbiosphere export by rivers and biochemical degradation (i.e. oxidation) of 148
POCbiosphere in the landscape. The model assumes: i) one-time input of eroded POCbiosphere by 149
earthquake-triggered landslides; ii) transport-limited export of POCbiosphere by a mountain 150
river; and iii) biological degradation of mobilized POCbiosphere by heterotrophic respiration in 151
the landscape. Regarding i), the post-seismic triggering of landslides on weakened hillslopes 152
may cause subsequent inputs of POCbiosphere to rivers (Dadson et al., 2004), but volumes of 153
post-earthquake landslides associated with the Wenchuan earthquake are thought to be <20% 154
of the co-seismic volumes (Li et al., 2016), so it is unlikely that these inputs are important in 155
our analysis. The assumption of transport-limited export is supported by observations of the 156
current rate of POCbiosphere discharge from the study reach (Fig. 2). However, the model could 157
be refined by measurements which constrain the nature and processes of POCbiosphere export, 158
and the degree to which supply-limited export is important (West et al., 2014). The third 159
assumption may overestimate the degradation rate because it assumes the same biochemical 160
conditions present in landslide deposits as in soil (Trumbore, 2000). This may not occur if the 161
soil structure has been destroyed during mass wasting, in which case degradation may be less 162
efficient (Restrepo et al., 2009). In addition, the model considers only a single pool of 163
POCbiosphere. The model could be refined by including multiple pools of varying reactivity 164
(Trumbore, 2000; Blair and Aller, 2012); however, we note that these would predict that 165
POCbiospehre would reside for longer in the environment. 166
With these caveats in mind, the fate of earthquake-mobilized POCbiosphere remaining 167
within the landscape, Mc (tC), at time t (yr) can be described as: 168

9
dM /d E M (4) 169
where constant k is organic carbon decomposition rate in % yr-1 (Trumbore, 2000; Blair and 170
Aller, 2012) and Er is the export rate of POCbiosphere by a mountain river (tC yr-1). Under 171
transport-limited conditions, Er was assumed to be constant after the earthquake. The 172
decomposition rate constant k is the inverse of the organic carbon turnover time. The overall 173
mean global carbon turnover time of the terrestrial biosphere has been estimated to be 23 174
(+7)/(-4) years (i.e., k ≈ 5% yr-1) (Carvalhais et al., 2014). However, lower than global 175
average annual precipitation and temperature in the Longmen Shan suggests that organic 176
matter turnover times may be lower than the global average (Xian et al., 2009). We used a 177
turnover time of 50 years (k = 2% yr-1) as an upper bound, which also considered the longer 178
than 50 years residence of organic matter in soils (Trumbore, 2000). Model outputs were 179
computed across the river reach where we had upstream and downstream fluxes to quantify. 180
Subtracted the background POCbiosphere erosion (948 ± 369 tC yr-1) from the total (3478 ± 181
1599 tC yr-1), the POCbiosphere erosion attributed to the earthquake-triggered landslide is Er = 182
2539 ± 1641 tC yr-1. We have mapped the landslides triggered by the earthquake to quantify 183
Mc0 = 215,000 ± 14,000 tC. The model was run with variable k, reflecting rapid degradation 184
(k = 2% yr-1), moderate degradation (k = 0.5% yr-1), and no degradation (k = 0% yr-1) (Fig. 3). 185
REFERENCES CITED: 186
Burchfiel, B.C., Chen, Z., Liu, Y., and Royden, L.H., 1995, Tectonics of the Longmen Shan 187
and adjacent regions, central China: International Geology Review, v. 37, p. 661–735, 188
doi:10.1080/00206819509465424. 189

10
Carvalhais, N., et al., 2014, Global covariation of carbon turnover times with climate in 190
terrestrial ecosystems: Nature, v. 514, p. 213–217, doi:10.1038/nature13731. 191
Clark, K.C., Hilton, R.G., West, A.J., Malhi, Y., Gröcke, D.R., Bryant, C.L., Ascough, P.L., 192
Robles, A., and New, M., 2013, New views on old carbon in the Amazon river: Insight 193
from the source of organic carbon eroded from the Peruvian Andes: Geochemistry, 194
Geophysics, Geosystems, v. 14, p. 1644–1659, doi:10.1002/ggge.20122. 195
Cui, Q., 2013, Impact of landcover change and climate change on ecohydrological process in 196
Zagunao Watershed, Upper Minjiang: PhD thesis, Chinese Academy of Forestry (in 197
Chinese). 198
Dadson, S.J., et al., 2004, Earthquake-triggered increase in sediment delivery from an active 199
mountain belt: Geology, v. 32, p. 733–736, doi:10.1130/G20639.1. 200
Editorial Committee for Vegetation of China, Chinese Academy of Sciences, 2007, The 201
Vegetation Map of the People's Republic of China (1:1000000): Beijing, Geological 202
Publishing House. 203
Galy, V., Beyssac, O., France-Lanord, C., and Eglinton, T., 2008, Recycling of graphite 204
during Himalayan erosion: a geological stabilization of carbon in the crust: Science, v. 205
322, p. 943–945, doi:10.1126/science.1161408. 206
Galy, V., and T. Eglinton, 2011, Protracted storage of biospheric carbon in the Ganges-207
Brahmaputra basin: Nature Geoscience, v. 4, p. 843–847, doi:10.1038/ngeo1293. 208
He, F., Liu, X., Mu, C., Zheng, S., Feng, Y., and Wang, M., 2006, Research on the 209
corrrelation of plant species-area with shady slope and sunny slope and different 210

11
altitudes in the arid-valley region of the Zagunao River: Journal of Sichuan Forestry 211
Science and Technology, v. 27, p. 31–34 (in Chinese). 212
Hilton, R.G., Galy, A., Hovius, N., Horng, M.-J., and Chen, H., 2010, The isotopic 213
composition of particulate organic carbon in mountain rivers of Taiwan: Geochimica et 214
Cosmochimica Acta, v. 74, p. 3164–3181, doi:10.1016/j.gca.2010.03.004. 215
Li, G., West, A.J., Densmore, A.L., Hammond, D.E., Jin, Z., Zhang, F., Wang, J., and Hilton, 216
R.G., 2016, Connectivity of earthquaketriggered landslides with the fluvial network: 217
Implications for landslide sediment transport after the 2008 Wenchuan earthquake: 218
Journal of Geophysical Research: Earth Surface, doi:10.1002/2015JF003718. 219
Liu-Zeng, J., Wen, L., Oskin, M., and Zeng, L., 2011, Focused modern denudation of the 220
Longmen Shan margin, eastern Tibetan Plateau: Geochemistry Geophysics Geosystems, 221
v. 12, Q11007, doi:10.1029/2011GC003652. 222
Ministry of Water Resources of China, 2007, Code for Measurements of Suspended Sediment 223
in Open Channels (GB50159-92): Beijing, China Planning Press (in Chinese). 224
Restrepo, C., et al., 2009, Landsliding and its multiscale influence on mountainscapes: 225
Bioscience, v. 59, p. 685–698, doi:10.1525/bio.2009.59.8.10. 226
Robert, A., Pubellier, M., de Sigoyer, J., Vergne, J., Lahfid, A., Cattin, R., Findling, N., and 227
Zhu, J., 2010, Structural and thermal characters of the Longmen Shan (Sichuan, China): 228
Tectonophysics, v. 491, p. 165–173, doi:10.1016/j.tecto.2010.03.018. 229
Stuiver, M., and Polach, H.A., 1977, Discussion: reporting of 14C data: Radiocarbon, v. 19, p. 230
355–363. 231

12
Tao, S., Eglinton, T.I., Montluçon, D.B., McIntyre, C., Zhao, M., 2015, Pre-aged soil organic 232
carbon as a major component of the Yellow River suspended load: Regional significance 233
and global relevance: Earth and Planetary Science Letters, v. 414, p. 77–86, 234
doi:10.1016/j.epsl.2015.01.004. 235
West, A.J., Lin, C.W., Lin, T.C., Hilton, R.G., Liu, S.H., Chang, C.T., Lin, K.C., Galy, A., 236
Sparkes, R.B., and Hovius, N., 2011, Mobilization and transport of coarse woody debris 237
to the oceans triggered by an extreme tropical storm: Limnology and Oceanography, v. 238
56, p. 77–85, doi:10.4319/lo.2011.56.1.0077. 239
Xian, J., Zhang, Y., Hu, T., Wang, K., and Yang, H., 2009, Carbon stock and allocation of five 240
restoration ecosystems in subalpine coniferous forest zone in Western Sichuan Province, 241
Southwest China: Acta Ecologica Sinica, v. 29, p. 51–55, 242
doi:10.1016/j.chnaes.2009.04.007. 243
13
Table Legends: 244
245
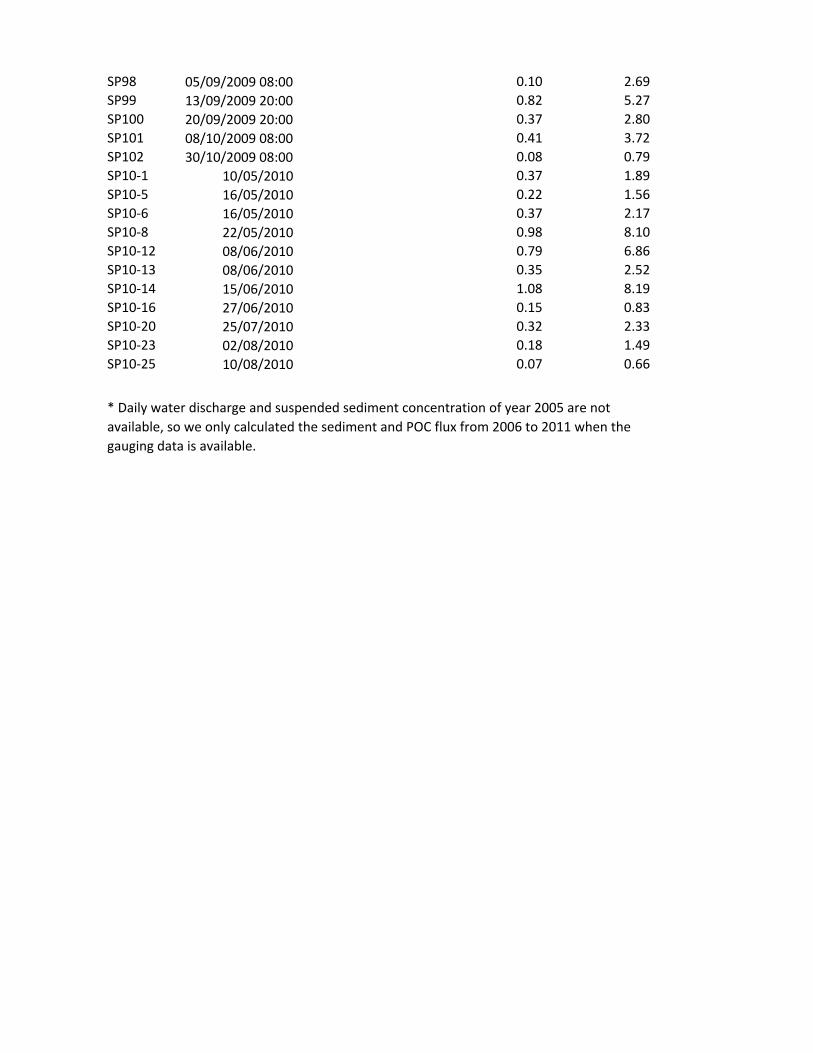
Table DR1. Suspended sediment samples from the Zagunao River. Suspended sediment 246
concentration (SSC, g L-1) and total particulate organic carbon concentration (POCtotal, mg L-247
1) for samples from the Sangping and Zagunao gauging stations as shown in Figure 1B. 248
249
Table DR2. Carbon isotope measurements (13C and 14C) of particulate organic carbon in 250
the Zagunao River. Organic carbon content ([OCtotal], %), stable carbon isotope (δ13Corg, ‰) 251
and radiocarbon activity reported as the ‘fraction modern’ (Fmod) have been corrected for a 252
full procedural blank (Fig. DR5). 253
254
Table DR3. Biospheric and petrogenic POC discharge over 6 month intervals from 255
2006–2011 for the two gauging stations on the Zagunao River. The errors on Qss, POCtotal, 256
POCpetro, and POCbiosphere discharge are propagated from the uncertainties of SSC (Wang et 257
al., 2015), [OCpetro], and the relationship between POCtotal and SSC (Fig. 1B, DR methods). P 258
runoff > 6 mm d-1 is the frequency of runoff large than > 6 mm d-1. All discharges are over 6 259
month time intervals. 260
261
Table DR4. Organic carbon stock in soil and vegetation within the Zagunao catchment. 262
The soil and total (soil + vegetation) carbon stock (tC km-2) were estimated using different 263
vegetation zones in the Longmen Shan (Xian et al., 2009), and the percentage of the 264
catchment area (%) was calculated using a GIS (Fig. DR1C, Editorial Committee for 265
Vegetation of China, Chinese Academy of Sciences, 2007). 266
267
268

14
269
Figure DR1. The Zagunao River catchment, Longmen Shan, China. A: Distribution of 270
vegetation cover revealed by Normalized Difference Vegetation Index (NDVI) from SPOT-4. 271
NDVI values >1 correspond to biomass and soil. B: Simplified geological map of the 272
Longmen Shan. C: Dominant vegetation types in the Longmen Shan (Editorial Committee for 273
Vegetation of China, Chinese Academy of Sciences, 2007). D. The landslide inventory of the 274
Zagunao River catchment (after Li et al., 2014). 275
276
277
278

15
279
Figure DR2. Grain size separates of POC from the Zagunao River. Stable carbon isotope 280
composition of POC (δ13Corg, ‰) versus fraction modern (Fmod) as per Fig. 1A, for suspended 281
load samples sieved at <63 µm (triangles), 63–250 µm (circles) and >250 µm (stars) for the 282
Sangping (blue) and Zagunao (red) gauging stations. Bulk river bed samples are shown as 283
squares. The grey bars show the end-members of petrogenic (lower right) and biospheric 284
POC (upper left). 285
16
286
287
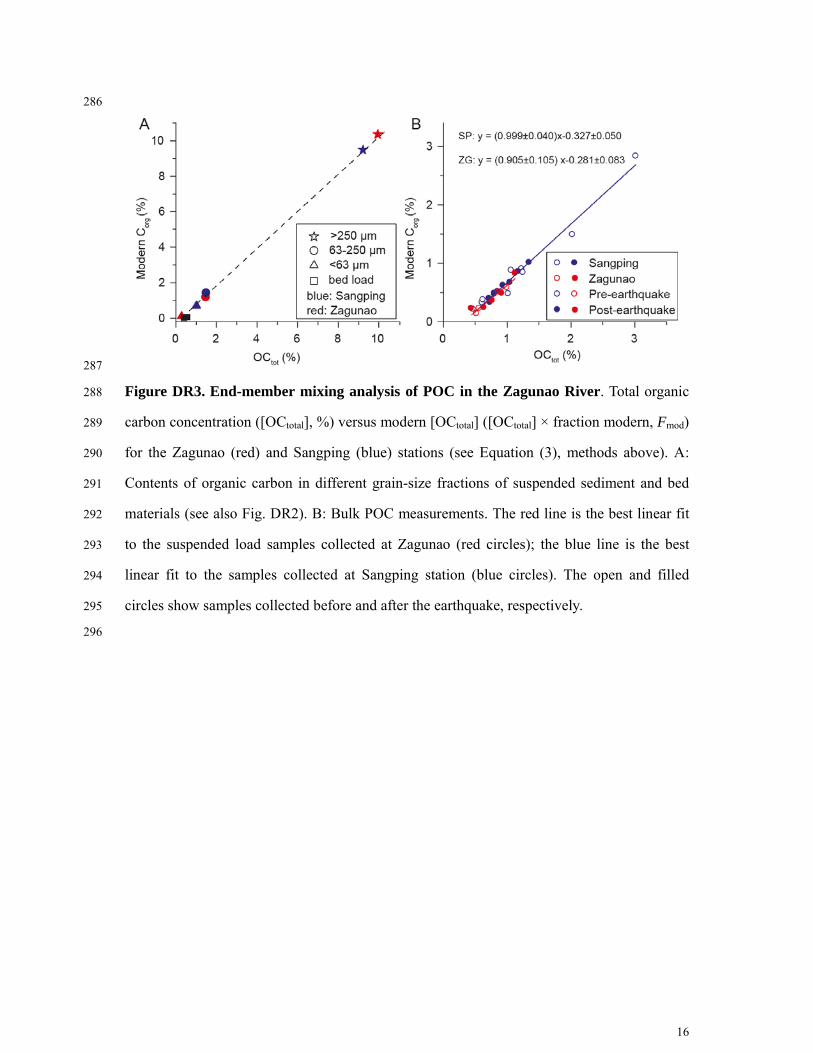
Figure DR3. End-member mixing analysis of POC in the Zagunao River. Total organic 288
carbon concentration ([OCtotal], %) versus modern [OCtotal] ([OCtotal] × fraction modern, Fmod) 289
for the Zagunao (red) and Sangping (blue) stations (see Equation (3), methods above). A: 290
Contents of organic carbon in different grain-size fractions of suspended sediment and bed 291
materials (see also Fig. DR2). B: Bulk POC measurements. The red line is the best linear fit 292
to the suspended load samples collected at Zagunao (red circles); the blue line is the best 293
linear fit to the samples collected at Sangping station (blue circles). The open and filled 294
circles show samples collected before and after the earthquake, respectively. 295
296

17
Figure DR4. The frequency of days with intense runoff and POC discharge, by half-
year intervals, at the Sangping and Zagunao stations. Intense runoff frequency is
likely to be important in causing high POCbiosphere discharge, while the occurrence of
debris flow (e.g. July 6th, 2011) also plays an important role (e.g., explaining the high
POCbiosphere discharge with a large error but low frequency of intensive runoff in 2011).

18
Figure DR5. Carbon blank (mgC) contributed by filter papers. Replicates of torched
quartz sand ([OCtotal] < 0.02%) (Hilton et al., 2010) of different weights were passed
through CBH 1 µm paper filter papers, and removed by the same process as the samples
(see DR methods). The carbon weight of the blank (in mgC) is given, while whiskers
show the standard deviation of the two replicates for each sample weight. The solid line
is the best linear fit with 95% confidence intervals shown by dashed lines.

Sample ID Sampling Date suspended sediment concentration (g L‐1)POCtotal (mgC L‐1)
Zagunao station
ZGN04 15/05/2005 08:00 0.08 0.91
ZGN05 14/06/2005 20:00 0.20 2.70
ZGN06 03/07/2005 02:00 6.35 65.57
ZGN07 03/07/2005 08:00 1.34 16.03
ZGN08 07/07/2005 04:40 2.00 19.82
ZGN10 08/07/2005 20:00 0.89 8.00
ZGN11 09/07/2005 08:00 0.79 7.43
ZGN12 10/07/2005 08:00 0.26 2.79
ZGN13 20/08/2005 08:00 0.32 3.43
ZGN15 03/10/2005 08:00 0.77 3.96
ZGN16 01/04/2006 08:00 1.72 9.56
ZGN17 11/05/2006 08:00 0.17 0.89
ZGN18 03/06/2006 08:00 0.12 1.41
ZGN19 05/06/2006 08:00 1.01 10.20
ZGN20 06/06/2006 10:42 5.00 63.80
ZGN22 04/07/2006 02:00 5.44 51.05
ZGN23 16/08/2006 08:00 0.69 7.99
ZGN01 16/06/2007 08:00 25.56 136.21
ZGN26 17/06/2007 08:00 0.25 1.49
ZGN27 13/07/2007 00:00 0.15 1.55
ZGN31 May 2008 0.20 2.27
ZGN33 May 2008 0.20 1.84
ZGN35 May 2008 0.38 2.39
ZGN36 May 2008 0.78 8.78
ZGN37 May 2008 0.51 4.84
ZGN42 August 2008 0.08 0.61
ZGN43 August 2008 1.74 17.98
ZGN44 August 2008 2.12 21.56
ZGN45 August 2008 0.53 5.34
ZGN46 August 2008 0.33 1.70
ZGN47 15/04/2009 08:00 0.21 1.66
ZGN49 16/05/2009 20:00 0.17 2.84
ZGN50 28/06/2009 23:00 0.57 4.38
ZGN51 29/06/2009 02:00 1.29 13.32
ZGN02 29/06/2009 05:00 4.52 19.85
ZGN52 29/06/2009 13:00 2.02 17.47
ZGN54 16/07/2009 08:00 0.74 8.86
ZGN55 17/08/2009 02:00 0.43 4.66
ZGN56 13/09/2009 14:00 1.60 15.04
ZGN57 15/09/2009 08:00 0.27 3.31
Sangping station
SP6 01/04/2005 08:00 0.18 0.65
SP8 05/05/2005 08:00 1.43 7.73
SP9 26/05/2005 14:00 0.52 5.02
SP10 01/06/2005 08:00 0.82 4.97
Table DR1

SP11 17/06/2005 08:00 0.14 0.70
SP12 25/06/2005 02:00 0.70 4.20
SP13 25/06/2005 08:00 1.69 13.39
SP14 25/06/2005 14:00 0.84 7.97
SP15 25/06/2005 20:00 0.42 3.62
SP16 02/07/2005 08:00 0.19 0.75
SP17 02/07/2005 20:00 12.87 388.23
SP1 08/07/2005 08:00 11.19 136.39
SP19 02/08/2005 20:00 1.24 10.37
SP20 23/08/2005 08:00 0.13 0.75
SP22 25/09/2005 08:00 0.92 8.24
SP23 02/10/2005 08:00 0.31 3.07
SP24 31/10/2005 08:00 0.11 1.20
SP25 01/04/2006 08:00 0.26 5.16
SP26 21/04/2006 08:00 0.16 1.99
SP27 30/04/2006 08:00 0.12 1.62
SP28 05/05/2006 08:00 0.63 5.85
SP29 12/05/2006 08:00 0.99 11.04
SP30 05/06/2006 08:00 0.20 1.26
SP2 07/06/2006 08:00 2.24 19.61
SP31 07/06/2006 08:00 0.75 6.50
SP32 14/06/2006 08:00 0.14 0.88
SP33 28/06/2006 08:00 0.08 0.98
SP34 04/07/2006 08:00 2.69 27.23
SP35 11/07/2006 08:00 0.05 0.60
SP36 23/07/2006 14:00 0.63 7.23
SP37 06/08/2006 08:00 0.04 0.26
SP38 24/08/2006 20:00 0.12 1.18
SP39 30/08/2006 08:00 0.03 0.64
SP40 08/09/2006 08:00 0.61 7.62
SP41 17/09/2006 20:00 0.07 0.59
SP42 30/09/2006 08:00 0.11 0.72
SP43 05/10/2006 20:00 0.08 0.75
SP45 01/04/2007 08:00 0.08 0.75
SP46 20/04/2007 08:00 0.11 0.97
SP47 11/05/2007 20:00 0.33 3.16
SP48 17/05/2007 08:00 0.06 0.83
SP3 24/05/2007 08:00 4.03 49.34
SP49 25/05/2007 20:00 0.35 2.68
SP50 31/05/2007 08:00 0.13 0.96
SP51 01/06/2007 08:00 3.11 33.04
SP52 08/06/2007 08:00 0.22 1.45
SP53 15/06/2007 20:00 0.11 0.59
SP54 06/07/2007 08:00 7.07 91.63
SP55 13/07/2007 08:00 0.15 1.41
SP56 11/08/2007 02:00 2.11 18.48
SP57 24/08/2007 20:00 0.12 0.94

SP58 08/09/2007 08:00 0.09 0.81
SP59 13/09/2007 08:00 0.16 1.07
SP60 16/09/2007 20:00 1.29 11.22
SP62 29/10/2007 08:00 0.10 0.50
SP63 01/04/2008 08:00 0.07 1.35
SP4 21/04/2008 08:00 2.17 5.30
SP‐1‐2008 07/05/2008 20:00 0.18 1.10
SP‐2‐2008 08/05/2008 08:00 0.08 0.39
SP‐3‐2008 09/05/2008 02:00 0.48 2.23
SP‐4‐2008 10/05/2008 08:00 0.17 1.33
SP‐5‐2008 13/05/2008 14:00 1.36 13.23
SP‐6‐2008 15/05/2008 20:00 1.05 9.81
SP‐7‐2008 17/05/2008 20:00 0.78 10.47
SP‐8‐2008 19/05/2008 20:00 0.45 4.71
SP‐9‐2008 20/05/2008 08:00 0.67 4.76
SP‐10‐2008 28/05/2008 20:00 0.35 2.76
SP65 01/06/2008 08:00 0.26 2.61
SP66 07/06/2008 20:00 0.26 2.57
SP67 14/06/2008 20:00 0.68 8.70
SP68 20/06/2008 20:00 0.31 2.41
SP69 25/06/2008 08:00 0.19 1.32
SP70 01/07/2008 20:00 0.16 1.17
SP71 08/07/2008 08:00 0.18 1.73
SP72 15/07/2008 08:00 0.22 1.72
SP73 22/07/2008 08:00 0.34 3.91
SP74 28/07/2008 20:00 0.06 0.43
SP75 11/08/2008 08:00 0.54 7.21
SP76 18/08/2008 08:00 0.10 0.68
SP77 21/08/2008 08:00 0.36 8.36
SP78 30/08/2008 10:00 3.35 28.53
SP79 30/08/2008 20:00 1.64 13.41
SP80 31/08/2008 02:00 0.74 6.11
SP81 06/09/2008 08:00 0.20 1.06
SP82 24/09/2008 20:00 0.11 0.87
SP83 14/10/2008 20:00 0.06 0.39
SP84 28/10/2008 08:00 0.04 0.29
SP86 21/04/2009 08:00 0.05 0.94
SP88 15/05/2009 08:00 0.11 1.39
SP89 29/05/2009 08:00 0.08 1.28
SP90 08/06/2009 08:00 0.65 4.92
SP91 15/06/2009 08:00 0.16 1.15
SP92 29/06/2009 08:00 3.26 24.09
SP93 09/07/2009 14:00 1.35 10.15
SP94 17/07/2009 08:00 0.28 3.23
SP95 23/07/2009 08:00 0.50 3.91
SP96 02/08/2009 20:00 0.90 6.99
SP5 19/08/2009 08:00 2.07 23.48
SP98 05/09/2009 08:00 0.10 2.69
SP99 13/09/2009 20:00 0.82 5.27
SP100 20/09/2009 20:00 0.37 2.80
SP101 08/10/2009 08:00 0.41 3.72
SP102 30/10/2009 08:00 0.08 0.79
SP10‐1 10/05/2010 0.37 1.89
SP10‐5 16/05/2010 0.22 1.56
SP10‐6 16/05/2010 0.37 2.17
SP10‐8 22/05/2010 0.98 8.10
SP10‐12 08/06/2010 0.79 6.86
SP10‐13 08/06/2010 0.35 2.52
SP10‐14 15/06/2010 1.08 8.19
SP10‐16 27/06/2010 0.15 0.83
SP10‐20 25/07/2010 0.32 2.33
SP10‐23 02/08/2010 0.18 1.49
SP10‐25 10/08/2010 0.07 0.66
* Daily water discharge and suspended sediment concentration of year 2005 are not
available, so we only calculated the sediment and POC flux from 2006 to 2011 when the
gauging data is available.

Sample ID Date [OCtotal] (%) δ13Corg, (‰) Fmod_BK
Zagunao station
ZGN8 07/07/2005 04:40 0.99 ‐20.70 0.59
ZGN15 03/10/2005 08:00 0.52 ‐19.33 0.27
ZGN16 01/04/2006 08:00 0.56 ‐20.75 0.42
ZGN33 May 2008 0.91 ‐20.99 0.53
ZGN35 May 2008 0.63 ‐19.57 0.39
ZGN36 May 2008 1.12 ‐22.52 0.74
ZGN50 27/06/2005 23:00 0.76 ‐22.11 0.48
ZGN52 28/06/2005 13:00 0.86 ‐23.16 0.59
ZGN02 28/06/2005 05:00 0.44 ‐21.99 0.52
ZGN02 <63µ 28/06/2005 05:00 0.27 ‐21.68 0.48
ZGN02 63‐2 28/06/2005 05:00 1.48 ‐24.36 0.80
ZGN02 >250 28/06/2005 05:00 9.95 ‐25.99 1.04
SC14‐28D2 bedload 0.55 ‐13.19 0.06
Sangping station
SP12 25/06/2005 02:00 0.60 ‐23.88 0.54
SP17 02/07/2005 20:00 3.02 ‐25.68 0.94
SP34 04/07/2006 08:00 1.01 ‐21.16 0.48
SP3 24/05/2007 08:00 1.22 ‐23.97 0.74
SP25 01/04/2006 08:00 2.03 ‐24.61 0.74
SP40 08/09/2006 08:00 1.25 ‐23.90 0.68
SP51 01/06/2007 08:00 1.06 ‐24.20 0.83
SP‐1‐2008 07/05/2008 20:00 0.62 ‐23.84 0.61
SP‐3‐2008 09/05/2008 02:00 0.46 ‐22.69 0.46
SP‐4‐2008 10/05/2008 08:00 0.80 ‐24.04 0.61
SP‐6‐2008 15/05/2008 20:00 0.94 ‐23.99 0.66
SP‐7‐2008 17/05/2008 20:00 1.34 ‐24.51 0.76
SP‐8‐2008 19/05/2008 20:00 1.04 ‐24.51 0.64
SP‐9‐2008 20/05/2008 08:00 0.71 ‐24.14 0.56
SP‐10‐2008 28/05/2008 20:00 0.80 ‐23.54 0.59
SP78 30/08/2008 10:00 0.85 ‐22.91 0.61
SP10‐13 08/06/2010 0.73 ‐22.14 0.46
SP5 19/08/2009 08:00 1.17 ‐24.26 0.74
SP5 >250µm 19/08/2009 08:00 1.08
SP5 63‐250µ 19/08/2009 08:00 1.79 ‐25.67
SP5 <63µm 19/08/2009 08:00 1.02 ‐23.99 0.69
SP3 >250µm 24/05/2007 08:00 9.23 ‐27.40 1.03
SP3 63‐250µ 24/05/2007 08:00 1.51 ‐25.74 0.95
SP3 <63µm 24/05/2007 08:00 0.98 ‐23.45 0.69
SC14‐19D beadload 0.41 ‐18.45 0.02
Table DR2

Time Q w Q ss POCtotal POCbiosphere POCpetro Q w Q ss POCtotal POCbiosphere POCpetro
(km3) (Mt) (tC) (tC) (tC) (km3) (Mt) (tC) (tC) (tC)2006/01-2006/06 1.32 0.40±0.04 3488±132 2189±154 1300±79 0.011 0.78 0.22±0.02 2021±82 1323±119 698±86 0.0282006/07-2006/12 1.63 0.21±0.02 1850±52 1156±61 694±31 0.005 1.02 0.13±0.01 1216±36 813±52 403±38 0.0332007/01-2007/06 1.19 0.39±0.04 3392±129 2129±149 1263±76 0.022 0.74 0.40±0.04 3350±251 2100±333 1250±219 0.0392007/07-2007/12 1.68 0.67±0.07 5887±183 3699±212 2187±108 0.043 1.11 0.54±0.05 4725±162 3042±231 1683±165 0.062008/01-2008/06 1.08 0.41±0.04 3589±58 2251±68 1338±35 0 0.62 0.07±0.01 705±14 478±19 227±13 02008/07-2008/12 1.7 0.27±0.03 2323±67 1452±78 871±40 0.005 1.13 0.10±0.01 915±23 619±33 295±24 0.0052009/01-2009/06 1.15 0.27±0.03 2362±92 1481±107 881±55 0.006 0.71 0.10±0.01 909±27 610±38 299±28 0.0062009/07-2009/12 1.92 0.44±0.04 3833±86 2401±101 1432±52 0 1.11 0.15±0.01 1448±26 976±36 473±26 02010/01-2010/06 1.58 0.57±0.06 5026±112 3150±131 1875±68 0.033 0.92 0.17±0.02 1558±37 1045±52 513±37 0.0442010/07-2010/12 2.24 0.48±0.05 4234±81 2649±95 1585±49 0.016 1.37 0.25±0.02 2287±50 1523±72 764±52 0.0872011/01-2011/06 1.51 0.44±0.04 3861±155 2426±180 1435±91 0.017 0.87 0.10±0.01 987±31 662±44 325±32 0.0332011/07-2011/12 1.69 1.23±0.12 10991±935 6974±1035 4017±443 0.005 1.01 0.60±0.06 4786±447 2925±588 1861±382 0.005
Downstream: Sangping station Upstream: Zagunao stationP runoff >
6 mm d-1
P runoff >
6 mm d-1
Table DR3

Community type Soil carbon stock (tC km-2 Total carbon stockCoverage (%)
Herb 9.4 ± 0.8 × 10³ 10.5 ± 0.7 × 10³ 16.7
Shrub 13.2 ± 1.0 × 10³ 17.4 ± 1.0 × 10³ 40.7
Board-leaf forest 16.6 ± 1.2 × 10³ 24.8 ± 1.7 × 10³ 14
Mixed forest 22.2 ± 1.8 × 10³ 35.4 ± 2.2 × 10³ 0.5
Fir forest 16.7 ± 1.1 × 10³ 61.9 ± 5.4 × 10³ 28.1
Total 13.6 ± 1.0 × 10³ 3.0 ± 2.0 × 10³
Table DR4