Embed Size (px)
Citation preview
Earthquakes and California Agriculture: Where are the Vulnerabilities?
Final Report prepared for the
Alfred E. Alquist Seismic Safety Commission
State of California
November 2014
CSSC Publication Number 2014-05
Scott J. Brandenberg University of California, Los Angeles
Hyunok Lee
University of California, Davis
Daniel A. Sumner University of California, Davis and
University of California Agricultural Issues Center
1
Executive Summary
California agriculture is especially vulnerable to damage from earthquakes for three main reasons. First, a substantial share of farm production and the associated marketing and processing activities are located in regions particularly susceptible to seismic activity. Second, agriculture relies on public infrastructure, especially for power and transportation, that is likely to suffer disruptions following earthquakes, and redundancies are few in the rural systems. Third, much of California agriculture is devoted to highly perishable commodities and farm and marketing activities, such as milking cows and processing milk or harvesting and shipping fresh vegetables that must be done without delay. In addition to these concerns, long term capital losses to the soil itself remain a concern in some regions. This study considers the vulnerability of California agriculture to earthquake losses by considering three brief examples that focus on specific industries in locations of known seismic activity. In Chapter 2 we study in detail effects of two recent seismic events on two linked cattle businesses in Imperial County. Meloland Cattle Company was hit by a large earthquake in April 2010 that was centered just across the border in Mexico. The Meloland case study shows how dependent feedlot operations are on power grid, water and transportation infrastructure. We used estimates of the fragility of crucial equipment as a guide to damage to non-structural systems and found a 91 percent chance of the feed mill system being undamaged in a similar earthquake. The 2010 earthquake also raised cattle transport costs for more than a year. Finally, in investigating water systems for cattle we found that a major siphon necessary for livestock and irrigation water for a third of the Imperial Valley survived the 2010 earthquake but remains vulnerable. Turning to the processing end of the industry we found that the National Beef slaughter and beef processing facility in Brawley suffered significant structural damage from a “swarm” of small quakes in 2012. These caused plant operations to be disrupted for 5 days to assure no comprise to standards for food sanitation or worker safety. Substantial repair costs were incurred. Chapter 3 investigates market impacts for producers and consumers of a potential temporary disruption to transportation and related services affecting the fresh vegetable industry in the Salinas area of Monterey County. Monterey County is the most import source of lettuce and other greens in the United States and during some seasons is the dominant supplier of these crops. The region is also the main source of strawberries during its peak season. Both strawberries and lettuce rely on cooling within hours of harvest. Multiple faults run throughout Monterey County which is particularly vulnerable to an earthquake. Besides losses from damage to structures, the main disruption to produce markets is likely damage to
2
infrastructure that would affect the cooling chain for produce after it leaves the farm. We consider scenarios of potential effects on prices and revenues under alternative seasons of the disruption. Losses of quantities during the peak season in Salinas would raise market prices and cause economic losses to buyers more than sellers. Chapter 4 examines dairy production and processing, the number one agricultural industry in California. While much of the production and processing is located in the Southern San Joaquin Valley, which is less prone to earthquakes than other parts of the state, there remains significant vulnerability to the large dairy industry in the Delta region. California dairy relies on electricity for milking, milk movement and cooling on the farm. Transportation and processing are also required daily so the industry faces severe losses from even temporary disruptions. Recommendations for backup power and transport systems and attention to planning to avoid losses seem crucial. This study has highlighted a number of areas for more extensive investigation that would engage joint research with economists and seismic engineers. We suggest close engagement with farmers and processing and marketing firms. In addition to the industries more thoroughly examined in our case study, we propose detailed evaluation of tree fruit industries and especially the California wine industry.
3
Table of Contents 1. Introduction 1.1. Overview 1.2 Vital Features and Unique Vulnerabilities of California Agriculture 1.3 Approach of the Study 1.4 Research Needs 1.5 References 2. Intensive Study of Impacts of Effects of Recent Seismic Events on a Cattle Feedlot and Beef Processing Facility in Imperial County California with Economic Implications 2.1 Meloland Cattle Company Case Study 2.2 Description of Meloland Cattle Company and Related Business Operations 2.3 Description of April 4, 2010 Magnitude 7.2 Earthquake 2.4 Observed and Predicted Damage to on-site Systems 2.5 Damage to Water, Transportation, and Electrical Infrastructure during the 2010 El Mayor Cucapah Earthquake 2.6 Damage at National Beef Processing Facility due to Swarm of Magnitude 4 to 5 Earthquakes in 2012 2.7 Opportunities for Future Research 2.8 References 3. Potential Effects of a Seismic Event on Monterey Agriculture: A Focus on Market Effects in the Produce Industry 3.1 Monterey County Agriculture 3.2 Agriculture in Salinas Valley 3.3 Harvest, Post-harvest Handling and Marketing of Fresh Produce, with a focus on Lettuce and Strawberries 3.4 Potential Seismic Risk for Agriculture in Monterey County 3.5 Numeric Illustrations of Seismic Damages in the Agricultural Sector in Monterey County 3.5.1 Loss Calculations with no Market Price Effects 3.5.2 Loss Calculations with Price Effects Incorporated 3.6 Final Remarks 3.7 References
4
4. Seismic Events and California Dairy 4.1 Dairy Vulnerability in San Joaquin County 4.2 California Dairy Vulnerabilities 4.3 References 5. Concluding Remarks
List of Figures Figure 1.1 California Crops Cash Receipts, 2010-2012. Average total crop cash receipts = $29.4 billion Figure 1.2 California Livestock Cash Receipts, 2010-2012. Average total livestock and dairy cash receipts = $11.4 billion Figure 1.3 Distribution of California Agricultural Exports 2010, by Commodity Figure 2.1 Feed Handling System Meloland Cattle Company Figure 2.2 Intensity Map for April 4, 2010 El Mayor Cucapah Earthquake (USGS 2010). Figure 2.3 Ground Motion Records for USGS Seismic Station 0931 at Meloland Cattle Company Figure 2.4 Siphon for Water from the All American Canal the New River in Calexico, California Figure 2.5 Concrete Lined Irrigation Canal Damaged by Liquefaction Figure 2.6 Epicenters of Earthquake Events August 26-27, 2012 Figure 2.7 Shaking Intensity Maps Earthquake Events August 26-27, (USGS 2012). Figure 3.1 Salinas Valley Figure 3.2 Monterey County Major Fault Lines Figure 4.1 Confined Animal Feeding Units and Earthquake Fault Lines in California Figure 4.2 Dairy Farms, Milk Processing Facilities, Roads and Faults in San Joaquin and Stanislaus Counties
List of Tables Table 1.1 California's Top 10 Agricultural Counties and Leading Commodities Table 3.1 Monterey County Agricultural Marketing Value, 2012 Table 3.2 Potential Losses Related to Seismic Event in Salinas Area Table 3.3 Approximate Monthly Share of National Shipments for Three Selected Products Table 3.4 Losses in Market Revenue due to a Seismic Event
5
1. Introduction 1.1 Overview This project has established that agriculture has unique vulnerabilities to seismic disruptions and therefore needs further detailed and specific study to determine potential damages and ways to mitigate damages. In addition to seismic damages at the farm-gate, we show that geographic dispersion of farms and ranches adds vulnerability due to seismic disruptions that affect transport systems and rural distribution of water and electricity. Given that agricultural products are marketed and exported through the rural and urban infrastructure, understanding agricultural vulnerabilities to infrastructure disruptions is especially crucial. Much of California farm output is highly perishable. Farmers often have little flexibility in timing of harvest, processing or marketing. This applies to milk, eggs, meat, many fresh fruits and vegetables and some nursery and greenhouse items. We incorporated into our analysis the fact that economic “perishabiltiy” also applies to livestock marketing because animals held beyond the most economic weight and grade lose value and cause economic losses. Farm commodities face severe losses from disruptions in production, harvest, product quality, transport, processing and marketing services caused by earthquakes. The livestock industries also raise animal welfare concerns in addition to economic losses. For example, in case of power failure, living conditions of confined livestock deteriorate and daily harvest of products such as milk or eggs is disrupted. While these seismic damages can be understood broadly, the extent and scope of damages vary by region and product. Quantifying these damages requires systematic analysis based on information on seismic activity and impacts linked to data on agricultural activities. This project has: (a) identified the most significant vulnerability in agriculture due to seismic disasters in our case study regions, especially from the examples of the 2010 and 2012 seismic events affecting Imperial County; (b) projected potential losses quantitatively for cases of hypothetical events that disrupted marketing of Salinas Valley produce; (c) assessed potential ways to mitigate seismic damages in some specific cases; (d) suggested a few ways that farmers and others in agricultural communities might be better prepared for seismic disasters; and (e) begun to identify research and information needs and potential roles for local, state and federal governments. An important outcome of the project is a summary of important research needed to provide a basis for practical advice for stakeholders, as well as recommendations for public officials and public service providers.
6
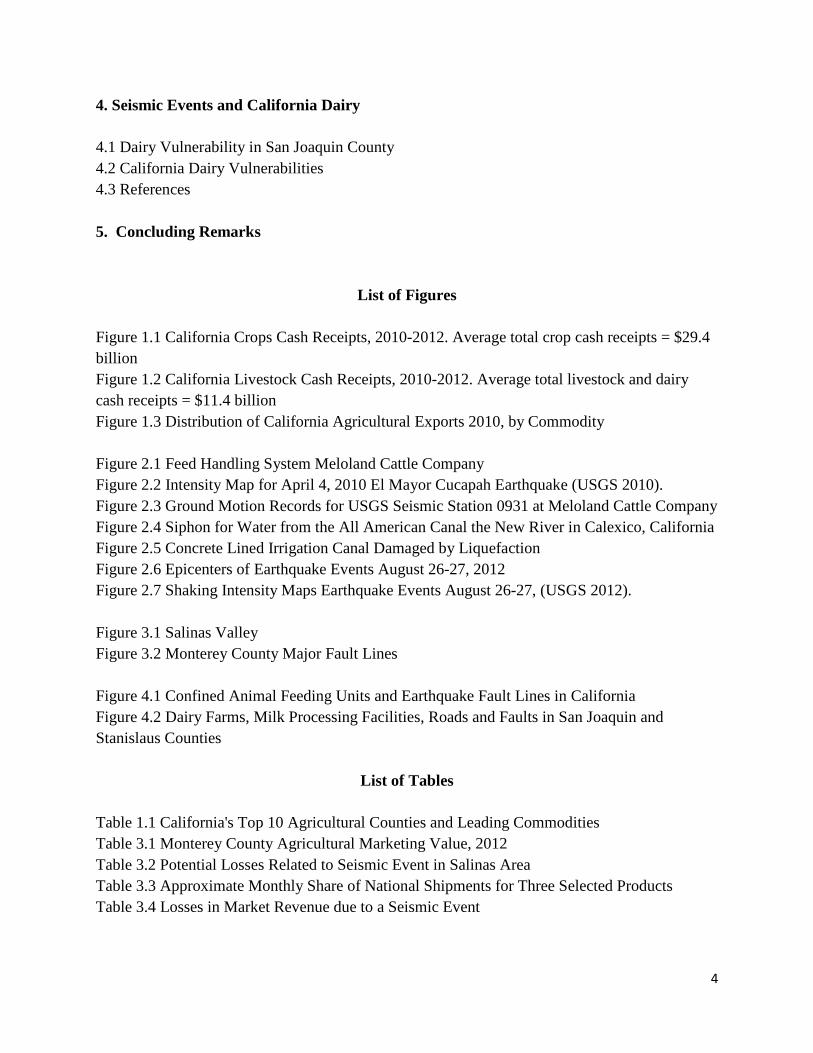
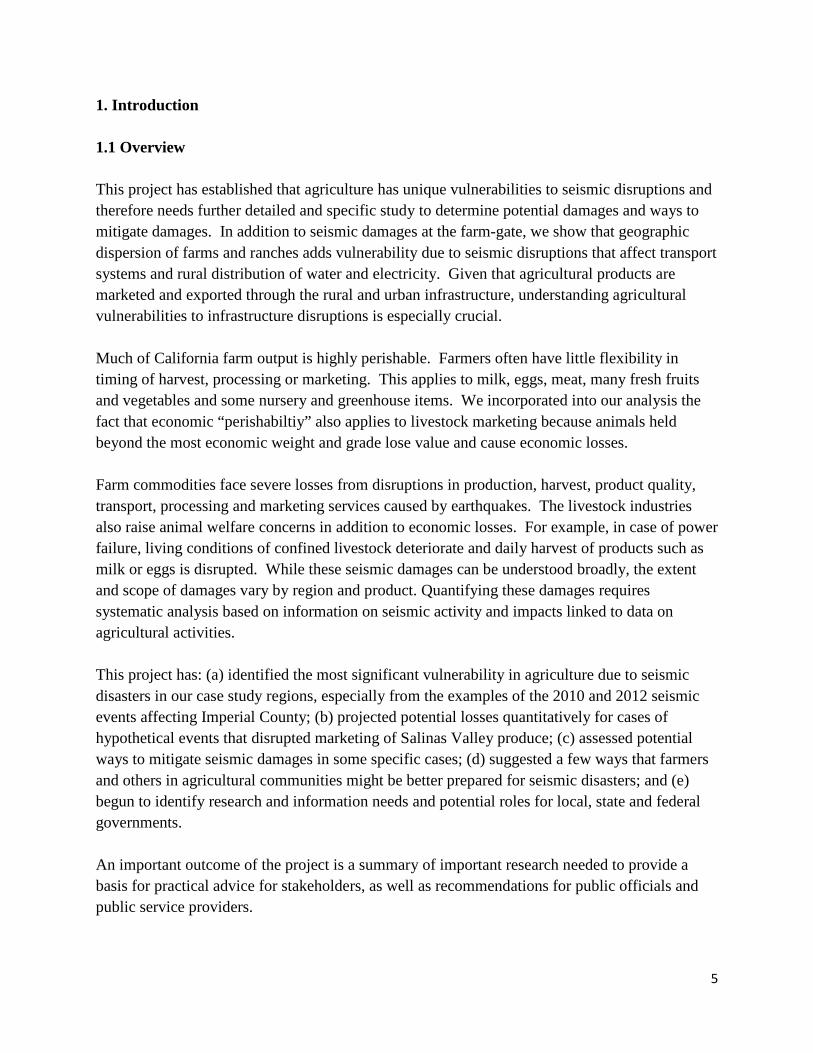
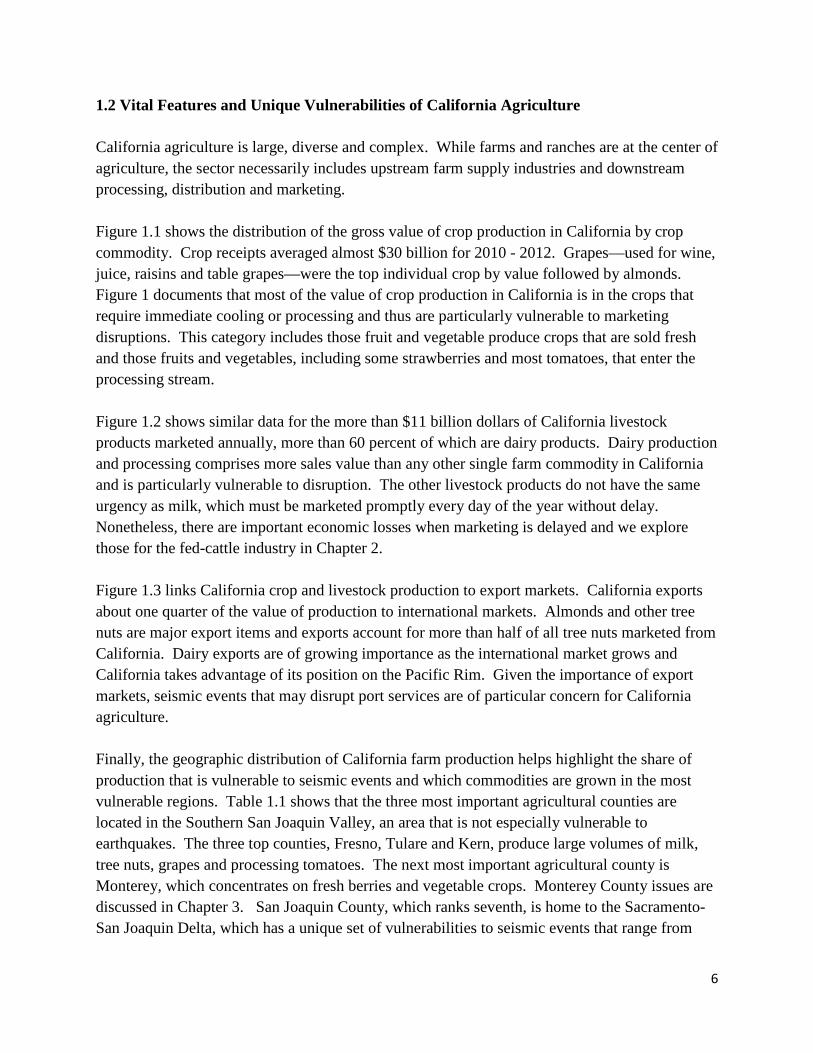
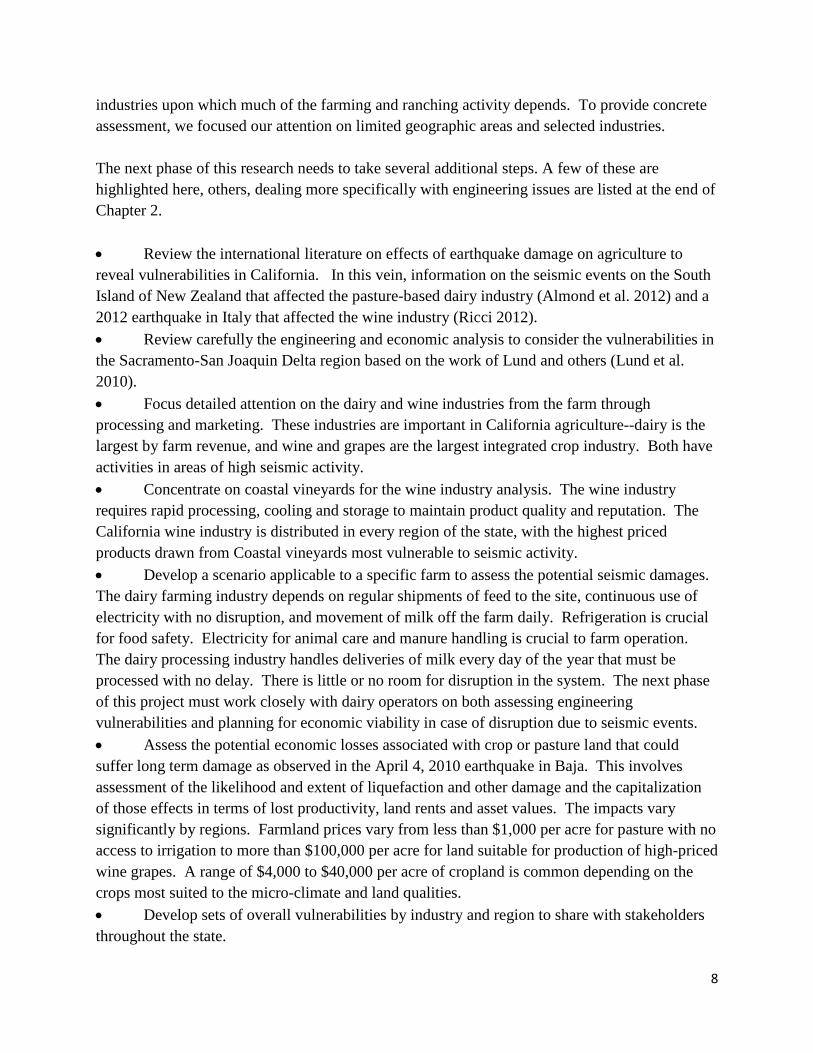
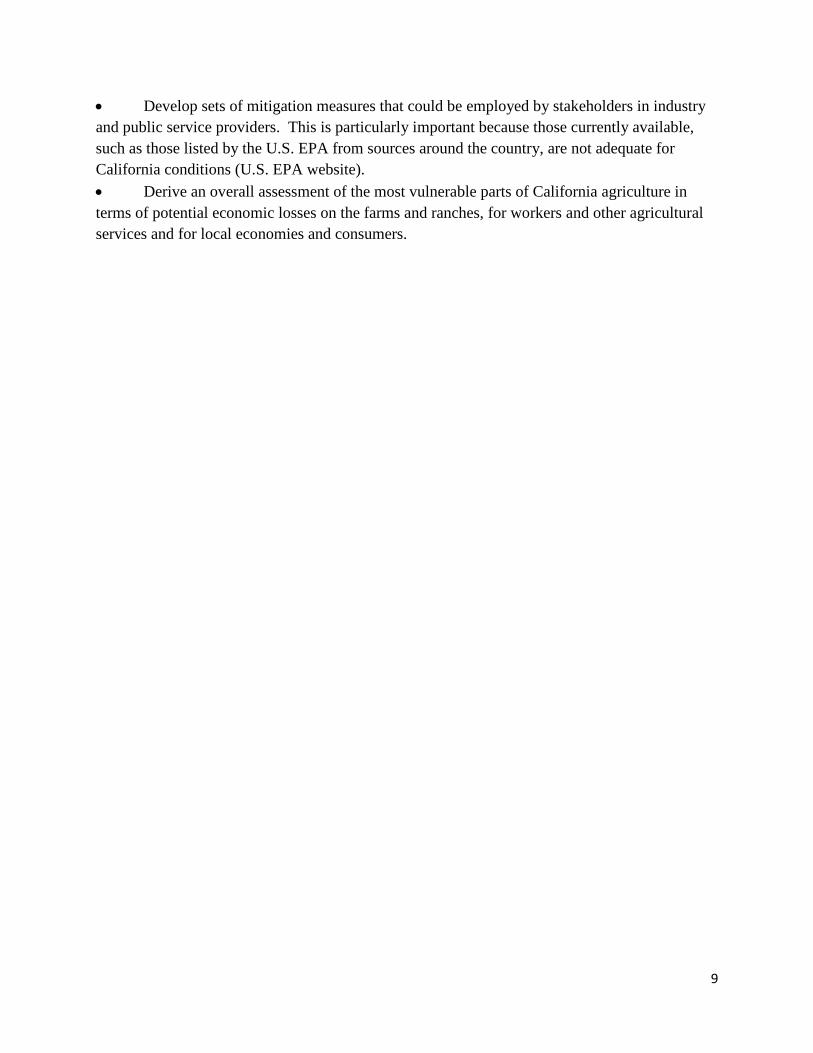
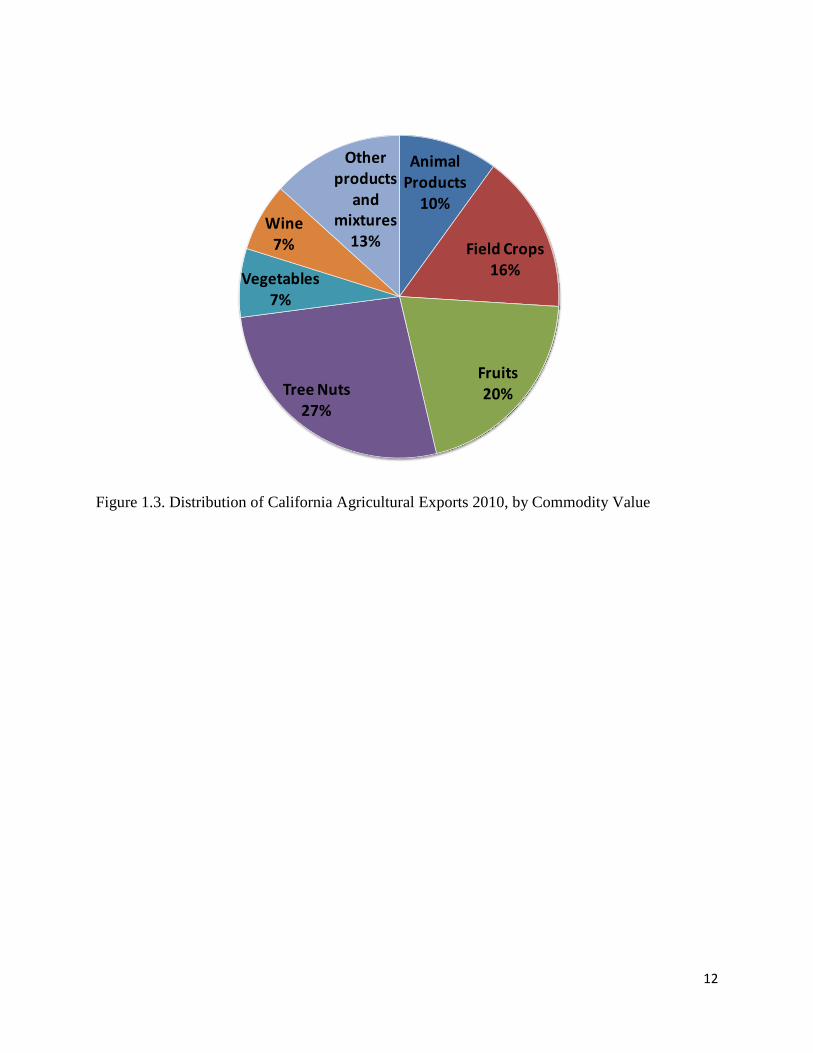
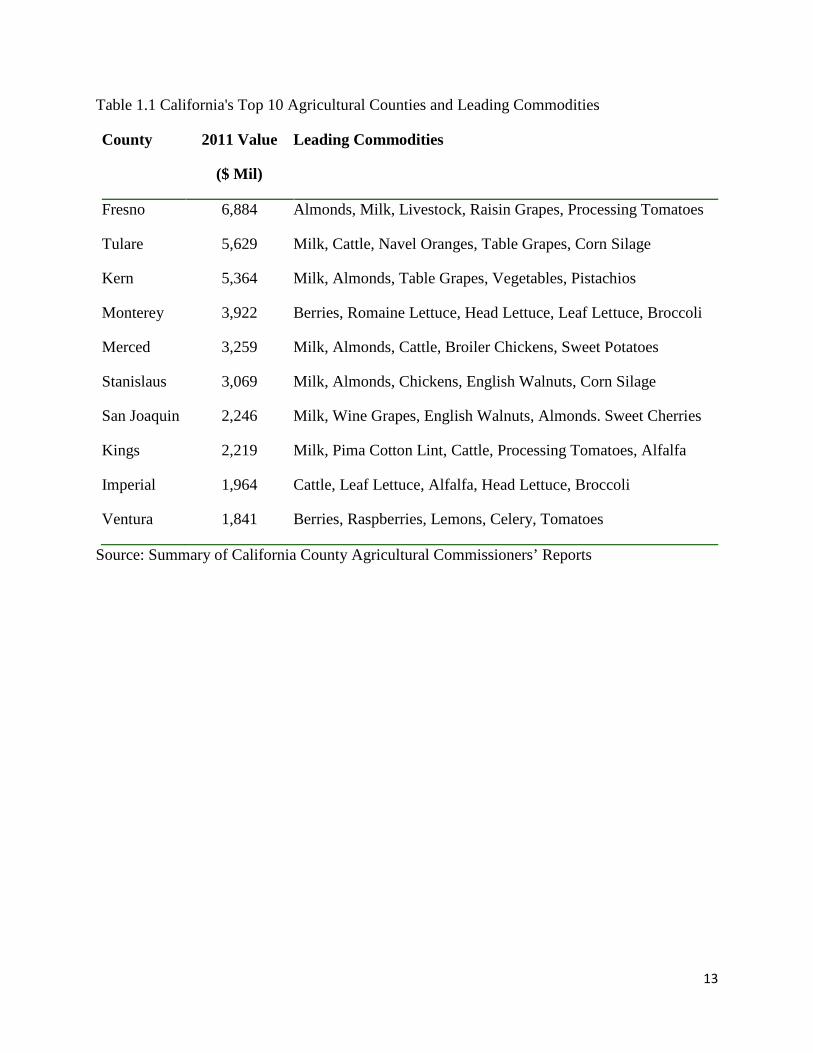
1.2 Vital Features and Unique Vulnerabilities of California Agriculture California agriculture is large, diverse and complex. While farms and ranches are at the center of agriculture, the sector necessarily includes upstream farm supply industries and downstream processing, distribution and marketing. Figure 1.1 shows the distribution of the gross value of crop production in California by crop commodity. Crop receipts averaged almost $30 billion for 2010 - 2012. Grapes—used for wine, juice, raisins and table grapes—were the top individual crop by value followed by almonds. Figure 1 documents that most of the value of crop production in California is in the crops that require immediate cooling or processing and thus are particularly vulnerable to marketing disruptions. This category includes those fruit and vegetable produce crops that are sold fresh and those fruits and vegetables, including some strawberries and most tomatoes, that enter the processing stream. Figure 1.2 shows similar data for the more than $11 billion dollars of California livestock products marketed annually, more than 60 percent of which are dairy products. Dairy production and processing comprises more sales value than any other single farm commodity in California and is particularly vulnerable to disruption. The other livestock products do not have the same urgency as milk, which must be marketed promptly every day of the year without delay. Nonetheless, there are important economic losses when marketing is delayed and we explore those for the fed-cattle industry in Chapter 2. Figure 1.3 links California crop and livestock production to export markets. California exports about one quarter of the value of production to international markets. Almonds and other tree nuts are major export items and exports account for more than half of all tree nuts marketed from California. Dairy exports are of growing importance as the international market grows and California takes advantage of its position on the Pacific Rim. Given the importance of export markets, seismic events that may disrupt port services are of particular concern for California agriculture. Finally, the geographic distribution of California farm production helps highlight the share of production that is vulnerable to seismic events and which commodities are grown in the most vulnerable regions. Table 1.1 shows that the three most important agricultural counties are located in the Southern San Joaquin Valley, an area that is not especially vulnerable to earthquakes. The three top counties, Fresno, Tulare and Kern, produce large volumes of milk, tree nuts, grapes and processing tomatoes. The next most important agricultural county is Monterey, which concentrates on fresh berries and vegetable crops. Monterey County issues are discussed in Chapter 3. San Joaquin County, which ranks seventh, is home to the Sacramento-San Joaquin Delta, which has a unique set of vulnerabilities to seismic events that range from
7
damage to levees to salt water intrusion. Imperial County, which we consider in Chapter 2, is home to a major cattle industry along with fresh produce. Ventura County, which ranks tenth, is similar to Monterey in its reliance on fresh produce, especially berries. Thus, four of the top 10 agricultural counties in California have particular vulnerability to seismic events. 1.3 Approach of the Study This project involved contributions from seismic science and engineering and agricultural economics. Seismic engineers at UCLA outlined major geographic and structural effects of earthquakes of different types and magnitudes. This allowed initial assessments to determine that the Imperial Valley and the Salinas Valley of Monterey County were useful case studies. In addition, we determined that analysis of Confined Animal Feeding Operations (CAFOs) were of particular importance and vulnerability. Information related to occurrences and physical damages of earthquakes was linked with the distribution of agricultural production, especially CAFOs and processing facilities, to identify important overlaps. We documented physical damages that occurred with different kinds and strengths of earthquakes in Imperial County. The UCLA team led by Prof. Brandenberg was responsible for the physical and engineering aspects of this work. We also summarized initial potential impacts on agriculturally relevant natural resources and infrastructure such as soil structures, levees, irrigation systems, highways, rural roads, rail lines, and ports, and implications for electricity supplies. To provide more concrete economic assessments built on the initial catalog of vulnerabilities, we developed potential scenarios for Monterey County to represent cases of seismic disasters. We travelled to case study regions and interviewed producers, processors and others involved in the supply chain for inputs and outputs. We project lost market revenue for major livestock and produce industries. Perishability is a key determining factor in assessing losses when power is lost or roads are damaged. We examined the feedlot cattle business in Imperial County as an example of CAFOs in California. This led to consideration of the local hay industry and connection to grain shipped by rail from the Midwest. For the produce industry, chapter 3 focuses on Monterey County, with special attention on the two main types of lettuce and strawberries. 1.4 Further Research Needs This project, even though modest in scope, was able to document the serious potential vulnerability of California agriculture to earthquake damage. We examined actual cases of the effect of seismic activity in agricultural production, and the food marketing and processing
8
industries upon which much of the farming and ranching activity depends. To provide concrete assessment, we focused our attention on limited geographic areas and selected industries. The next phase of this research needs to take several additional steps. A few of these are highlighted here, others, dealing more specifically with engineering issues are listed at the end of Chapter 2. • Review the international literature on effects of earthquake damage on agriculture to reveal vulnerabilities in California. In this vein, information on the seismic events on the South Island of New Zealand that affected the pasture-based dairy industry (Almond et al. 2012) and a 2012 earthquake in Italy that affected the wine industry (Ricci 2012). • Review carefully the engineering and economic analysis to consider the vulnerabilities in the Sacramento-San Joaquin Delta region based on the work of Lund and others (Lund et al. 2010). • Focus detailed attention on the dairy and wine industries from the farm through processing and marketing. These industries are important in California agriculture--dairy is the largest by farm revenue, and wine and grapes are the largest integrated crop industry. Both have activities in areas of high seismic activity. • Concentrate on coastal vineyards for the wine industry analysis. The wine industry requires rapid processing, cooling and storage to maintain product quality and reputation. The California wine industry is distributed in every region of the state, with the highest priced products drawn from Coastal vineyards most vulnerable to seismic activity. • Develop a scenario applicable to a specific farm to assess the potential seismic damages. The dairy farming industry depends on regular shipments of feed to the site, continuous use of electricity with no disruption, and movement of milk off the farm daily. Refrigeration is crucial for food safety. Electricity for animal care and manure handling is crucial to farm operation. The dairy processing industry handles deliveries of milk every day of the year that must be processed with no delay. There is little or no room for disruption in the system. The next phase of this project must work closely with dairy operators on both assessing engineering vulnerabilities and planning for economic viability in case of disruption due to seismic events. • Assess the potential economic losses associated with crop or pasture land that could suffer long term damage as observed in the April 4, 2010 earthquake in Baja. This involves assessment of the likelihood and extent of liquefaction and other damage and the capitalization of those effects in terms of lost productivity, land rents and asset values. The impacts vary significantly by regions. Farmland prices vary from less than $1,000 per acre for pasture with no access to irrigation to more than $100,000 per acre for land suitable for production of high-priced wine grapes. A range of $4,000 to $40,000 per acre of cropland is common depending on the crops most suited to the micro-climate and land qualities. • Develop sets of overall vulnerabilities by industry and region to share with stakeholders throughout the state.
9
• Develop sets of mitigation measures that could be employed by stakeholders in industry and public service providers. This is particularly important because those currently available, such as those listed by the U.S. EPA from sources around the country, are not adequate for California conditions (U.S. EPA website). • Derive an overall assessment of the most vulnerable parts of California agriculture in terms of potential economic losses on the farms and ranches, for workers and other agricultural services and for local economies and consumers.
10
References
Almond, P, T.M. Wilson, F. Shanhun, Z. Whitman, A. Eger, D. Moot, M. Cockcroft, and D.C. Nobes. 2012. “Agricultural Land Rehabilitation Following 2010 Darfield (Canterbury) Earthquake: A Preliminary Report.” Bulletin of the New Zealand Society for Earthquake Engineering, vol. 43 p. 432-438.
Lund, Jay, E. Hanak, W. Fleenor, W. Bennett, R. Howitt, J. Mount, and P. Moyle. 2008. Comparing Futures for the Sacramento–San Joaquin Delta. Public Policy Institute of California. R708EHR. http://www.ppic.org/content/pubs/report/R_708EHR.pdf
Ricci, Claudia. 2012. “Earthquakes Hit Italy: A Blow to the Wine and Food Industry.” http://www.winemag.com/Web-2012/Earthquakes-Hit-Italy-A-Blow-to-the-Wine-and-Food-Industry/
U.S. EPA. 2014. Agriculture/Natural Events and Disasters/Earthquakes. http://www.epa.gov/oecaagct/tned.html#earthquakes
11
Figure 1.1. California Crops Cash Receipts, 2010-2012. Average total crop cash receipts = $29.4 billion
Figure 1.2. California Livestock Cash Receipts, 2010-2012. Average total livestock and dairy cash receipts = $11.4 billion
Grapes
Strawberries
Citrus
Other Fruits
Lettuce, All
Proc. Tomatoes
Almonds
Other Tree Nuts
Hay
Cotton
Other Field Crops
Milk and Cream
Cattle and Calves
Chickens
Eggs Turkeys
Other Livestock
Greenhouse and Nursery
Other Vegetables
12
Figure 1.3. Distribution of California Agricultural Exports 2010, by Commodity Value
Animal Products
10%
Field Crops 16%
Fruits20%Tree Nuts
27%
Vegetables7%
Wine7%
Other products
and mixtures
13%
13
Table 1.1 California's Top 10 Agricultural Counties and Leading Commodities
County 2011 Value
($ Mil)
Leading Commodities
Fresno 6,884 Almonds, Milk, Livestock, Raisin Grapes, Processing Tomatoes
Tulare 5,629 Milk, Cattle, Navel Oranges, Table Grapes, Corn Silage
Kern 5,364 Milk, Almonds, Table Grapes, Vegetables, Pistachios
Monterey 3,922 Berries, Romaine Lettuce, Head Lettuce, Leaf Lettuce, Broccoli
Merced 3,259 Milk, Almonds, Cattle, Broiler Chickens, Sweet Potatoes
Stanislaus 3,069 Milk, Almonds, Chickens, English Walnuts, Corn Silage
San Joaquin 2,246 Milk, Wine Grapes, English Walnuts, Almonds. Sweet Cherries
Kings 2,219 Milk, Pima Cotton Lint, Cattle, Processing Tomatoes, Alfalfa
Imperial 1,964 Cattle, Leaf Lettuce, Alfalfa, Head Lettuce, Broccoli
Ventura 1,841 Berries, Raspberries, Lemons, Celery, Tomatoes
Source: Summary of California County Agricultural Commissioners’ Reports
14
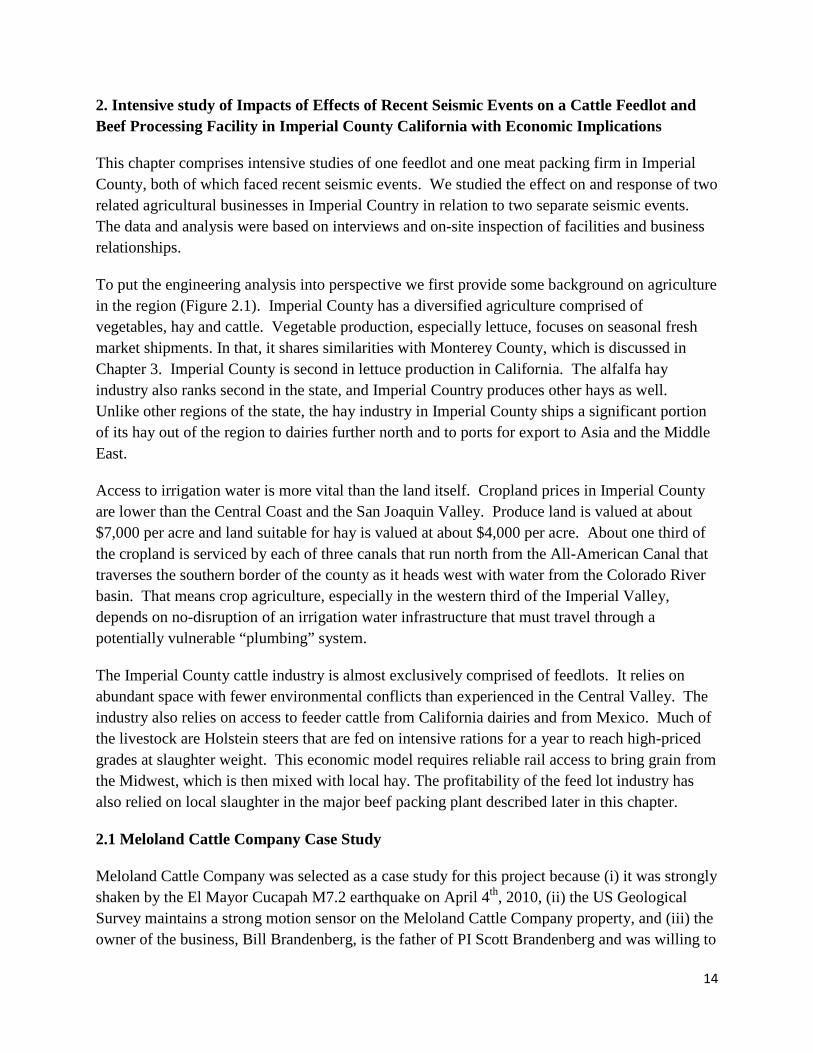
2. Intensive study of Impacts of Effects of Recent Seismic Events on a Cattle Feedlot and Beef Processing Facility in Imperial County California with Economic Implications
This chapter comprises intensive studies of one feedlot and one meat packing firm in Imperial County, both of which faced recent seismic events. We studied the effect on and response of two related agricultural businesses in Imperial Country in relation to two separate seismic events. The data and analysis were based on interviews and on-site inspection of facilities and business relationships.
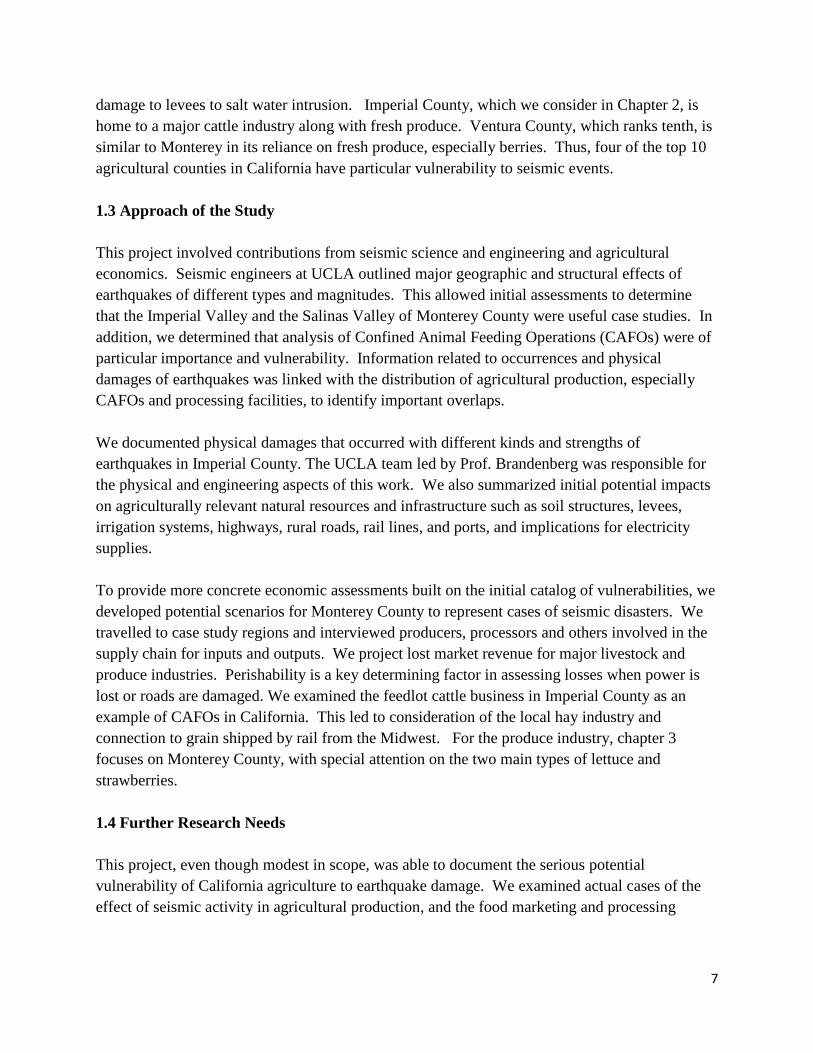
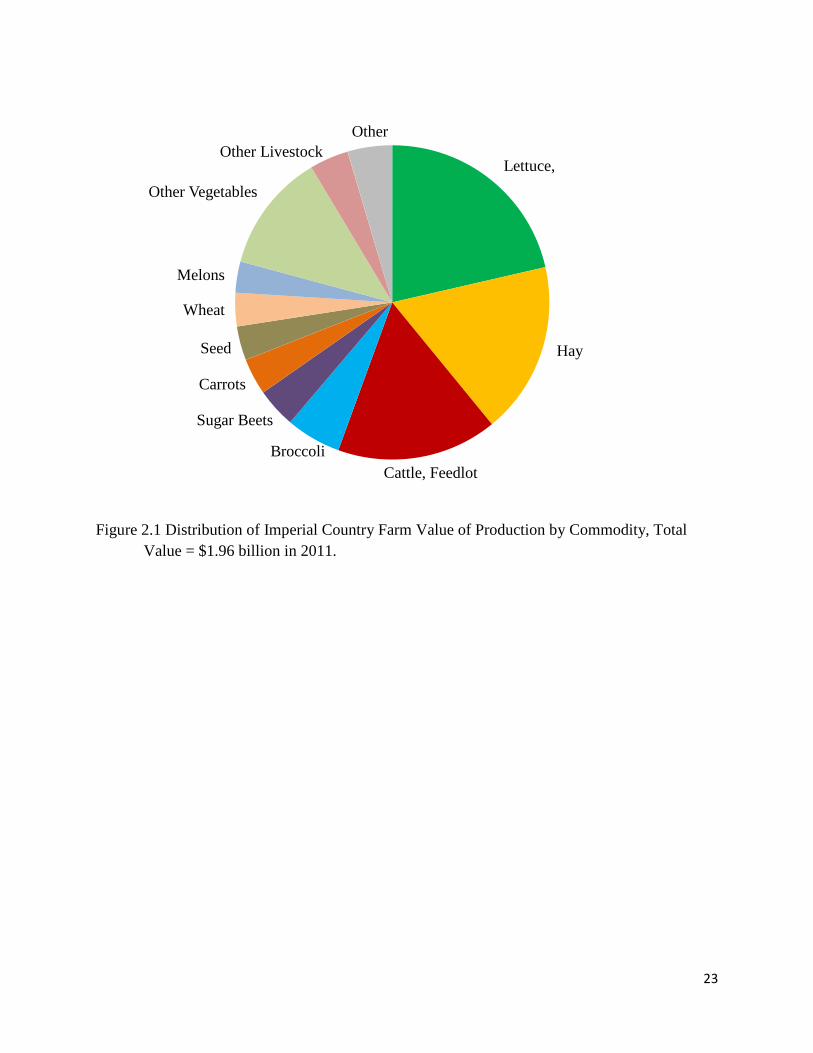
To put the engineering analysis into perspective we first provide some background on agriculture in the region (Figure 2.1). Imperial County has a diversified agriculture comprised of vegetables, hay and cattle. Vegetable production, especially lettuce, focuses on seasonal fresh market shipments. In that, it shares similarities with Monterey County, which is discussed in Chapter 3. Imperial County is second in lettuce production in California. The alfalfa hay industry also ranks second in the state, and Imperial Country produces other hays as well. Unlike other regions of the state, the hay industry in Imperial County ships a significant portion of its hay out of the region to dairies further north and to ports for export to Asia and the Middle East.
Access to irrigation water is more vital than the land itself. Cropland prices in Imperial County are lower than the Central Coast and the San Joaquin Valley. Produce land is valued at about $7,000 per acre and land suitable for hay is valued at about $4,000 per acre. About one third of the cropland is serviced by each of three canals that run north from the All-American Canal that traverses the southern border of the county as it heads west with water from the Colorado River basin. That means crop agriculture, especially in the western third of the Imperial Valley, depends on no-disruption of an irrigation water infrastructure that must travel through a potentially vulnerable “plumbing” system.
The Imperial County cattle industry is almost exclusively comprised of feedlots. It relies on abundant space with fewer environmental conflicts than experienced in the Central Valley. The industry also relies on access to feeder cattle from California dairies and from Mexico. Much of the livestock are Holstein steers that are fed on intensive rations for a year to reach high-priced grades at slaughter weight. This economic model requires reliable rail access to bring grain from the Midwest, which is then mixed with local hay. The profitability of the feed lot industry has also relied on local slaughter in the major beef packing plant described later in this chapter.
2.1 Meloland Cattle Company Case Study
Meloland Cattle Company was selected as a case study for this project because (i) it was strongly shaken by the El Mayor Cucapah M7.2 earthquake on April 4th, 2010, (ii) the US Geological Survey maintains a strong motion sensor on the Meloland Cattle Company property, and (iii) the owner of the business, Bill Brandenberg, is the father of PI Scott Brandenberg and was willing to
15
share information related to his business operation, disruptions caused by the earthquake, and concerns over potential disruptions caused by future earthquakes. This rather remarkable set of circumstances makes the case study of the Meloland Cattle Company particularly valuable for learning about the seismic effects on agriculture and agribusiness.
2.2 Description of Meloland Cattle Company and Related Business Operations
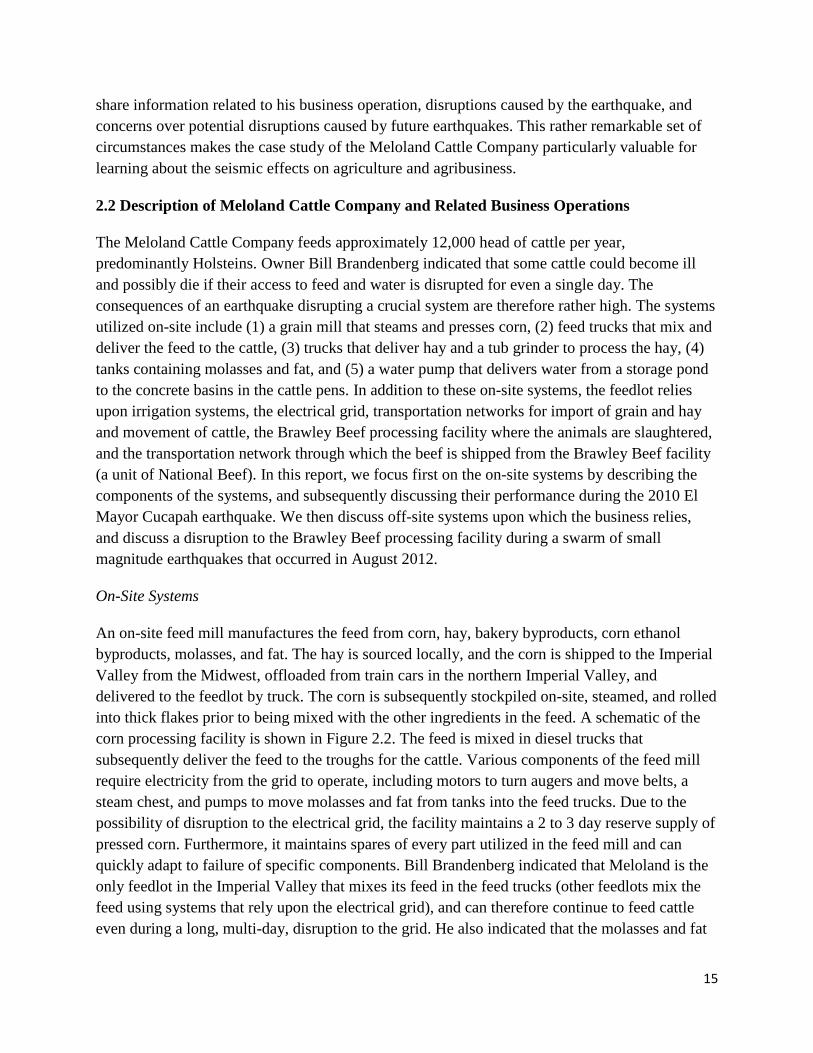
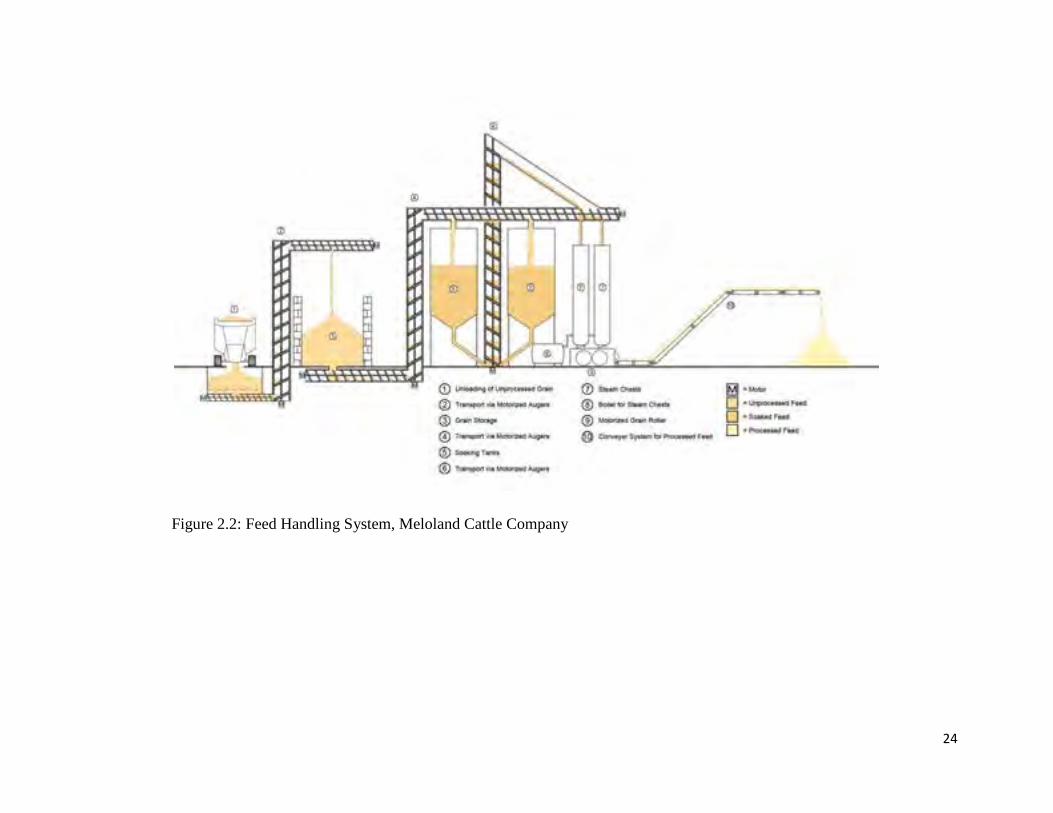
The Meloland Cattle Company feeds approximately 12,000 head of cattle per year, predominantly Holsteins. Owner Bill Brandenberg indicated that some cattle could become ill and possibly die if their access to feed and water is disrupted for even a single day. The consequences of an earthquake disrupting a crucial system are therefore rather high. The systems utilized on-site include (1) a grain mill that steams and presses corn, (2) feed trucks that mix and deliver the feed to the cattle, (3) trucks that deliver hay and a tub grinder to process the hay, (4) tanks containing molasses and fat, and (5) a water pump that delivers water from a storage pond to the concrete basins in the cattle pens. In addition to these on-site systems, the feedlot relies upon irrigation systems, the electrical grid, transportation networks for import of grain and hay and movement of cattle, the Brawley Beef processing facility where the animals are slaughtered, and the transportation network through which the beef is shipped from the Brawley Beef facility (a unit of National Beef). In this report, we focus first on the on-site systems by describing the components of the systems, and subsequently discussing their performance during the 2010 El Mayor Cucapah earthquake. We then discuss off-site systems upon which the business relies, and discuss a disruption to the Brawley Beef processing facility during a swarm of small magnitude earthquakes that occurred in August 2012.
On-Site Systems
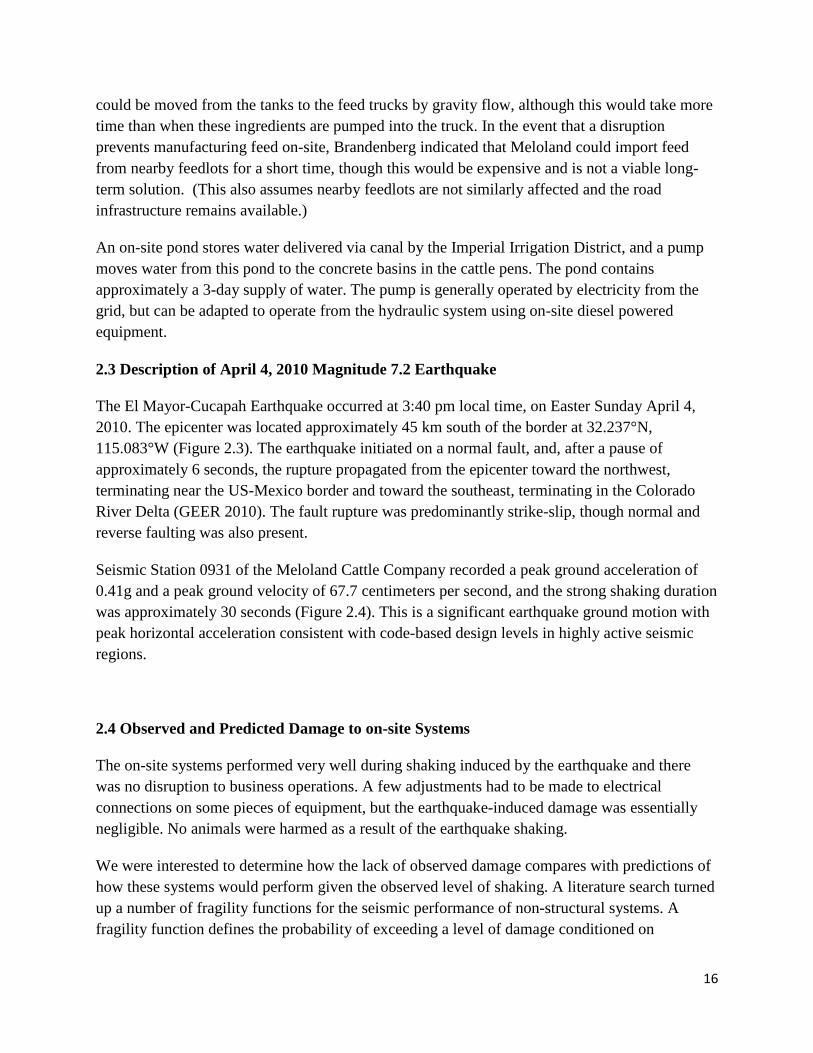
An on-site feed mill manufactures the feed from corn, hay, bakery byproducts, corn ethanol byproducts, molasses, and fat. The hay is sourced locally, and the corn is shipped to the Imperial Valley from the Midwest, offloaded from train cars in the northern Imperial Valley, and delivered to the feedlot by truck. The corn is subsequently stockpiled on-site, steamed, and rolled into thick flakes prior to being mixed with the other ingredients in the feed. A schematic of the corn processing facility is shown in Figure 2.2. The feed is mixed in diesel trucks that subsequently deliver the feed to the troughs for the cattle. Various components of the feed mill require electricity from the grid to operate, including motors to turn augers and move belts, a steam chest, and pumps to move molasses and fat from tanks into the feed trucks. Due to the possibility of disruption to the electrical grid, the facility maintains a 2 to 3 day reserve supply of pressed corn. Furthermore, it maintains spares of every part utilized in the feed mill and can quickly adapt to failure of specific components. Bill Brandenberg indicated that Meloland is the only feedlot in the Imperial Valley that mixes its feed in the feed trucks (other feedlots mix the feed using systems that rely upon the electrical grid), and can therefore continue to feed cattle even during a long, multi-day, disruption to the grid. He also indicated that the molasses and fat
16
could be moved from the tanks to the feed trucks by gravity flow, although this would take more time than when these ingredients are pumped into the truck. In the event that a disruption prevents manufacturing feed on-site, Brandenberg indicated that Meloland could import feed from nearby feedlots for a short time, though this would be expensive and is not a viable long-term solution. (This also assumes nearby feedlots are not similarly affected and the road infrastructure remains available.)
An on-site pond stores water delivered via canal by the Imperial Irrigation District, and a pump moves water from this pond to the concrete basins in the cattle pens. The pond contains approximately a 3-day supply of water. The pump is generally operated by electricity from the grid, but can be adapted to operate from the hydraulic system using on-site diesel powered equipment.
2.3 Description of April 4, 2010 Magnitude 7.2 Earthquake
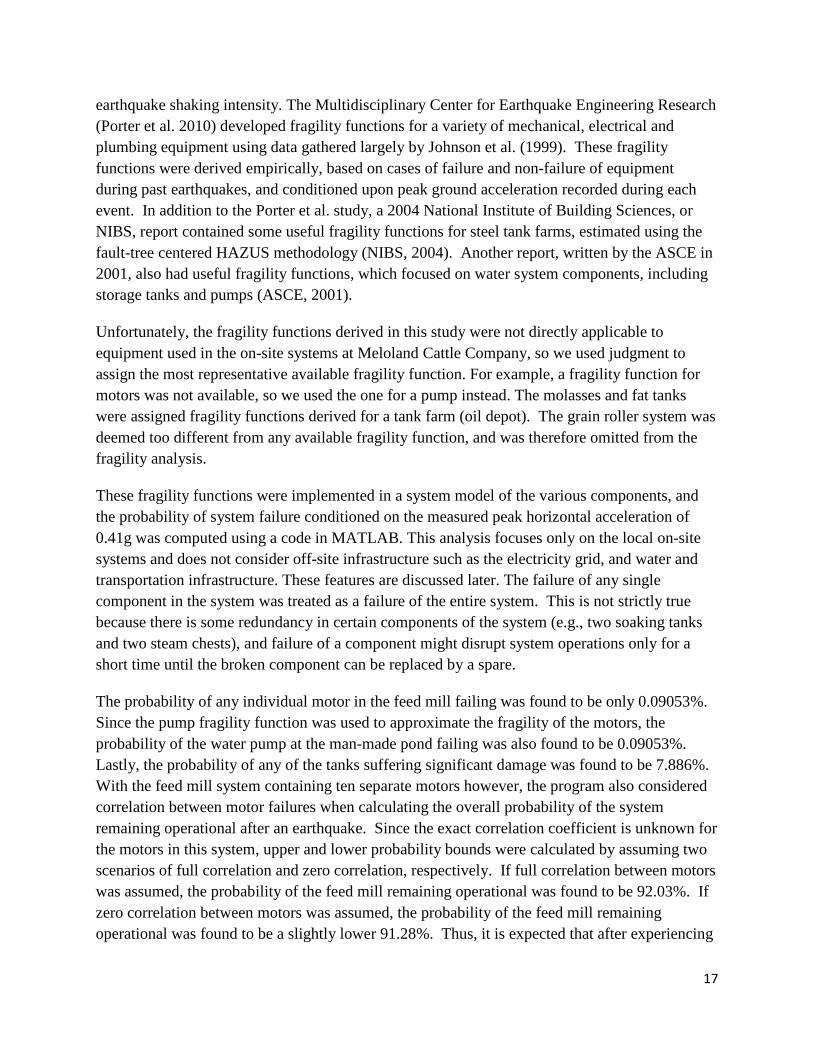
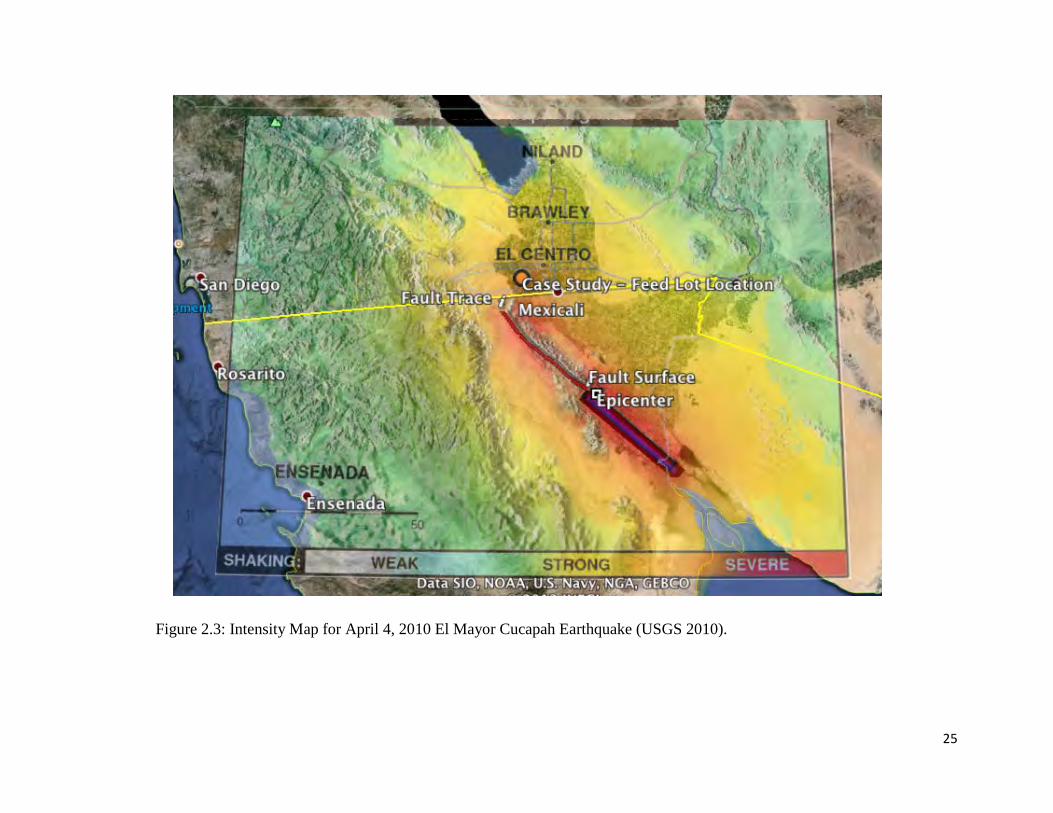
The El Mayor-Cucapah Earthquake occurred at 3:40 pm local time, on Easter Sunday April 4, 2010. The epicenter was located approximately 45 km south of the border at 32.237°N, 115.083°W (Figure 2.3). The earthquake initiated on a normal fault, and, after a pause of approximately 6 seconds, the rupture propagated from the epicenter toward the northwest, terminating near the US-Mexico border and toward the southeast, terminating in the Colorado River Delta (GEER 2010). The fault rupture was predominantly strike-slip, though normal and reverse faulting was also present.
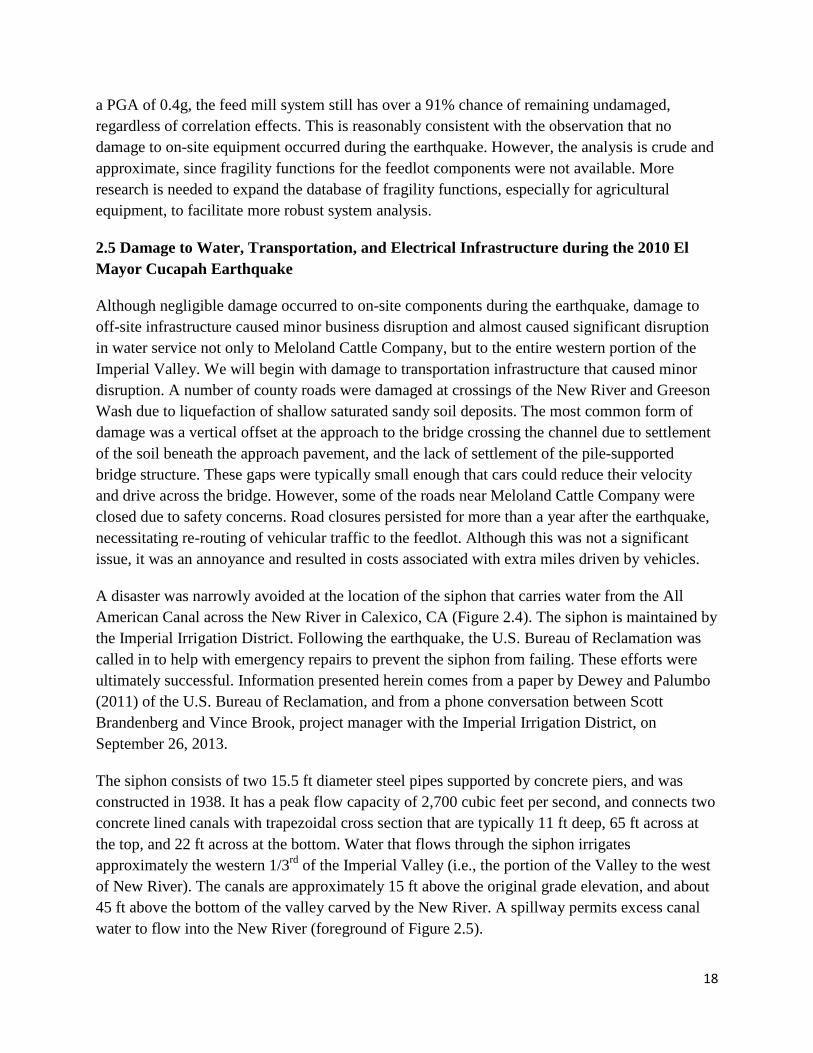
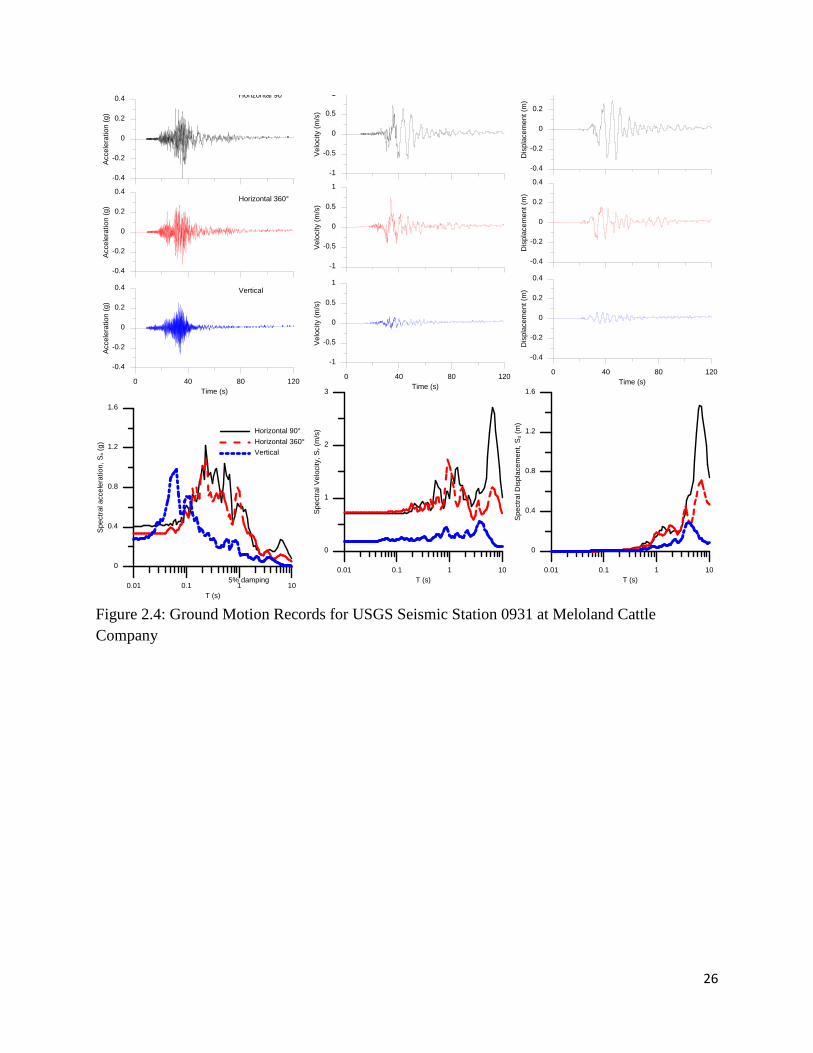
Seismic Station 0931 of the Meloland Cattle Company recorded a peak ground acceleration of 0.41g and a peak ground velocity of 67.7 centimeters per second, and the strong shaking duration was approximately 30 seconds (Figure 2.4). This is a significant earthquake ground motion with peak horizontal acceleration consistent with code-based design levels in highly active seismic regions.
2.4 Observed and Predicted Damage to on-site Systems
The on-site systems performed very well during shaking induced by the earthquake and there was no disruption to business operations. A few adjustments had to be made to electrical connections on some pieces of equipment, but the earthquake-induced damage was essentially negligible. No animals were harmed as a result of the earthquake shaking.
We were interested to determine how the lack of observed damage compares with predictions of how these systems would perform given the observed level of shaking. A literature search turned up a number of fragility functions for the seismic performance of non-structural systems. A fragility function defines the probability of exceeding a level of damage conditioned on
17
earthquake shaking intensity. The Multidisciplinary Center for Earthquake Engineering Research (Porter et al. 2010) developed fragility functions for a variety of mechanical, electrical and plumbing equipment using data gathered largely by Johnson et al. (1999). These fragility functions were derived empirically, based on cases of failure and non-failure of equipment during past earthquakes, and conditioned upon peak ground acceleration recorded during each event. In addition to the Porter et al. study, a 2004 National Institute of Building Sciences, or NIBS, report contained some useful fragility functions for steel tank farms, estimated using the fault-tree centered HAZUS methodology (NIBS, 2004). Another report, written by the ASCE in 2001, also had useful fragility functions, which focused on water system components, including storage tanks and pumps (ASCE, 2001).
Unfortunately, the fragility functions derived in this study were not directly applicable to equipment used in the on-site systems at Meloland Cattle Company, so we used judgment to assign the most representative available fragility function. For example, a fragility function for motors was not available, so we used the one for a pump instead. The molasses and fat tanks were assigned fragility functions derived for a tank farm (oil depot). The grain roller system was deemed too different from any available fragility function, and was therefore omitted from the fragility analysis.
These fragility functions were implemented in a system model of the various components, and the probability of system failure conditioned on the measured peak horizontal acceleration of 0.41g was computed using a code in MATLAB. This analysis focuses only on the local on-site systems and does not consider off-site infrastructure such as the electricity grid, and water and transportation infrastructure. These features are discussed later. The failure of any single component in the system was treated as a failure of the entire system. This is not strictly true because there is some redundancy in certain components of the system (e.g., two soaking tanks and two steam chests), and failure of a component might disrupt system operations only for a short time until the broken component can be replaced by a spare.
The probability of any individual motor in the feed mill failing was found to be only 0.09053%. Since the pump fragility function was used to approximate the fragility of the motors, the probability of the water pump at the man-made pond failing was also found to be 0.09053%. Lastly, the probability of any of the tanks suffering significant damage was found to be 7.886%. With the feed mill system containing ten separate motors however, the program also considered correlation between motor failures when calculating the overall probability of the system remaining operational after an earthquake. Since the exact correlation coefficient is unknown for the motors in this system, upper and lower probability bounds were calculated by assuming two scenarios of full correlation and zero correlation, respectively. If full correlation between motors was assumed, the probability of the feed mill remaining operational was found to be 92.03%. If zero correlation between motors was assumed, the probability of the feed mill remaining operational was found to be a slightly lower 91.28%. Thus, it is expected that after experiencing
18
a PGA of 0.4g, the feed mill system still has over a 91% chance of remaining undamaged, regardless of correlation effects. This is reasonably consistent with the observation that no damage to on-site equipment occurred during the earthquake. However, the analysis is crude and approximate, since fragility functions for the feedlot components were not available. More research is needed to expand the database of fragility functions, especially for agricultural equipment, to facilitate more robust system analysis.
2.5 Damage to Water, Transportation, and Electrical Infrastructure during the 2010 El Mayor Cucapah Earthquake
Although negligible damage occurred to on-site components during the earthquake, damage to off-site infrastructure caused minor business disruption and almost caused significant disruption in water service not only to Meloland Cattle Company, but to the entire western portion of the Imperial Valley. We will begin with damage to transportation infrastructure that caused minor disruption. A number of county roads were damaged at crossings of the New River and Greeson Wash due to liquefaction of shallow saturated sandy soil deposits. The most common form of damage was a vertical offset at the approach to the bridge crossing the channel due to settlement of the soil beneath the approach pavement, and the lack of settlement of the pile-supported bridge structure. These gaps were typically small enough that cars could reduce their velocity and drive across the bridge. However, some of the roads near Meloland Cattle Company were closed due to safety concerns. Road closures persisted for more than a year after the earthquake, necessitating re-routing of vehicular traffic to the feedlot. Although this was not a significant issue, it was an annoyance and resulted in costs associated with extra miles driven by vehicles.
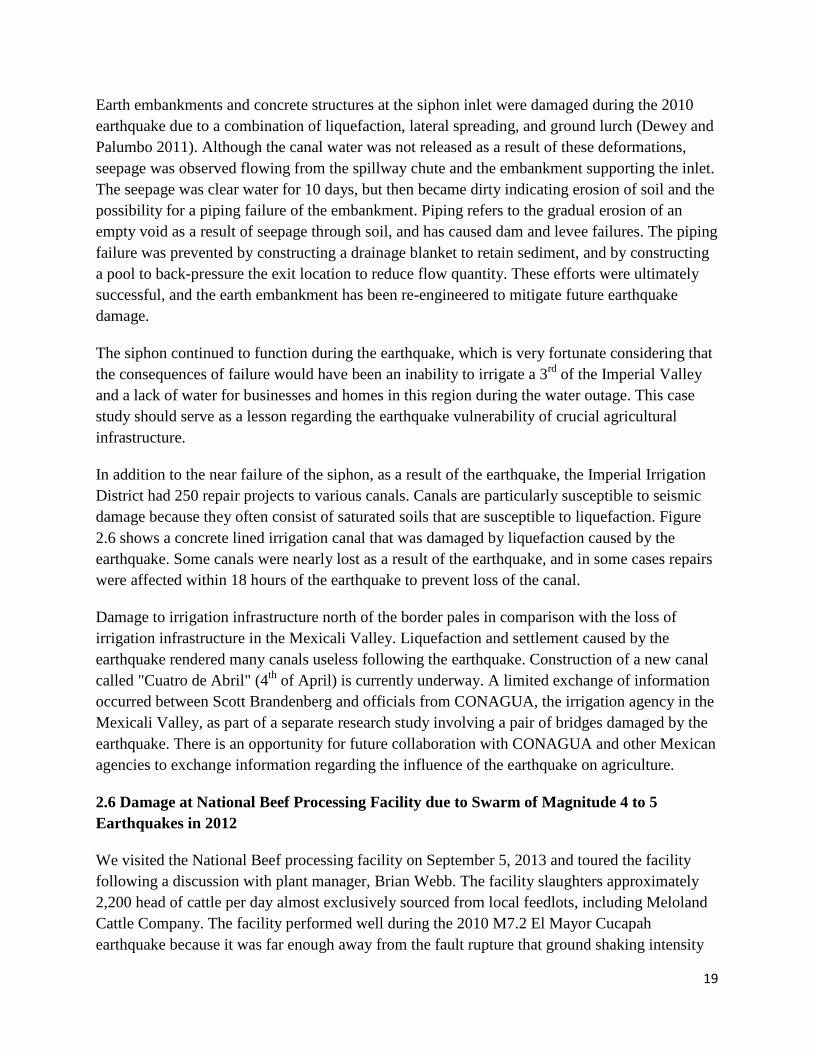
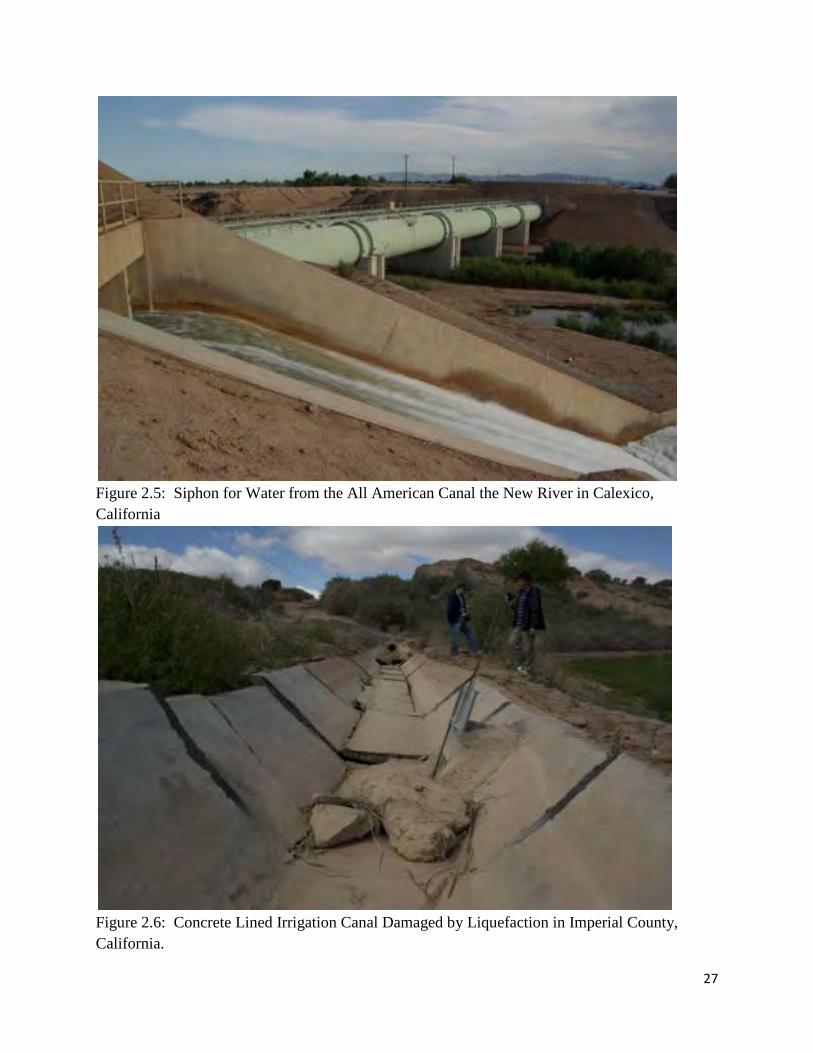
A disaster was narrowly avoided at the location of the siphon that carries water from the All American Canal across the New River in Calexico, CA (Figure 2.4). The siphon is maintained by the Imperial Irrigation District. Following the earthquake, the U.S. Bureau of Reclamation was called in to help with emergency repairs to prevent the siphon from failing. These efforts were ultimately successful. Information presented herein comes from a paper by Dewey and Palumbo (2011) of the U.S. Bureau of Reclamation, and from a phone conversation between Scott Brandenberg and Vince Brook, project manager with the Imperial Irrigation District, on September 26, 2013.
The siphon consists of two 15.5 ft diameter steel pipes supported by concrete piers, and was constructed in 1938. It has a peak flow capacity of 2,700 cubic feet per second, and connects two concrete lined canals with trapezoidal cross section that are typically 11 ft deep, 65 ft across at the top, and 22 ft across at the bottom. Water that flows through the siphon irrigates approximately the western 1/3rd of the Imperial Valley (i.e., the portion of the Valley to the west of New River). The canals are approximately 15 ft above the original grade elevation, and about 45 ft above the bottom of the valley carved by the New River. A spillway permits excess canal water to flow into the New River (foreground of Figure 2.5).
19
Earth embankments and concrete structures at the siphon inlet were damaged during the 2010 earthquake due to a combination of liquefaction, lateral spreading, and ground lurch (Dewey and Palumbo 2011). Although the canal water was not released as a result of these deformations, seepage was observed flowing from the spillway chute and the embankment supporting the inlet. The seepage was clear water for 10 days, but then became dirty indicating erosion of soil and the possibility for a piping failure of the embankment. Piping refers to the gradual erosion of an empty void as a result of seepage through soil, and has caused dam and levee failures. The piping failure was prevented by constructing a drainage blanket to retain sediment, and by constructing a pool to back-pressure the exit location to reduce flow quantity. These efforts were ultimately successful, and the earth embankment has been re-engineered to mitigate future earthquake damage.
The siphon continued to function during the earthquake, which is very fortunate considering that the consequences of failure would have been an inability to irrigate a 3rd of the Imperial Valley and a lack of water for businesses and homes in this region during the water outage. This case study should serve as a lesson regarding the earthquake vulnerability of crucial agricultural infrastructure.
In addition to the near failure of the siphon, as a result of the earthquake, the Imperial Irrigation District had 250 repair projects to various canals. Canals are particularly susceptible to seismic damage because they often consist of saturated soils that are susceptible to liquefaction. Figure 2.6 shows a concrete lined irrigation canal that was damaged by liquefaction caused by the earthquake. Some canals were nearly lost as a result of the earthquake, and in some cases repairs were affected within 18 hours of the earthquake to prevent loss of the canal.
Damage to irrigation infrastructure north of the border pales in comparison with the loss of irrigation infrastructure in the Mexicali Valley. Liquefaction and settlement caused by the earthquake rendered many canals useless following the earthquake. Construction of a new canal called "Cuatro de Abril" (4th of April) is currently underway. A limited exchange of information occurred between Scott Brandenberg and officials from CONAGUA, the irrigation agency in the Mexicali Valley, as part of a separate research study involving a pair of bridges damaged by the earthquake. There is an opportunity for future collaboration with CONAGUA and other Mexican agencies to exchange information regarding the influence of the earthquake on agriculture.
2.6 Damage at National Beef Processing Facility due to Swarm of Magnitude 4 to 5 Earthquakes in 2012
We visited the National Beef processing facility on September 5, 2013 and toured the facility following a discussion with plant manager, Brian Webb. The facility slaughters approximately 2,200 head of cattle per day almost exclusively sourced from local feedlots, including Meloland Cattle Company. The facility performed well during the 2010 M7.2 El Mayor Cucapah earthquake because it was far enough away from the fault rupture that ground shaking intensity
20
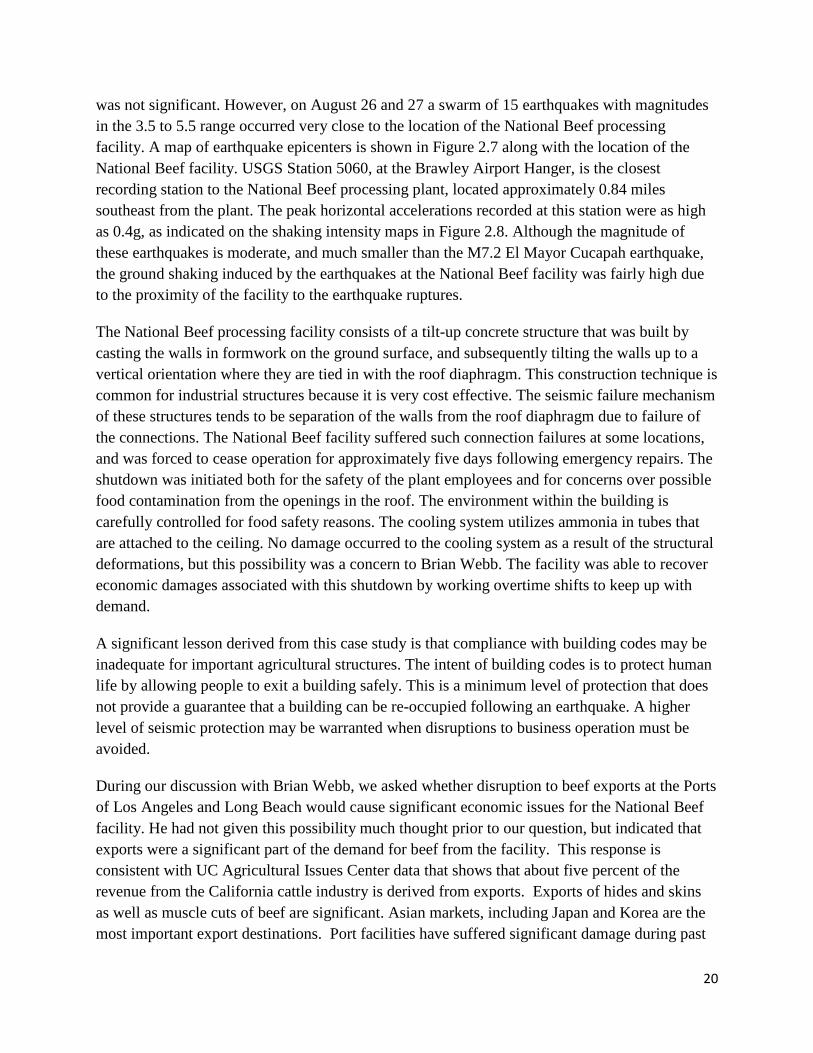
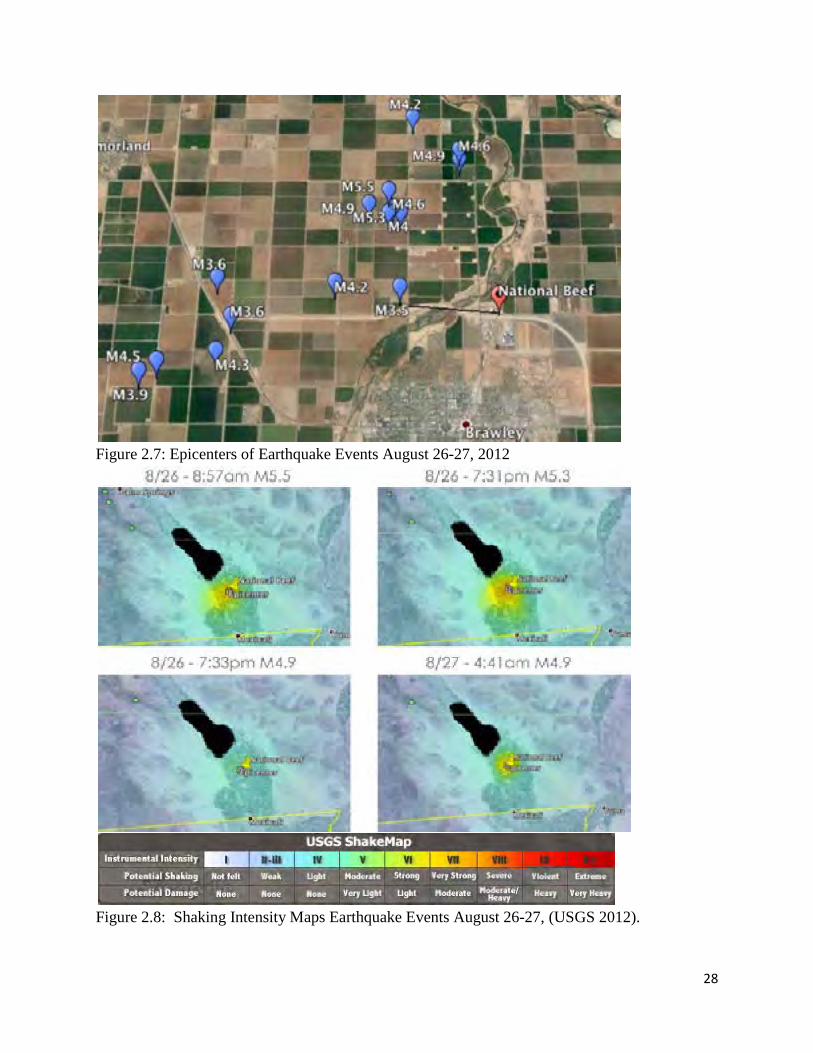
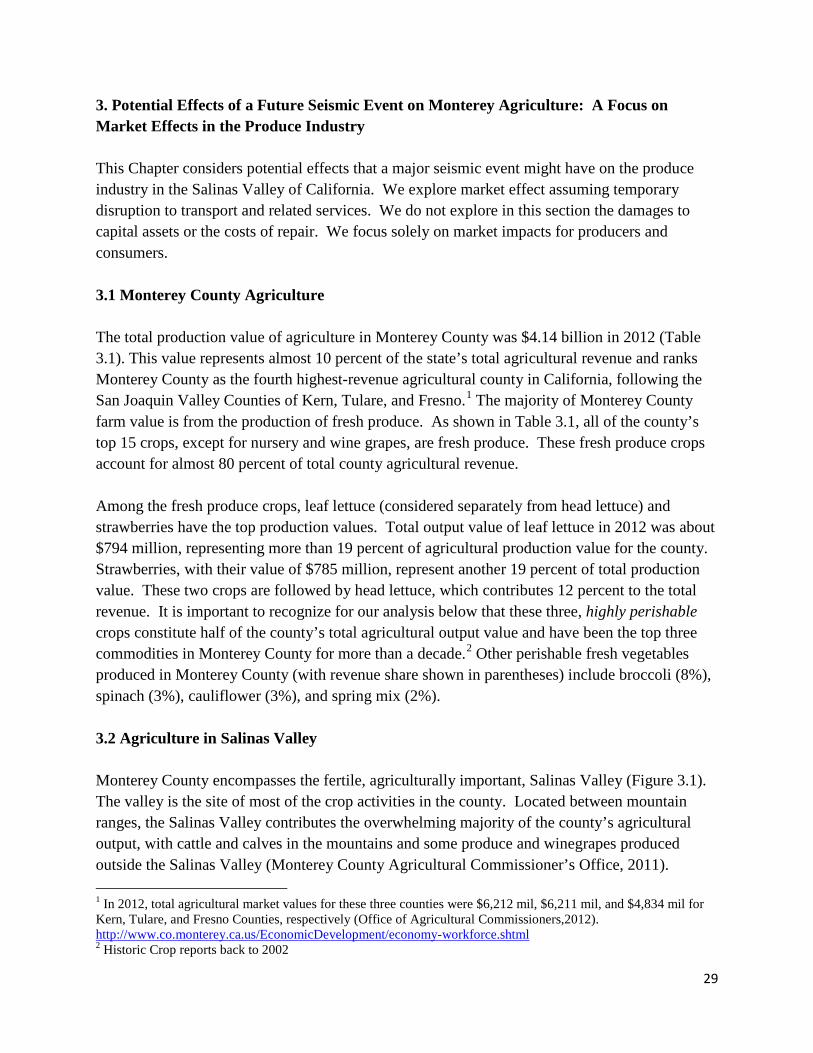
was not significant. However, on August 26 and 27 a swarm of 15 earthquakes with magnitudes in the 3.5 to 5.5 range occurred very close to the location of the National Beef processing facility. A map of earthquake epicenters is shown in Figure 2.7 along with the location of the National Beef facility. USGS Station 5060, at the Brawley Airport Hanger, is the closest recording station to the National Beef processing plant, located approximately 0.84 miles southeast from the plant. The peak horizontal accelerations recorded at this station were as high as 0.4g, as indicated on the shaking intensity maps in Figure 2.8. Although the magnitude of these earthquakes is moderate, and much smaller than the M7.2 El Mayor Cucapah earthquake, the ground shaking induced by the earthquakes at the National Beef facility was fairly high due to the proximity of the facility to the earthquake ruptures.
The National Beef processing facility consists of a tilt-up concrete structure that was built by casting the walls in formwork on the ground surface, and subsequently tilting the walls up to a vertical orientation where they are tied in with the roof diaphragm. This construction technique is common for industrial structures because it is very cost effective. The seismic failure mechanism of these structures tends to be separation of the walls from the roof diaphragm due to failure of the connections. The National Beef facility suffered such connection failures at some locations, and was forced to cease operation for approximately five days following emergency repairs. The shutdown was initiated both for the safety of the plant employees and for concerns over possible food contamination from the openings in the roof. The environment within the building is carefully controlled for food safety reasons. The cooling system utilizes ammonia in tubes that are attached to the ceiling. No damage occurred to the cooling system as a result of the structural deformations, but this possibility was a concern to Brian Webb. The facility was able to recover economic damages associated with this shutdown by working overtime shifts to keep up with demand.
A significant lesson derived from this case study is that compliance with building codes may be inadequate for important agricultural structures. The intent of building codes is to protect human life by allowing people to exit a building safely. This is a minimum level of protection that does not provide a guarantee that a building can be re-occupied following an earthquake. A higher level of seismic protection may be warranted when disruptions to business operation must be avoided.
During our discussion with Brian Webb, we asked whether disruption to beef exports at the Ports of Los Angeles and Long Beach would cause significant economic issues for the National Beef facility. He had not given this possibility much thought prior to our question, but indicated that exports were a significant part of the demand for beef from the facility. This response is consistent with UC Agricultural Issues Center data that shows that about five percent of the revenue from the California cattle industry is derived from exports. Exports of hides and skins as well as muscle cuts of beef are significant. Asian markets, including Japan and Korea are the most important export destinations. Port facilities have suffered significant damage during past
21
earthquakes because they are often constructed on man-made fill that is susceptible to liquefaction and associated ground deformations. Examples include damage to the Port of Kobe following the 1995 Kobe earthquake and to the Port of Oakland following the 1989 Loma Prieta earthquake. Such disruptions could have significant adverse consequences to businesses that rely upon export markets.
2.7 Opportunities for Future Research
The preliminary study presented in this report helped to identify several important issues that warrant future research related to the seismic vulnerability of agricultural infrastructure. Topics of research that we believe are required include:
1. Development of fragility functions for components commonly used in agricultural systems. In our analysis of the Meloland Cattle Company case history, we used fragility functions that most closely matched the components in the feed mill. The mill is a rather simple system compared to many other agricultural systems such as milk production equipment at dairies, yet the available information was inadequate to perform a thorough and accurate analysis of seismic risk. Development of these fragility functions could proceed empirically, by gathering information about the seismic performance of agricultural facilities that have experienced past earthquakes. In some cases where specific components are deemed crucial but information is inadequate, shake table testing could help shed light on the seismic performance of key components used in agricultural facilities.
2. Coordination with Imperial Irrigation District, CONAGUA and other Mexican water agencies, to learn more about damage to irrigation infrastructure caused by the 2010 El Mayor Cucapah earthquake. Preliminary coordination with these agencies through other research projects of Scott Brandenberg other research project identified that the agencies are eager to work with us, and we believe there are lessons to be learned through such an exchange of information.
3. Identify crucial pieces of infrastructure whose failure could result in significant economic damage to agriculture in California. Local farmers and ranchers bear responsibility for the seismic performance of on-site equipment and systems utilized in their business operation, but they often have little influence over other important infrastructure that is crucial to their business operation. An example is the siphon that carries All American Canal water over the New River in Calexico, CA. Many farmers rely upon this irrigation water, and failure of this component of the irrigation system could have significant adverse consequences. Other examples include port facilities, rail lines (potentially susceptible to landslides, surface fault rupture, and liquefaction-induced ground failure), the electrical grid, and water distribution infrastructure. A particularly important and relevant piece of water distribution infrastructure is the Sacramento / San Joaquin Delta, which serves as the hub of California's water delivery system. An earthquake in the Delta could cause multiple simultaneous levee breaches that would draw saline water into the Delta, thereby halting water delivery. Delta water is the only source for many farmers in the western
22
San Joaquin Valley, and disruption to this system could have disastrous consequences for California agriculture.
References Agricultural Issues Center, University of California. 2014. “Estimating California’s Agricultural
Exports.” http://aic.ucdavis.edu/pub/exports.html. ASCE. 2001. Seismic Fragility Formulations for Water Systems, Part 1 – Guideline. American
Society of Civil Engineers. http://www.americanlifelinesalliance.com/pdf/Part_1_Guideline.pdf
NIBS. 2004. "Earthquake Loss Estimation Methodology HAZUS." National Institute of Building Sciences, FEMA, Washington D.C.H
Porter, K., Johnson, G., Sheppard, R., and Bachman, R., 2010. Fragility of Mechanical, Electrical, and Plumbing Equipment, Earthquake Spectra: May 2010, Vol. 26, No. 2, pp. 451-472.
US Geological Survey (USGS) (2010). "CISN Shake Map for Sierra El Mayor Earthquake." http://earthquake.usgs.gov/earthquakes/shakemap/sc/shake/14607652/.
US Geological Survey (USGS) (2012). CISN Shake Map for Brawley earthquake swarm.
23
Figure 2.1 Distribution of Imperial Country Farm Value of Production by Commodity, Total
Value = $1.96 billion in 2011.
Lettuce,
Hay
Cattle, Feedlot Broccoli
Sugar Beets
Carrots
Seed
Wheat
Melons
Other Vegetables
Other Livestock Other
24
Figure 2.2: Feed Handling System, Meloland Cattle Company
25
Figure 2.3: Intensity Map for April 4, 2010 El Mayor Cucapah Earthquake (USGS 2010).
26
Figure 2.4: Ground Motion Records for USGS Seismic Station 0931 at Meloland Cattle Company
-0.4
-0.2
0
0.2
0.4A
ccel
erat
ion
(g)
0.01 0.1 1 10T (s)
0
0.4
0.8
1.2
1.6
Spe
ctra
l acc
eler
atio
n, S
a (g)
Horizontal 90°Horizontal 360°Vertical
0 40 80 120Time (s)
-0.4
-0.2
0
0.2
0.4
Acc
eler
atio
n (g
)
-0.4
-0.2
0
0.2
0.4
Acc
eler
atio
n (g
)
-1
-0.5
0
0.5
1
Vel
ocity
(m/s
)
0 40 80 120Time (s)
-1
-0.5
0
0.5
1
Vel
ocity
(m/s
)
-1
-0.5
0
0.5
1
Vel
ocity
(m/s
)
-0.4
-0.2
0
0.2
Dis
plac
emen
t (m
)
0 40 80 120Time (s)
-0.4
-0.2
0
0.2
0.4
Dis
plac
emen
t (m
)
-0.4
-0.2
0
0.2
0.4
Dis
plac
emen
t (m
)
5% damping
Horizontal 90
Vertical
Horizontal 360°
0.01 0.1 1 10T (s)
0
1
2
3
Spe
ctra
l Vel
ocity
, Sv (
m/s
)
0.01 0.1 1 10T (s)
0
0.4
0.8
1.2
1.6
Spe
ctra
l Dis
plac
emen
t, S
d (m
)
27
Figure 2.5: Siphon for Water from the All American Canal the New River in Calexico, California
Figure 2.6: Concrete Lined Irrigation Canal Damaged by Liquefaction in Imperial County, California.
28
Figure 2.7: Epicenters of Earthquake Events August 26-27, 2012
Figure 2.8: Shaking Intensity Maps Earthquake Events August 26-27, (USGS 2012).
29
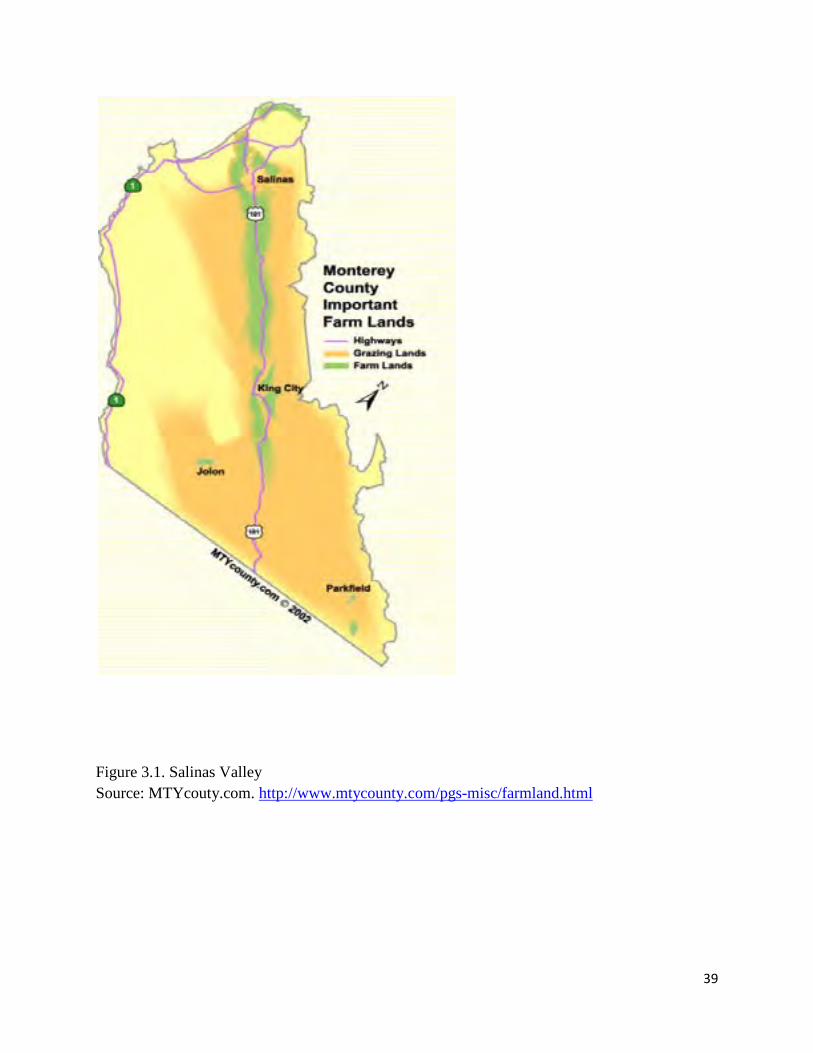
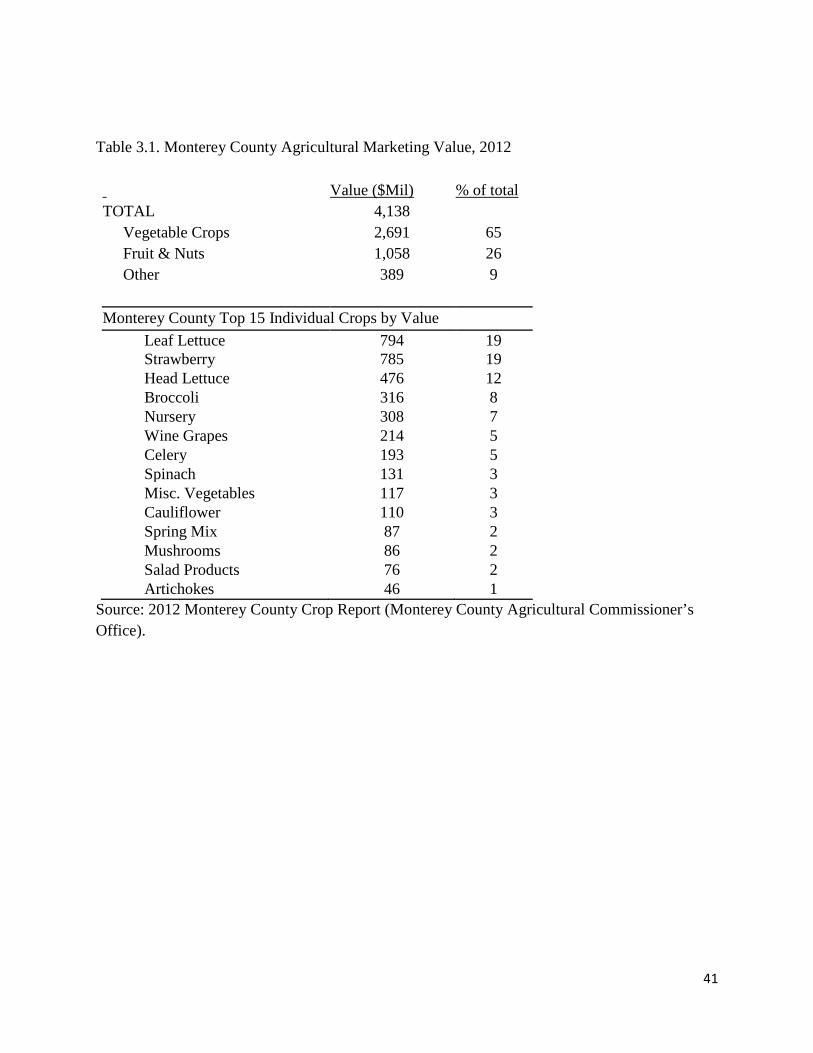
3. Potential Effects of a Future Seismic Event on Monterey Agriculture: A Focus on Market Effects in the Produce Industry This Chapter considers potential effects that a major seismic event might have on the produce industry in the Salinas Valley of California. We explore market effect assuming temporary disruption to transport and related services. We do not explore in this section the damages to capital assets or the costs of repair. We focus solely on market impacts for producers and consumers. 3.1 Monterey County Agriculture The total production value of agriculture in Monterey County was $4.14 billion in 2012 (Table 3.1). This value represents almost 10 percent of the state’s total agricultural revenue and ranks Monterey County as the fourth highest-revenue agricultural county in California, following the San Joaquin Valley Counties of Kern, Tulare, and Fresno.1 The majority of Monterey County farm value is from the production of fresh produce. As shown in Table 3.1, all of the county’s top 15 crops, except for nursery and wine grapes, are fresh produce. These fresh produce crops account for almost 80 percent of total county agricultural revenue. Among the fresh produce crops, leaf lettuce (considered separately from head lettuce) and strawberries have the top production values. Total output value of leaf lettuce in 2012 was about $794 million, representing more than 19 percent of agricultural production value for the county. Strawberries, with their value of $785 million, represent another 19 percent of total production value. These two crops are followed by head lettuce, which contributes 12 percent to the total revenue. It is important to recognize for our analysis below that these three, highly perishable crops constitute half of the county’s total agricultural output value and have been the top three commodities in Monterey County for more than a decade.2 Other perishable fresh vegetables produced in Monterey County (with revenue share shown in parentheses) include broccoli (8%), spinach (3%), cauliflower (3%), and spring mix (2%). 3.2 Agriculture in Salinas Valley Monterey County encompasses the fertile, agriculturally important, Salinas Valley (Figure 3.1). The valley is the site of most of the crop activities in the county. Located between mountain ranges, the Salinas Valley contributes the overwhelming majority of the county’s agricultural output, with cattle and calves in the mountains and some produce and winegrapes produced outside the Salinas Valley (Monterey County Agricultural Commissioner’s Office, 2011). 1 In 2012, total agricultural market values for these three counties were $6,212 mil, $6,211 mil, and $4,834 mil for Kern, Tulare, and Fresno Counties, respectively (Office of Agricultural Commissioners,2012). http://www.co.monterey.ca.us/EconomicDevelopment/economy-workforce.shtml 2 Historic Crop reports back to 2002
30
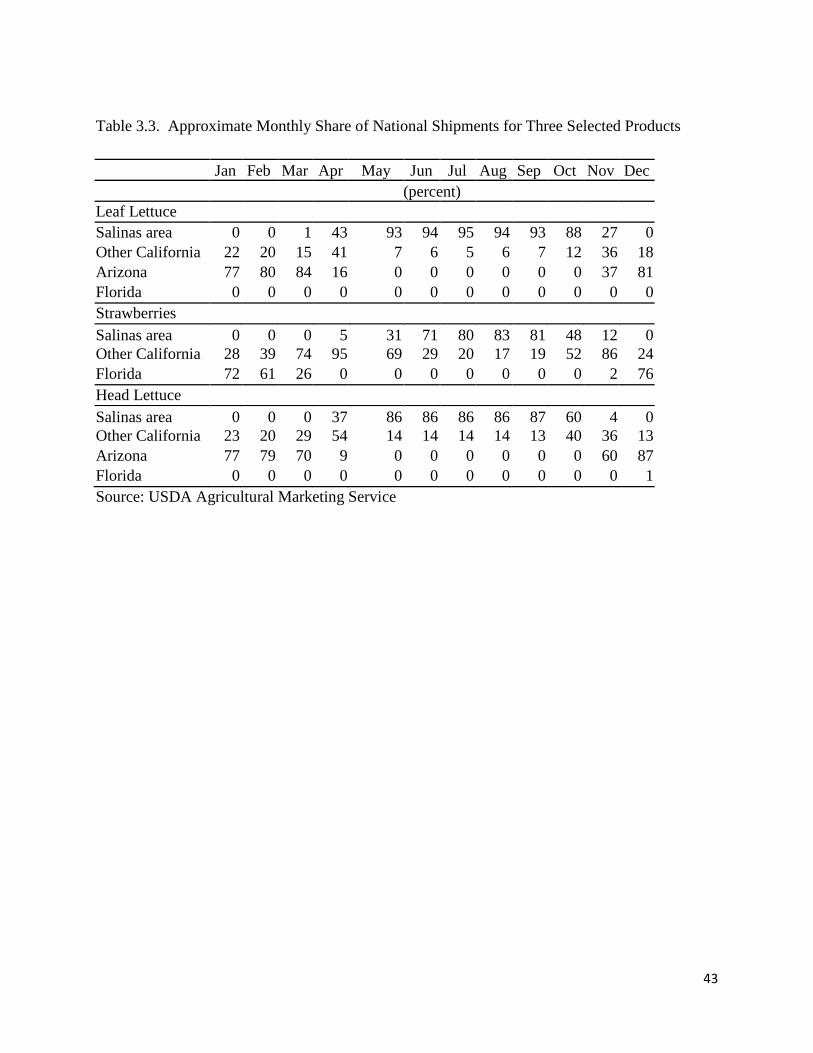
The Salinas Valley is also responsible for a large portion of North American fresh produce production. Each month between May and September, the Salinas Valley region supplies over 90 percent of combined leaf lettuce shipments from California, Arizona and Florida—the nation’s three major fresh produce suppliers. The Salinas Valley region also supplies over 70 percent of combined strawberry shipments during June through September and over 80 percent of head lettuce shipments during May and September (USDA). These shipment data indicate that the Salinas Valley is an important supplier of the nation’s fresh produce during its season and that any disruption in production or marketing in this region would cause notable impacts in the national market. Thus, national consumer markets (and exports) would be affected if a seismic event were to disrupt harvest or marketing. 3.3 Harvest, Post-harvest Handling and Marketing of Fresh Produce, with a focus on Lettuce and Strawberries Lettuce is harvested 70 to 130 days after planting. The planting and harvesting is continuous during the seasons with production staggered across fields. Lettuce is usually field-packed into cartons, meaning no further packing is required before shipment (Smith et al. 2011). Lettuce is typically packed 24 heads to a carton and vacuum cooled within hours of harvest. Vacuum cooling removes field heat in approximately 15 minutes, and reduces the temperature to the ideal storage temperature of 34 degrees Fahrenheit (Turini et al. 2011). Cooling facilities are typically located within 25 miles of the field (Smith et al., 2009). Lettuce can be stored for between two and three weeks at the optimal temperature and 98% relative humidity (Turini et al. 2011). An alternative to field packing is marketing lettuce as a bulk product for further packaging. But in that case too, immediate cooling is crucial. Producers of bulk lettuce will harvest the lettuce and place it in one cubic yard bins for pre-cooling and transport to processing facilities, where it is further cut and packaged (Turini et al. 2011). Processing facilities are maintained at temperatures between 35 and 40 degrees Fahrenheit to maintain freshness (Turini et al. 2011). Strawberries are harvested by hand and transported to cooling facilities within one to four hours after harvesting (Bolda et al. 2010). Fresh strawberries are often placed into trays each holding 8, one pound containers. Strawberries are extremely perishable and have unusually demanding postharvest handling requirements. Even under ideal conditions they can rarely be kept for more than seven days after harvest. They must be cooled immediately to their lowest safe temperature (32 to 34 degrees Fahrenheit) to prevent over-ripening and decay, and they must not be allowed to re-warm. Strawberries are typically forced air cooled to 34 degrees Fahrenheit, stored, and transported by refrigerated trucks (NSF Center for Integrated Pest Management, 1999).
31
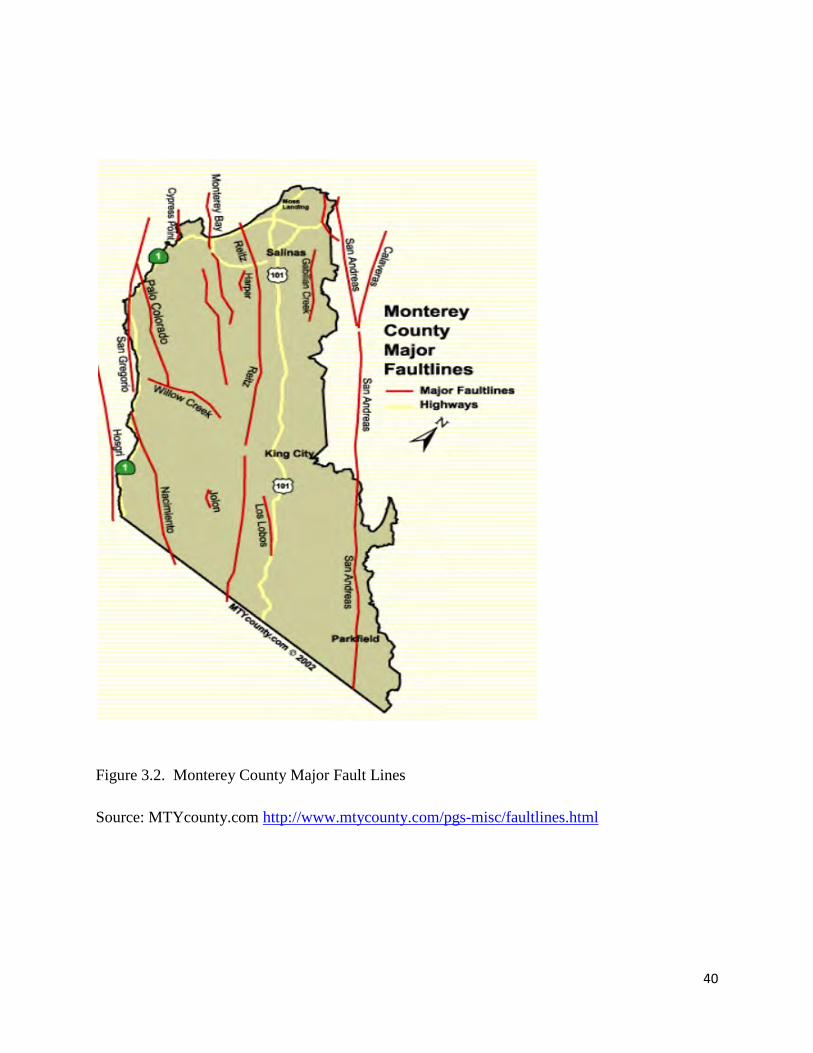
Firms that market fresh produce are referred to as “shippers.” Such firms are often growers that are vertically integrated, and control the production, harvesting, packing, cooling and marketing of the product. Vertically integrated produce operations can be referred to as “grower-shippers” (Carman et al. 2003). Many individual shippers now operate out of multiple locations in Salinas, the Imperial Valley, the San Joaquin Valley, Western Arizona and Mexico to ensure a year round supply of their products to retailers. Their product mix typically includes fresh vegetables and fresh cut vegetables or “value added products.” Produce grown in the Salinas Valley is shipped by refrigerated truck to markets throughout the United States and Canada. It takes between 4 and 5 days for a refrigerated truck to reach markets across the country (NSF Center for Integrated Pest Management, 1999). A limited quantity is shipped by air to high-priced export markets (Smith et al. 2009). The Japanese market takes a significant share of high-quality California produce. 3.4 Potential Seismic Risk for Agriculture in Monterey County Monterey County is located on active geologic fault lines. In the far east of the county, the San Andreas Fault, the most active fault, runs through the area of Parkfield, and numerous other major and minor fault lines run throughout the county (Figure 3.2). As documented in Chapter 2 of this report, seismic damages in agriculture can involve destruction of agricultural land, such as surface deformation and fracturing or other types of land damages, all of which make land unsuitable for continuing agricultural operations. Such damage to the land asset is particularly important in regions such as the Central Coast of California with extremely high land values that routinely reach $50,000 per acre (Rickert 2013). Also as documented in Chapter 2, seismic risk includes potential damage to farm and off-farm infrastructure. Here, we focus on two types of off-farm infrastructure failure related to seismic events, power outage and road destruction that cause disruption in harvesting and post-harvest activities. We focus our attention on vulnerabilities caused by the perishabiltiy of much of Monterey County agriculture. A distinctive characteristic of fresh produce is extreme perishabiltiy. This implies that an important risk for producers in the Salinas area is the interruption of the “cold chain,” or the temperature-controlled supply chain on which vegetables are transported from the field to cooling or processing facilities, and ultimately to the consumer. The first stage is particularly important because the vegetables retain "field heat" and are more likely to perish unless that heat is removed quickly. Once vegetables have reached cooling or processing facilities, it is critical that they remain within a specific temperature range, which differs depending on the commodity. This necessity
32
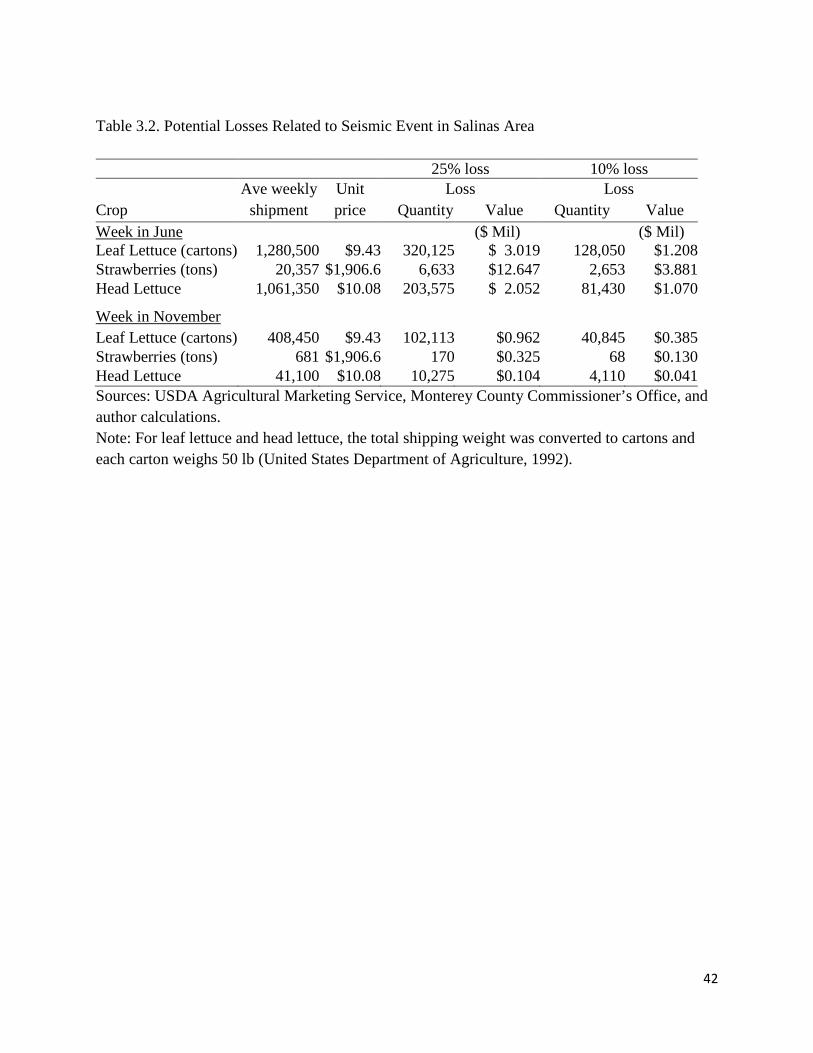
makes the supply chain vulnerable to disruptions in the electric power supplied to cooling facilities. Power outages related to natural disasters could result in substantial economic losses for perishable products. Prevalence of reliable alternate power sources, such as back-up generators (and their operational capacity) that can withstand a major local seismic event is not known and is a subject for further research. Transportation networks, specifically surface roads and especially U.S. Highway 101, are critical to maintaining the cold chain, since most vegetables are transported by refrigerated truck. The majority of cooling facilities are in Salinas or the north valley, while fields are spread out south of Salinas. Because the majority of cooling and processing facilities are located within a few miles of Highway 101, damage to that highway severe enough to stop shipments from reaching the appropriate cooling facilities will break the cold chain if alternate routes are congested or not available. Produce that is able to be moved to storage in centralized cooling facilities must then be transported to the next link in the marketing chain (wholesale markets or directly to retailer distribution centers or outlets) to maintain the quality of fresh produce. Continuous road access out of the Salinas regions is therefore also crucial. In the case of even a short term disruption in transportation routes to the next link in marketing chain, produce delivery may be delayed, which would result in potentially large monetary losses to those shippers affected and higher prices to consumers. These impacts are explored next. 3.5 Numeric Illustrations of Seismic Damages in the Agricultural Sector in Monterey County To illustrate the potential economic damage to agricultural production value after seismic events, we present estimates of revenue losses that would follow from four hypothetical scenarios that describe two levels of seismic damages for both the low production season and the high production season. Our analysis considers only losses to the portion of the national industry located in the Salinas (Monterey County) area that is geologically vulnerable to seismic events and where damages are likely to be significant, given the dominance of fresh produce in the region. To derive some illustrative values, our analysis focuses only on the three top crops from this region–leaf lettuce, strawberries, and head lettuce. We hypothesize two levels of seismic damage described by the loss of production marketed from the region at 10 percent and 25 percent. These products may become unmarketable due to quality degradation following a power outage in packing facilities or road disruptions that prevent products from being marketed. For illustration we examine the case when these seismic disruptions in cooling or transport last for one week before power and marketing services return to normal. The market calculations are based on hypothetical, but realistic, disruptions and serve
33
to illustrate the magnitude of vulnerabilities of routine rather than extreme losses from a moderate seismic event of the sorts that affected Imperial County in the example discussed in Chapter 2. Our example uses the shipment data from the Salinas region in June, which is the peak season for all three crops considered. Lettuce supplies originating from the California Central Coast peak in May and June, and are lowest in December and January, when Western Arizona replaces California as a major supplier (Smith et al. 2011). Monthly shipment data for 2012 were obtained from the USDA Agricultural Marketing Service. Monthly shipment data for 2012 were prorated to construct weekly data. To arrive at total revenue losses at the farm level, we use the farm level prices obtained from the 2012 Monterey County Crop Report, which can be considered annual average prices. We use these annual prices because no weekly (or monthly) prices, which match our investigated period, were available. Use of an annual price likely leads to overestimation of losses in high season (June) and underestimation of losses in low season. We calculate losses first without taking into consideration the market price response of supply disruptions and then we include the price impacts on revenue. 3.5.1 Loss calculations with no market price effects First we consider the case when the percentage of lost supply that is not available to market is simply translated into the same percentage of monetary losses. In other words, this example assumes constant prices and does not incorporate market effects on price that may be caused by changes in market quantity. Table 3.2 presents the revenue losses that are caused by a seismic event for the producers of three representative crops produced in the Salinas Valley under the assumptions of 25 percent and 10 percent losses of marketable quantities. These revenue losses represent impacts on growers and shippers affected directly by the seismic event. Because of the localized nature of some events, it is likely that some grower-shippers could have a total loss of quantity and revenue while grower-shippers in another location within the Salinas Valley would have no loss in quantity. Another scenario that involved damage, for example to U.S. Highway 101, would entail wide-spread losses to many growers affected by a road closure to the main artery for the Salinas Valley. Similarly power outages could be localized or widespread across cooling facilities. The differences in losses between weeks of June and November are the direct consequences of the differences in the volume of production. As shown in Table 3.3, for all three crops considered, the season begins in either April or May and ends in November. In both these scenarios it is reasonable to expect that no increase in produce supply would be available from
34
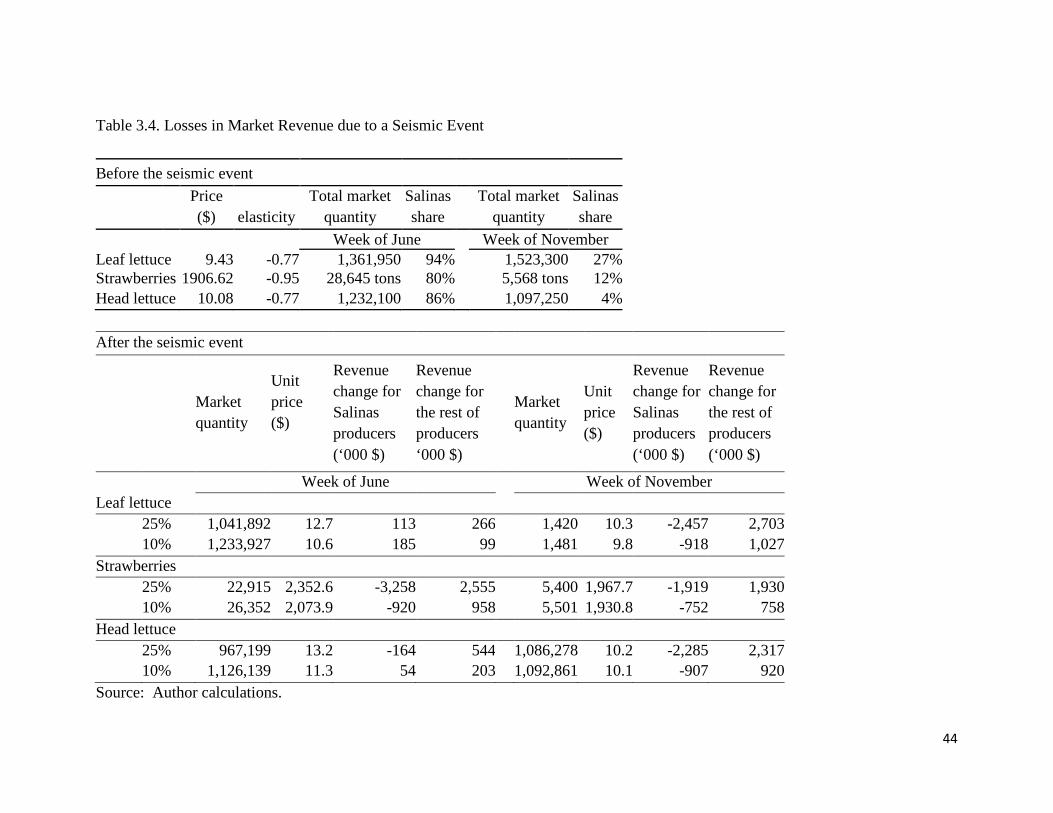
other farms or other regions. A shortfall that occurs in the single week is simply not enough time for production or supply response in crop agriculture. 3.5.2 Loss calculations with price effects incorporated As shown in Table 3.3, the Salinas area is a major supplier of these products during the appropriate season. That means that any changes in supply originated from the Salinas area is likely to affect the market price of that produce item substantially. The same supply disruptions (scenarios 10 percent and 25 percent) as in section 3.5.1 are extended by incorporating realistic market price effects. Increases in market price due to temporary supply disruptions are familiar in produce markets. The most common cases are losses of production due to a freeze or yield short-fall due to pests or some other localized problem. The higher price benefits those producers and shippers that continue to have products to sell and disadvantages consumers in higher food costs for produce. We estimate the price changes associated with the quantity changes based on econometric evidence on the price responsiveness of quantity demanded for these produce items. A “price elasticity of demand” measures the proportional (percentage) change in market quantity demanded relative to proportional (percentage) change in price. For this study, price elasticity of demand was determined based on the findings in a study of food demand by Okrent and Alston (2011). They estimated the price elasticities by commodity group and we use -0.77 for the elasticity of leaf lettuce and head lettuce, which was estimated for fresh vegetables, and -0.95 for the elasticity of strawberries, which was estimated for fresh fruit. We are particularly interested in the inverse of the price elasticity of demand (or the “price flexibility”) which shows how much market price will rise with a reduction in quantity available in the market. A price elasticity of demand less than one in absolute value, as applies for most food items, implies that a reduction in quantity causes a more than proportional rise in price and therefore an increase in aggregate total revenue. This aggregate revenue impact must be placed in context. First, it represents the accepted notion that consumers face losses with market disruptions because prices rise and may rise substantially. Second, although aggregate revenues increase due to the substantial price increase, this is little benefit to those producers and shippers who have little to sell because their own supply disruptions are larger than average. Thus we expect disruptions to benefit those least affected and may cause severe business losses to others who bear the brunt of the lost production. Second, these total revenue calculations do not include impacts on costs of production and distribution. For example, if road disruptions cause higher costs for the share of the quantity that
35
gets to market, even producers and shippers that experience higher total revenue may suffer losses in net revenue. Or, for example, if cooling facilities shift to backup generators that are expensive to operate, they may experience net losses, even if total revenue increases. Before applying these elasticities to calculate revenue, we need to determine initial market quantities. We obtained additional shipment quantities originated from other regions including other California, Arizona and Florida (USDA Agricultural Marketing Service). “Other California” in Table 3.3 includes mostly the Oxnard (Ventura County) and Santa Maria (Santa Barbara County) areas. Under prescribed price elasticities, new prices are simulated after market quantities supplied are reduced by the losses in the Salinas area. The implied price increase, of course, larger for a 25 percent loss in Salinas output a 10 percent loss in output. The larger percentage reduction in national supply occurs during the peak Salinas marketing season. Table 3.4 presents the losses or gains in total revenue resulting from Salinas Valley seismic events to producers in the Salinas Valley, both those that face disruptions and those that do not, when aggregate price effects are incorporated in calculations. The first part of the table presents the figures describing the status prior to the seismic event. When price effects are incorporated, any loss in market quantity leads to an increase in price. This implies that the monetary losses must be smaller than those calculated assuming no market price increases, and can be even negative (meaning gains) when the proportional price increase is greater than the proportional decrease in quantity. Note that during the week of June (peak season when the Salinas market share is very high) this is exactly what happens in the case of leaf lettuce. The price increase compensates more than the quantity loss for the Salinas farmers in both cases. For strawberries, with its demand elasticity of -0.95, the price increase was not high enough to compensate the quantity loss. In the case of head lettuce, producers in Salinas make a loss with a 25 percent product loss but gain slightly under the case of 10 percent product loss. However, when the seismic event occurs in November, product losses in the Salinas area imply income losses for producing firms in Salinas. During November, the Salinas region contributes a small share in market quantities of these products. Thus, prices change little and a loss in product surely means a loss in economic terms.
36
3.6 Final Remarks Finally, we need to reflect further on what these calculations do not include. As noted above we examine in detail only three commodities covering about half of total farm revenue. So, potential farm vulnerability is double the values calculated for these three crops. Second, as noted above, we have not calculated impacts on costs of production and marketing and these may be substantial. We have also not calculated losses for farm workers and those in allied industries. Many of the those losses are proportional to the quantity of produce, so even if some shippers gain revenue from higher prices, demand for farm and shipper employment will fall, as will demand for trucking services and all the other allied services that are so important to the Salinas Valley economy. An intense look at multiplier impact and economy-wide effects is important to assess agricultural impacts of a seismic event affecting Monterey County agriculture. All these topics are subjects for further economic research. Finally, this section began by considering hypothetical disruptions caused by a seismic event in Monterey County. An engineering analysis of grower-shipper operations is crucial to making these estimates more applicable to real potential events. This would allow a full integration of the economic and engineering analysis. We have highlighted market impacts and disruptions off the farm. This is consistent with the Imperial County experience of 2010 and 2012. But, more explicit analysis of seismic vulnerabilities in the produce industry is important for Monterey County, as well as other part of this vital industry for California.
37
References Bolda, Mark P., Laura Tourte, Karen M. Klonsky, and Richard L. De Moura. 2010. "Sample
Cost to Produce Strawberries: Central Coast Region." Cost Studies. University of California Cooperative Extension, 2010. Web.
Carman, Hoy F., Roberta Cook, and Richard J. Sexton. 2003. "Marketing California's
Agricultural Production." California Agriculture: Dimension and Issues.” University of California, Giannini Foundation of Agricultural Economics. Web.
Mitchell, F.G., and E.C. Maxie Gene Mayer. "Low Holding Temperatures Still Vital with Rapid
Marketing of Strawberries." California Agriculture Mar. 1966: 13-14. Print. Monterey County Agricultural Commissioner’s Office, 2011. “Economic Contributions of
Monterey County Agriculture,” 2011 Monterey County. Monterey County Agricultural Commissioner. 2012 Monterey County Crop
Report. 2013. National Science Foundation (NSF) Center for Integrated Pest Management, "Crop Profile for
Strawberries in California." Crop Profiles. 1999. Okrent, Abigail M., and Julian M. Alston. 2011 "Demand for Food in the United States: A
Review of Literature, Evaluation of Previous Estimates and Presentation of New Estimates of Demand." Giannini Foundation Monograph 48. University of California, Agriculture and Natural Resources.
Rickert, S. James. “ASFMRA: Trends in California land value.” AGPROFESSIONAL
MAGAZINE. Updated: 04/10/2013 http://www.agprofessional.com/agprofessional-magazine/ASFMRA-Trends-in-California-land-value--202354961.html?view=all
Smith, Richard F., Karen M. Klonsky, and Richard L. De Moura. 2009. "Sample Costs to
Produce Iceberg Lettuce: Central Coast Region." Cost Studies. University of California Cooperative Extension, LT-CC-09-2.
Smith, Richard, Michael Cahn, Oleg Daugovish, Steven Koike, Eric Natwick, Hugh Smith,
Krishna Subbarao, Etaferahu Takele, and Thomas Turini. 2011. "Leaf Lettuce Production
38
in California." UC Vegetable Research and Information Center. University of California: Agriculture and Natural Resources, 2011.
Takele, Etaferahu, Jose Aguiar, and Delos Walton.1996. "Production Practices and Sample
Costs to Produce Loose Leaf Lettuce: Coachella Valley." Cost Studies. University of California Cooperative Extension, 1996.
Turini, Thomas, Michael Cahn, Marita Cantwell, Louise Jackson, Steve Koike, Eric Natwick,
Richard Smith, Krishna Subbarao, and Etaferahu Takele. 2011. "Iceberg Lettuce Production in California." UC Davis Vegetable Research and Information Center: Vegetable Production Series, 2011.
United States. United States Department of Agriculture. Economic Research Service. Weights,
Measures and Conversion Factors for Agricultural Commodities and Their Products. Washington, D.C.: n.p., 1992.
39
Figure 3.1. Salinas Valley Source: MTYcouty.com. http://www.mtycounty.com/pgs-misc/farmland.html
40
Figure 3.2. Monterey County Major Fault Lines Source: MTYcounty.com http://www.mtycounty.com/pgs-misc/faultlines.html
41
Table 3.1. Monterey County Agricultural Marketing Value, 2012 Value ($Mil) % of total TOTAL 4,138
Vegetable Crops 2,691 65 Fruit & Nuts 1,058 26 Other 389 9
Monterey County Top 15 Individual Crops by Value Leaf Lettuce 794 19 Strawberry 785 19 Head Lettuce 476 12 Broccoli 316 8 Nursery 308 7 Wine Grapes 214 5 Celery 193 5 Spinach 131 3 Misc. Vegetables 117 3 Cauliflower 110 3 Spring Mix 87 2 Mushrooms 86 2 Salad Products 76 2 Artichokes 46 1
Source: 2012 Monterey County Crop Report (Monterey County Agricultural Commissioner’s Office).
42
Table 3.2. Potential Losses Related to Seismic Event in Salinas Area
25% loss 10% loss
Crop Ave weekly
shipment Unit price
Loss Quantity Value
Loss Quantity Value
Week in June
($ Mil)
($ Mil) Leaf Lettuce (cartons) 1,280,500 $9.43 320,125 $ 3.019 128,050 $1.208 Strawberries (tons) 20,357 $1,906.6 6,633 $12.647 2,653 $3.881 Head Lettuce
1,061,350 $10.08 203,575 $ 2.052 81,430 $1.070
Week in November
Leaf Lettuce (cartons) 408,450 $9.43 102,113 $0.962 40,845 $0.385
Strawberries (tons) 681 $1,906.6 170 $0.325 68 $0.130 Head Lettuce
41,100 $10.08 10,275 $0.104 4,110 $0.041
Sources: USDA Agricultural Marketing Service, Monterey County Commissioner’s Office, and author calculations. Note: For leaf lettuce and head lettuce, the total shipping weight was converted to cartons and each carton weighs 50 lb (United States Department of Agriculture, 1992).
43
Table 3.3. Approximate Monthly Share of National Shipments for Three Selected Products Jan Feb Mar Apr May Jun Jul Aug Sep Oct Nov Dec
(percent)
Leaf Lettuce Salinas area 0 0 1 43 93 94 95 94 93 88 27 0 Other California 22 20 15 41 7 6 5 6 7 12 36 18 Arizona 77 80 84 16 0 0 0 0 0 0 37 81 Florida 0 0 0 0 0 0 0 0 0 0 0 0 Strawberries
Salinas area 0 0 0 5 31 71 80 83 81 48 12 0 Other California 28 39 74 95 69 29 20 17 19 52 86 24 Florida 72 61 26 0 0 0 0 0 0 0 2 76 Head Lettuce
Salinas area 0 0 0 37 86 86 86 86 87 60 4 0 Other California 23 20 29 54 14 14 14 14 13 40 36 13 Arizona 77 79 70 9 0 0 0 0 0 0 60 87 Florida 0 0 0 0 0 0 0 0 0 0 0 1 Source: USDA Agricultural Marketing Service
44
Table 3.4. Losses in Market Revenue due to a Seismic Event
Before the seismic event
Price ($) elasticity
Total market quantity
Salinas share
Total market quantity
Salinas share
Week of June Week of November
Leaf lettuce 9.43 -0.77 1,361,950
94% 1,523,300
27% Strawberries 1906.62 -0.95 28,645 tons 80% 5,568 tons 12% Head lettuce 10.08 -0.77 1,232,100
86% 1,097,250
4% After the seismic event
Market quantity
Unit price ($)
Revenue change for Salinas producers (‘000 $)
Revenue change for the rest of producers ‘000 $)
Market quantity
Unit price ($)
Revenue change for Salinas producers (‘000 $)
Revenue change for the rest of producers (‘000 $)
Week of June
Week of November
Leaf lettuce
25%
1,041,892 12.7 113 266
1,420 10.3 -2,457 2,703
10%
1,233,927 10.6 185 99
1,481 9.8 -918 1,027 Strawberries
25% 22,915 2,352.6 -3,258 2,555
5,400 1,967.7 -1,919 1,930
10%
26,352 2,073.9 -920 958
5,501 1,930.8 -752 758 Head lettuce
25%
967,199 13.2 -164 544 1,086,278 10.2 -2,285 2,317
10%
1,126,139 11.3 54 203
1,092,861 10.1 -907 920
Source: Author calculations.
45
4. Seismic Activity and the California Dairy Industry
We documented in Chapter 1 that dairy farming is the largest industry in California agriculture measured by value of production. Milk cows in California are kept in herds of several hundred to a few thousand cows, in confined spaces that allow convenient animal feeding and milking. The cows are generally not kept on pasture, but instead are fed carefully calibrated rations to optimize nutrition for high milk productivity. Nonetheless, dairy farming is central to a larger forage industry, especially alfalfa hay and corn silage that uses about 1.5 million acres or more than 20 percent of the irrigated cropland in California. Dairy farming is also the supplier to the milk processing industry. About 80 percent of California milk enters the processing plants to make butter, milk powder, cheese and whey. The other 20 percent of farm milk produces fluid, soft and frozen products such as beverage milk, yogurt, cottage cheese, and ice cream. 4.1 California Dairy Vulnerabilities Cows are milked two or three times per day in milking barns or parlors designed to maximize the use of electric powered equipment to milk the cows and pump the milk into on-farm bulk tanks that hold about one day’s production. Manure is washed out of barns and pens into bulk lagoons where the manure is kept before being used on nearby crops as a source of fertilizers. Although still labor intensive, all steps in animal handling, milk and waste management depend on mechanization and electric power. Several points of disruption are particularly important for the dairy industry. First, lactating cows must be milked at least twice per day or they suffer and end their milking cycle. Given the average dairy herd size of nearly one thousand cows with a staff of perhaps a dozen workers, there is no way to milk the cows without the use of milking equipment, typically powered by electricity. The second major vulnerability is manure handling and waste management, which typically depends on electric pumps. Third, the milk must be cooled and temporarily stored on farm in cool and sanitary conditions and bulk milk tank must be emptied each day to make room for the milk produced on the next day. The typical pattern is for tanker trucks to visit farms regularly to drain the tanks and move the milk to the processing plant. If roads are blocked or a farm is otherwise not accessible, milk must be dumped for lack of on-farm storage. Fourth, once it leaves the farm, raw milk must be processed before it begins to spoil. Plants are designed to operate every day. They have no capacity for storage of raw milk. Thus, if dairy processing plant operations are disrupted that milk must either be diverted to other plants located further away or be dumped. In California the most important dairy production region is the Southern San Joaquin Valley, especially Tulare, Fresno, Merced and Kern Counties. Fortunately that region is not among the most vulnerable to seismic activity. Thus much of the California dairy industry is comparatively safe. Figure 4.1 shows, location of Confined Animal Feeding Operations (mostly dairies) in California. As Figure 4.1 also shows, there are significant faults through the Central Valley, but density of faults and seismic activity is not as common as along the coast. 4.2 Dairy Vulnerability in San Joaquin County
46
To be more specific about seismic vulnerabilities, let us focus on dairy in San Joaquin County, which is geologically vulnerable and is the seventh largest California dairy county in terms of milk output value (CDFA 2012). Nearby Stanislaus County, which is just south of San Joaquin County, and accounts for an even larger proportion of California dairy production, is also home to several large processing facilities. In 2013 there were 113 dairy farms operating in San Joaquin County with approximately 90 thousand dairy cows. The average herd size was approximately 800 cows per farm. San Joaquin County produced about 2.3 billion pounds of milk worth more than $400 million in farm value. The average dairy farm produced about $3.5 million in milk value each year. There are 11 major dairy processing facilities in San Joaquin and Stanislaus Counties combined (Figure 4.2). A simple analysis provides some illustration of potential losses to the dairy industry and San Joaquin County following a seismic event. Disruptions may occur from power disruptions on dairies, which would prevent cows from being milked, or milk being accepted at processing plants. Disruption may also occur in the transportation networks, which may prevent milk from being shipped. There is further potential for disruption because of San Joaquin County’s low elevation and vulnerability to levy failure and flooding as a result of a seismic event. The markets for California farm milk are regional and the markets for processed dairy products are national and international. Therefore, milk prices would not likely rise with localized disruptions in milk production or marketing. Further, since milk production and marketing occurs every day; seasonality is limited compared to crop farming. San Joaquin County dairy farms produce about $8 million in raw milk each week. An average San Joaquin County dairy farm produces about $70,000 in milk every week. Disruptions affecting individual farms or localized groups of farms would have severe economic effects on those operations, but have smaller county-wide impacts. However, disruptions at the processing plants, especially in Stanislaus County, would have much more severe impacts with losses quickly reaching the millions of dollars per week and employment reduction in the hundreds of jobs. References California Department of Food and Agriculture. 2012. California Dairy Statistics: 2011 Data.
http://www.cdfa.ca.gov/dairy/dairystats_annual.html San Joaquin County. Agricultural Commissioner. 2013. 2012 Annual Crop Report.
http://www.sjgov.org/agcomm/annualrpts.aspx
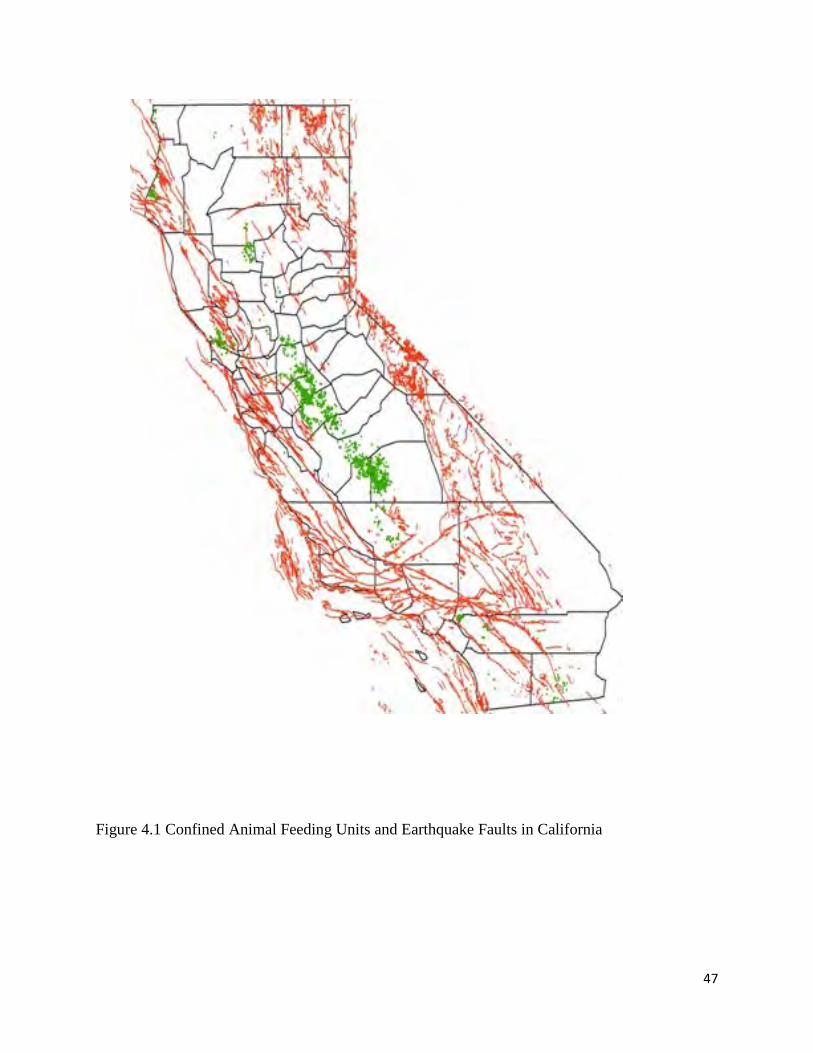
47
Figure 4.1 Confined Animal Feeding Units and Earthquake Faults in California
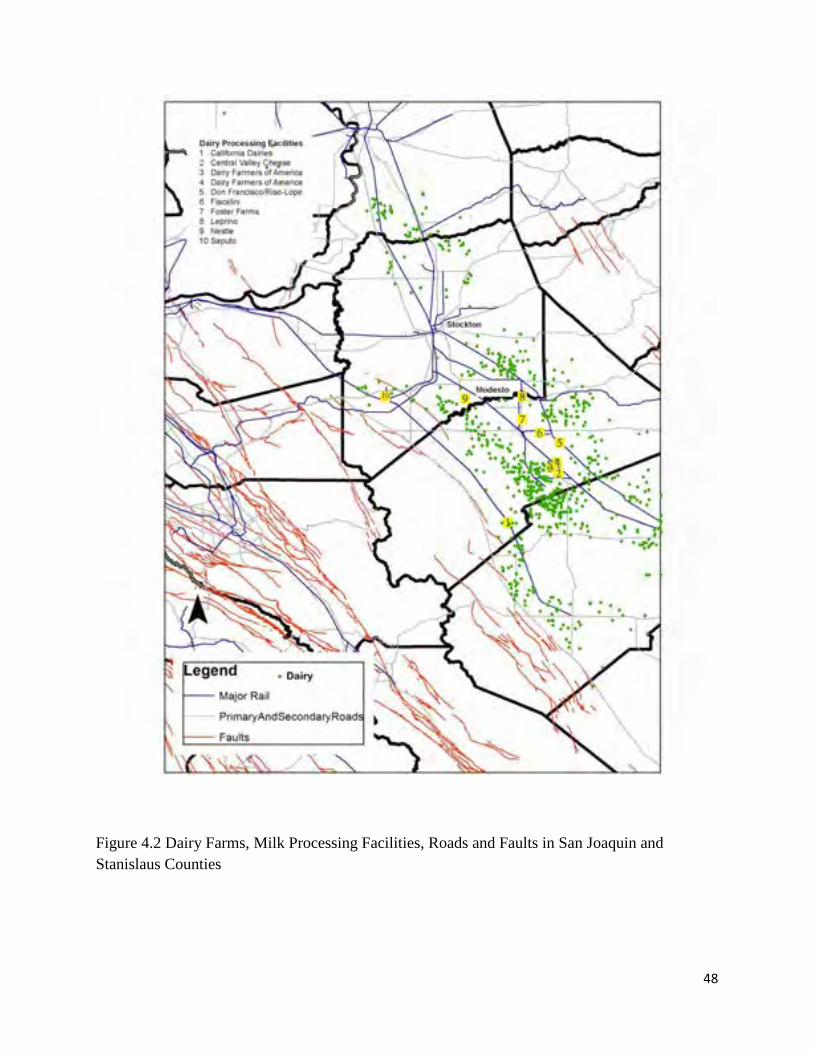
48
Figure 4.2 Dairy Farms, Milk Processing Facilities, Roads and Faults in San Joaquin and Stanislaus Counties
49
5. Concluding Remarks Seismic safety is often considered a priority for urban areas where population density and large scale infrastructure vulnerabilities create potential for large losses. This study has documented that significant losses are also a concern for primarily rural food and agricultural industries. We show that large parts of California agriculture, along the Mexican border, along the central and southern coast, and near the Sacramento-San Joaquin Delta, are especially vulnerable to seismic activity. Imperial County experienced damaging earthquakes in 2010 and 2012 and we draw on those experiences to study implications for the cattle feeding industry. The California produce industry is perhaps more vulnerable than any other to seismic disruptions both because of where it is located and because of the high levels of perishability of its crops. Furthermore, the Monterey County produce industry ships a high proportion of the nation’s vegetables and berries during its peak season, so disruptions would affect consumers as well as producers. Finally, we show that the most important dairy production and processing regions, the Southern San Joaquin Valley, is less prone to seismic events than the coastal counties and Imperial County. Nonetheless, given extreme perishability and animal welfare concerns, dairies do need to have a high level of awareness of seismic risks. Disruptions at individual dairy farms and especially dairy processing facilities could have widespread implications. This study has raised many issues and stressed the linkage from farms to distribution and processing. It has highlighted where vulnerabilities may lie in California agriculture and laid the foundations for further analysis of engineering and economic issues and especially the interaction among the two.