Embed Size (px)
Citation preview
Earthquakes
Introduction
When the Earth quakes, the energy stored in elastically strained rocks is suddenly released.
The more energy released, the stronger the quake.
Massive bodies of rock slip along fault surfaces deep underground.
Earthquakes are key indicators of plate motion.
How Earthquakes Are Studied (1)
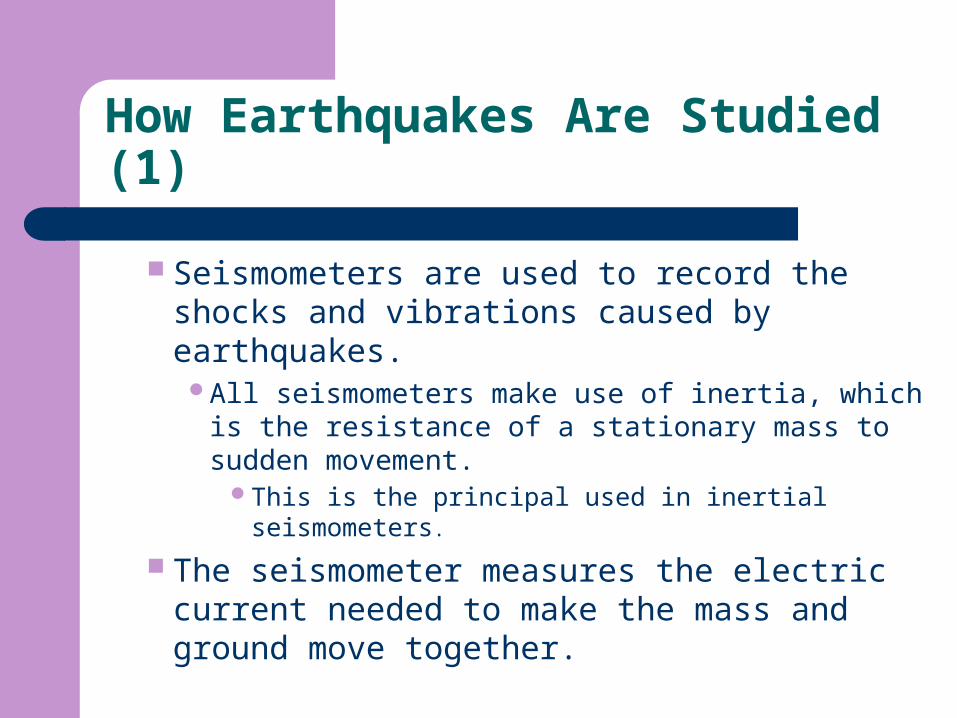
Seismometers are used to record the shocks and vibrations caused by earthquakes.
All seismometers make use of inertia, which is the resistance of a stationary mass to sudden movement.
This is the principal used in inertial seismometers.
The seismometer measures the electric current needed to make the mass and ground move together.
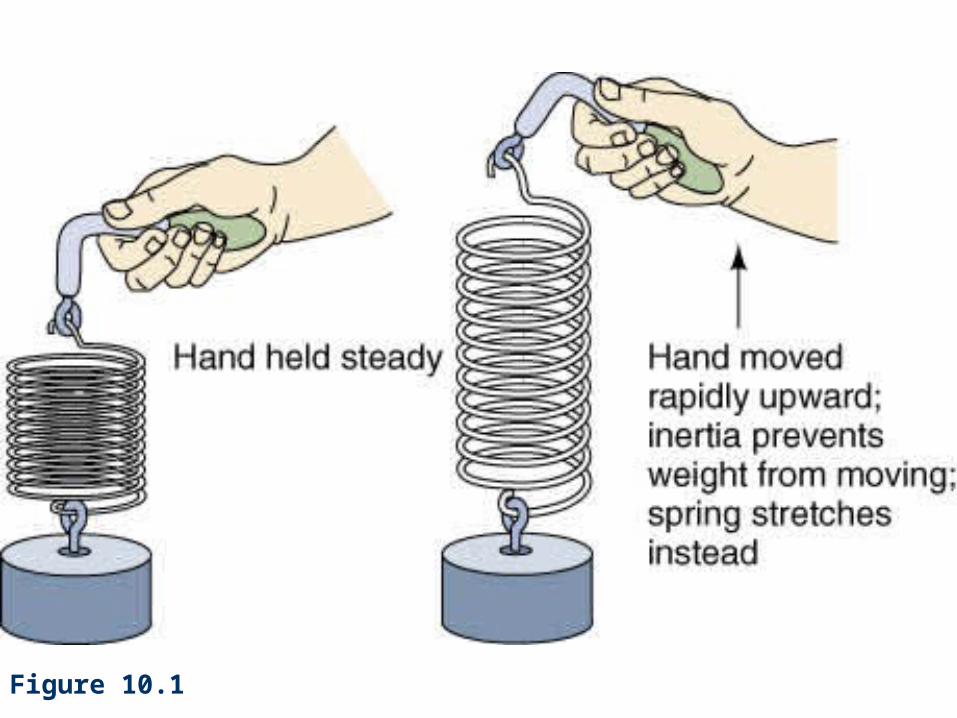
Figure 10.1
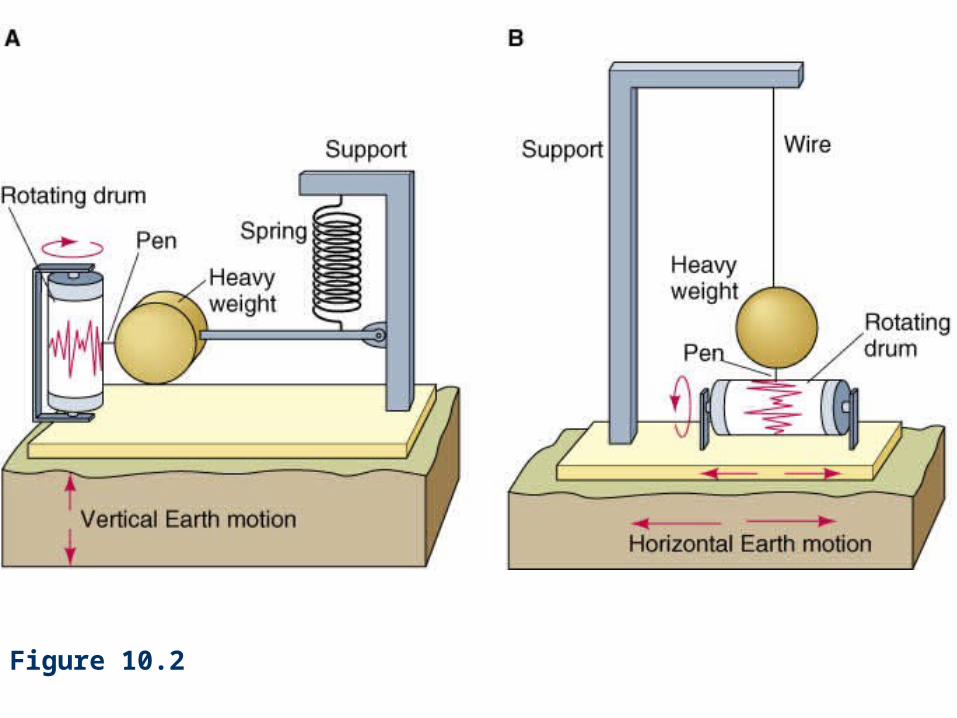
Figure 10.2
Figure B10.01
How Earthquakes Are Studied (2)
Three inertial seismometers are commonly used in one instrument housing to measure up-down, east-west, north-south motions simultaneously.
Earthquake Focus And Epicenter
The earthquake focus is the point where earthquake starts to release the elastic strain of surrounding rock.
The epicenter is the point on Earth’s surface that lies vertically above the focus of an earthquake.
Fault slippage begins at the focus and spreads across a fault surface in a rupture front.
The rupture front travels at roughly 3 kilometers per second for earthquakes in the crust.
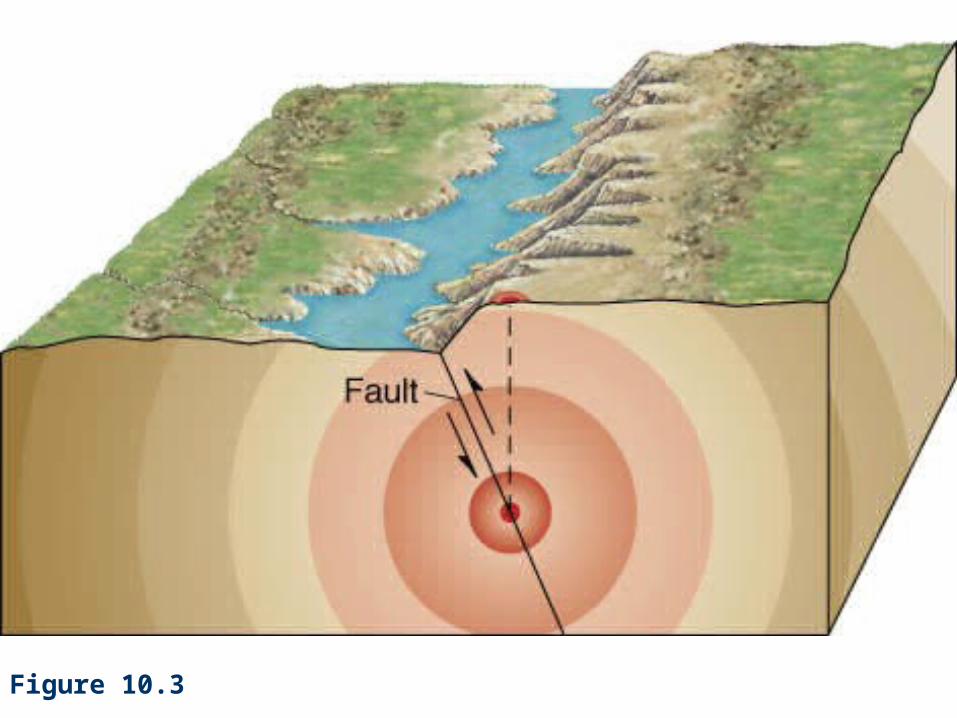
Figure 10.3
Seismic Waves (1)
Vibrational waves spread outward initially from the focus of an earthquake, and continue to radiate from elsewhere on the fault as rupture proceeds.
Seismic Waves (2)
There are two basic families of seismic waves.Body waves can transmit either:
Compressional motion (P waves), orShear motion (S waves).
Surface waves are vibrations that are trapped near Earth’s surface. There are two types of surface waves:
Love waves, orRayleigh waves.
Body Waves (1)
Body waves travel outward in all directions from their point of origin.
The first kind of body waves, a compressional wave, deforms rocks largely by change of volume and consists of alternating pulses of contraction and expansion acting in the direction of wave travel.
Compressional waves are the first waves to be recorded by a seismometer, so they are called P (for “primary”) waves.
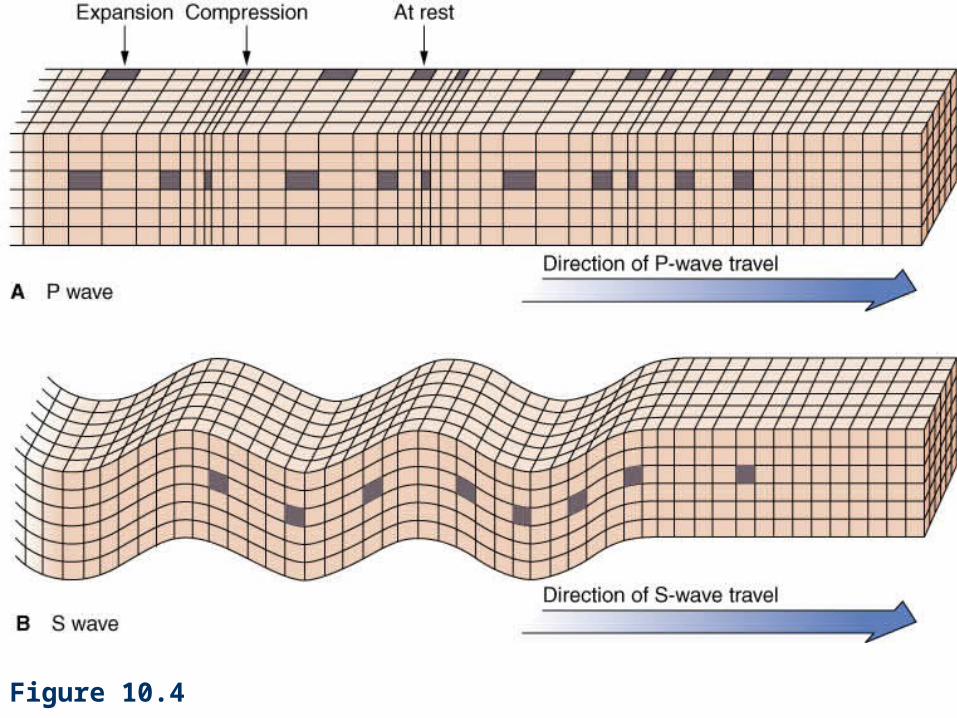
Figure 10.4

Body Waves (2)
The second kind of body waves is a shear wave.Shear waves deform materials by change of shape,Because shear waves are slower than P waves and
reach a seismometer some time after P waves arrives, they are called S (for “secondary”) waves.
Body Waves (3)
Compressional (P) waves can pass through solids, liquid, or gases.
P waves move more rapidly than other seismic waves: 6 km/s is typical for the crust. 8 km/s is typical for the uppermost mantle.
Body Waves (4)
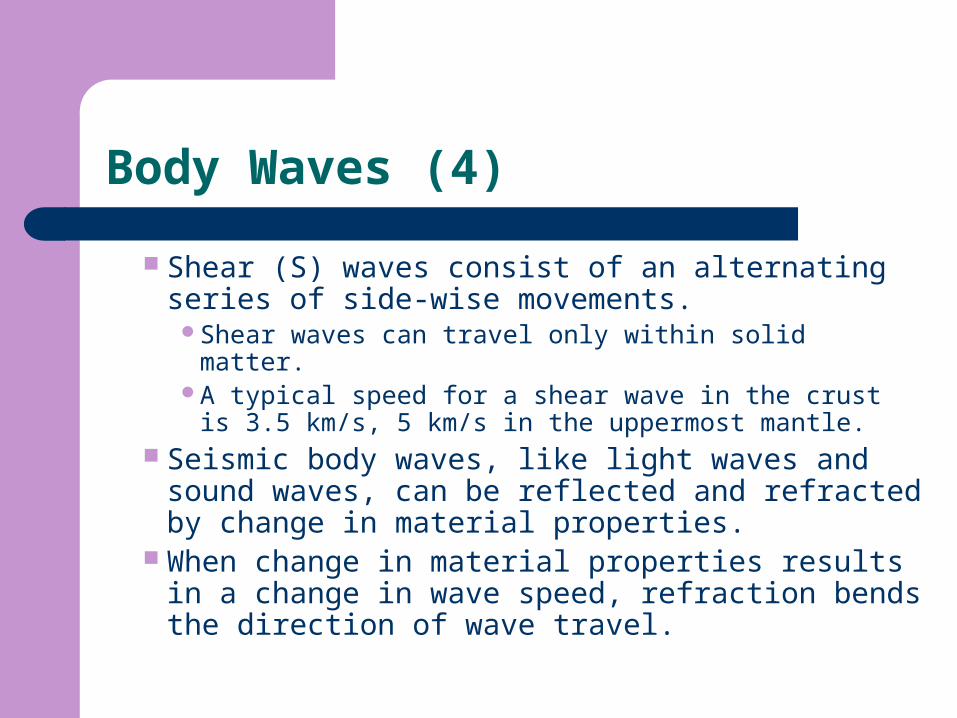
Shear (S) waves consist of an alternating series of side-wise movements.
Shear waves can travel only within solid matter.A typical speed for a shear wave in the crust is 3.5
km/s, 5 km/s in the uppermost mantle. Seismic body waves, like light waves and sound
waves, can be reflected and refracted by change in material properties.
When change in material properties results in a change in wave speed, refraction bends the direction of wave travel.
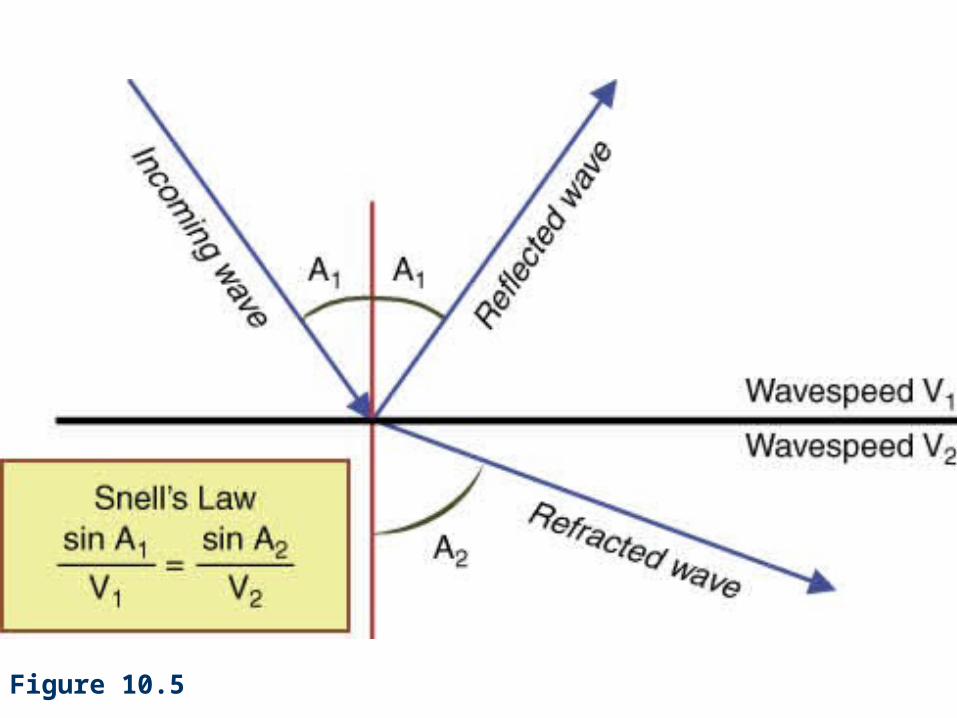
Figure 10.5
Body Waves (5)
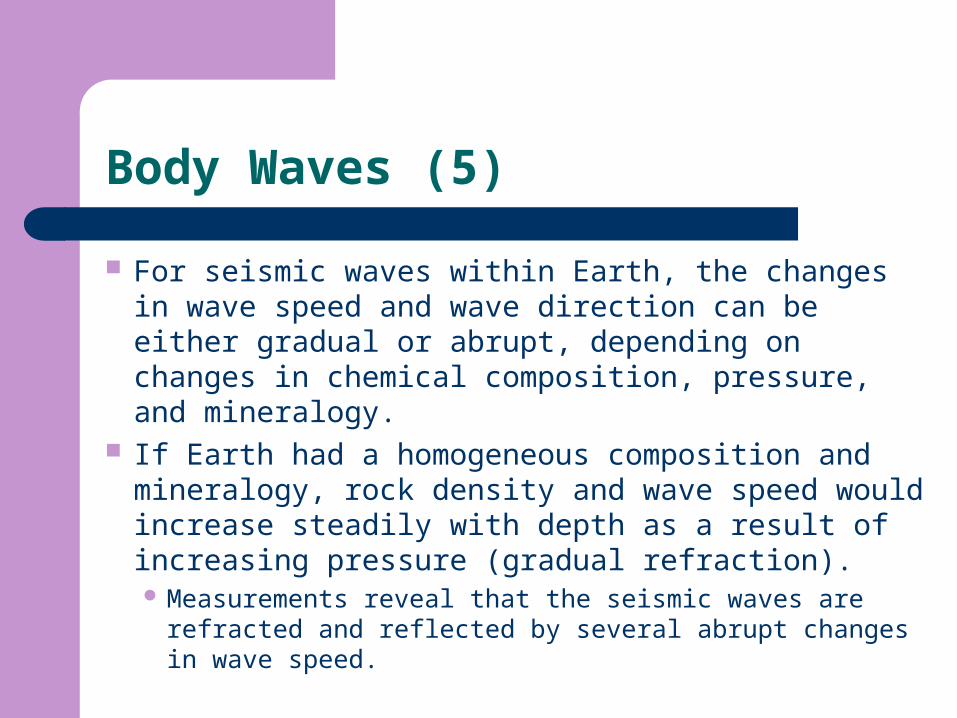
For seismic waves within Earth, the changes in wave speed and wave direction can be either gradual or abrupt, depending on changes in chemical composition, pressure, and mineralogy.
If Earth had a homogeneous composition and mineralogy, rock density and wave speed would increase steadily with depth as a result of increasing pressure (gradual refraction). Measurements reveal that the seismic waves are refracted
and reflected by several abrupt changes in wave speed.
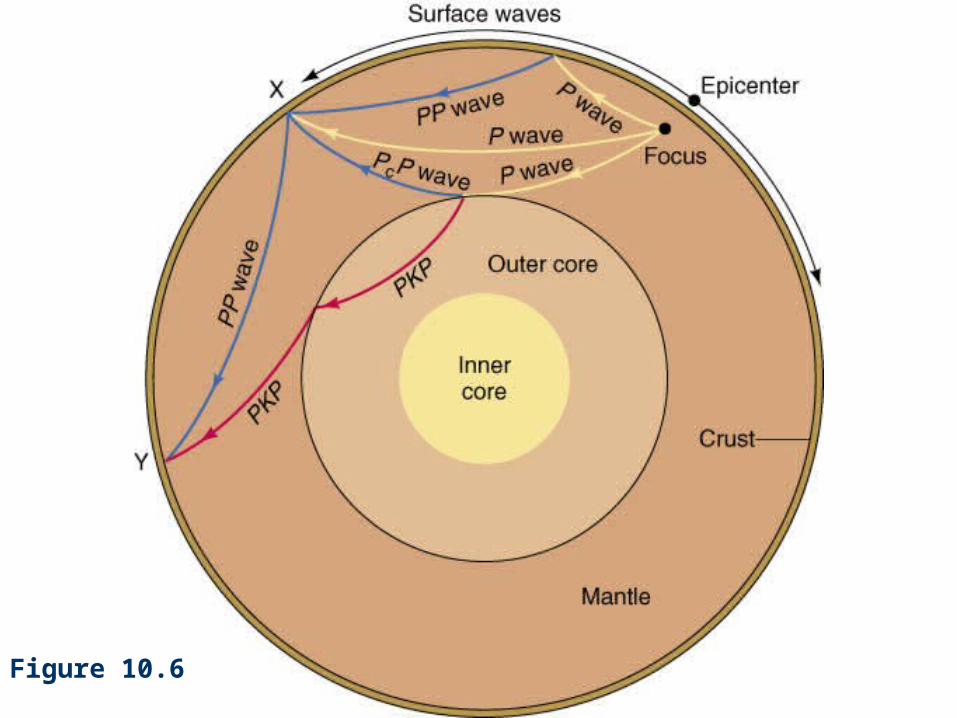
Figure 10.6
Surface Waves (1)
Surface waves travel more slowly than P waves and S waves, but are often the largest vibrational signals in a seismogram.
Love waves consist entirely of shear wave vibrations in the horizontal plane, analogous to an S wave that travels horizontally.
Rayleigh waves combine shear and compressional vibration types, and involve motion in both the vertical and horizontal directions.
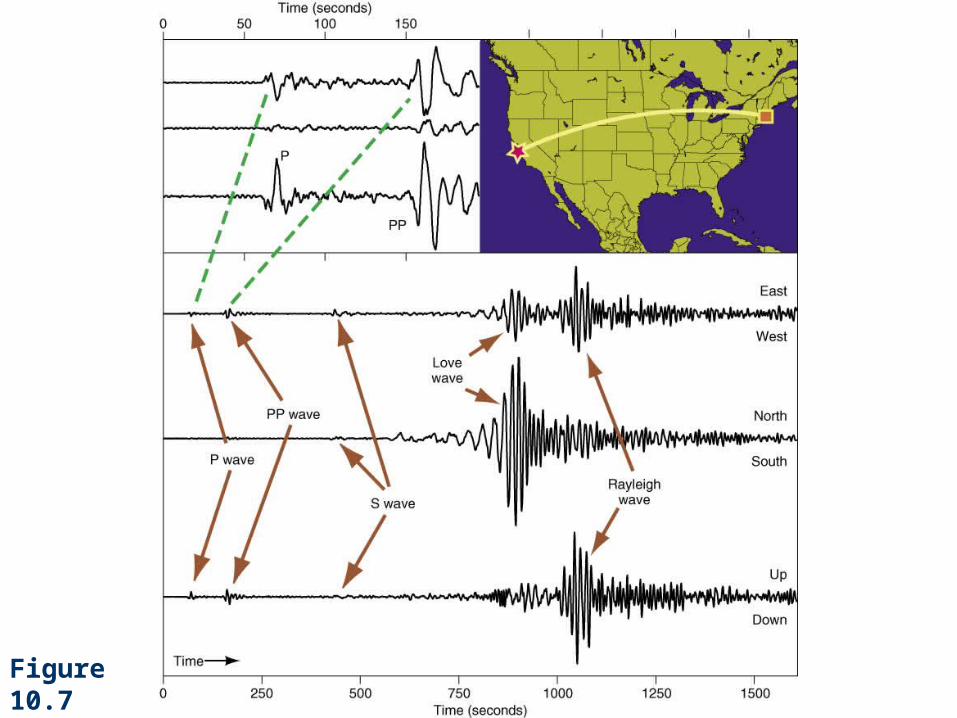
Figure 10.7
Surface Waves (2)
The longer the wave length of a surface wave, the deeper the wave motion penetrates Earth. Surface waves of different wave lengths develop different velocities. This Behavior is called Dispersion
Determining The Epicenter (1)
An earthquake’s epicenter can be calculated from the arrival times of the P and S waves at a seismometer. The farther a seismometer is away from an epicenter, the
greatest the time difference between the arrival of the P and S waves.
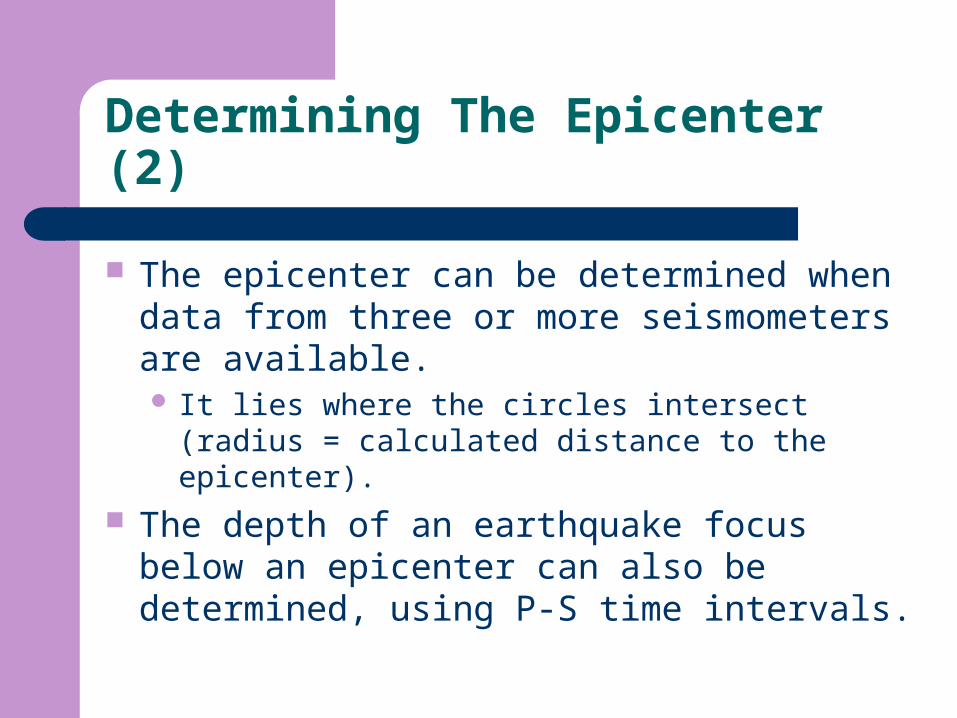
Determining The Epicenter (2)
The epicenter can be determined when data from three or more seismometers are available. It lies where the circles intersect (radius = calculated
distance to the epicenter).
The depth of an earthquake focus below an epicenter can also be determined, using P-S time intervals.
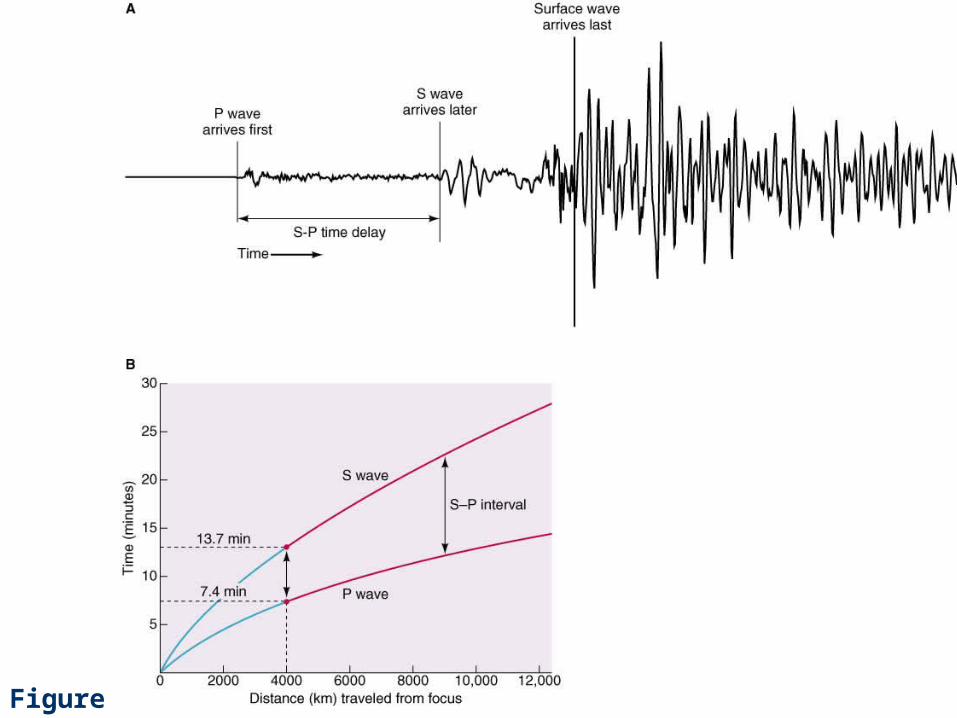
Figure 10.8
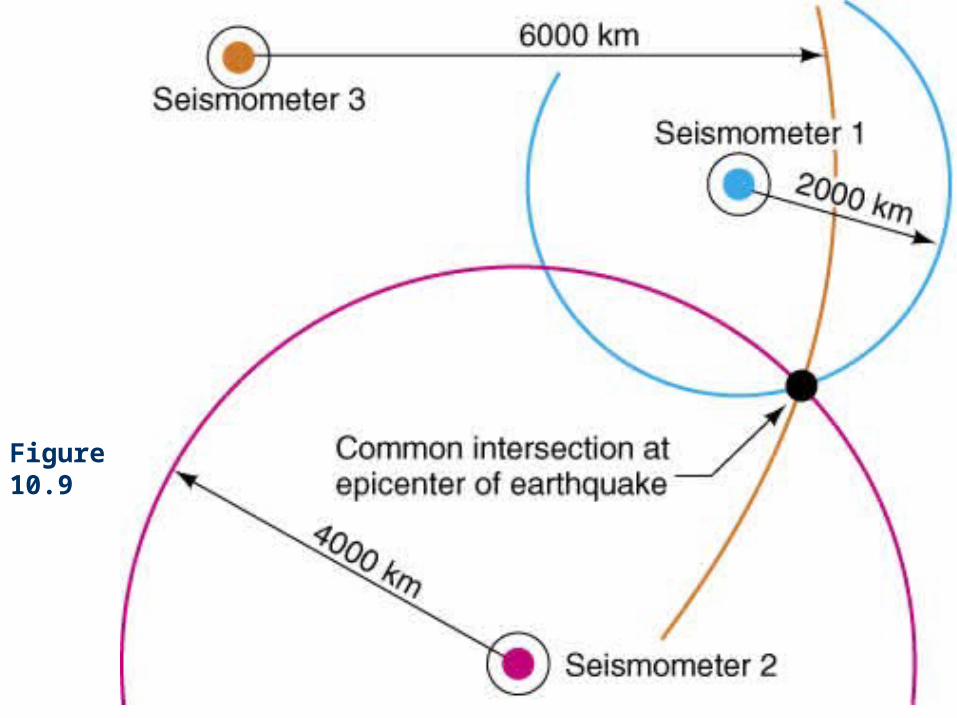
Figure 10.9
Earthquake Magnitude
The Richter magnitude scale is divided into steps called magnitudes with numerical values M.
Each step in the Richter scale, for instance, from magnitude M = 2 to magnitude M = 3, represents approximately a thirty fold increase in earthquake energy.
Earthquake Frequency (1)
Each year there are roughly 200 earthquakes worldwide with magnitude M = 6.0 or higher.
Each year on average, there are 20 earthquakes with M = 7.0 or larger.
Each year on average, there is one “great” earthquake with M = 8.0 or larger.
Earthquake Frequency (2)
Four earthquakes in the twentieth century met or exceeded magnitude 9.0. 1952 in Kamchatka (M = 9.0). 1957 in the Aleutian Island (M = 9.1). 1964 in Alaska (M = 9.2). 1960 in Chile (M = 9.5).
Earthquake Frequency (3)
The nuclear bomb dropped in 1945 on the Japanese city of Hiroshima was equal to an earthquake of magnitude M = 5.3. The most destructive man-made devices are small in
comparison with the largest earthquakes.
Earthquake Hazard
Seismic events are most common along plate boundaries.
Earthquakes associated with hot spot volcanism pose a hazard to Hawaii.
Earthquakes are common in much of the intermontane western United States (Nevada, Utah, and Idaho).
Several large earthquakes jolted central and eastern North America in the nineteenth century (New Madrid, Missouri, 1811 and 1812).
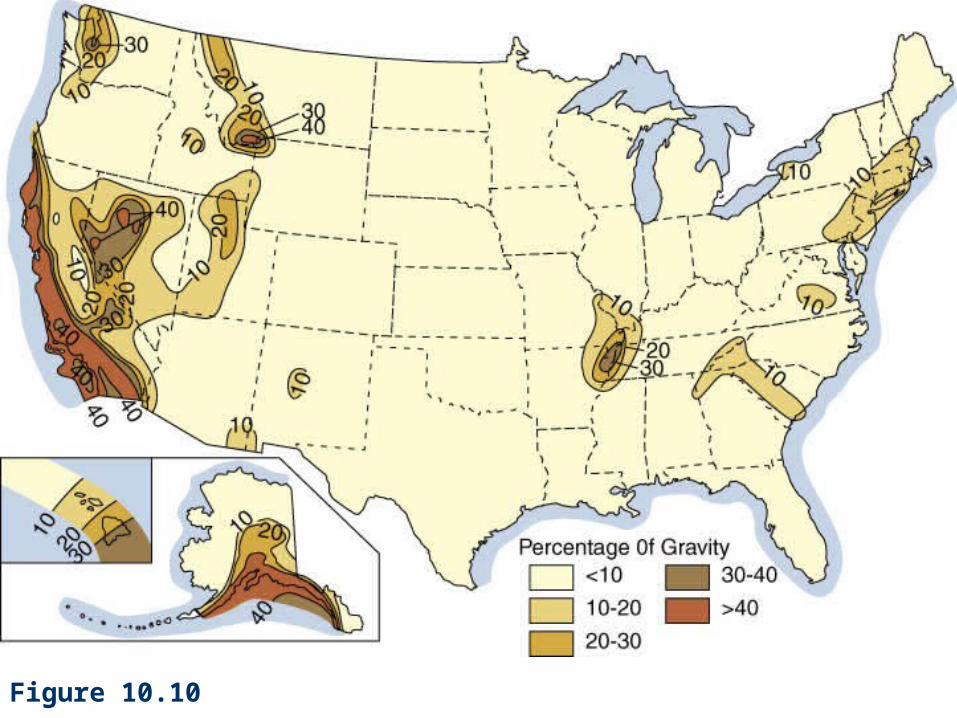
Figure 10.10
Earthquake Disasters (1)
In Western nations, urban areas that are known to be earthquake-prone have special building codes that require structures to resist earthquake damage. However, building codes are absent or ignored in many
developing nations.
In the 1976 T’ang Shan earthquake in China, 240,000 people lost their lives.
Earthquake Disasters (2)
Eighteen earthquakes are known to have caused 50,000 or more deaths apiece.
The most disastrous earthquake on record occurred in 1556, in Shaanxi province, China, where in estimated 830,000 people died.
Earthquake Damage (1)
Earthquakes have six kinds of destructive effects. Primary effects:
Ground motion results from the movement of seismic waves.
Where a fault breaks the ground surface itself, buildings can be split or roads disrupted.

Earthquake Damage (2)
Secondary effects: Ground movement displaces stoves, breaks gas lines, and
loosens electrical wires, thereby starting fires. In regions of steep slopes, earthquake vibrations may
cause regolith to slip and cliffs to collapse. The sudden shaking and disturbance of water-saturated
sediment and regolith can turn seemingly solid ground to a liquid mass similar to quicksand (liquefaction).
Earthquakes generate seismic sea waves, called tsunami, which have been particularly destructive in the Pacific Ocean.
Modified Mercalli Scale
This scale is based on the amount of vibration people feel during low-magnitude quakes, and the extent of building damage during high-magnitude quakes.
There are 12 degrees of intensity in the modified Mercalli scale.
World Distribution of Earthquakes
Subduction zones have the largest quakes. The circum-Pacific belt, where about 80 percent of
all recorded earthquakes originate, follows the subduction zones of the Pacific Ocean.
The Mediterranean-Himalayan belt is responsible for 15 percent of all earthquakes.
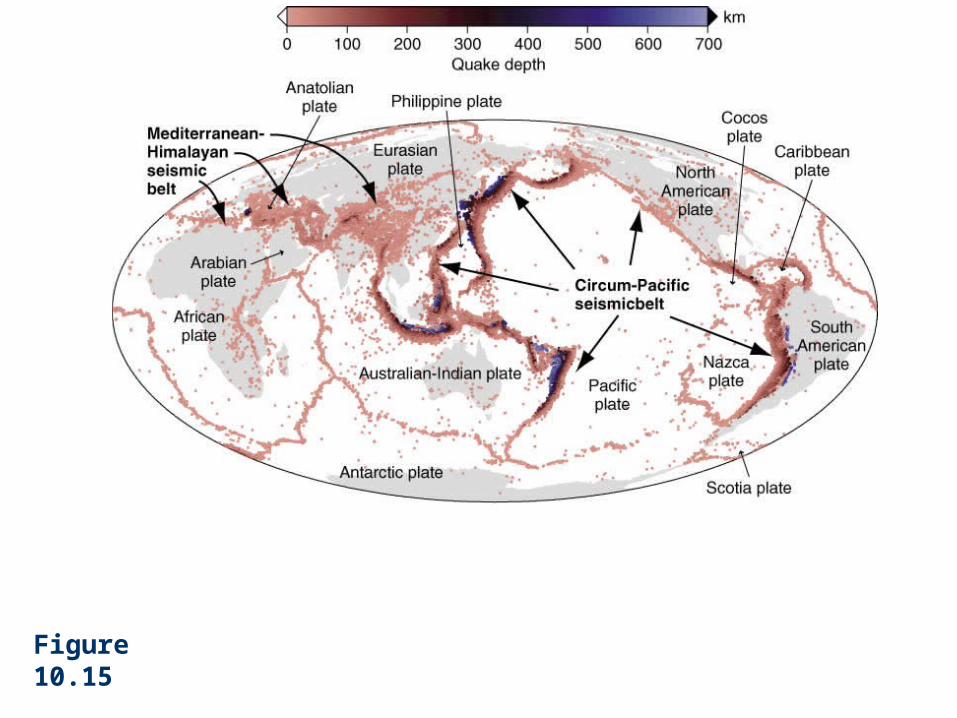
Figure 10.15
Depth of Earthquake Foci
Most foci are no deeper than 100 km. down in the Benioff zone, that extends from the surface to as deep as 700 km.
No earthquakes have been detected at depths below 700 km. Two hypotheses may explain this. Sinking lithosphere warms sufficiently to become
entirely ductile at 700 km depth. The slab undergoes a mineral phase change near 670 km
depth and loses its tendency to fracture.
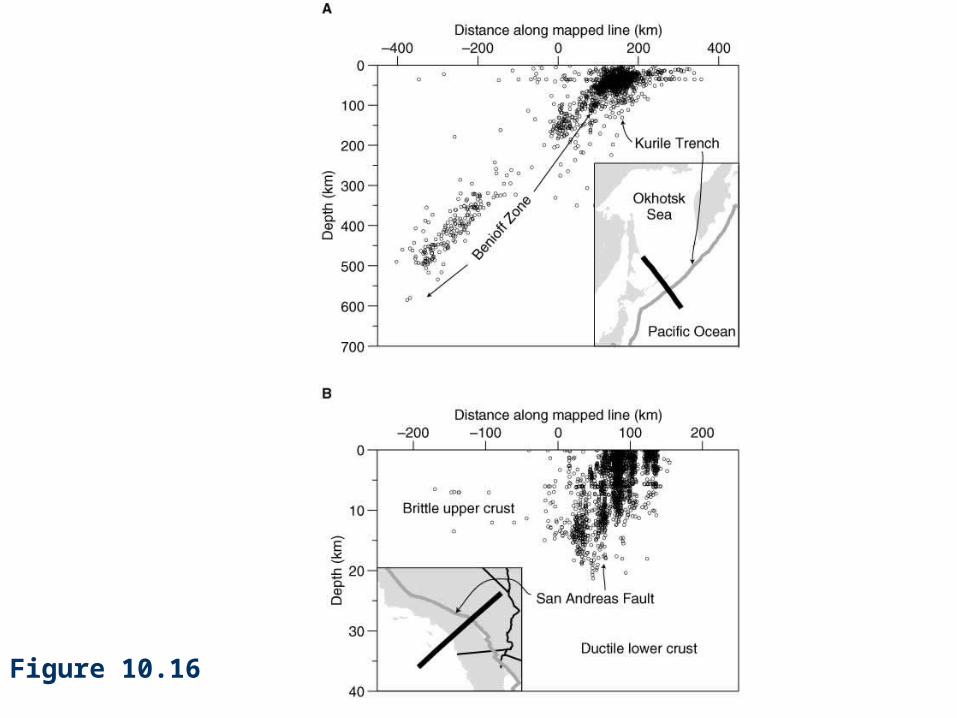
Figure 10.16

First-Motion Studies Of The Earthquake Source
If the first motion of the arriving P wave pushes the seismometer upward, then fault motion at the earthquake focus is toward the seismometer.
If the first motion of the P wave is downward, the fault motion must be away from the seismometer.
S-waves and surface waves also carry the signature of earthquake slip and fault orientation and can provide independent estimates of motion at the earthquake focus.
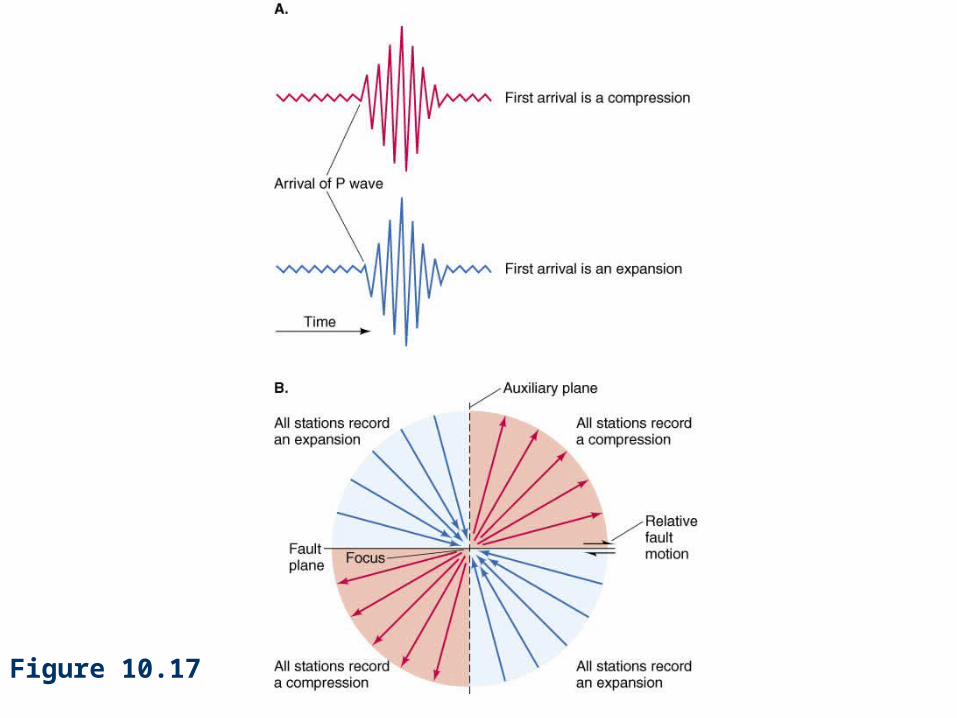
Figure 10.17
Figure 10.18
Earthquake Forecasting And Prediction (1)
Forecasting identifies both earthquake-prone areas and man-made structures that are especially vulnerable to damage from shaking.
Earthquake prediction refers to attempts to estimate precisely when the next earthquake on a particular fault is likely to occur.
Earthquake Forecasting And Prediction (2)
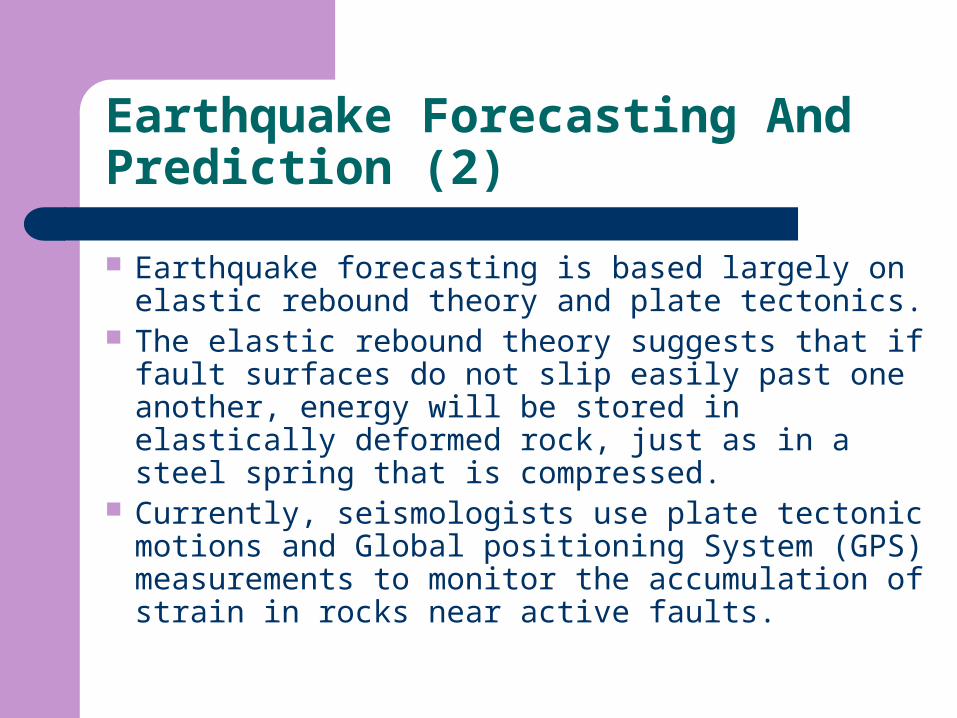
Earthquake forecasting is based largely on elastic rebound theory and plate tectonics.
The elastic rebound theory suggests that if fault surfaces do not slip easily past one another, energy will be stored in elastically deformed rock, just as in a steel spring that is compressed.
Currently, seismologists use plate tectonic motions and Global positioning System (GPS) measurements to monitor the accumulation of strain in rocks near active faults.
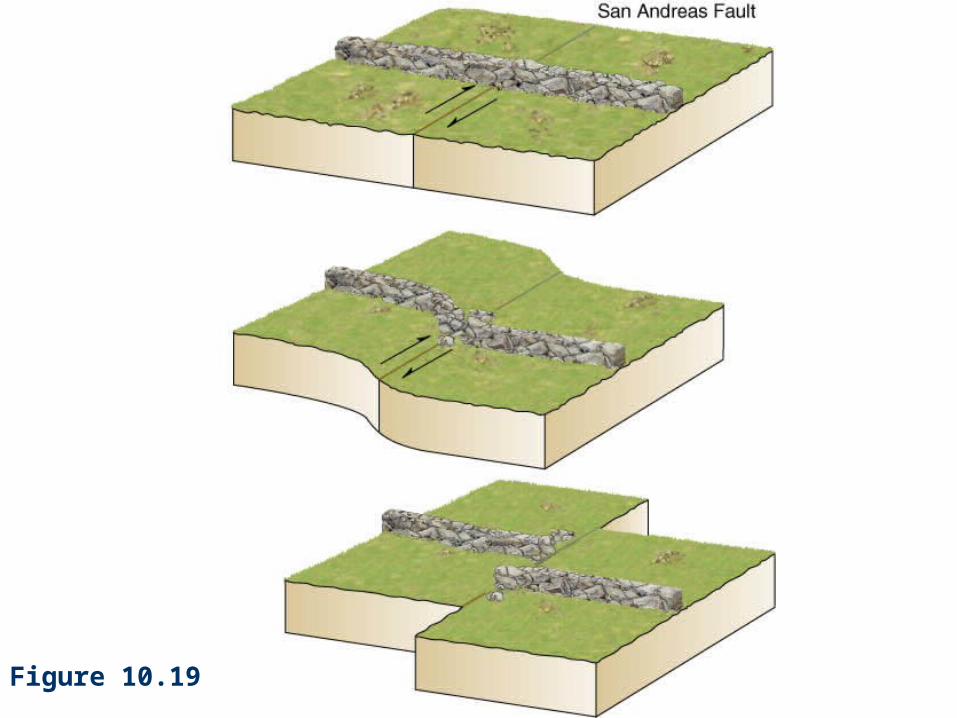
Figure 10.19
Earthquake Forecasting And Prediction (3)
Earthquake prediction has had few successes. Earthquake precursors:
Suspicious animal behavior. Unusual electrical signals. Many large earthquakes are preceded by small
earthquakes called foreshocks (Chinese authorities used an ominous series of foreshocks to anticipate (the Haicheng earthquake in 1975).
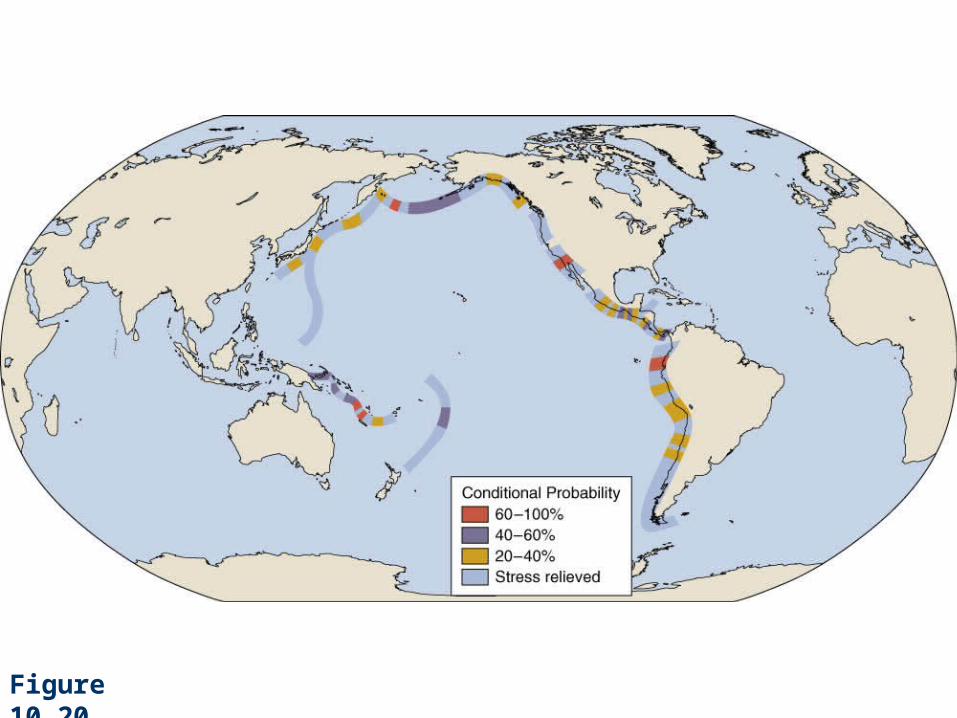
Figure 10.20
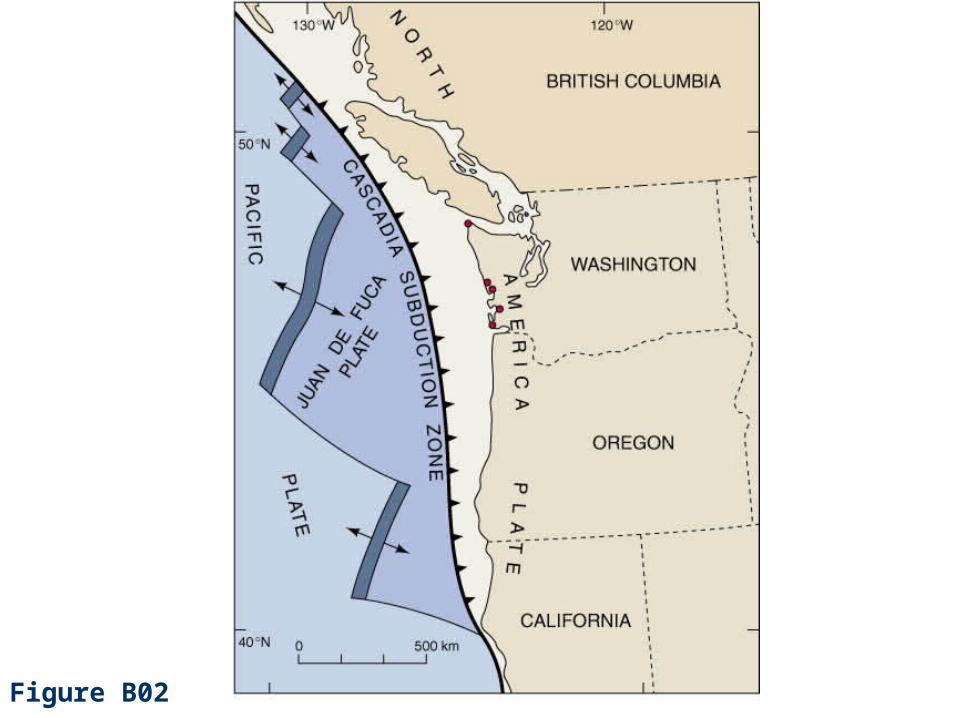
Figure B02
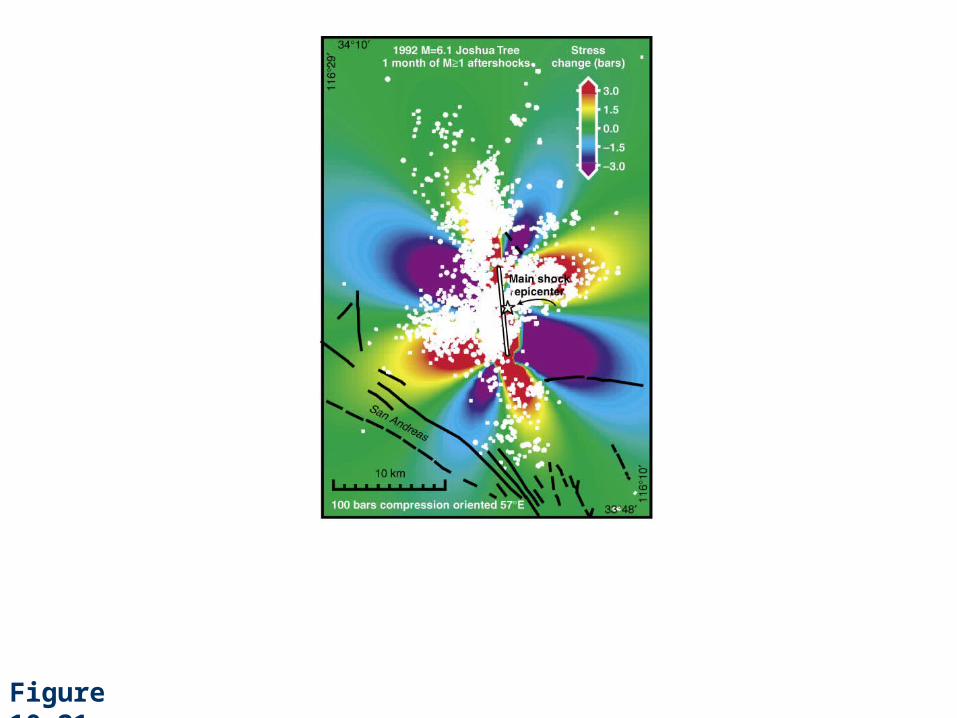
Figure 10.21
Using Seismic Waves As Earth Probes (1)
Seismic waves are the most sensitive probes we have to measure the properties of the unseen parts of the crust, mantle, and core.
Distinct boundaries (or discontinuities) can be readily detected by refraction and reflection of body waves deep within Earth.
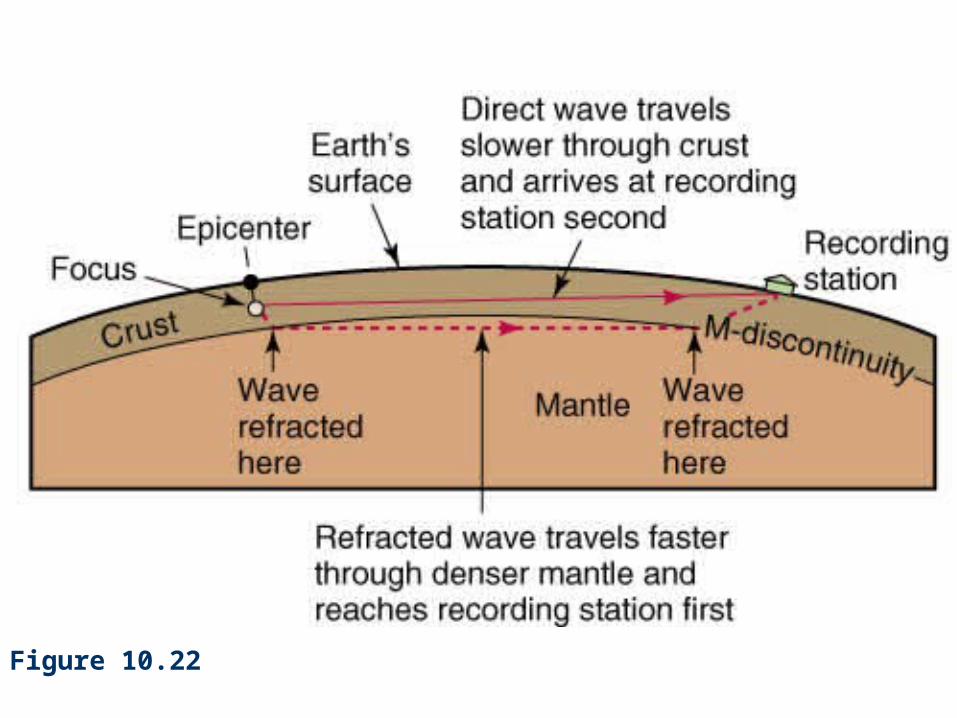
Figure 10.22
Using Seismic Waves As Earth Probes (2)
Early in the twentieth century, the boundary between Earth’s crust and mantle was demonstrated by a Croatian scientist named Mohorovicic.
A distinct compositional boundary separated the crust from this underlying zone of different composition (the Mohorovicic discontinuity).
Seismic wave speeds can be measured for different rock types in both the laboratory and the field.
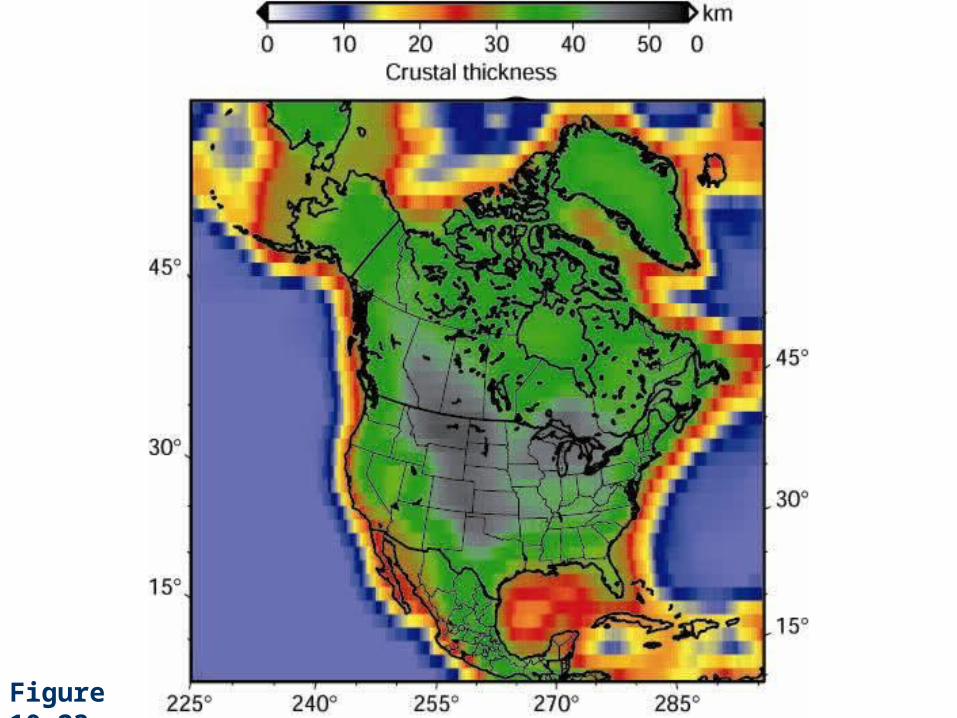
Figure 10.23
Using Seismic Waves As Earth Probes (3)
The thickness and composition of continental crust vary greatly from place to place. Thickness ranges from 20 to nearly 70 km and tends to
be thickest beneath major continental collision zones, such as Tibet.
P-wave speeds in the crust range between 6 and 7 km/s. Beneath the Moho, speeds are greater than 8 km/s.
Using Seismic Waves As Earth Probes (4)
Laboratory tests show that rocks common in the crust, such as granite, gabbro, and basalt, all have P-wave speeds of 6 to 7 km/s.
Rocks that are rich in dense minerals, such as olivine, pyroxene, and garnet, have speeds greater than 8 km/s. Therefore, the most common such rock, called peridotite,
must be among the principal materials of the mantle.
Using Seismic Waves As Earth Probes (5)
Some evidence can be obtained from rare samples of mantle rocks found in kimberlite pipes—narrow pipe-like masses of intrusive igneous rock, sometimes containing diamonds, that intrude the crust but originate deep in the mantle.
Using Seismic Waves As Earth Probes (6)
Both P and S waves are strongly influenced by a pronounced boundary at a depth of 2900 km. Geologists infer that it is the boundary between the
mantle and the core.
Seismic-wave speeds calculated from travel times indicate that rock density increases from about 3.3 g/cm3 at the top of the mantle to about 5.5 g/cm3 at the base of the mantle.
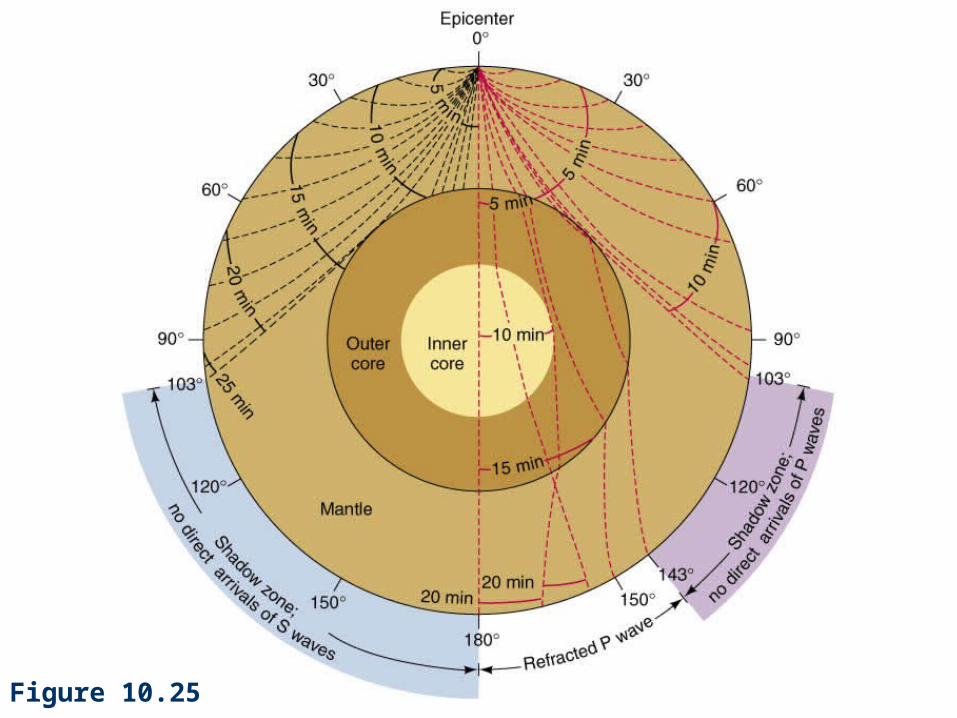
Figure 10.25
Using Seismic Waves As Earth Probes (7)
To balance the less dense crust and the mantle, the core must be composed of material with a density of at least 10 to 13 g/cm3.
The only common substance that comes close to fitting this requirement is iron.
Using Seismic Waves As Earth Probes (8)
Iron meteorites are samples of material believed to have come from the core of ancient, tiny planets, now disintegrated.
All iron meteorites contain a little nickel; thus, Earth’s core presumably does too.
P-wave reflections indicate the presence of a solid inner core enclosed within the molten outer core.
Layers of Different Physical Properties in the Mantle
The P-wave velocity at the top of the mantle is about 8 km/s and it increases to 14 km/s at the core-mantle boundary.
The low-velocity zone can be seen as a small blip in both the P-wave and S-wave velocity curves. An integral part of the theory of plate tectonics is the idea
that stiff plates of lithosphere slide over a weaker zone in the mantle called the asthenosphere.
In the low velocity zone rocks are closer to their melting point than the rock above or below it.
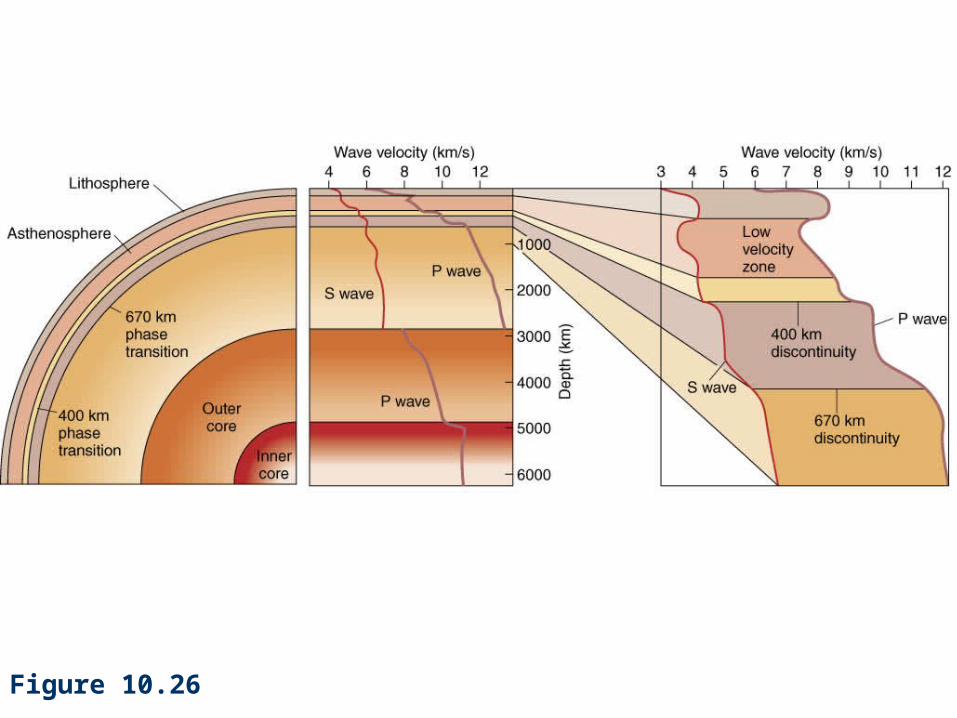
Figure 10.26
The 400-km Seismic Discontinuity
From the P-and S-wave curves, velocities of both P and S waves increase in a small jump at about 400 km.
When olivine is squeezed at a pressure equal to that at a depth of 400 km, the atoms rearrange themselves into a denser polymorph (polymorphic transition).
The 670-km Seismic Discontinuity
An increase in seismic-wave velocities occurs at a depth of 670 km.
The 670-km discontinuity may correspond to a polymorphic change affecting all silicate minerals present.

Seismic Waves and Heat (1)
Seismic wave speed is affected by temperature. Seismologists translate travel-time discrepancies
into maps of ‘fast” and “slow” regions of Earth’s interior using seismic tomography.
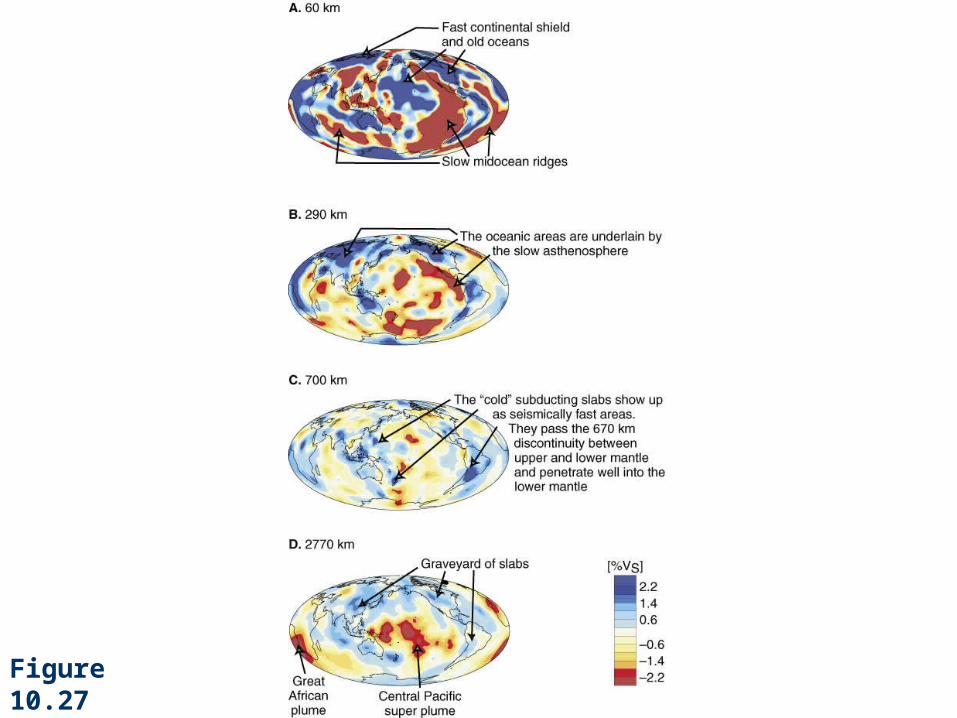
Figure 10.27
Seismic Waves and Heat (2)
Researchers hypothesize that these “slow’’ regions are the hot source rocks of most mantle plumes.
Near active volcanoes, seismologists have interpreted travel-time discrepancies to reconstruct the location of hot and partially molten rock that supplies lava for eruptions.
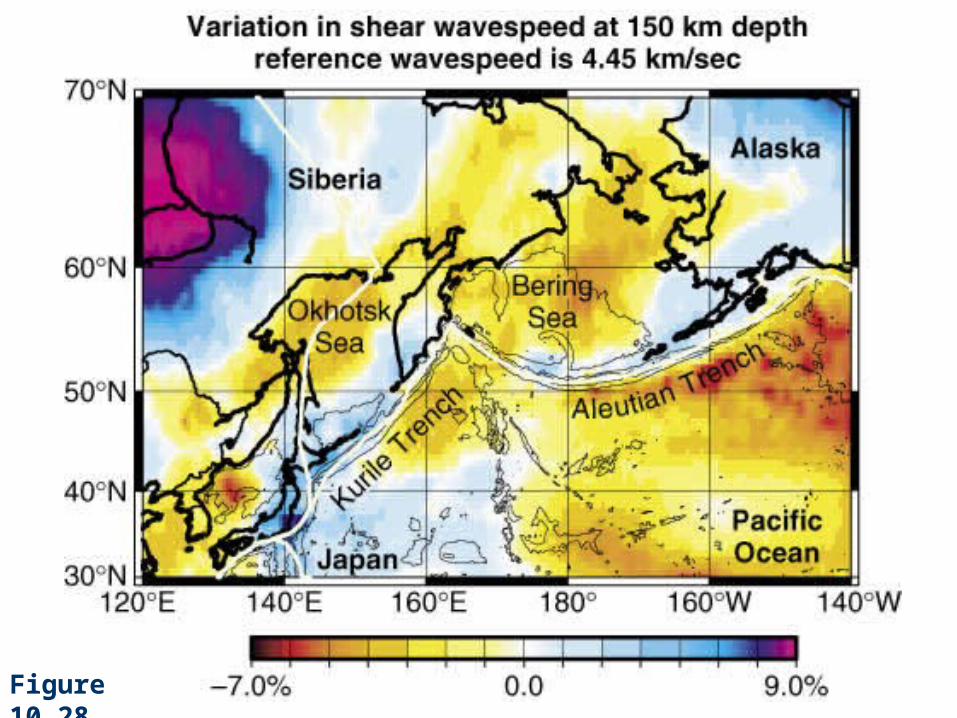
Figure 10.28
Earthquakes Influence Geochemical Cycles (1)
Earthquakes play an important role in the transport of volatiles through Earth’s solid interior.
Earthquakes facilitate the concentration of many important metals into ore deposits.
In the mantle, the carbon and hydrologic cycles are fed when the subducting slab releases water, CO2, and other volatiles at roughly 100-km depth beneath the overriding plate.
Earthquakes Influence Geochemical Cycles (2)
Some seismologists speculate that water released from the slab helps cause brittle fracture in the slab itself, and that water may be necessary for deep earthquakes to occur in the Benioff zone.


![[ccgrid2014] JCatascopia: Monitoring Elastically Adaptive Applications in the Cloud](https://img.pdfslide.net/doc/110x75/54b79e064a795997768b4592/ccgrid2014-jcatascopia-monitoring-elastically-adaptive-applications-in-the-cloud.jpg)