Embed Size (px)
Citation preview

BTO Research Report No. 639
Measuring the Interaction between Marine Features of Special
Protection Areas with Offshore Wind Farm Development Sites
Through Telemetry: Third Year Report
Authors
Chris B. Thaxter1, Viola H. Ross-Smith
1, Alison Johnston
1, Nigel A. Clark
1, Greg J. Conway
1,
Helen M. Wade2, Elizabeth A. Masden
2, Willem Bouten
3 and Niall H.K. Burton
1
1 British Trust for Ornithology, The Nunnery, Thetford, Norfolk IP24 2PU, UK
2 Centre for Energy and the Environment, Environmental Research Institute, North Highland College – University of the
Highlands and Islands (UHI), Ormlie Road, Thurso, Caithness, KW14 7EE 3 Computational Geo-Ecology, Institute for Biodiversity and Ecosystem Dynamics, University of Amsterdam, Sciencepark
904, 1098 XH Amsterdam, The Netherlands
Report of work carried out by the British Trust for Ornithology1
in association with the University of Amsterdam3
and collaboration with the Environmental Research Institute2
on behalf of the Department of Energy and Climate Change
June 2013
This document was produced as part of the UK Department of Energy and Climate Change's
offshore energy Strategic Environmental Assessment programme. Crown Copyright, all
rights reserved
British Trust for Ornithology
The British Trust for Ornithology, The Nunnery, Thetford, Norfolk IP24 2PU
Registered Charity No. 216652

BTO Research Report No. 639
June 2013 1
CONTENTS
Page No.
List of Tables ...................................................................................................................................... 3
List of Figures ...................................................................................................................................... 5
EXECUTIVE SUMMARY ........................................................................................................................... 7
1. INTRODUCTION ......................................................................................................................... 9
1.1 Background ................................................................................................................................ 9
1.2 Project Aims............................................................................................................................... 9
2. METHODS ................................................................................................................................ 11
2.1 Field Sites ................................................................................................................................. 11
2.2 The GPS System ....................................................................................................................... 11
2.3 Assessment of Tag Effects ....................................................................................................... 11
2.4 Data Gathered During 2012 .................................................................................................... 12
2.5 Data Processing and Analysis.................................................................................................. 13
2.5.1 Defining trips and calculating trip statistics .............................................................. 13
2.5.2 Connectivity with the areas of proposed and consented wind farms ..................... 13
2.5.3 Spatial overlap of home ranges with consented and proposed wind farms ........... 13
2.5.3.1 Seasonal variation ....................................................................................................... 13
2.5.4 Time budgets of birds ................................................................................................ 14
2.5.4.1 Seasonal variation ....................................................................................................... 14
2.5.5 Formal statistical tests – spatial overlap and time budgets ..................................... 14
2.5.6 Flight altitudes ............................................................................................................ 15
2.5.6.1 Altitude Analysis.......................................................................................................... 15
2.5.6.2 Precision and accuracy in measurements ................................................................... 15
2.5.6.3 The modelling process................................................................................................. 15
2.5.6.4 Outputs ....................................................................................................................... 17
3. RESULTS ................................................................................................................................... 19
3.1 Descriptive Trip Statistics ........................................................................................................ 19
3.1.1 Annual Variation in trips ............................................................................................ 20
3.2 Connectivity with the Areas of Proposed and Consented Wind Farms ................................ 22
3.2.1 2012 breeding season ................................................................................................ 22
3.2.2 Migration .................................................................................................................... 22
3.2.2.1 Data summary ............................................................................................................ 22
3.2.2.2 Wind farm overlaps..................................................................................................... 24
3.3 Spatial Overlap of Home Ranges with Consented and Proposed Wind Farms ..................... 28
3.3.1 Seasonal variation in home ranges ............................................................................ 30
3.4 Time Budgets ........................................................................................................................... 32
3.4.1 Seasonal variation ...................................................................................................... 33
3.5 Flight Heights ........................................................................................................................... 33

BTO Research Report No. 639
June 2013 2
Page No.
4. DISCUSSION ............................................................................................................................. 35
4.1 Overview .................................................................................................................................. 35
4.1.1 Lesser Black-backed Gulls .......................................................................................... 35
4.1.2 Great Skuas ................................................................................................................. 35
4.2 Seabird-Wind Farm Interactions in 2012 ................................................................................ 35
4.3 Effects of Wind Farms on Lesser Black-backed Gulls ............................................................. 36
4.4 Concluding Comments ............................................................................................................ 36
Acknowledgments ................................................................................................................................ 37
References .................................................................................................................................... 39

BTO Research Report No. 639
June 2013 3
LIST OF TABLES
Page No.
Table 1 Current data holdings for tags on Lesser Black-backed Gulls during the
breeding season……. ........................................................................................................... 14
Table 2 Descriptive trip statistics for Lesser Black-backed Gulls at Orford Ness in 2012 for
all trips. Trip duration and total distance travelled are computed for all trips,
however offshore foraging range is calculated only from those trips with an
offshore component ........................................................................................................... 22
Table 3 Migration information for all birds from both 2010/11 winter and 2011/12
winter period… .................................................................................................................... 25
Table 4 Overlap analysis of “individual bird” kernels (pooled analysis) with wind farms
(WF) for individual Lesser Black-backed Gulls for Orford Ness using a 1800 s rate. .......... 30
Table 5 Information on (a) Time budgets of Lesser Black-backed Gulls during 2012 (hrs),
including time spent offshore and in wind farm (WF) sites; and (b) Number of
trips, and number of trips offshore that overlapped with offshore wind farm sites
during 2012. ........................................................................................................................ 34

BTO Research Report No. 639
June 2013 4

BTO Research Report No. 639
June 2013 5
LIST OF FIGURES
Page No.
Figure 1 Altitudinal readings from one lesser black-backed gull during 2010 when stationary. ..... 17
Figure 2 Schematic diagram of the state-space modelling approach proposed. ............................. 18
Figure 3 Smoothed Terms from a general additive model (GAM) for (a) offshore foraging
Range, and (b) trip duration showing annual variation in seasonal patterns ..................... 23
Figure 4 Plot of all Orford Ness data for birds tagged in 2012. Purple = Round 3;
orange = Rounds 1 and 2; grey = extensions. ..................................................................... 24
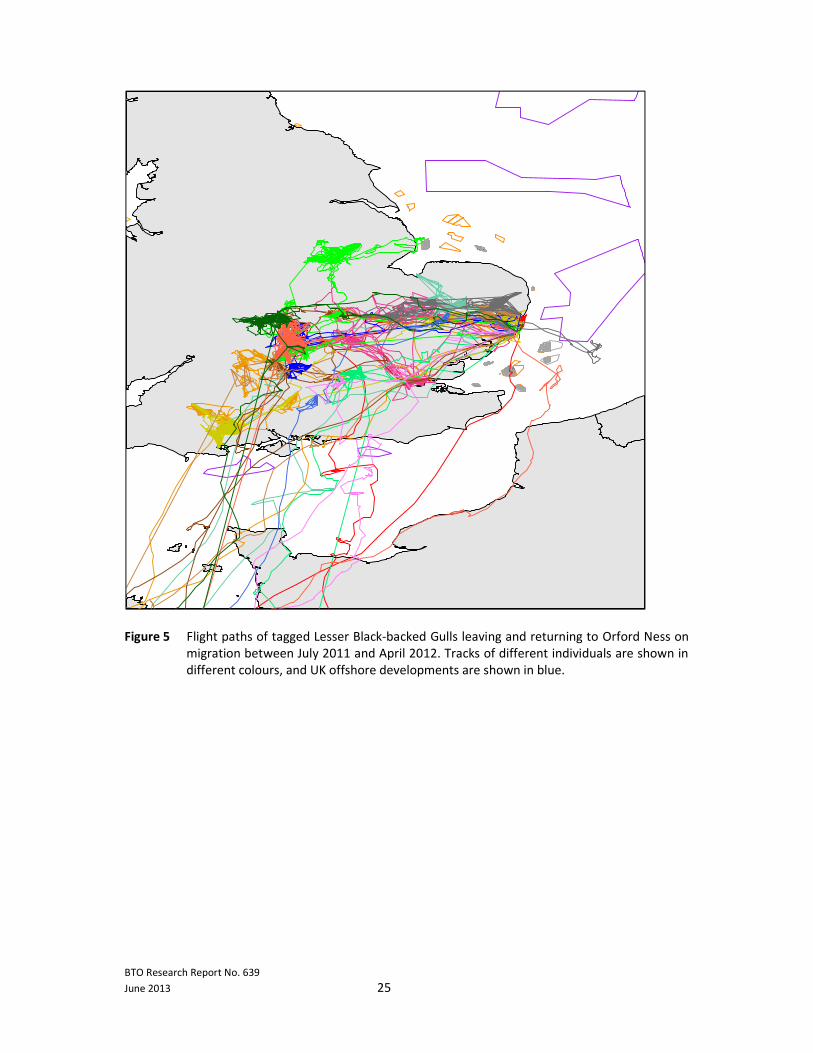
Figure 5 Flight paths of tagged Lesser Black-backed Gulls leaving and returning to Orford
Ness on migration between July 2011 and April 2012. Tracks of different individuals
are shown in different colours, and UK offshore developments are shown in blue. ......... 27
Figure 6 Flight paths of tagged Lesser Black-backed Gulls showing their movements
throughout migration and overwinter. Tracks of different individuals are
shown in different colours, and UK offshore developments are shown in blue.. .............. 28
Figure 7 Repeatability of migration routes for two Lesser Black-backed Gulls
tracked for consecutive migration periods 2010/11 and 2011/12: (a) bird 407 and
(b) bird 395, (c) bird 336 (the straight yellow line here represents data
not yet downloaded on the return route in 2011/12 for this bird.. ................................... 29
Figure 8 Home ranges for all foraging trips of Lesser Black-backed Gulls tracked from the
Orford Ness colony in 2012 ................................................................................................. 31
Figure 9 Kernels for all birds from 2012 showing seasonal variation – each map is a
five-day period, using a 1800s filtering rate.. ..................................................................... 32
Figure 10 Seasonal variation in 2012 for all birds showing (a) total home range (95% KDE)
and (b) area overlap with all offshore wind farms. Also shown are the total
number of birds both contributing data to averages (as presented in a), and
the total number of individuals overlapping in any one period (as presented in b).. ........ 33
Figure 11 Seasonal time budget across all birds for 5-day consecutive periods during 2012
showing time spent at the nest, time spent away from the nest inland, time spent
away from the nest offshore outside wind farm sites, and time spent offshore
in wind farm sites.. .............................................................................................................. 35

BTO Research Report No. 639
June 2013 6

BTO Research Report No. 639
June 2013 7
EXECUTIVE SUMMARY
1. The UK government has a commitment to obtain 15% of the UK’s energy from renewable
sources by 2020, of which wind energy is likely to form a major part (DECC 2009). Consequently
many wind farms are currently under construction and more developments are proposed (e.g.
Round 3 zones, Scottish Territorial Waters sites and extensions to Round 1 and Round 2 sites).
There is, however, much concern as to the effects that offshore wind developments may have
on seabird populations.
2. Many seabirds designated as feature species of Special Protection Areas (SPAs) might potentially
be affected by these developments, as their breeding season foraging ranges and migratory
routes may overlap with wind farm sites. The effect of wind farms on particular species is likely
to be influenced by altitude at which birds fly, and the avoidance behaviour they might show.
3. This study uses the latest tracking technology to investigate the movements of two seabird
species that are features of SPAs – Lesser Black-backed Gull and Great Skua. The aims of this
study are threefold:
i. To understand the connectivity of these feature species with the areas of consented wind
farms (i.e. those which have already been constructed or are under construction) and
proposed wind farm development sites;
ii. To understand the extent to which these feature species use the areas of wind farms which
have already been constructed or are under construction;
iii. To provide an assessment of the flight altitudes of these feature species that could usefully
inform collision risk modelling.
4. In summer 2012, 17 GPS-tagged Lesser Black-backed Gulls returned to breed at Orford Ness
(Alde-Ore Estuary SPA), including all 14 tagged in 2011 and three tagged in 2010. As well as
providing data for the 2012 breeding season, the tags on these birds also provided additional
information for the 2011/12 migration and winter periods. Only one tagged Great Skua returned
to the Foula and Hoy breeding colonies in 2012, and this bird had lost its tag and harness,
whereas a control group for skuas at both colonies showed a high return rate. No adverse effect
had been seen during the 2011 breeding season, but clearly the attachment of the tags caused
an adverse effect over the migration / winter period. While it is conceivable that the remaining
tagged skuas just skipped a breeding attempt, this is considered unlikely. Consequently, the skua
study was immediately terminated. A full discussion of this issue is presented in Thaxter et al. (in
prep a,b) and all new GPS movement information presented are from data obtained from Lesser
Black-backed Gulls.
5. In total 13% of the 2,717 trips recorded in 2012 for Lesser Black-backed Gulls contained a marine
component. The maximum foraging range offshore in 2012 during breeding was 159 km. Some
individual gulls never ventured offshore, whilst others spent a substantial amount of time away
from the colony at sea.
6. During the 2012 breeding season (mid-February-mid-July), Lesser Black-backed Gulls showed
connectivity with consented Round 1 and 2 wind farms, proposed extensions, and Round 3 sites
(overlap of 95% KDE, mean of 1.0±1.9% across birds; and mean 2.2±3.8% time offshore). During
the 2011/12 migration and non-breeding period, 10 of the 15 Lesser Black-backed Gulls left the
UK but five remained in the UK overwinter. During migration, six of the 15 birds crossed the sites
of existing and proposed wind farms but all birds came near to wind farm sites at some point.

BTO Research Report No. 639
June 2013 8
7. Considerable variation in behaviour was recorded over the season. Early in the season (pre-
breeding), use of offshore areas was low and birds stayed relatively close to the colony
apparently resting on the sea-surface overnight. As incubation approached during May, nest site
attendance increased, but thereafter dropped from late-May onwards. Only after 20/05/2012
were spatio-temporal overlaps with offshore wind farm sites recorded more extensively,
reaching up to 14% spatial overlap and just less than 5% of the total time budget (19/06/2012 –
24/06/2012). These results serve to highlight the importance of considering seasonal
investigations when assessing the extent of seabird-wind farm interactions.
8. Full analysis of the results from across the three breeding seasons and three non-breeding
seasons covered of the project, incorporating data from the 2012/13 non-breeding seasons, will
be provided in a final report later in 2013. This final report will provide an overall picture of all
movements and how these SPA feature species interact with wind farms both during breeding
and non-breeding periods. The final report will also include full analyses of flight height data, for
which the methodology is described here, including information on the distribution of flight
altitudes and analysis of environmental factors such as weather that may affect altitude.

BTO Research Report No. 639
June 2013 9
1. INTRODUCTION
1.1 Background
The UK government has a commitment to obtain 15% of the UK’s energy from renewable sources by
2020, of which wind energy is likely to form a major part (DECC 2009). Consequently many wind
farms are currently under construction and more developments are proposed (e.g. Round 3 zones,
Scottish Territorial Waters sites and extensions to Round 1 and Round 2 sites). There is, however,
much concern as to the effects that offshore wind developments may have on seabird populations.
Potential areas for development of offshore wind farms include locations that may hold large
numbers of seabirds, seaduck and other waterbirds. Both consented and proposed development
sites within the North Sea may also overlap the foraging areas of seabirds that are features of
protected sites. Offshore wind farms may potentially have an impact on these bird populations
through four main effects: (1) displacement due to the disturbance associated with developments;
(2) the barrier effect posed by developments to migrating birds and birds commuting between
breeding sites and feeding areas; (3) collision mortality; (4) indirect effects due to changes in habitat
or prey availability. When assessing the potential effects of proposed wind farms on local bird
populations, it is important to establish not only the use that birds make of the proposed wind farm
area, but also in the assessment of collision risk, whether they are likely to come into contact with
the turbines. The latter is largely determined by the height at which the birds fly, and any avoidance
behaviour that they may show towards the turbines.
Before construction is consented, an Environmental Impact Assessment (EIA) is required to identify
the possible risks posed by a development. As part of this process, where a “likely significant effect”
upon a Natura 2000 site (Special Protection Area, SPA1, or Special Area of Conservation, SAC) is
identified, an Appropriate Assessment (AA) needs to be conducted, to understand and predict the
effects on the feature species found at those sites. SPAs are designated under the European Bird’s
Directive (79/409/EEC), which protects sites within the European Union of international importance
for breeding, wintering, feeding, or migrating vulnerable bird species. Wind farms have the potential
to affect breeding seabirds or wintering waterbirds that are features of SPAs if they forage in areas
where wind farms are proposed, or pass through these areas on migration. Thus, it is important to
understand the connectivity between features of SPAs with development regions.
1.2 Project Aims
This study uses the latest tracking technology to investigate the movements of two seabird species
that are features of SPAs – the Lesser Black-backed Gull (Larus fuscus) and the Great Skua
(Stercorarius skua). The aims of this study are threefold:
i. To understand the connectivity of these feature species with the areas of consented wind
farms (i.e. those which have already been constructed or are under construction) and
proposed wind farm development sites;
ii. To understand the extent to which these feature species use the areas of wind farms
which have already been constructed or are under construction;
iii. To provide an assessment of the flight altitudes of these feature species that could
usefully inform collision risk modelling.
1http://www.naturalengland.org.uk/ourwork/conservation/designatedareas/spa/default.aspx

BTO Research Report No. 639
June 2013 10
Here, we present the findings of the third year of this study. This report presents new movement
information and seabird-wind farm interactions for Lesser Black-backed Gulls for the migration
period 2011/12 and subsequent breeding season movements of returning birds in 2012.
Comparisons of movements through the season are provided, together with some comparisons to
previous years. No new data was gathered on movements of Great Skuas (see Thaxter et al. in prep
a,b). However, we report on the field work that was carried out at Foula and Hoy in 2012. Complete
analyses of data from the three breeding seasons and three non-breeding seasons covered of the
project, incorporating data from the 2012/13 non-breeding seasons, will be provided in a final report
later in 2013. This final report will also include full analyses of flight height data (the third aim of the
study) – the methodology developed for this is described here – which will provide distribution of
altitudes and investigations of how factors such as weather affect flight altitude.

BTO Research Report No. 639
June 2013 11
2. METHODS
2.1 Field Sites
As in 2010 and 2011 (see Thaxter et al. 2012), Lesser Black-backed Gull fieldwork was conducted at
Orford Ness, Suffolk, UK (52°06’N, 1°35’E), part of the Alde-Ore Estuary SPA. There were
approximately 550 apparently occupied nests (AONs) for Lesser Black-backed Gulls at this site in
2010 and 2011 (M. Marsh, personal communication). Fieldwork for Great Skuas was again
conducted at the Foula SPA, Shetland, UK (60°8’N, 2°5’W), as in 2010 and 2011 (Thaxter et al. 2012)
and at the Hoy SPA, UK (58°52’N, 3°24’W) as in 2011, the latter work led by the University of the
Highlands and Islands (UHI). For background information on tagging and the project’s focal species,
see Thaxter et al. (2011, 2012).
2.2 The GPS System
The GPS devices deployed on birds in 2011 and 2012 are discussed in Thaxter et al. (2010 and 2011).
The system allows information from the tags to be remotely downloaded to a central base station
(Bouten et al. 2012). A perimeter of approximately 200 m2 was used around the Orford Ness gull
colony, to allow calculation of when birds were “within” the colony attending nests, and “outside”
the colony indicating nearby bathing or foraging trips. This same “perimeter fence” was used to
automatically switch the device from quicker sampling rates to less frequent rates (i.e. to conserve
battery power when the bird was at the nest).
2.3 Assessment of Tag Effects
In previous seasons (Thaxter et al. 2011, 2012), nest sites were monitored for productivity and
attendance to assess tag effects on birds. We found no significant effect on productivity or
attendance for either species during 2011. These results are also presented in Thaxter et al. (in prep
a,b). Building on these results, we were also able to assess the return rates (apparent survival) of
tagged individuals between one breeding season and the next and compare the return rates of
tagged birds to those of control colour-ringed birds in an unbiased assessment. Details of survey
methods and visits to the respective colonies are also given in Thaxter et al. (in prep a,b).
As in 2011, an excellent return rate of Lesser Black-backed Gulls was recorded at Orford Ness in
2012. All 14 of the birds previously tagged in 2011 returned to the colony, 12 with working tags – the
remaining tags had either stopped working or lost aerials meaning that data transmission was weak
or absent. A further three birds from the previous year (2010) also returned, two with working tags;
however, one of these birds had patchy data stored, thus giving an incomplete temporal
perspective.
In contrast to the gulls, only one tagged Great Skua at Foula was recorded back and this bird had lost
its tag and harness. This bird was a female that laid two eggs and upon re-trapping showed no sign
of having had a harness or any feather wear, with a weight well within the typical range for this
species at this stage of the season (see Thaxter et al. in prep a,b). No tagged birds were seen back at
Hoy. However, 10 out of 10 and 8 out of 10 birds colour-ringed in 2011 were seen back at the colony
in 2012 at Foula and Hoy respectively. During migration, one Great Skua was recovered dead on the
German coast (tag 419 from Foula) with the tag in place. Another Great Skua (tag 467) was
recovered recently on the Portuguese coast (see Thaxter et al. in prep a,b). The exact cause of death
in both cases was unknown. Another skua was seen alive in flight, from a fishing boat off the coast of
Cornwall in November 2011. Hence, a clear over-winter tag effect was recorded for Great Skuas

BTO Research Report No. 639
June 2013 12
giving no migration data, and the study for this species has now been terminated. Thaxter et al. (in
prep a,b) give further details and discussion.
2.4 Data Gathered During 2012
Table 1 gives the data gathered during 2012 for Lesser Black-backed Gulls. Due to technical
difficulties with a relay malfunction, we were unable to gather a complete full breeding season for
some individuals, with the bulk of data available prior to the end of May. However, for several
individuals, we were still able to obtain data for a considerable period (Table 1). It is hoped that
outstanding data may be obtained for those birds during the 2013 breeding season.
At the end of the 2011 breeding season, all tags from Lesser Black-backed Gulls were set on a 30
minute sampling rate. Tags from Lesser Black-backed Gulls returning from migration were changed
to a 10 minute sampling rate when feasible to do so. Based on battery life assessment, a five minute
rate for tags in their second year of deployment was deemed potentially unsustainable and may
otherwise have given gaps in the dataset. As in previous years, we also used an energy surplus
setting enabling a five-fold faster sampling rates when tags were fully charged. Additional 3 second
sampling rates were collected in short bursts between 1200-1400 hours on some days, weather
permitting, to allow further investigation into sample rate effects on flight height precision and
accuracy (see Thaxter et al. 2011).
Table 1 Current data holdings for tags on Lesser Black-backed Gulls during the breeding season.
2010 2011 2012
Year
tagged Bird Start End
Duration
(days) Start End
Duration
(days) Start End
Duration
(days)
2010 334 15/06/10 09/07/10 23.8
15/04/11 29/07/11 105.3
335 05/06/10 06/07/10 31.2
336 15/06/10 12/07/10 26.9 28/03/11 27/04/12 395.5 27/04/12 04/05/12 7.2
345 06/06/10 09/07/10 33.6
347 05/06/10 na
384 15/06/10 21/06/10 5.7
388 15/06/10 08/07/10 22.6
391 15/06/10 05/07/10 19.6
04/04/11 28/07/11 115.3
395 15/06/10 21/07/10 35.6
29/03/11 15/07/11 108.5
23/03/12 01/07/12 99.7
407 15/06/10 17/07/10 31.4
20/03/11 29/07/11 131.5
13/03/12 09/07/12 117.5
408 15/06/10 14/07/10 29.3
2011 457
21/05/11 10/06/11 19.8
459
21/05/11 24/07/11 63.3
21/03/12 18/05/12 57.7
460 21/05/11 10/08/11 80.4 15/03/12 15/07/12 121.3
478
21/05/11 01/08/11 72.2
28/02/12 26/05/12 88.1
479
21/05/11 19/08/11 90.2
26/03/12 29/05/12 63.8
480
21/05/11 12/08/11 82.4
08/04/12 06/06/12 59.4
481
21/05/11 10/07/11 50.0
482 21/05/11 09/08/11 79.9 17/02/12 26/05/12 98.9
483
22/05/11 17/08/11 86.6
19/03/12 17/06/12 89.6
484
21/05/11 31/07/11 71.2
16/03/12 25/05/12 70.5
485 21/05/11 21/07/11 60.7 27/03/12 29/05/12 63.0
486
22/05/11 11/08/11 81.4
24/03/12 30/06/12 97.9
492
21/05/11 01/07/11 41.0
16/03/12 19/06/12 94.5
493 21/05/11 03/08/11 73.5 20/02/12 25/06/12 126.4
Total
259.6
1808.8
1255.5
Mean 26.0±8.7 95.2±77.3 83.7±30.9

BTO Research Report No. 639
June 2013 13
2.5 Data Processing and Analysis
2.5.1 Defining trips and calculating trip statistics
Following Thaxter et al. (2012), we considered all trips for assessment of interaction with wind farm
sites, but defined those trips that were offshore, inland, or a mixture of both. We therefore
calculated an “offshore foraging range” (the maximum point reached offshore from the colony). For
all trips we calculated the total distance travelled per trip, by summing distances between GPS
points from the moment the bird left the colony until its return. Trip duration was calculated from
the time the bird left the colony to the time it returned.
2.5.2 Connectivity with the areas of proposed and consented wind farms
As in 2010 and 2011 (see Thaxter et al. 2012), the connectivity between Lesser Black-backed Gulls
and consented and proposed wind farms was assessed. The data collected between autumn 2011
and spring 2012 allowed connectivity to be evaluated on migration as well as during the breeding
season.
2.5.3 Spatial overlap of home ranges with consented and proposed wind farms
We investigated the overlap of areas used at sea with wind farm sites using kernel analysis (Worton
1989) to estimate the 50%, 75% and 95% kernel density estimates (KDEs) of the birds’ utilisation
distributions to define core, middle, and total foraging “home ranges” respectively, using Least
Squares Cross Validation (LSCV) (e.g. Hamer et al. 2007; Thaxter et al. 2009, 2010), following
methods presented in Thaxter et al. (2012). We also distinguished between observations for which
travelling speed was greater or less than 4 km.h-1
, the speed below which it is thought that birds are
unable to sustain flight (Shamoun-Baranes et al. 2011; Thaxter et al. 2011), so as to provide some
indication of likely resting and foraging locations (hereafter termed “KDE foraging”). All kernel
analyses were conducted using Package ‘adehabitat’ (Callenge 2006) in R 2.16.0 (R Development
Core Team 2012).
2.5.3.1 Seasonal variation
Previously (Thaxter et al. 2012), an attempt was made to define periods of “breeding” and “non-
breeding”. This approach was originally taken to investigate wind farm interactions during
incubation or chick-rearing (before 09/07/2011), and a likely non-breeding period when the majority
of birds were thought to no longer have chick-rearing duties and therefore no central-place foraging
restriction (after 09/07/2011). However, such a distinction can be refined further making full use of
the extensive dataset we have now collected. Due to difficulties of nest monitoring inherent for gulls
(see Thaxter et al. in prep a,b), we were not able to determine laying dates or hatching dates
precisely enough to define specific periods of incubation and chick-rearing for individuals in 2012.
Therefore, here we refined the previous approach in Thaxter et al. (2011) by investigating the
behaviour of birds in 5-day consecutive time periods across the season from mid-February to mid-
July 2012. This approach allowed us to assess individual seasonal variation in seabird-wind farm
interactions at a finer scale throughout the pre-breeding, incubation and chick-rearing periods, and
serves also to highlight the advantage of a long-term tracking approach.
For assessment of space use, we computed separate utilisation distributions (KDEs: 95%, 75% and
50%) for each 5-day period for all individuals. We then computed mean overlaps of the 95% KDE
with consented and proposed offshore wind farm sites. As previously (Thaxter et al. 2010, 2011),
GPS data were filtered to a 30 minute rate for spatial analysis to allow a wider time period of

BTO Research Report No. 639
June 2013 14
investigation. This analysis was also repeated for all individuals pooled together in a single
assessment representing a kernel for the “population”. Such an approach was also necessary to
avoid spurious comparisons with the results from previous years that may be influenced by when in
the season most data were available. Annual variation using this seasonal approach will be a central
subject to the final report.
2.5.4 Time budgets of birds
As previously (Thaxter et al. 2011, 2012), we assessed the temporal overlap of all foraging trips with
all offshore trips. We calculated the time spent in wind farms in relation to the total time budget of
the bird and the total time spent by the bird offshore. This was achieved through assessment of the
track of the bird with wind farm shapefiles using custom-written R scripts.
2.5.4.1. Seasonal variation
As with the kernel analyses, we also assessed the time budgets of birds throughout the 2012 season,
quantifying the amount of time birds spent within consented and proposed wind farm sites offshore
in relation to their total time budgets.
2.6.5 Formal statistical tests – spatial overlap and time budgets
To assess the difference of trip duration and foraging range to previous years, we used generalized
additive mixed-effects models (GAMMs) with a negative binomial or Poisson error distributions
accounting for Julian date fitted as a smoothed effect, sex of birds as a fixed effect and BirdID as a
random effect to account for repeated trips made by individual birds. This approach allowed annual
signals to be detected in absence of other variation. Smoothed effects were specified with a gamma
of 1.4 and degrees of freedom for the smooth were set to k = 6 (Wood 2006).
To assess 5-day spatial overlaps with offshore wind farms across the season, the area of the 95% KDE
estimate overlapping was assessed in a GAMM accounting for s(Julian Date), Sex, and Year, and an
offset of total kernel area, thus assessing the proportional overlap. A similar approach was taken to
assess the time spent in offshore wind farms. In addition to bird-specific analyses, a total “all bird”
analysis was conducted for kernel overlap.
All GAMMs used F tests to assess the significance of fixed effects and, with the most significant
variables selected through stepwise forward selection. Random effects were tested with and
without the term fitted (using delta AIC). Values are given as the mean ±1 SD unless otherwise
stated. All analyses were performed using R Version 2.14.0 (R Development Core Team 2012).

BTO Research Report No. 639
June 2013 15
2.5.6 Flight altitudes
2.5.6.1 Altitude Analysis
The following outlines the analyses that are being undertaken to describe the flight height
distributions of the Lesser Black-backed Gulls tagged at the Alde-Ore SPA, and the complete outputs
that will be provided in the final project report in 2013. A full analysis of flight height data will enable
improved assessment of collision risk, by providing modelled distributions of altitudes, and
assessment of the influence of environmental variables, and also specific information of the heights
flown through wind farm sites. This analysis will fulfil the third main aim of the study.
2.5.6.2 Precision and accuracy in measurements
To analyse the flying altitude of birds, it is important to consider the error in the altitudinal
measurements from the tags, both in terms of their precision and accuracy. Examining the altitudes
from stationary birds (i.e. those for which are likely to be on the sea or at the colony and thus at 0m
altitude) gives an indication of the amount of error in the estimates. Whilst a few recordings of
negative altitude may be expected when sea level is low or swell takes birds below the mean sea
surface, the data show a large number of negative altitudinal readings, extending below 40 m in the
example below (Figure 1). As there is no plausible reason for accurate altitudinal readings that low,
we suppose that much of the variation is error or bias in the altitudinal estimates. Bias (accuracy)
may be introduced from two sources. Firstly, the difference between sea level and mean sea level
and secondly the assumption that the world is a perfect sphere. The first of these can be corrected
for by calculating the sea level for the time of each observation, and adjusting the altitudinal reading
accordingly. The second of these is thought to introduce a negative bias of 6m to the altitudinal
measurements (see first year report). Once accounting for these sources of bias (inaccuracy) in the
measurements, we need to account for the error (or precision) of the observations.
Figure 1 Altitudinal readings from one lesser black-backed gull during 2010 when stationary.
2.5.6.3 The modelling process
Given the need to account for the error in the estimates and the division of bird behaviour into
discrete states with different flight height distributions (Shamoun-Baranes et al. 2012), a Bayesian
state-space model (e.g. Newman et al. 2009, Harrison et al. 2011, King 2012) is a natural choice for
407 Stationary (<1 km/h)
Altitude (m)
Fre
que
ncy
-50 -40 -30 -20 -10 0 10 20 30 40 50 60 70 80 90 100
02
46
810
02
46
810
12
14

BTO Research Report No. 639
June 2013 16
the analytical framework. The model processes are divided into ‘observation model’ and
‘state/process model’.
The ‘observation model’ is in this context the relationship between the true altitude and the altitude
we observe. This is likely to be dependent on the number and position of satellites used to calculate
the altitude and the weather at the time (Figure 2). For the process model we propose assuming a
fixed number of discrete states, of which each bird is in one state at any given time. The states are
assumed to be strongly linked to acceleration (Bouten et al. 2012, Shamoun-Baranes et al. 2012),
and therefore acceleration is used as a proxy for state, although some error is assumed in the
assignment of states from acceleration alone. Several factors are assumed to affect the probability
of a bird being in a given state at a given time and also transitioning into a state. These are sex,
season – breeding season, migration, winter – time of day, weather, whether a bird is over land or
the sea and whether or not the bird is in a constructed wind farm area (Figure 2). Each activity state
is assumed to have a distribution of flight heights; some of these are assumed to be Gaussian, whilst
some are more complex or non-parametric distributions. The form of these distributions will be
determined a priori by expert opinion and previous studies (e.g. Cook et al. 2012). The distributions
are assumed to describe the altitudinal distribution of a given bird in a given state. However, a
number of factors can potentially also affect the absolute altitude of a bird, and these are thought to
include weather, individual effects and whether the bird is in a constructed wind farm area or not
(Figure 2). The model shown in Figure 2 describes the optimal model we aim to fit; however, given
the complex nature of the data and the complexities inherent in this modelling approach, the final
model may be a simpler version of the model in Figure 2.
Figure 2 Schematic diagram of the state-space modelling approach proposed.

BTO Research Report No. 639
June 2013 17
We are fitting this model with Markov Chain Monte Carlo (MCMC) methods (Gilks et al. 1996) in
OpenBUGS (Lunn et al. 2009) or JAGS (Plummer 2003).
2.5.6.4 Outputs
Full analyses and results will be included in the final project report, based on data from the three
breeding seasons and three non-breeding seasons covered by the study. The outcome from this
modelling process will be a distribution of altitudes for each of the discrete states that we model.
We will also be able to infer how factors such as weather affect which states the birds are in and
altitude within the states (although we may have limited power to detect this, given the poorer
accuracy in poor weather), and whether birds behave differently and fly at different altitudes when
in a constructed wind farm area.

BTO Research Report No. 639
June 2013 18

BTO Research Report No. 639
June 2013 19
3. RESULTS
3.1 Descriptive Trip Statistics
A total of 17 Lesser Black-backed Gulls tagged in previous years returned to the Orford Ness
breeding colony in 2012. All of the 14 birds that were tagged in 2011 returned to the colony and of
these, 12 had fully functional tags. Some tags had become damaged over the winter, with external
aerials missing and therefore preventing communication. In addition, three birds tagged in 2010 also
returned to the colony, of which two had fully functional tags providing information through the
breeding season (bird 336 had an outward migration information available but no breeding season
movements for 2012), giving a total of 14 birds for assessment of breeding season, and 15 birds with
migration and non-breeding.
As in previous years, the Lesser Black-backed Gulls that had active tags during the 2012 breeding
season made a mixture of solely inland trips and coastal trips (88%), trips that were offshore (2%)
(hereafter “offshore”), and trips that straddled both inland and offshore habitats (11%) (Table 2).
Note that some very short trips, e.g. visits to fields adjacent to the colony, were included in these
totals. In total, 3,104 trips across all birds (those tagged in 2010 and in 2011) were recorded, and
these are summarised in Table 2.
During 2012, a total of 1255.5 bird-hrs data were available (mean per bird: 83.7±30.9 days), which
compared with 1808.8 (mean: 95.2±77.3 days) in 2011 and 259.6 (mean: 26.0±8.7) in 2010 (see
Table 2). However, the length of time individuals were tracked also varied depending on tag
functionality and download of data. Returning birds that provided data in 2012, from all tag-cohorts,
provided data from Julian day 48 (i.e. 17 February; mean: 79±18) up to day 193 (mean: 161±20). In
contrast, during 2010, birds were tracked between Julian dates of 157 and 199, with a mean end
date of 188±7, and during 2011, birds tagged in 2010 returned from day 79, but on average the date
was 91±10, and their data lasted the full season up to day 211 (mean, 177±51). Therefore, more data
was available later in the season in 2011 and more data earlier in 2012 (in part because of an earlier
return of birds). Some trips away from the colony had gaps in the GPS record, for instance when
trialling faster 3s sampling rates, and were therefore excluded from further analysis of distance
travelled and trip duration.
Across the whole 2012 breeding season, gulls had an offshore foraging range of up to 158.47 km
(mean 13.21±15.05 km) and travelled up to a total cumulative distance per trip of up to 788.78 km
(mean 20.34±40.62 km), these trips lasting up to 253.89 hrs (mean 5.65±10.98 hrs). The two birds
tagged in 2010 that returned with active tags showed similar trip summary statistics to those 12
tagged in 2011 that also returned with active tags.

BTO Research Report No. 639
June 2013 20
Table 2 Descriptive trip statistics for all trips of Lesser Black-backed Gulls tracked from the
Orford Ness colony in 2012. Trip duration and total distance travelled are computed for
all trips, however offshore foraging range is calculated only from those trips with an
offshore component.
Year tagged Number of trips Trip duration (hrs)
Offshore foraging
range (km) Total distance (km)
Bird Inland Offshore Total Mean Max Mean Max Mean Max
2010 395 232 2 234 5.47±17.12 253.89 7.16±4.98 10.68 10.92±51 771.45
2010 407 204 45 249 8.46±13.87 154.3 16.02±25.96 158.47 29.31±67.08 677.76
2010 336* 1 1 2 85.34±116.37 167.62 - 0.4 73.23±96.44 141.43
2011 459 143 14 157 5.03±5.56 35.66 16.01±25.27 100.75 15.19±27.72 272.3
2011 460 272 49 321 4.71±12.92 206.16 10.46±11.41 47.8 16.6±26.59 377.77
2011 478 243 40 283 3.94±8.44 130.66 11.15±4.3 18.65 15.99±27.98 429.83
2011 479 179 4 183 4.61±4.79 34.21 10.75±6.38 19.73 21.95±23.9 149.55
2011 480 111 8 119 9.44±9.28 52.82 11.98±2.89 16.14 20.21±36.13 280.86
2011 482 153 40 193 10.48±14.89 174.81 12.39±7.42 30.47 25.81±32.21 219.99
2011 483 216 19 235 3.62±3.56 19.7 7.77±3.78 16.32 25.47±37.69 220.29
2011 484 127 30 157 9.16±8.48 46.24 9.87±7.23 39.09 17.43±20.94 119.15
2011 485 74 16 90 5.13±5.4 27.56 10.36±10.49 42.92 21.32±28.41 131.49
2011 486 247 34 281 3.71±3.53 21.5 20.31±20 66.98 20.33±25.93 222.73
2011 492 199 25 224 4.8±6.66 74.36 8±4.85 19.02 17.06±38.28 405.01
2011 493 316 60 376 4.96±14.49 193.92 18.34±17.17 71 25.02±58.98 788.78
All* 2717 387 3104 5.65±10.98 253.89 13.21±15.05 158.47 20.34±40.62 788.78
* Bird 336 moved to nest at nearby Havergate and very few data were available, hence grand totals exclude this bird
3.1.1 Annual variation in trips
Analysing information from trips in 2010, 2011, and 2012, the distance reached offshore varied
significantly over the season (GAMM, edf = 4.47, F = 26.04, P < 0.001), with trips generally reaching
further from the colony as the season progressed. However, there was significant annual variation in
this pattern (Figure 3), with a model specifying differences between years significantly improving the
model (dAIC = 37.01, df = 2). In contrast to 2010, in 2011 and 2012, trips after Julian date 175
showed no further increase in distance from the colony, and even showed a decrease in offshore
range in 2011. There was further model improvement when individual ID was fitted as an interaction
variable with the smoothed term of Julian date (dAIC = 52.10, df = 19), indicating significant
individual variation in these patterns. After accounting for seasonal variation, there was a significant
difference in overall foraging range offshore between years (fixed effect of Year: F = 9.120, df = 2, P <
0.001), with 2011 trips significantly closer to the colony than 2010 (β = -0.253±0.123, P = 0.002), and
2012 trips shortest of all (-0.587±0.140), significantly more so than 2010 (P <0.001). The reasons
underpinning these differences will be explored in the final report. There was no difference between
sexes in distance reached from the colony (F = 0.144, df = 1, P = 0.705). Individuals also varied
significantly in their distances reached offshore (Bird ID Std Dev = 0.330, residual = 3.489; dAIC
comparison with and without random effect= 5507.634).
The time birds spent away from the nest (trip duration) increased over the season (GAMM
negbin(1.17), edf = 4.437, F = 71.35, P < 0.001). There was also a significant difference between
years in this pattern (Figure 3) (dAIC = 80.32, df = 2), with a clear increase in trip duration after Julian
Date 150 in 2011 and 2012. There was also significant individual variation (dAIC = 336.60, df = 19) in
these patterns. After accounting for this variation, trips were significantly longer in 2010 (F = 30.06,
df = 2, P < 0.001; 2010, 8.37±19.26 hrs, 2011, 4.72±7.53 hrs, 2012, 5.65±10.98 hrs; β2011 = -

BTO Research Report No. 639
June 2013 21
0.636±0.107, P < 0.001, β2012 = -0.355±0.114, P = 0.002) and females made longer trips overall than
males (F = 17.96, df = 1, P < 0.001; means, female: 6.70±10.60 hrs; male: 4.79±10.35 hrs; βmale = -
0.355±0.084, P < 0.001).
Birds generally travelled further per trip as the season progressed (analysis included inland and
offshore areas) (GAMM negbin(0.73), edf = 4.78, F = 59.18, P < 0.001). There was also a significant
difference between years in this pattern (Figure 3) (dAIC = 50.27, df = 2), and significant individual
variation (dAIC = 55.97, df = 19) in these patterns. After accounting for this variation, birds travelled
significantly further per trip in 2010 compared to 2012 (F = 6.61, df = 2, P = 0.001; β2011 = -
0.180±0.143, P = 0.209, β2012 = -0.369±0.152, P = 0.015) but there was no difference between sexes
(F = 0.22, df = 1, P = 0.637).
(a)
(b)
Figure 3 Smoothed Terms from a general additive model (GAM) for (a) offshore foraging range,
and (b) trip duration showing annual variation in seasonal patterns.
Julian Date
S(J
uli
an
Da
te)
S(J
uli
an
Da
te)
2010 2011 2012

BTO Research Report No. 639
June 2013 22
3.2 Connectivity with the Areas of Proposed and Consented Wind Farms
3.2.1 2012 breeding season
During the 2012 breeding season, a total of five of the 14 birds with active tags (407, 459, 460, 486,
and 493) showed overlaps with offshore wind farm sites, all of which showed connectivity with the
large Round 3 East Anglia zone (Figure 4). However, four also showed connectivity with Galloper
extension, three showed connectivity with the Greater Gabbard Round 2 development, and one bird
(407) with the Round 1 development at Scroby Sands. All other birds, although some did forage
offshore, showed no connectivity with offshore wind farms.
Figure 4 Plot of all Orford Ness data for Lesser Black-backed Gulls tracked from the Orford Ness
colony in 2012. Purple = Round 3; orange = Rounds 1 and 2; grey = extensions.
3.2.2 Migration
3.2.2.1 Data summary
A total of 15 Lesser Black-backed Gulls provided information on migration routes between July 2011
and April 2012, 12 from birds tagged in 2011, and 3 from birds tagged in 2010. Birds travelled on
average 1,344±841 km from the colony over a total distance of 12,493±4,694 km, 227±20 days away
from the colony. The maximum distance from Orford Ness for any bird in 2011/12 was 2,211 km
(bird 460), but a different bird travelled further overall (20,481 km, bird 481). A further bird was

BTO Research Report No. 639
June 2013 23
away from the colony for a total of 259 days (492). For many birds, gaps were noticeable in the data
records (Table 3). These gaps were due some birds remaining in the UK late into autumn and early
winter before migration, and for five individuals, not leaving the UK at all (see below). The largest
gap for any bird in 2011/12, for which we subsequently recorded 2012 breeding season movements,
was a period of 157 days (tag 485) out of the total migration absence of 250 days, see Table 3.
Another bird (336) returned to the colony but is thought to have bred away from Orford Ness and
coupled with tag downloading malfunction, only data from the outward migration route (gap of 251
days) have so far been downloaded.
Table 3 Migration information for all birds from 2010/11 and 2011/12 winter periods.
Migration Bird Sex Left
colony
Returned to
Colony
Maximum
distance from
colony (km)
Total Travel
Distance (km)
Time away
from colony
(days)
Time tag not
recorded
(days)
2010/11 334 M 09/07/10 15/04/11 2233 20874 280.03 15.71
2010/11 336 M 12/07/10 28/03/11 1947 20863 259.14 29.61
2010/11 395 M 21/07/10 29/03/11 2114 15599 251.05 16.52
2010/11 407 F 17/07/10 20/03/11 1970 14804 246.22 6.75
2010/11 391
05/07/10 04/04/11 2490 14431 272.97 2.43
2010/11 388 08/07/10 17/05/20112 4226 -
3 -
3 17.44
2011/12 336 M -1 27/04/12 1947 -
3 -
3 250.96
2011/12 395 M 16/07/11 23/03/12 1881 13795 251.05 17.90
2011/12 407 F 29/07/11 13/03/12 1965 13564 227.59 13.90
2011/12 459 F 24/07/11 21/03/12 1893 20080 241.11 2.24
2011/12 460 M 10/08/11 15/03/12 2211 14066 218.48 0.00
2011/12 478 M 02/08/11 28/02/12 180 10007 210.08 26.67
2011/12 479 (M) 20/08/11 26/03/12 2028 15913 219.28 0.00
2011/12 480 F 12/08/11 08/04/12 1720 20481 240.00 1.62
2011/12 482 F 09/08/11 17/02/12 300 7190 191.49 49.05
2011/12 483 M 17/08/11 19/03/12 1723 9852 215.43 0.00
2011/12 484 F 31/07/11 16/03/12 1909 13949 228.45 3.28
2011/12 485 F 21/07/11 27/03/12 212 4712 250.27 156.51
2011/12 486 M 11/08/11 24/03/12 1842 14982 226.03 58.19
2011/12 492 F 01/07/11 16/03/12 211 7773 258.78 -4
2011/12 493 (M) 03/08/11 20/02/12 132 8539 201.12 42.30
1 Bird believed to be breeding at different colony at Havergate, hence no start to migration from Orford Ness
2 Last time stamp - bird was caught by a fishermen in Mauritania
3 Incomplete migration information, no return journey
4 Bird departed with tag sampling at 3s; on 24/08/2011, the sampling rate increased to over 300 s until the bird's return

BTO Research Report No. 639
June 2013 24
3.2.2.2 Wind farm overlaps
In total, the migration routes of six of the 15 birds for which we had data overlapped with offshore
wind farm sites during the 2011/12 migration and winter periods. In contrast to the 2010/11
migration period, five of the 15 birds stayed in the UK overwinter during 2011/12 (birds 478, 482,
485, 492 and 493 – see Figures 5 and 6), hence distances reached from the colony of these
individuals were much lower than other birds (Table 3). All five birds spent nearly all of their time
inland, and four of these birds did not overlap with any offshore wind farms. However, bird 493
overlapped once with East Anglia Round 3 zone and 492 came very close to Inner Dowsing off the
east coast of England.
The other 10 birds all left the UK, many making movements to the Midlands and the south of
England before heading off on migration, and of these, five overlapped with offshore windfarms.
Three of these birds overlapped with the Isle of Wight Round 3 zone (483, 479, 407), with an
additional bird (486) coming very close, and another (395) overlapped with the Southern Array
Round 3 zone. Bird 460 overlapped with the existing London Array wind farm, as well as the Thanet
proposed extension, coming very near to the existing Thanet wind farm, and 459 came very close to
the existing Greater Gabbard wind farm. Five birds (459, 480, 484, 486, and 336) showed no
overlaps; however, for 336 only, the outward migration route has so far been downloaded, and birds
459 and 484 also had considerable gaps on migration where no GPS data were recorded due to low
battery. As in 2010/11 migration, birds also few in the vicinity of a proposed French offshore wind
farm (http://eoliennes-deux-cotes.com/) and since many flew over Spanish, Portuguese and
Moroccan waters, future offshore developments by these countries could potentially affect this
species.
BTO Research Report No. 639
June 2013 25
Figure 5 Flight paths of tagged Lesser Black-backed Gulls leaving and returning to Orford Ness on
migration between July 2011 and April 2012. Tracks of different individuals are shown in
different colours, and UK offshore developments are shown in blue.

BTO Research Report No. 639
June 2013 26
Figure 6 Flight paths of tagged Lesser Black-backed Gulls showing their movements throughout
migration and overwinter. Tracks of different individuals are shown in different colours,
and UK offshore developments are shown in blue.
Further full migration data was gathered for two birds tagged in 2010, and another individual (336)
for the outward migration route in 2011/12, hence providing longitudinal data spanning consecutive
migration periods. A gap in the migration record for bird 395 was also apparent on outward
migration. However, these data showed the individual Lesser Black-backed Gulls migrated along
similar routes between 2010/11 and 2011/12, suggesting consistency in migration strategy between
years (Figure 7). These results are relevant for potential repeatability of seabird-wind farm
interactions during migration for the same individuals.

BTO Research Report No. 639
June 2013 27
(a) (b)
(c)
Figure 7 Repeatability of migration routes for two Lesser Black-backed Gulls tracked for
consecutive migration periods 2010/11 and 2011/12: (a) bird 407 and (b) bird 395, (c)
bird 336 (the straight yellow line here represents data not yet downloaded on the return
route in 2011/12 for this bird).

BTO Research Report No. 639
June 2013 28
3.3 Spatial Overlap of Home Ranges with Consented and Proposed Wind Farms
Percentage overlaps of the 50% KDE, 75% KDE and 95% KDE with consented and proposed offshore
wind farm sites are presented for each individual bird (kernel analysis for GPS locations of individual
birds) in Table 4. A full “population” kernel analysis for all birds across the season was attempted but
did not converge, hence an average across all birds is given to provide a relative population
perspective.
Lesser Black-backed Gulls from the Orford Ness colony showed up to 5.6% overlap with all offshore
wind farms (bird 407), but more typically showed on average only 1.0±1.9% across all birds. Up to
5.0% overlap of the 95% KDE was recorded with the East Anglia Round 3 zone (1.3% 95% KDE
“foraging” overlap, bird 407), however in contrast to 2011, no birds had core foraging areas
overlapping with any offshore wind farm sites. Birds showed further overlaps to a lesser degree with
the Galloper extension and the Greater Gabbard Round 2 site, as well as one overlap (bird 407) with
the Scroby Sands Round 1 site; however, all such overlaps were less than 1%.
As with previous years, there was considerable individual variation in the behaviour of tagged gulls
(Figure 8). Varying amounts of data (number of fixes in Table 4) were available for each bird, ranging
between 548 filtered fixes and 3050. The home ranges of only four individuals overlapped with
offshore wind farms. A single foraging trip of an additional bird also overlapped with one offshore
wind farm area, though this was not reflected in its home range (see Table 5, time budgets).
Table 4 Overlap analysis of “individual bird” kernels (pooled analysis) with wind farms (WF) for
individual Lesser Black-backed Gulls tracked from the Orford Ness colony in 2012 using a
1800 s rate.
Bird Name Total (%)
"Foraging"
(%) Area (km
2) No.
fixes 50 75 95 50 75 95 50 75 95
395 68.2 156.1 819.6 1810
407 East Anglia 5.0 1.3 124.3 360.1 1899.8 2966
Galloper Extension 0.4 0.2 124.3 360.1 1899.8 2966
Scroby Sands 0.3 0.3 124.3 360.1 1899.8 2966
459 Galloper Extension 0.4 73.5 155.9 567.1 1016
460 112.9 220.2 412.0 1943
478 140.2 333.5 865.3 1265
479 84.5 161.6 393.7 1033
480 67.3 155.6 608.9 1705
482 86.9 191.4 578.0 3050
483 74.4 208.0 628.9 847
484 59.0 121.7 392.7 2223
485 133.1 271.1 649.4 548
486 East Anglia 3.5 0.0 86.1 180.3 496.3 1059
Galloper Extension 0.7 0.0 86.1 180.3 496.3 1059
Greater Gabbard 0.1 86.1 180.3 496.3 1059
492 99.6 280.3 887.8 1393
493 East Anglia 3.6 0.6 171.6 410.7 1156.4 2138

BTO Research Report No. 639
June 2013 29
Figure 8 Home ranges for all foraging trips of Lesser Black-backed Gulls tracked from the Orford
Ness colony in 2012. Data were filtered to a 1800 s rate to allow focus across the season.
Rounds 1 and 2 = orange shapes, Round 3 = purple, extensions = dark grey; 95% KDE =
blue; 75% KDE = yellow; 50% KDE = red.

BTO Research Report No. 639
June 2013 30
3.3.1 Seasonal variation in home ranges
The pattern of area use for all gulls combined varied throughout the season. Investigating sequential
5-day time periods, it was clear that although there was some use of offshore areas early in the
season, overlaps with consented and proposed wind farm sites were only recorded almost entirely
from 25/05/2012 to 29/06/2012.
The total area coverage by individual birds (expressed as a proportion of the maximum area of the
95% KDE in any 5-day section), showed a non-linear decrease and subsequent increase as the season
progressed. The average KDE proportion was at its lowest between 30/05/2012 and 04/06/2012
with a minimum of 21.8±6.1 SE %. This was when birds increasingly spent time at the nest site (see
time budget analyses). The largest proportional overlap of the 95% KDE with all offshore wind farm
sites was seen between 19th
June and 24th
June (Figures 9 and 10) reaching up to 14.1±6.7 %SE.
Figure 9 Kernels for all Lesser Black-backed Gulls tracked from the Orford Ness colony in 2012
showing seasonal variation – each map is a 5-day period, using a 1800s filtering rate.
Note, these are pooled data across all individuals dependent on the number of birds
available in each five-day period.

BTO Research Report No. 639
June 2013 31
(a)
(b)
Figure 10 Seasonal variation in 2012 for all birds showing (a) total home range (95% KDE) and (b)
area overlap with all offshore wind farm sites. Also shown are the total number of birds
both contributing data to averages (as presented in a), and the total number of
individuals whose ranges overlapped with offshore wind farm sites in any one period (as
presented in b).
0.0
0.2
0.4
0.6
0.8
1.0
31/0
1
10/0
2
20/0
2
01/0
3
11/0
3
21/0
3
31/0
3
10/0
4
20/0
4
30/0
4
10/0
5
20/0
5
30/0
5
09/0
6
19/0
6
29/0
6
09/0
7
Pro
po
rtio
n o
f m
axim
um
95
% K
DE
2012, N = 14 birds
0
2
4
6
8
10
12
14
Nu
mb
er
of b
ird
s in
sa
mp
le
No. birds
31/0
1
10/0
2
20/0
2
01/0
3
11/0
3
21/0
3
31/0
3
10/0
4
20/0
4
30/0
4
10/0
5
20/0
5
30/0
5
09/0
6
19/0
6
29/0
6
09/0
7
0
5
10
15
20
95
% K
DE
-win
dfa
rm o
ve
rla
p (
%)
0
2
4
6
8
10
12
14
Nu
mb
er
of b
ird
s o
ve
rla
pp
ing
No. birds overlapping

BTO Research Report No. 639
June 2013 32
3.4 Time Budgets
Between 17/02/2012 and 15/07/2012, Lesser Black-backed Gulls spent between 0% and 10.3%
(average, 2.2±3.8) of their offshore time in wind farm sites (Table 5). However, the time spent in
wind farms was less than 1% of the total time budget for all but one bird (407, 1.1%). Nine
individuals did not visit wind farm sites at all. As previously, the wind farm site in which the greatest
proportion of gulls’ time was passed was the East Anglia Round 3 Zone, which is the largest in the
vicinity of Orford Ness. As in 2011, birds also showed temporal overlap with the Greater Gabbard
Round 2 site and the Galloper extension, and bird 407 also interacted with a Round 1 site (Scroby
Sands).
Table 5 Information on (a) Time budgets of Lesser Black-backed Gulls during 2012 (hrs), including
time spent offshore and in wind farm (WF) sites; and (b) Number of trips, and number of
trips offshore that overlapped with offshore wind farm sites during 2012.
(a)
Year
tagged Bird
Total
time At Nest
On trip
On trip
total Inland
Offshore
Offshore
total
Not in
WF
In WF
Total East
Anglia
Galloper
Ext
Greater
Gabbard
Scroby
Sands
2010 395 2115.3 824.4 1290.8 1288.0 2.8 2.8
407 3000.0 831.7 2168.3 1858.4 309.9 278.0 31.9 28.2 2.3 0.0 1.4
2011 459 1440.0 642.1 797.9 709.7 88.2 84.3 3.9 1.3 2.5
460 3120.0 1493.8 1626.2 1417.9 208.3 204.6 3.7 3.3 0.1 0.3
478 2160.0 1096.5 1063.5 715.2 348.2 348.2
479 1680.0 731.9 948.1 935.5 12.7 12.7
480 1560.0 385.3 1174.7 1107.2 67.4 67.4
482 2442.1 358.5 2083.6 1793.3 290.3 290.3
483 2280.0 1366.7 913.3 782.4 130.9 130.9
484 1800.0 258.7 1541.3 1329.0 212.3 212.3
485 877.6 269.1 608.4 553.6 54.8 54.8
486 2400.8 1260.1 1140.7 980.3 160.4 146.0 14.4 10.6 1.9 1.9
492 2400.0 1212.7 1187.3 1000.5 186.8 186.8
493 2967.8 1093.8 1874.1 1484.7 406.4 369.5 26.2 26.2
Total 30243.6 11825.4 18418.2 15955.7 2479.5 2388.7 80.2
(b)
Year
tagged Bird
All
trips
Offshore
trips
East
Anglia
Galloper
Ext
Greater
Gabbard
Scroby
Sands
2010 395 234 2
407 244 45 4 2 1 1
2011 459 156 14 1 1
460 317 49 4 1 1
478 283 40
479 183 4
480 119 8
482 193 40
483 235 19
484 157 30
485 90 16
486 273 34 7 3 3
492 224 25
493 366 60 10
Total 3074 386 26 7 5 1

BTO Research Report No. 639
June 2013 33
3.4.1 Seasonal variation in time budgets
In the 2012 season, the early return of a large number of tagged birds with functioning tags provided
good temporal coverage from the early breeding season through until mid-July, spanning pre-
breeding, incubation, and part of the chick-rearing period. Note, data were not available for five
birds (485, 486, 493, 395, and 482) for some of the breeding season, and thus the sample size for the
5-day periods analysed varies from nine to 14 birds.
Splitting individual bird time budgets into 5-day periods showed that on average, the time spent at
the nest gradually increased until mid to late May when incubation begins (Figure 11). Inland
movements were consistently more frequent than offshore movements prior to late May, and no
birds interacted with offshore wind farm sites until late May. Use of offshore areas prior to
incubation (pre-breeding) was mostly limited to birds drifting on the sea overnight close to the
colony. The time spent offshore increased up to an initial peak of 27.6% (between 15/02/2012 and
20/02/2012), with another lesser peak of 13.5% between 24/06/2012 and 29/06/2012 (Figure 11).
Time spent in offshore wind farm sites peaked between 19/06/2012 and 24/06/2012. Time away
from the nest inland decreased until the 30/04/2012, thereafter increasing markedly.
This simple analysis reveals how time budgets, and therefore time spent in the areas of offshore
wind farm sites, varied considerably throughout the season. Further analyses of seasonal patterns
will be conducted for the final report using all years’ data.
Figure 11 Seasonal time budget across all birds for 5-day consecutive periods during 2012 showing
time spent at the nest, time spent away from the nest inland, time spent away from the
nest offshore outside wind farm sites, and time spent offshore in wind farm sites.
3.5 Flight Heights
Work is currently in progress analysing flight height data. Following the methodology presented in
the methods (section 2), a full analysis will be included in the final report.

BTO Research Report No. 639
June 2013 34

BTO Research Report No. 639
June 2013 35
4. DISCUSSION
4.1 Overview
4.1.1 Lesser Black-backed Gulls
The 2012 field season for Lesser Black-backed Gulls was very successful. In particular, the high
number of tagged individuals from 2011 and 2010 returning with functioning tags has provided
some excellent data. Although relay malfunction prevented downloading of all the data from birds
towards the end of the breeding season, some interesting seasonal patterns have been revealed. For
Lesser Black-backed Gulls at Orford Ness, the 2012 season was a less successful season in terms of
productivity than in 2011. As in 2010, many nests failed at the egg stage and chick fledging success
was believed to be low. Therefore, it is likely that annual variations in seasonal behaviour may be
apparent, hence a full comparison of seabird wind-farm interactions will be investigated and
presented in the final report.
A degree of inter-annual variation was demonstrated between 2010, 2011, and 2012 for Lesser
Black-backed Gulls in terms of the distances travelled and time spent offshore, as well as seasonal
patterns in distances reached offshore and trip duration. These findings highlight the importance of
such studies spanning more than one season to gain a better understanding of seabird-wind farm
interactions
4.1.2 Great Skuas
In contrast to the gulls, only one Great Skua tagged from 2011 returned to breed in 2012, and this
bird had lost its tag and harness. A further two birds have been recovered outside the UK during
migration, and nearly all colour-ringed control birds returned to both Foula and Hoy in 2012. The
differences between species were wholly surprising and unanticipated, and are discussed in more
detail in Thaxter et al. (in prep a,b). Consequently no migration data was obtained for skuas, and the
study for this species has now been terminated. Furthermore, for Great Skuas, the 2012 breeding
season was very poor at both Foula and Hoy, and as in previous years, birds fledged a very low
proportion of chicks (Thaxter et al. in prep a,b).
4.2 Seabird-Wind Farm Interactions in 2012
As in 2010 and 2011, the results show that certain individual Lesser Black-backed Gulls from Orford
Ness visited areas of proposed and consented wind farms at various points during the breeding
season. Information downloaded at the start of the season, from birds tagged in 2010 and 2011 that
returned to breed in 2012, showed that Lesser Black-backed Gulls also interacted with sites of
proposed and existing wind farms on passage. However, the data also revealed a degree of
intraspecific variation in the extent of spatial and temporal overlap between each individual and
wind farms, with some birds foraging almost solely inland. This difference between individuals may
reflect foraging specialisations and constraints due to age, sex or learned preferences, as has been
widely reported in gulls of several species at other breeding colonies (e.g. Annett & Pierotti 1999;
Davis 1975; Delhey et al. 2001; Greig et al. 1985; McCleery & Sibley 1986; Pierotti & Annett 1987;
Skórka et al. 2005).
It is becoming clear that the way in which birds use the marine environment (including offshore wind
farm sites) varies substantially during breeding. During pre-breeding (up to the end of April), birds
used offshore areas but analyses of trips suggested areas closer to the colony were used, with many
birds resting offshore overnight floating on the sea surface close to the colony. However, across all

BTO Research Report No. 639
June 2013 36
birds the time spent offshore on foraging trips was far less than that spent inland. As incubation
progressed during May, the time at the nest increased, but subsequently dropped, presumably as
chicks hatched requiring progressively less attendance, or reflecting changes in dietary requirements
or nest failure. Thereafter, the time spent in both inland and offshore habitats increased. Only after
late May (mostly after 25/05/12 were spatio-temporal overlaps recorded more extensively with
offshore wind farm sites reaching mean spatial overlap of up to 14% (across birds), but less than 5%
of the total time budget (19/06 – 24/06). Consequently, taking a snapshot of behaviour during May
would have revealed a very different extent of wind farm interaction than that in June. These results
serve to highlight the importance of seasonal investigations when assessing the extent of seabird-
wind farm interactions.
4.3 Effects of Wind Farms on Lesser Black-backed Gulls
The implications of these results for Lesser Black-backed Gulls will become clearer once the final
analyses have been conducted. For instance, while gulls showed clear overlaps with some existing
wind farms, a more refined assessment of precise movements near individual turbines as not yet
been undertaken. Nevertheless, these data indicate that birds from the Orford Ness colony do use or
fly through the areas of existing wind farms. A comprehensive analysis of flight altitude is being
conducted, the study of which will inform the collision risk of both species during the breeding
season and on passage.
The spatial and temporal overlap with both proposed and consented wind farms, coupled with the
known behaviour of gulls in offshore wind farms (recorded passing through constructed wind farms,
perching on structures) provisionally suggests displacement for this species from this colony might
not be substantial. Furthermore, the overall time spent offshore may have decreased over the three
years of study, but this requires further investigation accounting for inter-annual season variation.
Further characterisation of diurnal movements, time spent in flight, time spent flying at night within
wind farm sites, would also be valuable and will be presented as part of the final report.
Efforts were undertaken to define birds’ behaviours in terms of flight and foraging. However, a more
refined assessment would require diving, floating and other movements to be characterised, for
instance using accelerometer measurements (Shamoun-Baranes et al. 2012). This approach would
help to show whether birds are using wind farm area for foraging, for example, suggesting the
importance of these sites to SPA features.
4.4 Concluding Comments
The data presented here build on Thaxter et al. (2011, 2012) and reveal the substantial value of GPS
tagging studies in assessing both connectivity and potential interactions between SPA features and
offshore wind farms.
Although some aims of the project have been fulfilled, inclusion of data from the 2012/13 non-
breeding seasons will build an overall picture of all movements and how these SPA feature species
interact with wind farms within and outside the breeding season. For Great Skuas, we have been
unable to fulfil migration questions originally proposed due to unforeseen poor return rates. While
this is deeply regrettable, the skuas have provided us with some valuable breeding season
information when we reported no effects of the tags on the foraging behaviour of the birds. More
finer-scaled seasonal investigations will be conducted for the final report for Great Skuas in line with
the approach taken for gulls. The final report will also include full analyses of flight height data – the
methodology developed for this is described here – which will provide distribution of altitudes and
investigations of how factors such as weather affect flight altitude, thus fulfilling the aims and
objectives of this project.

BTO Research Report No. 639
June 2013 37
Acknowledgements
This work was funded by the Department of Energy and Climate Change (DECC). Particular thanks go
to Mark Rehfisch (formerly of the BTO) for his help in initiating the work, to John Hartley of Hartley
Anderson for managing the contract and to Emma Cole, Mandy King, Sophie Thomas and James Burt
at DECC. Thanks also to the National Trust, Scottish Natural Heritage and Natural England for
permission to work at the SPAs. We thank Kieran Bell and Anne Savage at the Crown Estate who
provided information on location of wind turbines, and Judy Shamoun-Baranes (University of
Amsterdam) for assistance in the setup of base stations at Orford Ness, Foula, and Hoy, and help
with queries with regard to databases, and equipment. We are very grateful to Mike Marsh, Dave
Crawshaw and Gill Stannard at Landguard Bird Observatory for assistance in capturing and tagging
Lesser Black-backed Gulls at Orford Ness. We thank Mark Bolton and Sarah Davis (RSPB) for
assistance in field work at Orford Ness, and also to Grant Lohoar, Dave Fincham, Dave Cormack,
Duncan Kent and Matt Guilliatt (National Trust) for advice and assistance in erecting the relay masts
on site at Orford Ness. We are very grateful to Bob Furness (McArthur Green Ltd) and Eliza Leat
(University of Glasgow) for tagging and trapping of Great Skuas at Foula and Hoy, Angus Jackson
(ERI) and Emily Coleman (BTO) for arranging the data sharing agreement between ERI and BTO, and
additional field assistants Guillam McIvor and Vikki Smith for fieldwork assistance during 2010.
Thanks also to Chris Booth for providing productivity data for Hoy, Soeren Hoejlund for
development of a solar powered relay for the Hoy base station, Aileen Adam (ERI) for molecular
sexing of skuas at Hoy, Jason McIlvenny, Astrid Harendza, Neil James and Mona Larsen (ERI), and
Andy Knight (RSPB), for help with colony walks and monitoring productivity at Hoy. We also thank
Fran-Dyson Sutton for excellent hospitality and further assistance in monitoring the Foula base
station, Magnus Holburn for assistance in erecting the relay pole at Foula, Sheila Gear for monitoring
the plot of Great Skuas adjacent to our study plot, and Marion at Leraback B&B and Isobel Holburn
for hospitality at Foula. We also thank “Kiwi” Kev Drew (Landcare Research), Jeff Davey (Anglia
Ruskin University), Nadia Thornton (Harrison Clinical Research Ltd), Neil Calbrade, Aonghais Cook,
Nick Moran and Lucy Wright (BTO) for further field assistance during 2010 and 2011.

BTO Research Report No. 639
June 2013 38

BTO Research Report No. 639
June 2013 39
References
Annett, C.A. & Pierotti, R. 1999. Long-term reproductive output in Western Gulls: consequences of
alternate tactics in diet choice. Ecology, 80, 288-297.
Bouten, W., Baaij, E.W., Shamoun-Baranes, J. & Camphuysen, K.C.J. 2012. A flexible GPS tracking
system for studying bird behaviour at multiple scales. Journal of Ornithology doi: 10.1007/s10336-
012-0908-1
Callenge, C. 2006. The package adehabitat for the R software: a tool for the analysis of space and
habitat use by animals. Ecological Modelling 197, 516-519.
Cook, A.S.C.P., Johnston, A., Wright, L.W. & Burton, N.H.K. 2012. A review of flight heights and
avoidance rates of birds in relation to offshore wind farms. Strategic Ornithology Support Services
Project SOSS-02. BTO Research Report 618.
Davis, J.W.F. 1975 Specialization in feeding location by herring gulls. Journal of Animal Ecology 44,
795-804.
DECC 2009. UK Offshore Energy Strategic Environmental Assessment. Future Leasing for Offshore
Wind Farms and Licensing for Offshore Oil & Gas and Gas Storage. Environmental Report,
Department of Energy and Climate Change.
www.offshore-sea.org.uk/consultations/Offshore_Energy_SEA/OES_Environmental_Report.pdf
Delhey, J.K.V., Carrete, M. & Martinez, M.M. 2001. Diet and feeding behaviour of Olrog's Gull Larus
atlanticus in Bahia Blanca, Argentina. Ardea 89, 319-329.
Gilks W.R., Richardson S. and Spiegelhalter D.J. 1996. Markov Chain Monte Carlo in Practice.
Chapman & Hall/CRC.
Greig, S.A., Coulson, J.C. & Monaghan, P. 1985. Feeding strategies of male and female adult herring
gulls (Larus argentatus). Behaviour 94, 41-59.
Hamer, K.C., Humphreys, E.M., Garthe, S., Hennicke, J., Peters, G., Grémillet, D., Phillips, R.A., Harris,
M.P. & Wanless, S. 2007. Annual variation in diets, feeding locations and foraging behaviour of
gannets in the North Sea: flexibility, consistency and constraint. Marine Ecology Progress Series 338,
295-305.
Harrison, P.J. , Hanski, I. & Ovaskainen, O. 2011. Bayesian state-space modeling of metapopulation
dynamics in the Glanville fritillary butterfly. Ecological Monographs 81, 581-598.
King, R. 2012. A review of Bayesian state-space modelling of capture–recapture–recovery data.
Interface Focus 2, 190–204.
Lunn, D., Spiegelhalter, D., Thomas, A. & Best, N. (2009). The BUGS project: Evolution, critique, and
future directions. Statistics in Medicine 28, 3049-3067
McCleery, R.H. & Sibly, R.M. 1986. Feeding specialization and preference in herring gulls. Journal of
Animal Ecology 55, 245-259.
Newman, K.B., Fernández, C., Buckland, S.T. & Thomas, L. 2009. Monte Carlo inference for state-
space models of wild animal populations. Biometrics 65, 572-583.

BTO Research Report No. 639
June 2013 40
Pierotti, R. & Annett, C. 1987. Reproductive consequences of dietary specialization and switching in
an ecological generalist. In: Foraging behavior (Ed. by Kamil, A.C., Krebs, J.R. & Pulliam, H.R.), pp.
417-442. Plenum Press, New York.
Plummer, M. 2003. JAGS: A Program for Analysis of Bayesian Graphical Models Using Gibbs
Sampling. Proceedings of the 3rd International Workshop on Distributed Statistical Computing (DSC
2003), March 20–22, Vienna, Austria. ISSN 1609-395X.
R Development Core Team. 2012. R: A language and environment for statistical computing. R
Foundation for Statistical Computing, Vienna. www.r-project.org
Shamoun-Baranes, J., Bouten, W., Camphuysen, C.J. & Baaj, E. 2011. Riding the tide: intriguing
observations of gulls resting at sea during breeding. Ibis 153, 411-415.
Shamoun-Baranes, J., Bom, R., van Loon, E., Ens, B.J., Oosterbeed, K. & Bouten, W. 2012. From
sensor data to animal behaviour: an oystercatcher example. PLoS ONE 7: e37997.
Skórka, P., Wójcik, J. D. & Martyka, R. 2005. Colonization and population growth of Yellow-legged
Gull Larus cachinnans in southeastern Poland: causes and influence on native species. Ibis 147, 471-
482.
Thaxter, C.B., Daunt, F., Hamer, K.C., Watanuki, Y., Harris, M.P., Grémillet, D., Peters, G. & Wanless,
S. 2009. Sex-specific food provisioning in a monomorphic seabird, the common guillemot Uria aalge:
nest defence, foraging efficiency or parental effort? Journal of Avian Biology 40, 75-84.
Thaxter, C.B., Wanless, S., Daunt, F., Harris, M.P., Benvenuti, S., Watanuki, Y., Grémillet, & Hamer, K.
C. 2010. Influence of wing loading on trade-off between pursuit-diving and flight in common
guillemots and razorbills. Journal of Experimental Biology 213, 1018-1025.
Thaxter, C.B., Ross-Smith, V.H., Clark, N.A., Conway. G.J., Rehfisch, M.M., Bouten, W. & Burton,
N.H.K. 2011. Measuring the interaction between marine features of Special Protection Areas with
offshore wind farm development zones through telemetry: first breeding season report. BTO
Research Report No. 590. Thetford, Norfolk.
Thaxter, C.B., Ross-Smith, V.H., Clark, N.A., Conway. G.J., Wade, H.M., Masden, E.A., Rehfisch, M.M.,
Bouten, W. & Burton, N.H.K. 2012. Measuring the interaction between marine features of Special
Protection Areas with offshore wind farm development zones through telemetry: second year
report. BTO Research Report No. 610. Thetford, Norfolk.
Thaxter, C.B et al. In prep. Effects of harness attachment for avian bio-logging research are species-
specific and depend on temporal-scale. Ibis.
Thaxter, C.B et al. In prep. A comparison of three different harness attachments and their suitability
for use on Lesser Black-backed Gulls. Ringing and Migration.
Wood, S.N., 2006. Generalized Additive Models: An Introduction with R. Chapman & Hall/CRC.
Worton, B.J. 1989. Kernel methods for estimating the utilization distribution in home-range studies.
Ecology 70, 164-168.