Embed Size (px)
Citation preview
East Africa: The 2016 Season

• The first growing season of 2016 (March-May, Long Rains in Kenya, Belg in Ethiopia) brought good rainfallacross Ethiopia, Eritrea and Somaliland. This was a welcome reprieve for many regions hit hard by droughtin 2015. In Somalia and coastal regions of Kenya, however, poor rainfall has impacted vegetation cover andcrop production.
• The early stages of the main seasons in South Sudan, Sudan, Ethiopia and Eritrea benefited from wetterthan average conditions, resulting in above average vegetation cover across the region and early start ofthe growing season. Northern pastoral areas of Sudan fared especially well.
• Drier than average conditions were observed across central and SW Ethiopia (Oromia and SNNPR) and intoSE South Sudan between July to mid September. Uganda was also affected resulting in poor first harvestsand significant delays in the start of the second season.
• Forecasts for the October-December period, indicate lower than average rainfall for Kenya and Somalia,raising the possibility of two consecutive poor seasons. The outlook is less certain for Uganda and SE SouthSudan where drier than average conditions now will further exacerbate the dryness observed during July-September.
HIGHLIGHTSEa
st A
fric
a: T
he
20
16
Se
aso
n
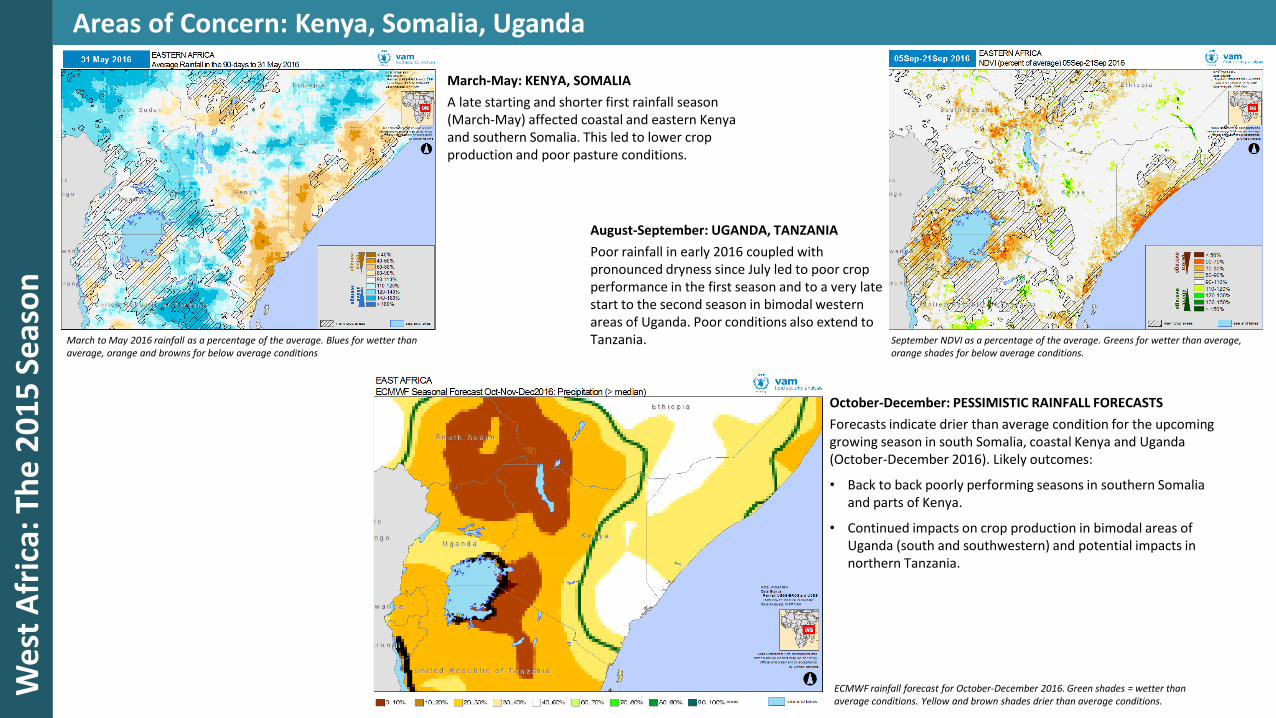
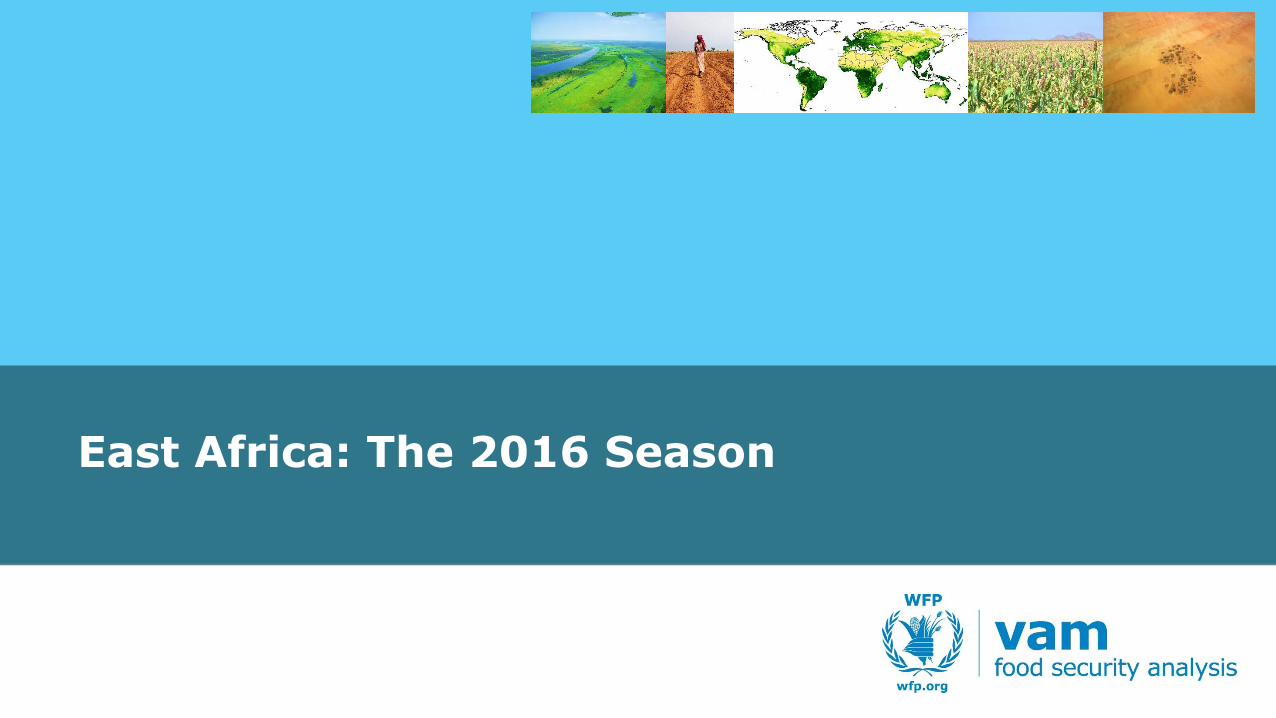
Areas of Concern: Kenya, Somalia, UgandaW
est
Afr
ica:
Th
e 2
01
5 S
eas
on
March-May: KENYA, SOMALIA
A late starting and shorter first rainfall season (March-May) affected coastal and eastern Kenya and southern Somalia. This led to lower crop production and poor pasture conditions.
March to May 2016 rainfall as a percentage of the average. Blues for wetter than average, orange and browns for below average conditions
October-December: PESSIMISTIC RAINFALL FORECASTS
Forecasts indicate drier than average condition for the upcoming growing season in south Somalia, coastal Kenya and Uganda (October-December 2016). Likely outcomes:
• Back to back poorly performing seasons in southern Somalia and parts of Kenya.
• Continued impacts on crop production in bimodal areas of Uganda (south and southwestern) and potential impacts in northern Tanzania.
August-September: UGANDA, TANZANIA
Poor rainfall in early 2016 coupled with pronounced dryness since July led to poor crop performance in the first season and to a very late start to the second season in bimodal western areas of Uganda. Poor conditions also extend to Tanzania. September NDVI as a percentage of the average. Greens for wetter than average,
orange shades for below average conditions.
ECMWF rainfall forecast for October-December 2016. Green shades = wetter than average conditions. Yellow and brown shades drier than average conditions.

The 2016 Season(s) So Far…
East
Afr
ica:
Th
e 2
01
6 S
eas
on
Earlier Developments in 2016
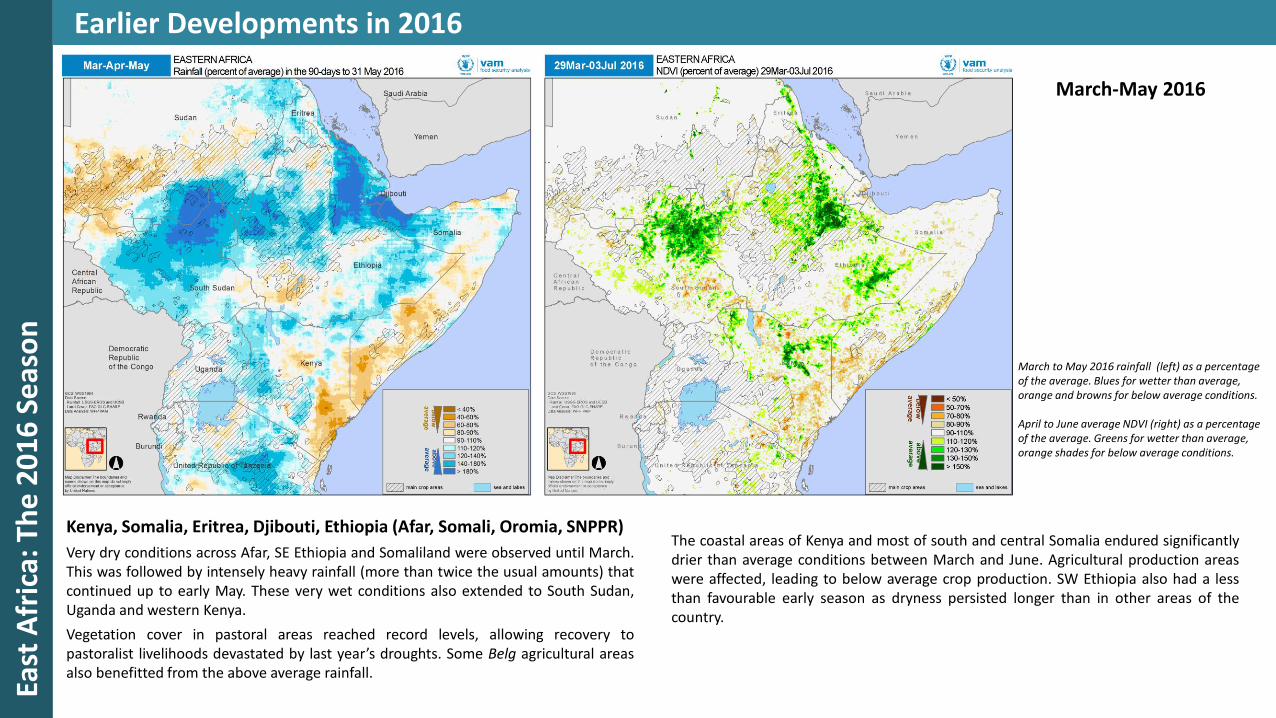
March to May 2016 rainfall (left) as a percentage of the average. Blues for wetter than average, orange and browns for below average conditions.
April to June average NDVI (right) as a percentage of the average. Greens for wetter than average, orange shades for below average conditions.
The coastal areas of Kenya and most of south and central Somalia endured significantlydrier than average conditions between March and June. Agricultural production areaswere affected, leading to below average crop production. SW Ethiopia also had a lessthan favourable early season as dryness persisted longer than in other areas of thecountry.
March-May 2016
Kenya, Somalia, Eritrea, Djibouti, Ethiopia (Afar, Somali, Oromia, SNPPR)
Very dry conditions across Afar, SE Ethiopia and Somaliland were observed until March.This was followed by intensely heavy rainfall (more than twice the usual amounts) thatcontinued up to early May. These very wet conditions also extended to South Sudan,Uganda and western Kenya.
Vegetation cover in pastoral areas reached record levels, allowing recovery topastoralist livelihoods devastated by last year’s droughts. Some Belg agricultural areasalso benefitted from the above average rainfall.
East
Afr
ica:
Th
e 2
01
6 S
eas
on
Seasonal Profiles: March to May Highlights
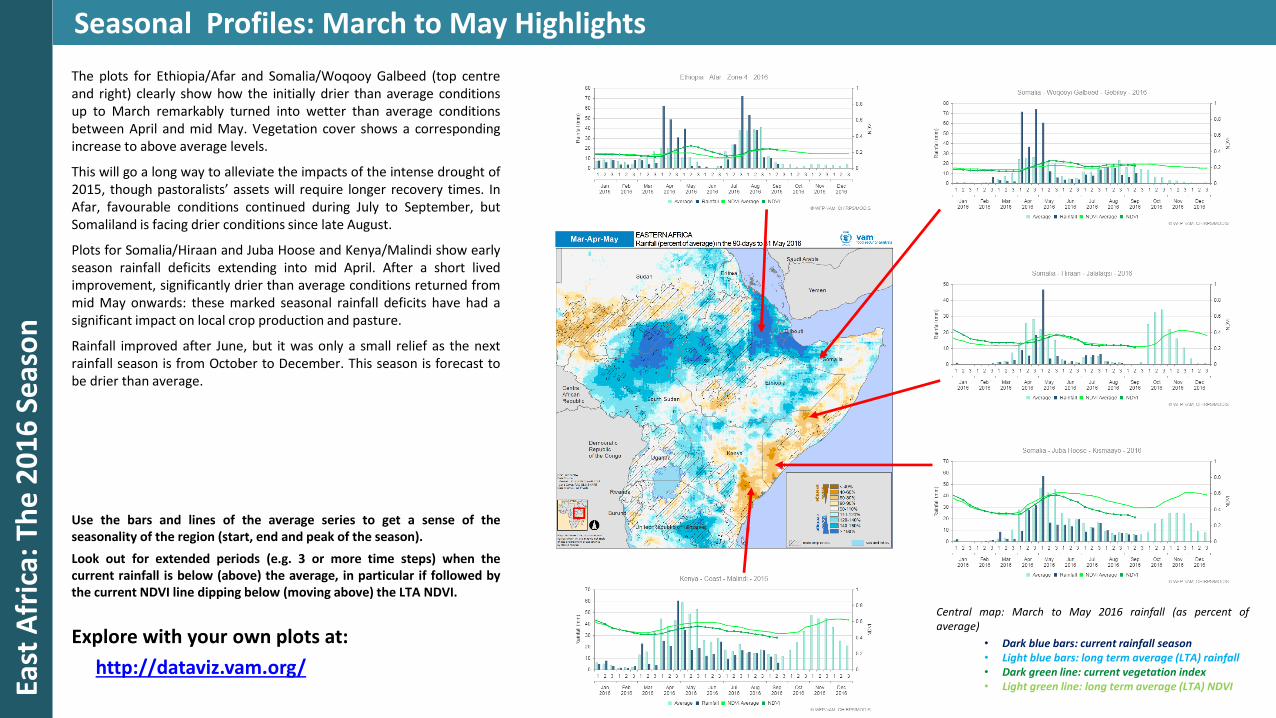
The plots for Ethiopia/Afar and Somalia/Woqooy Galbeed (top centreand right) clearly show how the initially drier than average conditionsup to March remarkably turned into wetter than average conditionsbetween April and mid May. Vegetation cover shows a correspondingincrease to above average levels.
This will go a long way to alleviate the impacts of the intense drought of2015, though pastoralists’ assets will require longer recovery times. InAfar, favourable conditions continued during July to September, butSomaliland is facing drier conditions since late August.
Plots for Somalia/Hiraan and Juba Hoose and Kenya/Malindi show earlyseason rainfall deficits extending into mid April. After a short livedimprovement, significantly drier than average conditions returned frommid May onwards: these marked seasonal rainfall deficits have had asignificant impact on local crop production and pasture.
Rainfall improved after June, but it was only a small relief as the nextrainfall season is from October to December. This season is forecast tobe drier than average.
Explore with your own plots at:
http://dataviz.vam.org/
Use the bars and lines of the average series to get a sense of theseasonality of the region (start, end and peak of the season).
Look out for extended periods (e.g. 3 or more time steps) when thecurrent rainfall is below (above) the average, in particular if followed bythe current NDVI line dipping below (moving above) the LTA NDVI.
Central map: March to May 2016 rainfall (as percent ofaverage)
• Dark blue bars: current rainfall season• Light blue bars: long term average (LTA) rainfall• Dark green line: current vegetation index• Light green line: long term average (LTA) NDVI
East
Afr
ica:
Th
e 2
01
6 S
eas
on
Recent Developments in 2016
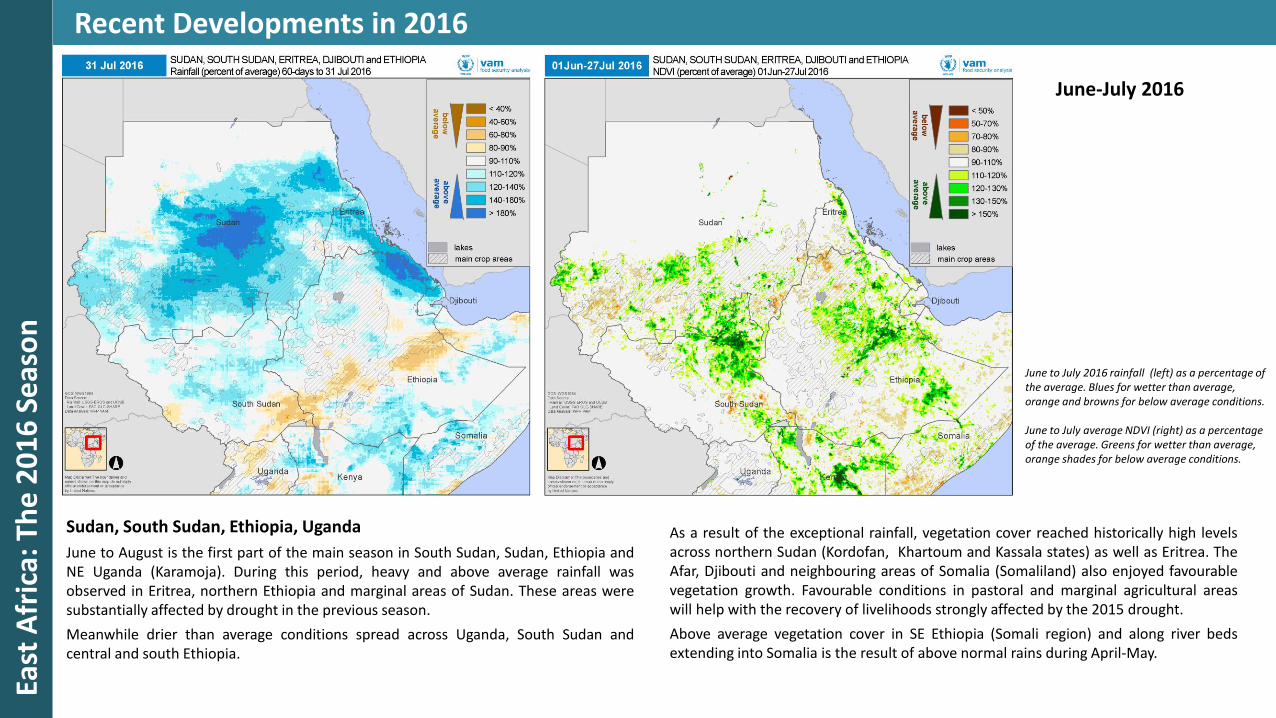
June to July 2016 rainfall (left) as a percentage of the average. Blues for wetter than average, orange and browns for below average conditions.
June to July average NDVI (right) as a percentage of the average. Greens for wetter than average, orange shades for below average conditions.
As a result of the exceptional rainfall, vegetation cover reached historically high levelsacross northern Sudan (Kordofan, Khartoum and Kassala states) as well as Eritrea. TheAfar, Djibouti and neighbouring areas of Somalia (Somaliland) also enjoyed favourablevegetation growth. Favourable conditions in pastoral and marginal agricultural areaswill help with the recovery of livelihoods strongly affected by the 2015 drought.
Above average vegetation cover in SE Ethiopia (Somali region) and along river bedsextending into Somalia is the result of above normal rains during April-May.
Sudan, South Sudan, Ethiopia, Uganda
June to August is the first part of the main season in South Sudan, Sudan, Ethiopia andNE Uganda (Karamoja). During this period, heavy and above average rainfall wasobserved in Eritrea, northern Ethiopia and marginal areas of Sudan. These areas weresubstantially affected by drought in the previous season.
Meanwhile drier than average conditions spread across Uganda, South Sudan andcentral and south Ethiopia.
June-July 2016
Current Status 2016
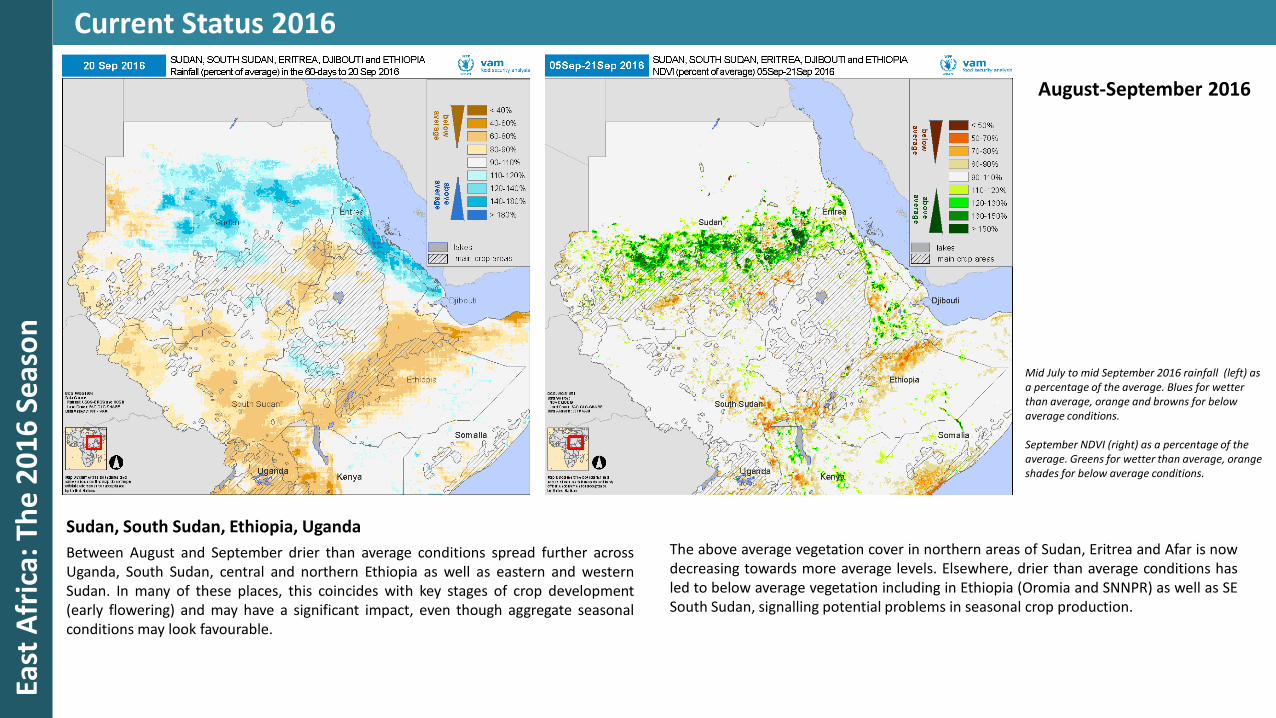
Mid July to mid September 2016 rainfall (left) as a percentage of the average. Blues for wetter than average, orange and browns for below average conditions.
September NDVI (right) as a percentage of the average. Greens for wetter than average, orange shades for below average conditions.
The above average vegetation cover in northern areas of Sudan, Eritrea and Afar is nowdecreasing towards more average levels. Elsewhere, drier than average conditions hasled to below average vegetation including in Ethiopia (Oromia and SNNPR) as well as SESouth Sudan, signalling potential problems in seasonal crop production.
August-September 2016
Sudan, South Sudan, Ethiopia, Uganda
Between August and September drier than average conditions spread further acrossUganda, South Sudan, central and northern Ethiopia as well as eastern and westernSudan. In many of these places, this coincides with key stages of crop development(early flowering) and may have a significant impact, even though aggregate seasonalconditions may look favourable.
East
Afr
ica:
Th
e 2
01
6 S
eas
on
East
Afr
ica:
Th
e 2
01
6 S
eas
on
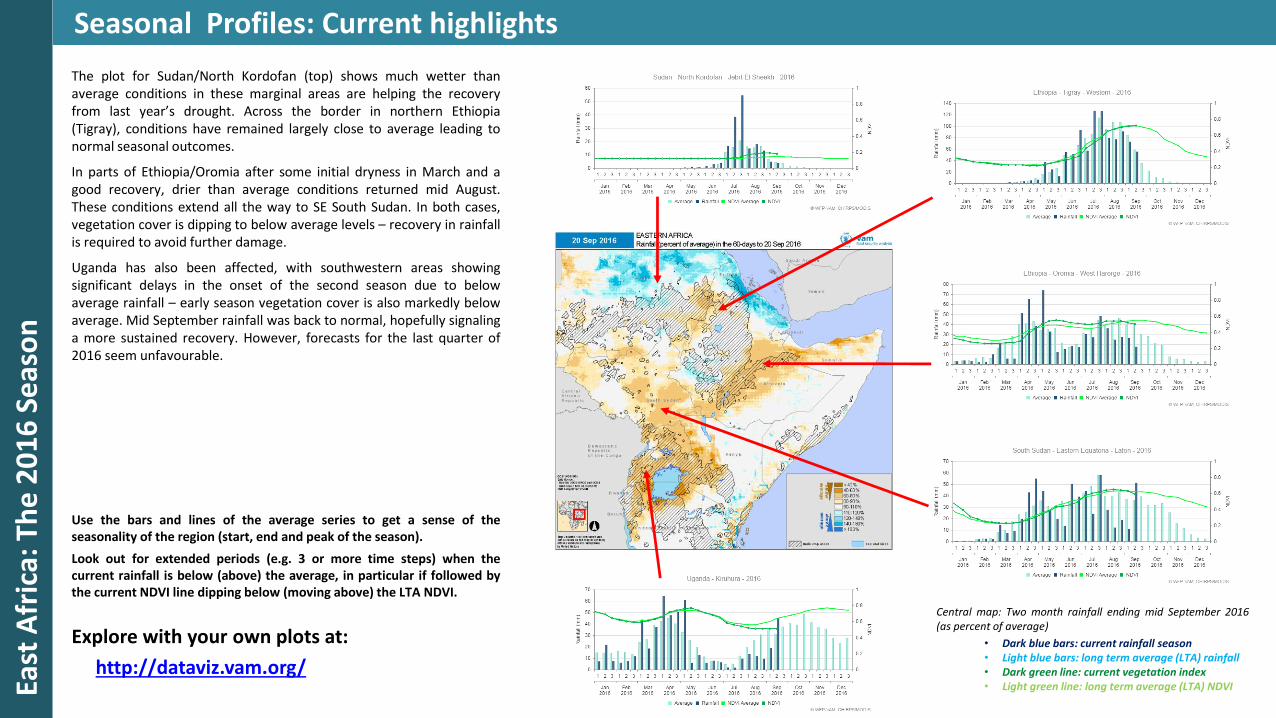
Seasonal Profiles: Current highlights
The plot for Sudan/North Kordofan (top) shows much wetter thanaverage conditions in these marginal areas are helping the recoveryfrom last year’s drought. Across the border in northern Ethiopia(Tigray), conditions have remained largely close to average leading tonormal seasonal outcomes.
In parts of Ethiopia/Oromia after some initial dryness in March and agood recovery, drier than average conditions returned mid August.These conditions extend all the way to SE South Sudan. In both cases,vegetation cover is dipping to below average levels – recovery in rainfallis required to avoid further damage.
Uganda has also been affected, with southwestern areas showingsignificant delays in the onset of the second season due to belowaverage rainfall – early season vegetation cover is also markedly belowaverage. Mid September rainfall was back to normal, hopefully signalinga more sustained recovery. However, forecasts for the last quarter of2016 seem unfavourable.
Explore with your own plots at:
http://dataviz.vam.org/
Use the bars and lines of the average series to get a sense of theseasonality of the region (start, end and peak of the season).
Look out for extended periods (e.g. 3 or more time steps) when thecurrent rainfall is below (above) the average, in particular if followed bythe current NDVI line dipping below (moving above) the LTA NDVI.
Central map: Two month rainfall ending mid September 2016(as percent of average)
• Dark blue bars: current rainfall season• Light blue bars: long term average (LTA) rainfall• Dark green line: current vegetation index• Light green line: long term average (LTA) NDVI

Short and Medium Term Perspectives
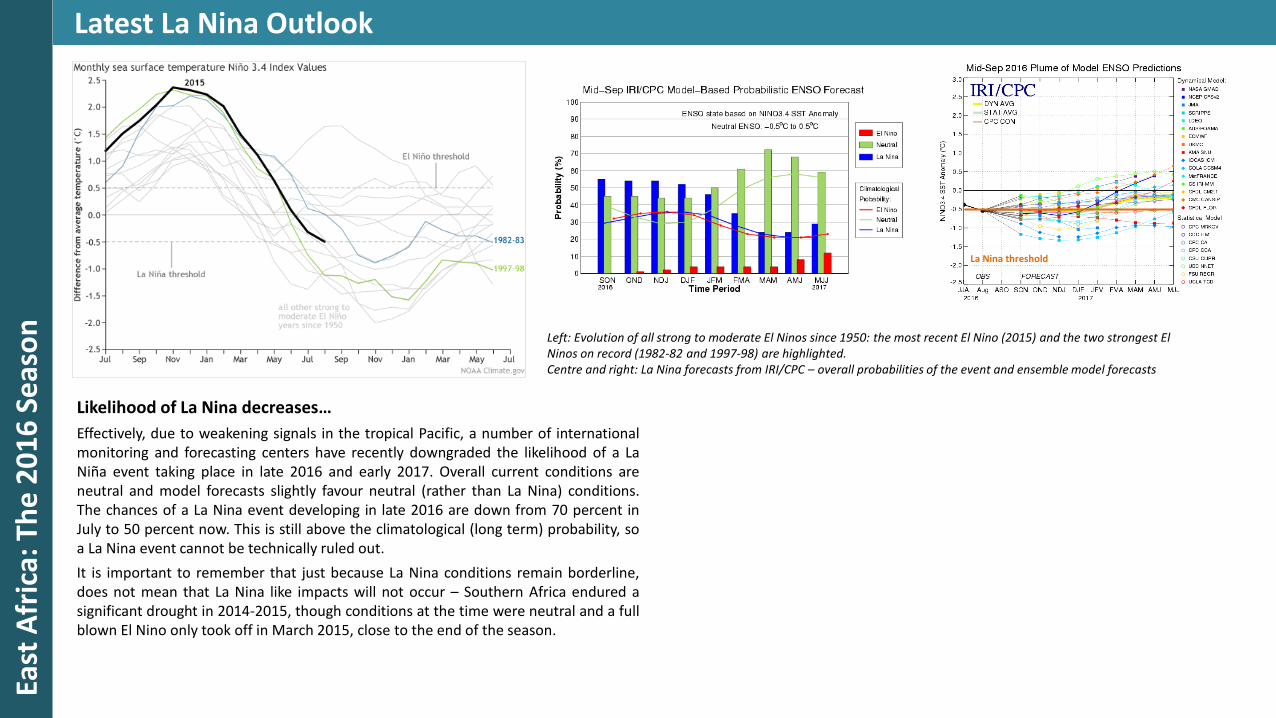
Latest La Nina Outlook
Left: Evolution of all strong to moderate El Ninos since 1950: the most recent El Nino (2015) and the two strongest El Ninos on record (1982-82 and 1997-98) are highlighted.Centre and right: La Nina forecasts from IRI/CPC – overall probabilities of the event and ensemble model forecasts
Likelihood of La Nina decreases…
Effectively, due to weakening signals in the tropical Pacific, a number of internationalmonitoring and forecasting centers have recently downgraded the likelihood of a LaNiña event taking place in late 2016 and early 2017. Overall current conditions areneutral and model forecasts slightly favour neutral (rather than La Nina) conditions.The chances of a La Nina event developing in late 2016 are down from 70 percent inJuly to 50 percent now. This is still above the climatological (long term) probability, soa La Nina event cannot be technically ruled out.
It is important to remember that just because La Nina conditions remain borderline,does not mean that La Nina like impacts will not occur – Southern Africa endured asignificant drought in 2014-2015, though conditions at the time were neutral and a fullblown El Nino only took off in March 2015, close to the end of the season.
La Nina threshold
East
Afr
ica:
Th
e 2
01
6 S
eas
on
East
Afr
ica:
Th
e 2
01
6 S
eas
on
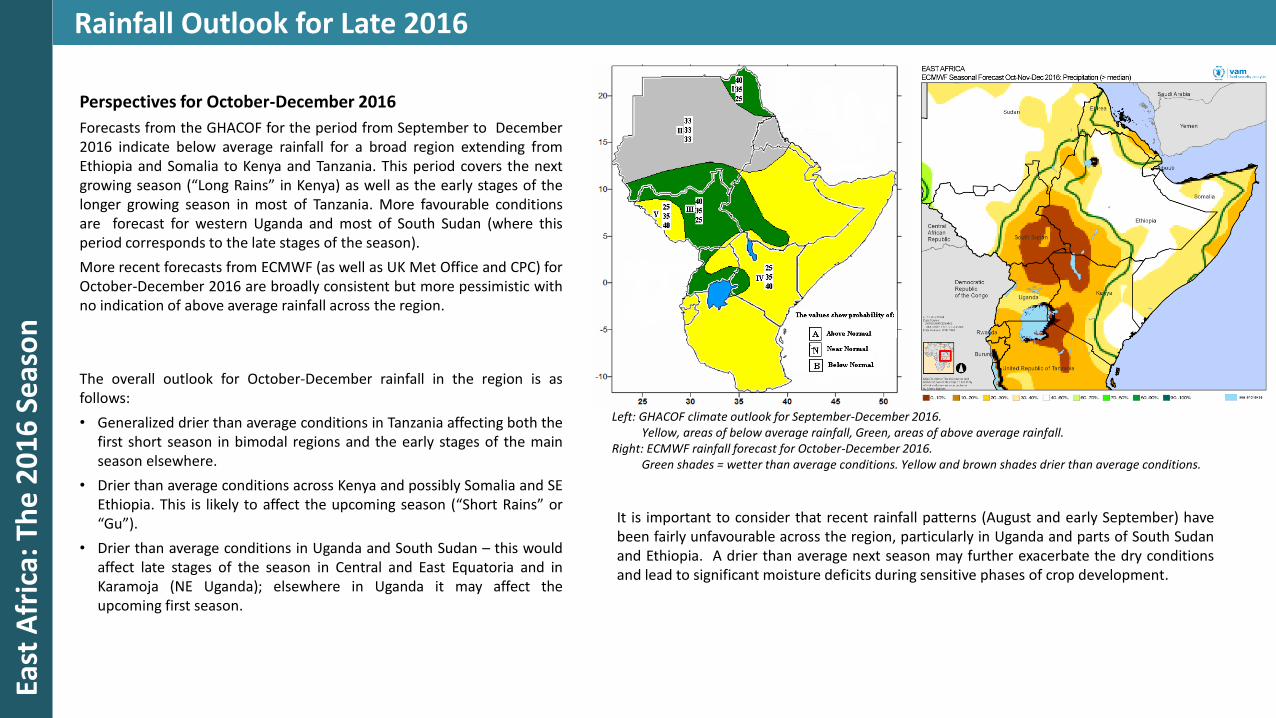
Rainfall Outlook for Late 2016
Left: GHACOF climate outlook for September-December 2016. Yellow, areas of below average rainfall, Green, areas of above average rainfall.
Right: ECMWF rainfall forecast for October-December 2016. Green shades = wetter than average conditions. Yellow and brown shades drier than average conditions.
Perspectives for October-December 2016
Forecasts from the GHACOF for the period from September to December2016 indicate below average rainfall for a broad region extending fromEthiopia and Somalia to Kenya and Tanzania. This period covers the nextgrowing season (“Long Rains” in Kenya) as well as the early stages of thelonger growing season in most of Tanzania. More favourable conditionsare forecast for western Uganda and most of South Sudan (where thisperiod corresponds to the late stages of the season).
More recent forecasts from ECMWF (as well as UK Met Office and CPC) forOctober-December 2016 are broadly consistent but more pessimistic withno indication of above average rainfall across the region.
The overall outlook for October-December rainfall in the region is asfollows:
• Generalized drier than average conditions in Tanzania affecting both thefirst short season in bimodal regions and the early stages of the mainseason elsewhere.
• Drier than average conditions across Kenya and possibly Somalia and SEEthiopia. This is likely to affect the upcoming season (“Short Rains” or“Gu”).
• Drier than average conditions in Uganda and South Sudan – this wouldaffect late stages of the season in Central and East Equatoria and inKaramoja (NE Uganda); elsewhere in Uganda it may affect theupcoming first season.
It is important to consider that recent rainfall patterns (August and early September) havebeen fairly unfavourable across the region, particularly in Uganda and parts of South Sudanand Ethiopia. A drier than average next season may further exacerbate the dry conditionsand lead to significant moisture deficits during sensitive phases of crop development.
The Season: Month by Month

March 2016Ea
st A
fric
a: T
he
20
16
Se
aso
n
March 2016 rainfall as a percentage of the 20-year average (left).
Brown shades for drier than average, blue shades for wetter than average conditions.
Early April 2016 vegetation index as a percentage of the 12-year average (right).
Orange shades for below-average, green shades for above-average vegetation.
Hashed pattern indicates main agricultural areas.
March is the first month of the growing seasons that extend from Kenya (“Long Rains”) to Somalia (“Gu”) and parts of Ethiopia (Afar, Somali and“Belg” season areas).
March was generally drier than average across the region, in many areas of Ethiopia continuing the patterns that predominated throughoutmost of 2015 as a result of one of the most intense El Nino on record. In contrast, western areas of South Sudan enjoyed some early rains, but oflittle significance.
Vegetation cover patterns were still reflecting the impact of the previous year’s poor development, leading to a longer delay in its response toearly rainfall.

April 2016Ea
st A
fric
a: T
he
20
16
Se
aso
n
April 2016 rainfall as a percentage of the 20-year average (left).
Brown shades for drier than average, blue shades for wetter than average conditions.
Early May 2016 vegetation index as a percentage of the 12-year average (right).
Orange shades for below-average, green shades for above-average vegetation.
Hashed pattern indicates main agricultural areas.
Conditions during April were in stark contrast with those in March, as most of the region enjoyed much wetter than average conditions – inparticular the Afar region and neighbouring areas of Somaliland, registered close to three times the long term average rainfall, bringing muchneeded improvements to water and pasture availability in the region after 2015’s devastating drought.
The only exception was eastern coastal Kenya and most of southern and central Somalia, where significant rainfall deficits accumulated duringthis period which provides the bulk of the rainfall during this season.
Vegetation cover responded strongly with some areas reaching historically high levels – the exception was Kenya and Somalia where drier thanaverage conditions led to lower than average vegetation cover.

May 2016Ea
st A
fric
a: T
he
20
16
Se
aso
n
May 2016 rainfall as a percentage of the 20-year average (left).
Brown shades for drier than average, blue shades for wetter than average conditions.
Early June 2016 vegetation index as a percentage of the 12-year average (right).
Orange shades for below-average, green shades for above-average vegetation.
Hashed pattern indicates main agricultural areas.
May was characterized by above average rainfall across most of the region, in particular with heavy early rainfall across NE South Sudan andcentral and northern Ethiopia. Good rainfall continued across Afar, Somaliland and SE Ethiopia. In contrast, drier than average conditionsdeveloped in southern Oromia and SNNPR in Ethiopia and continued in coastal Kenya and southern Somalia.
The continuing heavy rainfall in western South Sudan and the northern half of Ethiopia has led to vegetation cover reaching record high levelsfor this time of the year. Similar though more localized patterns can also be observed in northern Kenya and SE Ethiopia (Somali region).
June 2016Ea
st A
fric
a: T
he
20
16
Se
aso
n
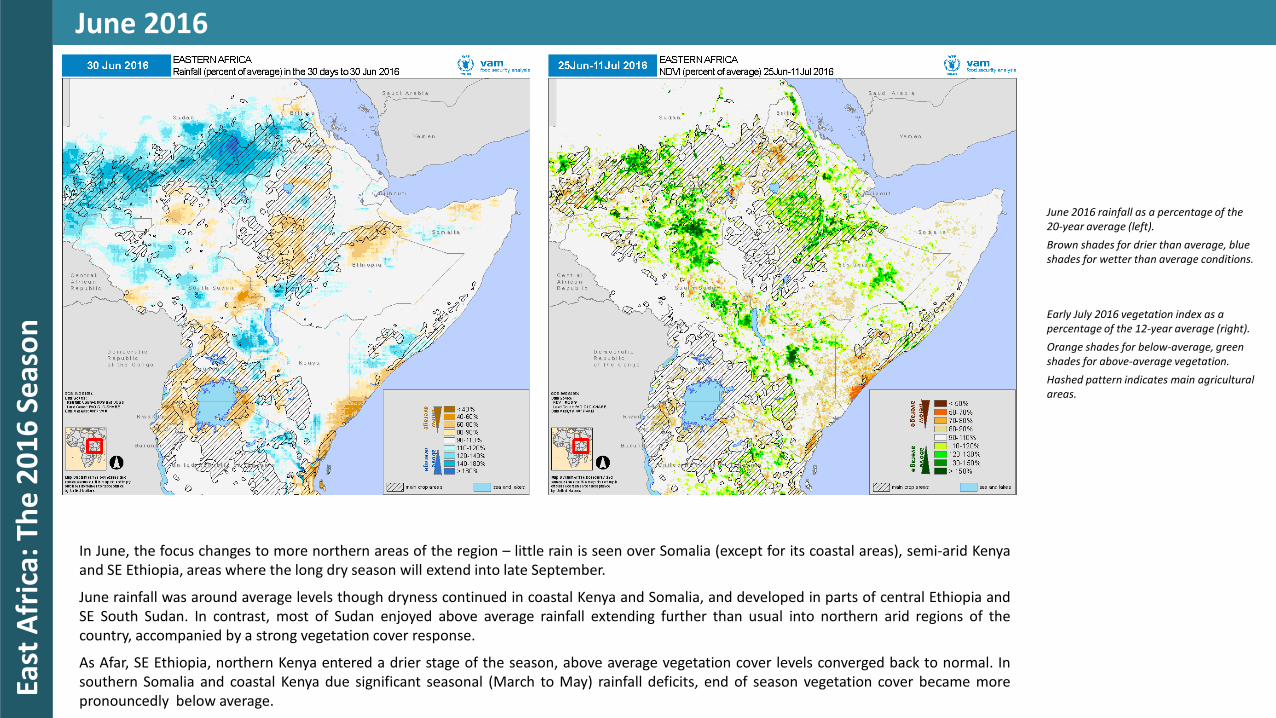
June 2016 rainfall as a percentage of the 20-year average (left).
Brown shades for drier than average, blue shades for wetter than average conditions.
Early July 2016 vegetation index as a percentage of the 12-year average (right).
Orange shades for below-average, green shades for above-average vegetation.
Hashed pattern indicates main agricultural areas.
In June, the focus changes to more northern areas of the region – little rain is seen over Somalia (except for its coastal areas), semi-arid Kenyaand SE Ethiopia, areas where the long dry season will extend into late September.
June rainfall was around average levels though dryness continued in coastal Kenya and Somalia, and developed in parts of central Ethiopia andSE South Sudan. In contrast, most of Sudan enjoyed above average rainfall extending further than usual into northern arid regions of thecountry, accompanied by a strong vegetation cover response.
As Afar, SE Ethiopia, northern Kenya entered a drier stage of the season, above average vegetation cover levels converged back to normal. Insouthern Somalia and coastal Kenya due significant seasonal (March to May) rainfall deficits, end of season vegetation cover became morepronouncedly below average.

July 2016Ea
st A
fric
a: T
he
20
16
Se
aso
n
July 2016 rainfall as a percentage of the 20-year average (left).
Brown shades for drier than average, blue shades for wetter than average conditions.
Early August 2016 vegetation index as a percentage of the 12-year average (right).
Orange shades for below-average, green shades for above-average vegetation.
Hashed pattern indicates main agricultural areas.
In July, rainfall systems made remarkable northwards progress, bringing much above average rainfall to Sudan, from its central regions all theway to its northern arid areas. Eritrea also benefitted from wetter than average conditions. Vegetation cover in central north Sudan respondedvery strongly reaching exceptional levels. More irregular rainfall and localized below average vegetation cover characterized eastern Sudanareas and parts of the Darfur region.
In contrast, drier than average conditions developed further along a belt extending from SE South Sudan across south-central Ethiopia (SNNPRand Oromia). No impacts are yet felt on vegetation cover.
August 2016Ea
st A
fric
a: T
he
20
16
Se
aso
n
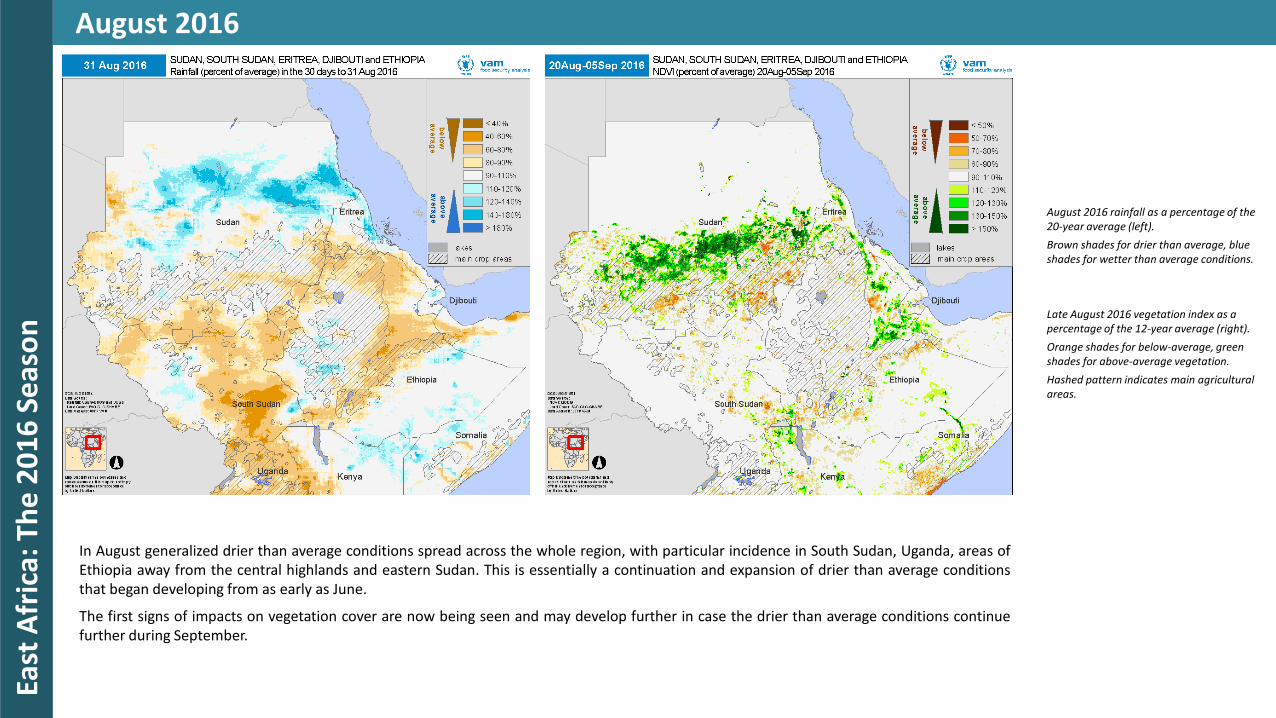
August 2016 rainfall as a percentage of the 20-year average (left).
Brown shades for drier than average, blue shades for wetter than average conditions.
Late August 2016 vegetation index as a percentage of the 12-year average (right).
Orange shades for below-average, green shades for above-average vegetation.
Hashed pattern indicates main agricultural areas.
In August generalized drier than average conditions spread across the whole region, with particular incidence in South Sudan, Uganda, areas ofEthiopia away from the central highlands and eastern Sudan. This is essentially a continuation and expansion of drier than average conditionsthat began developing from as early as June.
The first signs of impacts on vegetation cover are now being seen and may develop further in case the drier than average conditions continuefurther during September.
Data Sources:Rainfall: CHIRPS, Climate Hazards Group, UCSB
Vegetation: MODIS NDVI, EOSDIS-NASA
Land Cover: FAO GLC-Share
Processing:VAM software components, ArcGIS
For more information, please contact:
Rogerio Bonifacio
[email protected]+39 06 6513 3917