Embed Size (px)
Citation preview

1
East African Taxation Project:
Rwanda Country Case Study
Institute of Policy Analysis and Research-Rwanda
June 2011

2
East African Taxation Project: Rwanda Country Case Study
Pamela Abbott Ac SS
IPAR-Rwanda Team
Pamela Abbott Project Director
Dixon Malinda Peer Review
Serge Masana Team Leader and Peer Review
Florence Batoni Team Leader
Roger Mugisha Team Leader
Paul Kayira Team Leader
Marklin Rucogoza Research Assistant
Mansur Kakimba Research Assistant
Jackson Ruhigula Research Assistant
Suzan Mutavu Research Assistant
Adelite Murindangwe Research Assistant

3
Acknowledgement
We would like to thank the employees of government ministries, other government agencies, official
development partners, large inward investors and others who agreed to be interviewed for the project
(see Appendix 1). We would especially like to thank the Rwanda Revenue Authority who calculated
the amount of tax foregone due to tax incentives for us and Rwanda Development Board who
provided us with detailed information on registered domestic and foreign investors. Staff at both
institutions responded willingly and with speed to our frequent requests for additional information and
clarification.
We would also like to thank the three anonymous referees who provided us with helpful and
insightful comments on an earlier drat of this Report. Undoubtedly their comments have enabled us to
improve the Report.
We alone remain responsible for the content of the report. No omissions or errors should be attributed
to anyone who provided information for the project. The opinions expressed in the report are ours and
should not be attributed to the funding agencies who may not necessarily share them. Although all
reasonable care has been taken in compiling information on tax rates and tax exemptions and
incentives, it should not be taken to be authorative.
This study was financed by the Tax Justice Network–Africa and Action Aid International.

4
Contents Acknowledgement .................................................................................................................................. 3
Executive Summary ................................................................................................................................ 6
Acronyms ................................................................................................................................................ 8
1. Introduction ..................................................................................................................................... 9
2. Methodology ................................................................................................................................. 11
3. The Regional Context ................................................................................................................... 12
4. Country Context and Government Policy ..................................................................................... 14
4.1. Country Context .................................................................................................................... 14
4.2. Government Policy ............................................................................................................... 15
5. Taxation Policy ............................................................................................................................. 18
5.1. Introduction ........................................................................................................................... 18
5.2. General Structure of the Tax System and the Composition of Tax Revenue ....................... 18
5.2.1. Value Added Tax .......................................................................................................... 19
5.2.2. Excise Duty ................................................................................................................... 19
5.2.3. Income and Profit Taxation ........................................................................................... 19
5.2.4. Taxation Rates............................................................................................................... 20
5.2.5. Local Taxes ................................................................................................................... 20
5.3. Tax Exemptions in Rwanda .................................................................................................. 20
5.3.1. The Country’s Objectives ............................................................................................. 20
5.3.2. Public Debate/Studies to Inform Tax Incentives .......................................................... 21
5.3.3. Tax Incentives, Concessions and Exemptions in Rwanda ............................................ 22
5.3.4. Guidelines used to Determine Tax Incentives for Investors ......................................... 24
5.3.5. Targeting of Incentives and Eligibility Criteria ............................................................ 24
5.3.6. The legal Instruments and Tax Policies Providing Incentives for Investors ................. 26
6. Tax Foregone Due to Tax Incentives ............................................................................................ 28
6.1. Tax Foregone ........................................................................................................................ 28
6.2. Systems Put in Place for Monitoring Compliance ................................................................ 29
6.3. EAC Impact .......................................................................................................................... 29
7. Evaluating the Tax Incentive Policy ............................................................................................. 30
7.1. The Extent to Which Tax Incentives Attracted Domestic and Foreign Investment .............. 30
7.2. Types of Firms and Investment Attracted ............................................................................. 30
7.3. Are Tax Incentives and Exemptions Working? .................................................................... 32
8. Conclusions and Recommendations ............................................................................................. 38

5
References ............................................................................................................................................. 40
Appendices ............................................................................................................................................ 46
Appendix 1 Institutions and Individuals Interviewed ....................................................................... 47
Appendix 2 Additional Tables .......................................................................................................... 48
Figure 1: GDP Per Capita 1999-2010 ................................................................................................... 14
Figure 2: Gross Domestic Product by Activity at Constant 2006 Prices .............................................. 15
Figure 3: Investment by Registered Investors 2000-2010 in RWF ....................................................... 30
Figure 4: Number of Investment Projects Registered by RDB 2000-2010 ........................................... 30
Figure 5: Investment Projects by Sector Registered Foreign and Domestic Investors 2000-2010 ....... 32
Figure 6: New Business Registration and Investment Certificates Issued for New Start-ups – FDI and
Domestic Investment ............................................................................................................................ 33
Figure 7: Fiscal Revenue (Including TCCs) 1998-2010 in Billions RWF ............................................ 34
Figure 8: Number of Jobs Created by Registered Investors 2000-2010 ............................................... 35
Figure 9: Merchandised Trade and Trade in Services as Per Cent GDP 2000-2009 ............................ 35
Figure 10: Net Barter Terms of Trade Index 2000-2009 (2000=100) .................................................. 36
Figure 11: Growth in Imports in US$ Million ...................................................................................... 36
Table 1: Tax Collected 2009 in Billion RWF ....................................................................................... 18
Table 2: Excise Duty ............................................................................................................................. 19
Table 3: Taxation Rates ........................................................................................................................ 20
Table 4: General Tax Incentives, Concessions and Exemptions .......................................................... 23
Table 5: Legal and Regulatory Framework for Promoting and Incentivising Investment ................... 24
Table 6: Tax Incentives for Holders of an Exemption Certificate ........................................................ 26
Table 7: Tax Foregone Due to Tax Incentives 2008 and 2009 ............................................................. 28
Table 8: Leading Foreign Registered Direct Investors in Rwanda 2006-10 (10 Billion RWF+) ........ 31
Table 9: Countries of Domicile of Registered FDI 2006-10 ................................................................. 31
Table 10: Leading Registered Domestic Investors in Rwanda 2006-10 (10 Billion RWF+) .............. 31
Table 11: Rwanda Ranking UNCTAD FDI Performance Index and Potential Index 2000-2009 ........ 33
Table 12: Growth of Registered Taxpayers .......................................................................................... 34
Table A2.1: Location F actors Ranked by Importance for Investing in Sub-Saharan Africa ............... 48
Table A2.2: Summary of Taxes in the EAC ......................................................................................... 50
Table A2.3: Registered Investors RDB, Foreign and Domestic, 2000–2010 ....................................... 52
Table A2.4: Registered Investors RDB, Projects by Sector, FDI and Domestic 2000-2010 ................ 54

6
Executive Summary
Taxation is essential for sustainable development; it supports the basic function of a sustainable state
and sets the context for economic growth. It is also essential for responsive government. Yet Rwanda
foregoes a significant (and unknown) amount of tax year each year amounting to what are in effect
hidden expenditures. Rwanda is the most generous of the EAC countries in providing tax incentives
for FDI and domestic investment, foregoing about a quarter of its potential revenue each year in tax
incentives from businesses alone, 14 per cent of its potential budget. The revenue foregone would be
sufficient to more than double spending on health or nearly double that on education.
Tax exemptions and concessions given to business in Rwanda are seen as an integral element of
government policies for developing an economy led by the private sector, part of a package of policy
measures to attract local and foreign direct investment, but the amount ‘spent’ is not considered as
part of the budget expenditure. There has been no systematic monitoring and evaluation of the extent
to which they are working and the government has not systematically discussed the recommendations
of external experts recommending that they be reviewed.
The main purpose of this report is to raise the issue of tax incentives and exemptions. Are they too
generous for a country like Rwanda that is struggling to raise money to fund its development strategy?
Are they targeted at the right groups? Are they achieving the government’s objectives for them?
Would the money be better spent on other policy priorities like education or health? Why are the
amounts foregone not made publically available? Why is there no monitoring and evaluation of their
effectiveness and why has there been no cost benefit analysis of tax incentives for attract investment?
Should the amount foregone be considered as part of the Government’s budget so that it becomes
transparent expenditure?
As a member of the East African Community, the government is committed to removing or at least
harmonising ‘harmful taxes’. The expert review of taxes undertaken for the EAC concluded that there
was a need to review all tax exemptions and concessions in member states, to harmonise them and to
remove a number. There was a danger, the report warned, of a ‘race to the bottom’.
Rwanda has in place a complex system of tax incentives and exemptions and there is evidence of a
significant increase in private sector investment following the introduction of the revised tax code in
2005. This has resulted in the creation of new jobs. Exports have increased and there is some evidence
of a beginning of export diversification into areas prioritised by the government as well as an increase
in revenues from tourism. However, the government remains dependent on ODA for about half its
budget.
It is difficult to evaluate the effectiveness of tax incentives and exemptions, especially those aimed at
attracting investment, because of a number of confounding factors making it difficult to do a cost-
benefit analysis. Rwanda has been investing in: ensuring the rule of law and the absence of systematic
corruption; improving the ‘soft’ business infrastructure; the physical infrastructure; and the
availability of skilled workers. All of these are said to have more influence on business investment
decisions especially foreign investors than the availability of tax incentives and exemptions. The latter
are, it is argued, at best a second-order consideration. It is not possible to disentangle the impact of
these from tax incentives and exemptions.

7
Exempting a range of essential goods and services from VAT (a regressive tax) benefits everyone and
especially the poor. The exemption of agricultural inputs from VAT is also of benefit to a large
percentage of the Rwandan population, and by keeping prices lower than they would otherwise be,
supports the government’s efforts to get farmers to use more agricultural inputs to improve production
and reduce poverty. Tax exempt status for registered NGOs and religious organisations is a way for
the government to support from public funds social goods that are of benefit to society generally or to
specific groups. Often the services provided by these organisations would be provided by government
if they were not provided by the NGOs. Nevertheless VAT exemption and zero rating is still tax
foregone and there needs to be explicit criteria for determining what goods and services are exempt or
zero rated.
The exemption of a proportion of income from taxation so that the poor are exempt from paying tax is
also a widespread practice. However, exempting the first 12 million of turnover from taxation for
farmers may be considered over-generous. Non-farm small enterprises have to start paying tax when
their turnover exceeds 1.4 million RWF and a proportion with incomes below this threshold pay local
taxes from which farmers are also exempt. The same arguments for bring farmers into the tax net
applies as for other small businesses, developing a culture of tax compliance and holding government
to account for the expenditure of public (tax payers) money.
More controversial are the tax incentives and exemptions given to businesses. These include
businesses registered with the RDB as investors. The main beneficiaries are big businesses, many of
which are foreign owned although domestically owned businesses can benefit from some of the
incentives and exemptions. The largest amount is exemptions on imported goods amounting to 84 per
cent of the total while only 0.17 per cent is for employing Rwandans. The latter is generally regarded
as a preferable type of incentive as it rewards output. Our analysis of the costs of benefits of providing
tax incentives for businesses including attracting FDI and domestic investment is inconclusive, but
there is a growing consensus that tax incentives may not work, or to the extent they do they have to be
used selectively and for a limited The government needs to balance supporting investment by
providing a competitive tax environment and ensuring that investors pay an appropriate share of the
fiscal revenue. There is a need to protect the tax base against sophisticated tax planning, that is,
businesses avoiding taxation by taking advantage of incentives and then moving when they are no
longer entitled to them. It should also be noted that once they are introduced, it is difficult to remove
tax incentives.
Whether tax incentives and exemptions work or not, there is a need for transparency, public scrutiny
and dialogue, equity and bargaining are essential to building a culture of tax compliance.
Accountability of government to citizens is essential and taxation encourages citizens to make claims
on governments and hold them accountable for public expenditure.
The report recommends that the government:
1. develops an efficient and effective personal and corporate tax system that is transparent and
fair to all;
2. publishes comprehensive information on all tax exemptions in an annex to the annual budget
giving details of the amount of revenue foregone due to tax incentives and exemptions;
3. puts in place mechanisms to monitor and evaluate tax incentives;
4. carries out a cost-benefit analysis of tax incentives for business
5. reviews the tax incentives that it offers and the list of goods that are exempt from VAT;
6. works with the other members of the EAC to harmonise taxes including tax incentives and
exemptions.

8
Acronyms
AfDB African Development Bank
AGOA African Growth and Opportunity Act (US)
CIT Corporate Income Tax
COMESA Common Market of East and South Africa
EAC East African Community
EBA everything but arms
EDPRS Economic Development and Poverty Reduction Strategy
EPZ Export Commodity Processing Zone
EU European Union
FEZ Free Economic Zone
FTZ Free Trade Zone
GDP Gross Domestic Product
GTZ German Technical Cooperation
IMF International Monetary Fund
IPA Investment Promotion Agency
KPMG Klynveld, Peat, Marwick, Goerdeler
NBR National Bank of Rwanda
NUR National University of Rwanda
PAYE Pay As You Earn
PIT Personal Income Tax
PWC Price Waterhouse Cooper
RDB Rwanda Development Board
RWF Rwandan Franc
RRA Rwanda Revenue Authority
SEEPZ Single Enterprise Considered as Export Processing Zone
UNCTAD United Nations Conference on Trade and Development
VAT Value Added Tax

9
1. Introduction
Providing tax exemptions and incentives is seen as a central element of the Government’s policy of
providing a competitive environment for economic growth and poverty reduction (Ministry of
Finance and Economic Planning 2007). Attracting domestic and foreign direct investment (FDI) is
seen as essential for private sector led economic growth through creating employment, building the
skills base and increasing exports in agriculture, manufacturing and services. At the same time the
Government see it as essential to widen and deepen the tax base, to reduce reliance on Official
Development Aid (ODA) and borrowing to fund government expenditure. Also as a member of the
East African Community it has to harmonise its taxes with other members states and eliminate any
that provide unfair competition. The policy of widening the tax base and the policy of providing tax
incentives could be seen to be in tension (Perry 2011a) and the question needs to be asked if the
policy of providing tax incentives and exemptions is providing the intended outcomes. Is the money
well spent or would Rwanda be better off spending more money on education, health or other areas of
government expenditure? In other words are tax exemptions and incentives attracting domestic
investment and FDI and do the benefits outweigh the costs – the tax foregone1.
However, tax concessions and exemptions are more broadly based than those designed to attract FDI
and domestic investment. A whole range of goods and services are, for example, exempt from VAT,
there is a reduced rate of excise duty on diesel, those with an income below 360,000 RWF do not pay
tax and nor do non-farm businesses with a turnover of less than 1.42 million RWF or farms with a
turnover less than 12 million pay profit tax. There are a range of motivations for this including
encouraging private sector growth and job creation, keeping the price of essential goods and services
lower than they would otherwise have been and supporting philanthropic endeavours. Whilst some of
these may be seen as investing in a public good, nevertheless the non-collection of taxes represents a
public expenditure.
Every year the Parliament scrutinises the Government’s budget but tax incentives and exemptions do
not receive the same attention, effectively making them hidden expenditure. Without transparency
Parliament, tax payers and citizens do not have the information to hold the government accountable
(Prichard 2010a & b). Nor is the government able to monitor and evaluate the policy (e.g. UNCTAD
2006). The government has now agreed, however, that it will report each year on the amount of tax
foregone through incentives and exemptions (IMF 2011).
Tax incentives grant preferential tax treatment to specific taxpayer groups or types of investment. Tax
exemptions granted to rich and powerful potential taxpayers place more tax burden on people with
less economic influence and political clout and /or increase reliance on Official Development Aid.
Corporate income and other taxes are essential to invest in the infrastructure, education and good
governance all of which are important in influencing investment decisions and essential for economic
growth (International Bank for Reconstruction/World Bank 2008). Tax preferences are difficult to
target, may not yield the intended outcomes and may result in significant loss of revenue (African
Economic Outlook 2011).
1 It is beyond the scope of this paper to discuss whether and how public policies more generally can increase competitiveness and thereby
long term economic growth, job creation and poverty reduction. Suffice it to say that that the recent report of the Independent (Spence )
Commission on Growth (2008) concludes that the balance of evidence suggests that the general efficacy of selective industrial policies has not been established but that some policy interventions have yielded positive results in some individual countries. 2 Some non-farm businesses with a turnover below 1.4 M RWF pay local taxes.

10
Taxation experts argue that tax incentives need to be well designed, implemented and monitored
(Easson and Zolt 2010). Governments need to balance supporting FDI by providing a competitive tax
environment with ensuring that they collect an appropriate amount of tax from multinationals (OECD
2011). The Commission on Growth and Development (International Bank for Reconstruction/World
Bank 2008) indicated that tax exemptions should be only a temporary measure, they should be
evaluated and abandoned quickly if not working and they should be targeted at export promotion.
Furthermore they should not be seen as a substitute for investment in education, health, infrastructure
or good governance which are all essential for creating an attractive business environment.
Removing tax incentives and exemptions can be difficult to remove once they are in place (Petersen
Ed) 2010; Uwazi 2010). Reports on the tax regime in Rwanda have recommended that the policy of
granting tax incentives and exemptions be reviewed (AfDB 2010a; FIAS 2006; IMF 2007; Petersen et
al 2010; UNCTAD 2006). In 2006, for example, the Foreign Investment Advisory Service (part of the
World Bank Group) made a number of specific recommendations relating to tax incentives and
UNCTAD in a report made in the same year recommended a general review. There is clearly a need
to determine which incentives and exemptions are harmful and which are effective and necessary
However, there has been no published review or discussion and providing tax incentives to local and
international investors continues to be a central plank of government policy (Ministry of Finance and
Economic Planning 2007).
This Report examines the position of the Rwandan government on tax incentives, concessions and
exemptions, including the role that the government sees for them in its overall development strategy.
It raises questions about the extent to which they are meeting the Government’s objectives and are
providing good valve for the money invested. The report is divided into eight main sections including
this introduction.
Section Two describes the methods used to carry out the research which used a combination
of desk research and field work.
Section Three examines the regional context in the light of Rwanda’s accession to the East
African Community and the community’s commitment to harmonise taxes and do away with
harmful ones.
Section Four describes the country context and the role the government sees for tax incentives
in its overall development strategy.
Section Five considers the policy framework the government has put in place to implement its
strategy to attract FDI and domestic investment through a fiscal regime that grants tax
incentives to some groups of investors.
Section Six sets out what we know about the amount of tax foregone through tax incentives.
Section Seven discusses the extent to which the policy of granting tax incentives is meeting
the government’s objectives.
The final section summarises the conclusions from the research and makes recommendations
to the Government.

11
2. Methodology
The desk research involved key-word searches using google and searches of relevant web sites
including Rwanda Government web sites (see Reference List). All the source material accessed was
indexed and notes made on the information relevant for this project. Materials accessed included all
the Tax Laws in force in Rwanda, relevant policies, the Rwanda Revenue Authority Annual Reports,
recent research on tax policy in Rwanda and literature on tax incentives more generally.
The fieldwork involved agenda interviews with key stakeholders in government, Parliament, the East
African Legislature, international accountancy firms, inward investors and representatives of Official
Development Partners (see Appendix 1). We also collected statistical data from RAA and RDB. A
number of organisations declined to be interviewed including most of the accountancy firms, the
World Bank and some Official Development Partners. The World Bank said that they never answer
questions on a country’s taxation policy and the ODPs who declined said they did not have an expert
in post on taxation. The Private Sector Federation nominated one of their member companies,
Bralirwa, to respond to the questionnaire. In total we interviewed 32 people representing 23
organizations. We visited RRA and EDB on a number of occasions to collect additional data and
interview officials.
Agenda interview schedules were developed to ensure coverage of key topics and comparability of
responses while enabling respondents to give detailed answers. A set of core questions were asked of
all respondents with additional questions for different organisations. Interviews were carried out face
to face by trained interviewers and answers were recorded and subsequently transcribed for analysis.
Interviews were conducted in English and informants were requested to give oral informed consent.
The interview data were analysed for themes.

12
3. The Regional Context
The East African Community, with an estimated population of 126 million and a gross domestic
product of $44bn, has a strong potential to participate effectively in the world economy and thereby
support the social and economic development of the region.
Rwanda joined the EAC in 2007. Although Rwanda’s accession to the EAC is expected to bring
considerable economic benefits in the medium to long term, membership also imposes fiscal
constraints. Rwanda is already experiencing a reduction in customs revenue (RRA 2011). Article
032(e) of the EAC Treaty requires that member states harmonise their tax policies and reform them to
remove distortions and promote investment. The Customs Union, a common tariff for trade with the
rest of world and a Common Market were introduced in 2010. A Monetary Union and a political
federation are planned.
At present the member states have huge differences in their tax systems and these differences
sometimes result in unfair tax competition and unequal treatment of taxpayers, goods and services
which if not addressed will distort the functioning of the Common Market (Appendix 2 Table A2.2)
(EAC 2009). Harmonisation of tax policies and laws on domestic taxation is therefore an essential
aspect of microeconomic convergence and is one of the benchmarks to be attained for the effective
functioning of the Common Market.
The member states of the East African Community have committed themselves to eliminate harmful
tax competition (East African Community 2010). Article 83(2)(e) of the Treaty for the Establishment
of the East African Community commits the member states to harmonise tax policies with a view to
remove tax distortions in order to bring about a more efficient allocation of resources. This stance is
informed by the research findings, which suggest that providing tax incentives and exemptions can be
self-defeating and result in a race to the bottom. In a study specially commissioned to look at issues of
tax harmonization or tax coordination in the EAC (Petersen 2010 ed.) the authors conclude that there
is a need for tax harmonization and coordination and the elimination of harmful tax competition.
The Protocol on the Establishment of the EAC Customs Union provides for the establishment of
export promotion schemes, special economic zones and exemption regimes. However, at present the
incentive and exemption fiscal regimes differ between the member states both in terms of the
provisions in place and the generosity of the schemes (Mukibi 2010; Mbyamkono 2010). Also the
focus of member states revenue authorities is to maximise revenue while at the regional level the
focus is on trade facilitation as a means of increasing revenue collection in the longer term (Mukibi
2010).
At an extraordinary meeting of the EAC Sectoral Council on Trade, Industry, Finance and Investment
in 2009 the members noted the need for the member states to remain competitive at the international
level whilst recognising that tax competition could result in harmful tax practices and unfair
competition between member states. The Draft Code of Conduct Against Harmful Tax Competition in
the East African Community defines harmful tax competition as including:
----the competition created within an economic block as a result of preferential tax regimes
that offer tax advantages to particular entities at the detriment of other entities operating in
the same country or other countries thereby putting other entities at a disadvantage (p 6).
It further defines harmful tax practices as meaning:
13
Tax measures by tax havens and /or preferential tax regimes that affect the location of
financial and other service activities, erode the tax base of other countries, distort trade and
investment patterns and undermine the fairness, neutrality and the broad social acceptance of
systems (p 6).
If adopted the Code would require the member states not to introduce any new tax measures which are
harmful within the meaning of the code and to amend existing laws and practices with a view to
eliminating harmful measures within three years of the signing of the Code. It explicitly requires that
in order to eliminate potentially harmful practices:
any provisions for the negotiation of the tax rate or the tax base be reviewed;
any tax laws which exempt foreign-source income from residency country taxation be
reviewed;
with respect to VAT, that an EAC common VAT model be developed and that zero-rated
regimes and exempt transactions harmonised;
with respect to income tax that initial capital allowances of more than 50 per cent are
abolished, that all tax incentive regimes in the corporate income tax system, especially export
processing zones and special economic zones, are reviewed and harmonised, that the
treatment of losses and withholding taxes on dividends, interest payments, royalties and
services are also harmonised and that capital gains from capital sales be treated as normal
profit;
with respect to excise duty that a harmonised legal base be developed which defines the
categories of taxable goods, defines taxable items in a uniform way, replaces ad valorem rates
with specific rates and defines the lower and upper ceilings for national tax rates. Tax rates
should be defined in the national excise duty laws and discriminatory rates for imported
goods should be abolished.
The Code provides for special consideration to be given to tax measures that are designed to support
the economic development of a particular region, including paying special attention to the particular
features and constraints of the partner states which are geographically disadvantaged. Rwanda along
with Burundi both suffer from being small countries, landlocked and a long distance to ports. They
are also disadvantaged by the high non-tariff costs of exporting and importing goods (Ministry of
Trade and Industry and Private Sector Federation 2010). It should, however, also be noted that in
marketing the proposed Kigali Free Trade Zone the government of Rwanda emphasises the access to a
large market accessible from the location that is not easily served by other trade routes in the region.

14
4. Country Context and Government Policy
4.1. Country Context
Rwanda is one of the best performing countries in Africa and an example of success in post-conflict
reconstruction (Bigsten and Isaksson 2008). Its GDP per capita has increased from less than $200 in
1994 (AfDB 2010a) following the Genocide against the Tutsis to $540 US 2010 (Figure 1). The
average annual growth rated in GDP was 8.8 per cent between 2005 and 2009, 5.2 per cent for the
primary sector, 9.3 per cent for the secondary sector and 11.6 per cent for the tertiary sector (NBR
2010, Appendix Table 1). It has been widely acclaimed for the progress it has made in fighting
corruption and promoting gender equality. It has made dramatic progress in creating a soft business
environment in recent years becoming one of the most improved countries in the world in the annual
Doing Business Index, published annually by the World Bank and International Finance Corporation..
Figure 1: GDP Per Capita 1999-2010
(Source: GDP National Account 20093; NISR 2011)
Rwanda remains, however, one of the poorest and most aid-dependent countries in the world and
faces enormous development challenges. With an estimated population of just over 10 million, it is
the most densely populated country in Africa and one of the most densely populated countries in the
world with about 57 per cent of the population living below the national poverty line. The economy is
mainly dependent on rain-fed agricultural production based on small, semi-subsistence and
fragmented farms with about 77 per cent of the population living in rural areas and dependent on
mainly subsistence agriculture. There are few relatively well trained workers and there is
environmental degradation, poor quality infrastructure, high business operating costs, limited proved
natural resources and difficulties in economic management. It has the highest electricity prices in the
world (Abbot and Rwirahira 2010; AfDB 2010a; United Nations 2006). Around 50 percent of the
government budget comes from official development aid. Whilst domestic revenues have increased
dramatically since the beginning of the 21st century they fund only around half the government
budget and have grown only marginally as a proportion of GDP, up from 11,1 per cent in 2009 to
12.44 per cent in 2009 (data supplied by RRA April 2011).
There are signs of economic transformation with the proportion of the population employed in
agriculture declining from 90 per cent in 2000 to 77 per cent in 2006 and those employed in non-farm
jobs or running non-farm enterprises increasing (Cichello and Sienaert 2010). The agriculture
proportion of GDP declined from a high of 39 per cent in 2004 to 32 per cent in 2010 and that of the
service sector increased from 41 per cent in 2004 to 47 per cent in 2010. There has been little change
3 http://statistics.gov.rw last accessed 04/04/2010
4 This compares with an average of 16 per cent in sub-Saharan Africa excluding South Africa and 32 per cent for OECD countries in 2005
(Gayi 2007)

15
in the contribution of manufacturing which was 15 per cent in 20105 (NISR 2011a) (Figure2).
However, the formal sector’s share of the GDP was only 22 per cent in 2010, with the monetary
informal sector’s being 47 per cent, the informal non-monetary sector’s 20 per cent6 and the
Government’s 11 percent (NISR 2011b). While the high levels of export growth and relative share of
manufacturing in GDP are positive the major challenge is to increase the level of technology in
production. There is over-reliance on resource based goods, low technology, a narrow basket of
export goods and limited export market. FDI remains low despite Rwanda having established a sound
investment climate and the private sector is still nascent. The binding constraints to growth are lack
of economic infrastructure, expensive and unreliable infrastructure, the limited skills base and high
non-tariff barriers, such as delays at border crossings and weighbridges (Byiers 2009; Hansl 2011;
Newfarmer 2010; PSF 2008; World Bank 2007).
Figure 2: Gross Domestic Product by Activity at Constant 2006 Prices
(Source: NISR 2011)
4.2. Government Policy
Rwanda’s vision is to build a knowledge-based economy and to become a private sector led middle
income country by 2020. Rwanda’s ambitious programme for development is encapsulated in Vision
2020. The Economic Development and Poverty Reduction Strategy (EDPRS) is the mid-term
framework for implementing the Government’s long-term development agenda (Ministry of Finance
and Economic Planning 2007).
The EDPRS is based on three pillars designed to accelerate economic growth and promote human
development:
1. Sustainable growth for jobs and exports - investing in improving the climate for business
investment, thereby achieving private-sector growth. In the shorter term the priority is
reinforcing the productive and export potential of the agricultural sector, but in the longer
term the goal is to diversify the economy by promoting the non-farm sector.
2. Vision 2020 Umurenge is a pro-poor rural development and social protection programme. It
includes public works, credit packages and direct support and is implemented at village level
using participatory methods;
3. Good economic governance is seen as a precondition for poverty reduction and development
by creating a comparative advantage in ‘soft infrastructure’ (good governance and
institutional arrangements important for private investors) thus compensating for Rwanda’s
5 Adjustment on the trade figures is 6 per cent. 6 The formal sector is defined in Rwanda as taxpayers, the informal monetary sector is made up of business that have financial transactions but are not registered to pay national taxes and the informal non-monetary sector includes production for immediate consumption and barter.

16
relatively poorly developed hard infrastructure and disadvantaged geographical location
(Ministry of Finance and Economic Planning 2007).
Rwanda takes a developmental state approach with the key objective being sustainable economic
growth and social development. The main aim of EDPRS was to overcome the key constraints to
economic growth identified through a growth, diagnostic and investment climate analysis by:
systematically reducing the operating costs of business; investing in the private sector’s capacity to
innovate; and widening and strengthening the public sector. Government policy is to promote private
sector investment through good governance, a legal framework, promoting savings and the banking
sector and investment in infrastructure, health and education, including vocational training. The aim is
to: create new jobs to absorb new entrants to the labour market and surplus labour created by the
modernisation of farming; facilitate technology transfer; transfer skills to Rwandans; increase the
production of goods and services for export; and generally promote economic growth.
Lacking the main drivers of foreign direct investment Rwanda has recognised that it must develop a
good ‘soft’ environment for business. Rwanda moved from 143rd
to 67th
in 2009 and 58th in 2010 on
the Doing Business Index. A position significantly above that of other members of the EAC (Burundi
183, Kenya 98, Tanzania 128, Uganda 122) potentially giving it a competitive advantage in attracting
FDI (World Bank and International Finance Corporation 2009).
Public investment is targeted at inducing substantial private sector investment and fostering growth in
agriculture, manufacturing and the service sector. Investment is targeted at developing skill and
capacity for productive employment, improving the infrastructure, promoting science, technology and
innovation and strengthening the Financial Sector. Reforms to the ‘soft’ infrastructure for business
and reducing business costs were seen as the first priority. Incentives for foreign investors including
export processing zones and industrial parks, were seen as an important element of the strategy.
Partnership of foreign investors with Rwandan companies was to be encouraged and stimulating
domestic investment was also seen as integral element of the policy. Diversifying and increasing
exports was also seen as central to the strategy and the government has identified the main areas for
export growth, beyond the strategic exports of tea, coffee, horticulture, hides and skins and minerals.
These are tourism, mining services, business process outsourcing, silk textiles, fruit and vegetable
processing and dairy processing (Ministry of Trade and Industry 2009).
FDI was seen as bringing a number of benefits beyond job creation including the investment of
foreign capital, know-how and managerial skills and export promotion. FDI as well as local
investment was to be encouraged in resource based manufacturing (e.g. tea and coffee), low
technology products (e.g. footwear, textiles), high technology manufacturing (e.g. chemicals, IT,
pharmaceuticals) and services including tourism where there is seen to be a high potential for growth.
The 2010 Development Driven Trade Policy Framework prepared by the United Nations Conference
on Trade and Development and the Ministry of Trade and Industry (UNCTAD 2010) argues that the
trade policy should be development driven and not demand led. It suggests that investment, including
FDI, should facilitate the diversification of exports and markets, build local processing industries that
add value to exports especially in agriculture but also in manufacturing and services. Also investment
should provide opportunities for employment in rural areas. It argues that tax reductions/exemptions
in terms of tariffs should promote the inflow of industrial inputs and that consideration should be
given to more strategically located export processing zones with more effective incentives provided.
Generally it advocates making the financial regime effective and well administered. It recommends

17
making financial incentives outcome-based, targeted to development goals and designed to minimise
the impact of taxation on companies cash-flow (see also UNCTAD 2006).

18
5. Taxation Policy
5.1. Introduction
Taxation Policy in Rwanda is focused on widening the tax base to increase fiscal revenues especially
focusing on registering the informal sector, simplifying procedures and providing tax incentives to
encourage both FDI and domestic investment. Although as we have noted above fiscal incentives are
discussed in EDPRS as part of a basket of measures to encourage private sector growth the person we
interviewed for this project nominated by the PSF suggested that: The government focuses more on
revenue collection than on business promotion. We feel that there is not a tax policy linked to EDPRS
or Vision 2020 that promotes business. This is in line with the findings of the PSF (2009) Business
and Investment Climate Survey that concluded that corporation tax was seen as an impediment to
growth by businesses.
The income tax base in Rwanda remains narrow, however, with 80 per cent of workers being engaged
in mainly subsistence agriculture. Although tax revenues have increased in recent years, tax as
percentage of GDP has not increase significantly. In 2008 it was 12.8 per cent and in 2009 12.1 per
cent of GDP). This compares with 10 per cent in 1998.
5.2. General Structure of the Tax System and the Composition of Tax
Revenue
There are three main categories of domestic tax revenue, taxes on goods and services (VAT and
excise duty), direct taxes (including PAYE, corporation tax, personal income tax and tax imputed on
turnover) and tax on international trade
In recent years around half of all domestic tax revenue has come from tax on goods and services with
VAT accounting for around a third of all tax revenues (RRA 2006. 2007, 2008, 2009, 2011). In 2009
the proportion of tax revenue from direct taxes exceeded that from taxes on goods and services for the
first time (Table 1). There has been a decline in taxes on international trade since Rwanda joined the
East African Community and an increase in the contribution of direct taxes. The increase in direct
taxes has come mainly from increasing revenues through the Small and Medium Taxpayers Office
due mainly to the drive to bring more of the informal sector into the tax net (RRA 2011). However,
the largest share of revenue continues to come through the Large Tax Office although the share of
taxes from corporation tax remains low, with most of the income tax coming from PAYE.
Table 1: Tax Collected 2009 in Billion RWF Total Tax Revenue 392.7 % of Tax Revenue7
Tax on Goods and Services 174.7 44.5
Excise Duty 49,606,50 12.6
VAT 125,054,60 31.9
International Trade 37,818,90 9.6
Direct Taxes 179.9 45.8
Income and Profit 135.3 34.5
Large companies 27.4 7.0
Small companies 17.2 4.4 (Source: Data Provided by RRA April 2011)
7 Totals do not add up to 100 per cent because of rounding errors.

19
5.2.1. Value Added Tax
VAT was introduced in Rwanda in 2001. Law No 6 of 2001 has been supplemented by a 2003
Ministerial Order, Commissioner General Rules of 2001, 2002 and 2005, the 2005 Tax Law and Law
No 29/20010 modifying the 2001 Law. The VAT rate is 18 per cent the same as in the other EAC
countries except Kenya where it is 16 percent. There is a range of goods that are exempted at least in
part to reduce the regressive nature of the tax (see below). There is a limited number of zero-rated
goods including goods sold on aircrafts, inclusive tourist tours, goods imported for diplomatic
missions and diplomats and supplies for ODPs and government funded projects.
5.2.2. Excise Duty
Excise duty is levied in accordance with the 2010 Law No 28/2010 which modifies the 2006 Law No
26/2006. The tax on imports is based on the cost including insurance and freight on arrival in Kigali
and on local products on the selling price exclusive of taxes. In 2010 the rate of tax on fuel was
changed to a fixed one with diesel being taxed at a lower rate than premium petrol to support
economic activities.
Table 2: Excise Duty Goods Tax Rate
Beer 60%
Spirits and Wine 70%
Fruit juices 5%
Powdered Milk and Mineral Water 10%
Soft Drinks 39%
Cigarettes 150%
Fuel - Premium (excluding Benzene) and Diesel 283 RWF/litre on premium
250 RWF/litre on diesel
Lubricants 37%
Motor Vehicle up to 1500cc 5%
Motor Vehicle up to up to 2500cc 10%
Motor Vehicle over 2500cc 15%
Telephone 8%
5.2.3. Income and Profit Taxation
Profit and income tax rules and rates are set out in the 2005 Law (Law 16/2005) and regulations
relating to the implementation of the Law by the Minister and the Commissioner General Any
resident who earns an income from domestic and foreign sources as well as non-residents who have
income from a source in Rwanda are liable to pay personal income tax. The lower tax threshold is
360,000 RWF and the marginal tax rates are 20 per cent and 30 per cent (for a taxable income of
above 1.2 million RWF). Small non-farm business owners with an annual turnover of between 1.4 and
20 million RWF a year pay a presumptive tax of 4 per cent. Farmers are exempt from taxes until they
have an annual turnover of 12 million RWF a year. A withholding tax of 15 per cent is levied on
dividends, interest payments, royalties, service fees and performance payments.
Contributions made by employers to the state social security fund and qualifying pension fund are
exempt. Non-residents who receive income from an employer not based in Rwanda are exempt from
income tax. Payments for diplomatic personnel and payment related to services for international
organisations on the basis of international agreements are also exempt.
A withholding tax of five per cent the value (cost, insurance, freight) of imported good for
commercial use is paid to customs before the goods are released from the bonded warehouse.

20
5.2.4. Taxation Rates
The tax rates are set out in the 2005 Law (Table 3). The tax regime for personal income tax payers is
regressive with a low threshold for paying the top rate of tax, just under a third of the threshold in
Kenya and Tanzania and even they are regarded as regressive (AfDB 2010a; PWC 2011). Corporate
income tax by contrast is the same as in the other EAC countries at 30 per cent and lower than the
OECD average of 44.5 per cent and Sub-Saharan Africa of 67.5 per cent (Appendix 2, Table A2.2)
(World Bank 2010; PWC 2011). There is no defined capital gains tax, they are treated as profit and
charged at the CIT rate of 30 per cent.
Table 3: Taxation Rates Tax Rates in the 2005 Code
Corporate Income Tax Rate 30%
Withholding Rate Dividends, Non-Residents 15%
Withholding Rate on agency Fees and Interests 15%
VAT - Standard 18%
VAT - Exports 0%
PAYE 20%, 30%
Turnover Tax on Turnover Between 1.4 and 20 Million RWF8 for Non-Farm
Small Businesses
4%
(Source: Law 16/2005)
Our respondents said that the general perception in Rwanda is that taxes are too high and are high
compared with other countries in the region. A few argued that this was a perception but that tax rates
were not out of line with regional rates and that it was necessary to collect taxes to pay for services.
One inward investor said that domestic personal taxes were too high but that corporation tax was set
at an appropriate level. However another complained about hidden taxes and a number remarked on
the aggressive attitude of RRA. The respondent nominated by PSF told us that businesses fear tax
audits (see also PSF 2009).
5.2.5. Local Taxes
There are three local taxes, property tax charged on the value of a property, Pantente (trading licence)
and a tax on rental income from property or land. NGOs, religious groups and government are exempt
from property tax.
5.3. Tax Exemptions in Rwanda
5.3.1. The Country’s Objectives
Before considering in more detail the impact of the policy of providing tax incentives and exemptions
in Rwanda it is worth considering what we mean by tax exemptions and incentives, why governments
offer them and the extent to which they are seen to work,
Tax exemptions are given for the following reasons:
To reduce the regressive nature of VAT by lowering the price of goods and services
consumed by the poor by exempting from VAT goods consumed by the poor such as
water service;
lowering the price of certain goods that are deemed to have a direct benefit for society
such as medicines, health care and education by exempting them from VAT;
tax exemptions for NGOs and religious groups whose activities are of direct benefit
to society;
8 This upper limit is the same as the lower threshold for VAT registration.
21
where the foreign or official nature of the activity does not warrant taxation, for
example items sold in duty free shops or internationally bound aircrafts or goods
consumed by the armed forces.
to stimulate the transformation of agriculture by exempting farm-household
enterprises from income tax until they have a turnover of 1.4 RWF a year and
exempting agricultural inputs and products for all agricultural enterprises from VAT;
providing incentives to stimulate economic growth to domestic and foreign investors.
These incentives are expected to result in increased investment, employment, output
growth and exports. These include incentives such as the favourable treatment of
profits through reduced corporation tax and reduction in import duties,
5.3.2. Public Debate/Studies to Inform Tax Incentives
Taxation under the Rwandan Constitution (Republic of Rwanda 2003) has to be approved by
Parliament. Article 81 of the Constitution says that no taxation can be imposed, modified or
suppresses except by law and that no exemption from or reduction of tax may be granted unless
authorised by law. Under Article 79 of the Constitution every year the Chamber of Deputies have to
adopt the Finance Law (budget) and before the final adoption of the Budget, the President of the
Chamber of Deputies seeks the opinion of the Senate on the Finance Bill. However, the amount of
revenue foregone as a result of tax incentives and exemptions is not reported even though this is in
effect government expenditure to achieve policy objectives. Furthermore the Law gives the Cabinet
the right to negotiate incentives with individual investors without recourse to Parliament. This means
that incentives can be given without any form of public scrutiny. It is unclear if the information will
be formally presented to Parliament for public scrutiny in future year although the government has
signalled an intention to publish the information (IMF 2011).
The extent to which there has been public debate/consultation about taxation in general and incentives
in general is unclear. The government representatives, including ministries, RRA and RDB we
interviewed said there had been consultations. The representative of RDB, one of the academics we
interviewed and the interviewee nominated by PSF said there had been a consultation in 2009.
However, the Member of Parliament we interviewed, representatives of ODPs the TU leaders, the
representatives of foreign investors and the other three academics all said they were unaware of any
consultations. The TU officials were strongly of the view that there should be a public debate about
taxes in general and tax incentives in particular. We can find no records of any meetings. There are,
however, consultative meetings held by RRA with taxpayers to discuss service delivery.
There have been no studies carried out by the Rwandan authorities into the effectiveness of tax
incentives and exemptions in supporting policy objectives. There seems to be no regular calculation of
the amount foregone through tax incentives and exemptions9 and information on registered foreign
and domestic investors has not been published for several years. The representative of the Ministry of
Finance and Economic Planning we interviewed told us that the failure to carry out monitoring and
evaluation was due to lack of planning.
A number of international agencies have recommended that the government review tax incentives
and exemptions arguing that Rwanda would do better in tax revenue generation if it did not have in
place the tax incentives and exemptions introduced in 2005 (IMF (2007). Tax incentives for FDI may
be counterproductive or ineffective because they distort the investment climate, and what Rwanda
fails to tax may be taxed in the investors domicile.
9 The failure to report the amount of revenue foregone through tax incentives and exemptions seems to be the norm with very few countries reporting the amount (Kransdorff 2010).

22
Two studies carried out in 2006 one by UNCTAD and one by FIAS, both recommended a review of
policy. UNCTAD argued that the government needed to develop a clearer vision as to how fiscal
incentives could achieve the national development goal (see also UNCTAD 2010a). They
recommended that tax incentives be made available to all investors irrespective of size of investment,
as Rwanda was more likely to attract SMEs. They should also be output driven and focus on
employment creation and knowledge transfer with deductions for personnel training expenses and
targeted incentives to attract foreign skills and entrepreneurship.. They argued that reforms to the
taxation system, including lowering the corporation tax rate to 25 percent and the dividend
withholding rate to 10 percent, allowing a faster rate of depreciation on durable assets and unlimited
loss carry-forward, setting up a comprehensive claw-back scheme for exporters and improving RAA
administration including minimising the impact of taxation on companies’ cash flow, would better
enable the government to meet its objectives.
FIAS (2006) recommended: reviewing and eliminating as many fiscal incentives as possible and
ensuring that any that remain are not overly generous; investigating ways of bringing farmers into the
tax net and specifically halving the tax exemption threshold; reviewing the VAT exemption status of
agriculture; imposing VAT on gorilla permits issued by OPTPN; providing investment allowances for
all investors irrespective of size; evaluating the impact of the 0 per cent corporate income tax on
micro-finance institutions; and allowing VAT exemption on imports of international services that are
not available locally.
We have found no evidence that these recommendations had been systematically considered or
debated. The only changes in taxation that have taken place relating to the recommendations is that
Gorilla permits are now subject to VAT and VAT exemption on imports of international services that
are not available locally has been granted.
5.3.3. Tax Incentives, Concessions and Exemptions in Rwanda
We can consider tax incentives, concessions and exemptions as falling into three main types (Table
5). Those:
1. available to all residents or those who fall in a given category - e.g. exemption from VAT
on certain goods and services such as water, exemptions from profit tax (see Table 4);
2. available to all business or other organisations that fulfil the criteria e.g. - exemption of
VAT on manufacturing equipment, medical-equipment for use in health facilities (see
Table 4);
3. specifically designed to attract domestic investment and FDI and which require the
investor to hold an Investment Licence issues by RDB (see Section 5.3.5 below).
There is some overlap between 2 and 3; for example, all businesses can benefit from tax reductions
for exporting goods above a certain value. This can be seen as something that may be attractive to
foreign and domestic investors but it is a concession given to all business operators.

23
Table 4: General Tax Incentives, Concessions and Exemptions Excise Duty
Reduction of 33 RFW a litre on gas oil.
Customs Duty
goods contained in the personal luggage of a traveller, and goods brought in on setting up residency.
goods imported for diplomatic missions, consulates, international organisations and charities
educational, scientific and cultural materials.
pharmaceutical products, instruments and apparatus intended for medical purposes, pesticides,
agricultural inputs and tools and fishery equipment.
VAT – Exempt
For all Residents
Water Supply and Sewage Treatment Services
Goods and Services for Health Purposes including medical treatment, drugs and medical equipment and
equipment for people living with disabilities.
Educational Material and Services provided for/used by government education institutions and those run
by NGOs
Print Media and Electronic Equipment used for Educational Proposes
Transport Services including air, boat and road travel and the transport of goods by road and boat
Sale and Lease of Land and Property for Residential Purposes
Financial and insurance Services including premiums on health and life insurance, charges on operation
of current account, transfer of shares, capital market transactions for listed securities
Funeral Services
Energy supplies
Trade Union subscriptions
Leasing of Exempt goods
Agricultural and Livestock Products except for those Processes (locally processed milk is exempt)
Agricultural Inputs and Equipment
ICT Equipment
Mobile ‘Phone Handsets and SIM Cards
For all Investors
Machinery for Industry
Medical Equipment, Medical Products, Agricultural, Livestock, Fishing Equipment and Agricultural
Inputs
Tourist Charter Planes
Transfers of Market Shares
Income Tax
Farm enterprises are exempt from tax with turnover up to 12 million RWF a Year.
Non-Farm Enterprises are exempt from tax with a turnover up to 1.4 million RWF a Year.
Those with annual earnings/profit below 36,000 RWF a year are exempt from tax.
Premiums paid by employers and employees to recognised pension funds.
Government, NGOs, religious organisations, donor funded projects exempt.
Taxpayers who export commodities or service in a tax period to a value
- of between three and five million US$ are entitled to a tax discount of three per cent;
- more than five million US$ are entitled to a tax discount of five per cent.
Income accruing to registered collective investment schemes and employee share schemes is exempt
from tax
Exemption of secondary market transactions for listed securities from capital gains tax
Listed companies are taxed at 20 per cent, 25 per cent and 28 per cent respectively for a period of five
years if they sell 40 per cent, 30 per cent or 20 per cent of their shares
A venture capital firm is exempt from corporate income tax for five years from the date of registration
with the capital market authority.
The withholding tax is reduced from 15 per cent to five percent on dividends and interest income on
listed securities and interest arising from investments in listed bonds with a maturity period of three
years and over when the person who withholds is a resident of Rwanda or the EAC.
Exemption from withholding tax on imports and public tenders for taxpayers who have a tax clearance
certificate issued by the Commissioner General of Rwanda Revenue Authority who have complied with

24
tax requirements interest on investment income is taxed at a flat rate of 15 per cent
income from dividends is taxed at a flat rate of 15 per cent
royalty income is taxed at a flat rate of 15 per cent
tax on rental income (excluding buildings and houses) is reduced to 10 per cent.
5.3.4. Guidelines used to Determine Tax Incentives for Investors
Law No 26/2005 of 17/12/2005 Relating to Investment and Export Promotion and Facilitation sets the
framework for the policy for encouraging DFI and domestic investment through fiscal incentives.
Law No16/2005 reformed the previous Law (Law8/97) and incorporating all fiscal incentives in the
income tax code (Table 6). However, UNCTAD (2006) while recognising that the 2005 Law
improved the structure, administration and efficiency of the tax system argued that the code still
suffered from a number of weaknesses including:
a complex and administratively burdensome structure of incentives;
an insufficiently clear vision as to how fiscal incentives can support the achievement of
national development goals.
Table 5: Legal and Regulatory Framework for Promoting and Incentivising Investment Name Area
Constitution of Rwanda 2003 The Constitution Guarantees Private
Property Rights
Rwanda Investment and Export
Promotion Act 2005
Law on Investment, Trade and Export Provides for Registration of Investment
Projects
Value Added Tax 2001 Law Imposing VAT Provides for Exemptions for Domestic
and FDI
Income Tax Act 2005 Law governing Taxation of Income Provides for Incentives for domestic
and FDI
Customs and Excise Act 2006 Law on Import and Export duties Provides for Exemptions for Domestic
and FDI
2007 Law Establishing the Rwanda
Commercial Registration Services
Agency
Register trading companies and for
intellectual property rights
2008 Law Establishing Rwanda
Development Board
Government Agency to fast track
development activities, to promote
domestic and FDI and to promote
exports to regional and international
markets.
Provides an Information Hub and
advice to investors including a One
Stop Centre for Starting a Business and
support with business implementation.
2008 Law Establishing Arbitration and
Conciliation in Legal Matters
Applies to domestic and international
commercial arbitration and
conciliation.
5.3.5. Targeting of Incentives and Eligibility Criteria
There are no restrictions in Rwanda on domestic investment or FDI or the types of business that can
be started. RDB registers all businesses and the business operator has to also meet the sector-specific
requirements. Details of these are provided in the Investor Info Pack (RDB 2010).
However, to be eligible for a range of fiscal incentives and exemptions (see Table 6 below) investors
(FD and domestic) must hold an Investment Certificate issued by the RDB10
. A foreign investor must
invest a minimum of $250,000 and a domestic investor or one from COMESA $100,000. The criteria
used to evaluate the project proposal include: level of investment; non trading activity; creation of
quality jobs; transfer of skills and technology; use of local raw materials; potential for exports;
potential to create forward and backward linkages; and innovation and creativity (Law N016/2005 on
10
This is in addition to the general requirements of registering as a company or business with RDB and registering for tax with RRA.
25
Direct Tax on Income). The priority sectors for investment are: ICT; tourism; energy; agriculture; and
agro-based industries; manufacturing; re-export trade; mining; research; human resource
development; and, infrastructure. The main criteria used in evaluating a proposal are the level of
investment, jobs to be created and transfer of skills and technology (interview May 2011). There are
four areas of investment where more detailed criteria are given in the Law to be eligible for a
Certificate of Investment Registration.
1. Construction Projects. The project has to be worth the equivalent of one million and
eighty thousand USD, completed within 24 months, use quality local materials when
available, sub-contract to local companies that employ Rwandan workers, make optimal
use of the allocated land and be environmentally friendly.
2. Foreign Head Headquarter Status. The company must invest the equivalent of two
million USD in movable and fixed assets, employ Rwandans and provide training for
them, make international financial transactions of at least five million USD a year through
a licensed commercial bank in Rwanda, spend at least the equivalent of one million USD
a year in Rwanda and set up its actual physical administration in Rwanda. In addition it
must perform at least three qualifying services for its offices or companies outside of
Rwanda: general management and administration; business planning and coordination;
procurement of raw materials, components and finished products; technical support and
maintenance; marketing control and sales promotion planning; data/information
management services; treasury and fund management services; corpora and financial
advisory service; research and development work; and, training and personnel
management.
3. Free Economic Zones (Kigali Free Tax Zone). Eighty per cent of goods and/or
services have to be exported. A local firm has to invest a minimum of $50,000 and a
foreign firm $100,000. Products sold locally (up to 20%) attract local duties and taxes
(Law No 26/2005 of 17/12/2005). RDB has to ensure that the business will: create high
quality jobs; make substantial new investment in productive activities; transfer
technology and skills; diversify and expand exports; use locally produced raw materials;
create backward and forward linkages in the economy; and be environmentally friendly.
The first planned FTZ is the Kigali Free Tax Zone (FTZ) which is intended to provide a
trade, logistics and service hub to serve the northern Great Lakes Region including
Rwanda itself, Burundi, western Uganda, western Tanzania and eastern Congo. It will be
open to distribution and manufacturing companies including those engaged in
professional, financial and technical service with the targeted industrial sectors being
agro-processing, ICT/shared services, cold storage/horticulture, textiles/clothes,
petroleum storage, dry goods warehousing, high value trading and crafts. It is proving
difficult to attract investors due to the high cost of land (interview RDB May 2011).
4. Scarce Resources. Investors who wish to invest in scarce resources (including methane
gas) have to be given permission by RDB (2005 Law on Investment Promotion and
Facilitation). Those whose proposals to invest in exploiting the resource have the same
entitlement to tax incentives and exemptions as other licensed investors in Rwanda. The
methane gas in Lake Kivu is an important natural resource for Rwanda which can
potentially be exploited to provide electricity to the national grid and to manufacture
liquid fuels and fertilizers. There are no plans to provide incentives beyond those
generally available (Interview with RDB Official April 2011).

26
5.3.6. The legal Instruments and Tax Policies Providing Incentives for Investors
The general framework for encouraging private sector investment in investment in Rwanda is Law No
26/2005 of 17/12/2005 Relating to Investment and Export Promotion and Facilitation. The Laws that
set out the tax incentives available for investors register with RDB are:
Law N° 06/2001 of 20.01.2001 On the Code of Value Added Tax as amended by Law
N° 29/2010
.Law N° 25/2002 OF 18/07/2002 Fixing the Import Duty Tariff on Imported
Products.
LAW Nº 16/2005 of 18.08.2005 on Direct Taxes on Income as amended by Law n°
73/2008 Law Nº 24/2010
Law No 26/2010 Governing the Holding and Circulation of Securities.
Law n° 26/2006 of 27.05.2006 Determining and Establishing Consumption Tax on
Some Imported and Locally Manufactured Products as amended by Law No75/2008
Law N° 19/2009 and Law No 28/2010.
In addition to the fiscal incentives for businesses set out in Table 5 above there are a number of
incentives for holders’ of Investors Certificates, targeted at foreign investors with some also available
to domestic investors. Incentives are given that effectively reduce corporation tax and give exemption
to/reduce VAT, Custom Duties and withholding Taxes. Additional incentives are given for those
operating in a FTZ or a foreign company that locates its headquarters in Rwanda. The reduction on
corporation tax for employing more than a 100 Rwandans is output driven and the ability to deduct
training and research expenses is designed to encourage investment in capacity building (Table 6).
The goods exempt from VAT are all inputs that are in line with the priority areas for private sector
investment identified by the Government.
Table 6: Tax Incentives for Holders of an Exemption Certificate Direct Taxes on Income
An investment allowance of forty per cent of the invested amount (50% outside the City of Kigali or for priority
sectors as determined by the Investment Code of Rwanda) may be depreciated provided the amount invested is
equal to or more than 30 million RWF and the business assets are kept at the businesses premises for three tax
years following the first one.
Training and research expenses are deductible from taxable profits.
Losses may be carried forward and deducted from business profit in the next five tax years – earlier losses being
deducted before later ones; loss carry forward.
A company that operates in a Free Trade Zone and foreign companies that have their headquarters in Rwanda,
invest at least two million US dollars, provide employment and training for Rwandans, make international
financial transactions that need equivalent of five million US Dollars and pass through a local bank and spend at
least the equivalent of one million US Dollars a year in Rwanda are entitled to pay corporate income tax at zero
per cent, are exempt from the 15 per cent withholding tax on interest, and can repatriate profits tax free abroad.
A profit tax discount of:
two per cent if the investor employs between 100 and 200 Rwandans;
five per cent if the investor employs between 201 and 400 Rwandans;
six per cent if the investor employs between 401 and 900 Rwandans;
seven per cent if the investor employs more than 900 Rwandans.
Microfinance institutions are zero rated for five years renewable on a Ministerial Order.
VAT, Customs Duty11 and Withholding Tax
Machinery and Raw Materials
Building and finishing Materials provided that the project is worth at least one million eight hundred thousand
UD dollars and the materials are not available in Rwanda of international standard as specified by the developer.
Private education institutions importing materials and equipment.
Specialised vehicles.
Medical equipment, medical products, agricultural equipment and input
Equipment for tourism/hotel industry
11
Exemption from custom duty has to be in line with EAC regulations.

27
Foreign investor or an expatriate employee of a registered enterprise is exempt from duty on one car, personal
property and household effects
RDB may request the Cabinet to give additional incentives and facilities to investors. Such decisions will take account of
the importance of the investment to Rwanda, the location and the amount to be invested.

28
6. Tax Foregone Due to Tax Incentives
6.1. Tax Foregone
The representatives of the Ministry of Finance and Economic Planning and the RRA we interviewed
told us that the amount of tax foregone is calculated but not reported. However, an official we were
referred to in the RRA had to calculate the tax foregone for us. He informed us that he could not
provide information easily on the amount of tax foregone for all tax exemptions12
. And he was only
able to find the necessary data to provide us with figures for 2008 and 2009. Table 7 shows the
information that that RRA was able to provide us with. It basically shows the revenue foregone due to
incentives to investors. The RRA were unable to provide any information on revenue forgone through
other tax exemptions such as revenue lost through VAT exemptions or the non-taxing of NGOs and
religious institutions and government institutions.
In 2006 according to the International Monetary fund the amount of revenue foregone in Rwanda to
tax incentives was three per cent of GDP. Our calculations suggest that by 2008 this had risen to 3.6
per cent and 4.7 per cent by 2009. This compares with 2.8 per cent of GDP in Tanzania in 2008/9,
one per cent of GDP in Kenya and 0.4 percent in Uganda (Maliyamkono et al 2009)13
(see Table
A2.1).
Exemptions on imported goods provide by far the largest category, 84 percent of the total. By contrast
the percent of the total tax foregone for providing employment for Rwandans was 0.17 per cent.
Table 7: Tax Foregone Due to Tax Incentives 2008 and 200914
Tax 2008 Tax Foregone 2009 Tax Foregone
Investment Allowance 21,826,890,607
Tax Reduction Based on Number of Employees 259,265,691 237,037,365
Corporate Income Tax at 0% for 5 Years (Micro
Finance
529,065477 61,512,331
Import Tax Exemptions (VAT, Customs Duty,
Withholding Tax)
92,211,995,534 118,193,608,019
Domestic Tax Exemptions resulting from contracts
based in bilateral agreement e.g. COMESA
1,378,873,200 536,700,600
Total 94,379,199,902 140,855,748,922
As % Total Tax Revenue 34% 38%
As % Total Potential Tax Revenue 25.5% 30%
As % Total Government Revenue 29% 33%
As % Total Potential Government Revenue 22.5 24.7
As % of Government Budget 14% 17%
As % Total Potential Government Budget 12.3% 14%
Total as % of GDP 3.6% 4.7% (Source: Calculation Provided by RRA April 2011)
The informants we interviewed were generally unaware of how much was foregone in tax revenue
through tax exemptions and incentives, suggesting that there has been little discussion of the issue.
The exception was the representative from KPMG who provided figures for 2009 virtually identical to
those calculated for us by RRA. Yet the amount of revenue foregone is not insignificant and it is in
Budget.
12
This can be compared with Tanzania where all revenue foregone due to tax incentives and exemptions is calculated and reported
(Mahyamkono et al 2010). 13 We should note that the figure for Tanzania includes all tax forgone including VAT, NGOs, donor funded projects and other exemptions
other than those given as investment incentives. 14
We noticed that the data in this table does not match exactly to types of taxation in Rwanda. We checked the information with RAA and
were assured it was accurate.

29
What could the government have spent the foregone tax revenues on if they had been collected? The
government budget is funded from three sources, domestic revenues (479.7 b. RWF) ODA (409.2 b.
RWF) and borrowing (95 b RWF) (Law No 30/2010 of 3006/2010). So the government could have
eliminated the need to borrowed or relied on less foreign aid. Alternatively it could have increased
spending on priority areas. In terms of EDPRS priorities in the 2010/11 Budget 24.6 per cent was
allocated for infrastructure, 14.2 per cent for productive capacity, 33.9 for human development and
social sectors 30.1 per cent got governance and sovereignty, 4.5 per cent for defence and 5.1 per cent
for public order and safety (www.minecofin.gov.rw). It could have increased spending on the human
development and social sectors by 31.5 percent. It could for, example, have increased spending on
health by over a 100 per cent or increased that on education by nearly a 100 per cent. It could have
increased spending on industry and commerce by about 300 per cent.
Another way of putting it is to consider how much the government is spending on industry and
commerce if we take account of the budgetary allocation and the revenue foregone. The percentage of
government spending is 17.7 per cent per cent compared to 5.9 per cent in the budget – Over three
times what the government reports.
6.2. Systems Put in Place for Monitoring Compliance
RDB has an office (the Aftercare Team) to provide ongoing support for those given investors’
certificates. This office also monitors the implementation of the business plan and proposal submitted
to RDB that provided the basis for the certificate being issued (interview with RDB May 2011).
6.3. EAC Impact
The country gives a range of incentives for both domestic and foreign investment which could
potentially be seen as harmful taxes, distorting competition in the EAC. Rwandan has the most
generous provision of incentives in the EAC as we have already discussed. (see Table A2.2)
(Mayambono et al 2010). The EAC Treaty requires harmonisation of taxes although this does not
necessarily mean that the member states would have to have identical incentives and exemptions as
there needs to be agreement as to which taxes would be agreed at a Regional level and where the
principal of subsidiary would apply. Rwanda could claim that giving more generous incentives
compensates for a disadvantaged geographical location thus levelling up the playing field with the
other member states. Although Burundi and Uganda are both landlocked.
Although the general view of our respondents was that Rwanda would benefit from EAC membership
there was unease that if there were harmonisation of tax incentives and exemptions Rwanda would be
disadvantaged because of her geographical location. The representative of RRA thought there should
be an evaluation of current practices but the representative of the Ministry of Finance and Economic
Planning said that member states would have to harmonise taxation and compete by means other than
tax competition. The representative of one of the ODPs voiced the view that if there was not
harmonisation there would be a race to the bottom and another that there would be uneven regional
development.
In the context of the East African Community and the creation of a common market tax incentives
distort fair competition, are contrary to economic integration and cause unfair tax and state aid
compensations. There could be a race to the bottom in which all the member states are losers as they
compete to give ever increasing incentives at the expense of decreasing tax revenues. Attention also
needs to be given to harmonising VAT exemptions to avoid the potential for fraud.
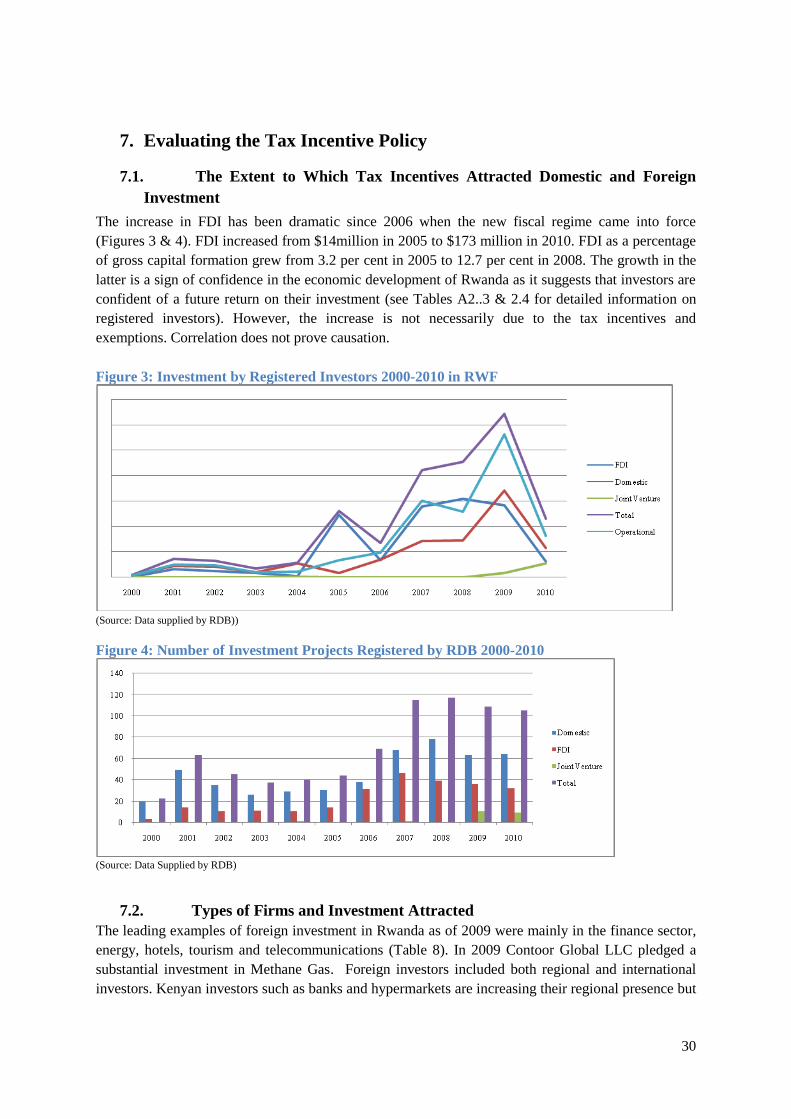
30
7. Evaluating the Tax Incentive Policy
7.1. The Extent to Which Tax Incentives Attracted Domestic and Foreign
Investment
The increase in FDI has been dramatic since 2006 when the new fiscal regime came into force
(Figures 3 & 4). FDI increased from $14million in 2005 to $173 million in 2010. FDI as a percentage
of gross capital formation grew from 3.2 per cent in 2005 to 12.7 per cent in 2008. The growth in the
latter is a sign of confidence in the economic development of Rwanda as it suggests that investors are
confident of a future return on their investment (see Tables A2..3 & 2.4 for detailed information on
registered investors). However, the increase is not necessarily due to the tax incentives and
exemptions. Correlation does not prove causation.
Figure 3: Investment by Registered Investors 2000-2010 in RWF
(Source: Data supplied by RDB))
Figure 4: Number of Investment Projects Registered by RDB 2000-2010
(Source: Data Supplied by RDB)
7.2. Types of Firms and Investment Attracted
The leading examples of foreign investment in Rwanda as of 2009 were mainly in the finance sector,
energy, hotels, tourism and telecommunications (Table 8). In 2009 Contoor Global LLC pledged a
substantial investment in Methane Gas. Foreign investors included both regional and international
investors. Kenyan investors such as banks and hypermarkets are increasing their regional presence but

31
some may be attracted by the more generous incentives for investors in Rwanda compared to other
EAC member states. It was beyond the scope of this project to investigate that.
Table 8: Leading Foreign Registered Direct Investors in Rwanda 2006-10 (10 Billion RWF+) Company Country Sector Investment in RWF
Kenya Commercial Bank Kenya Finance 128,421,421,361.00
Dubai World UAE Hotel & Real Estate 126,500,000,000.00
Star Communications Network China Telecommunications 10,893,135,000.00
CCDTHA Canada Hotel 11,275,000,000.00
Convention Centre Libya Hotel &Tourism 82,500,000,000.00
Kivu Watt Ltd USA & Netherlands Energy 171,000,000,000.00
Tigo Luxembourg Telecommunications 68,000,000,000.00
New Century/Marriott Hotel 25% Rwanda/75% China Hotel 39,330,000,000.00
Falcon Oil Storage Ltd Mauritius Petroleum 16,520,000,000.00 (Source: Data Supplied by RDB)
If we look at Table 9 we can see that Kenya is the leading country of domicile of foreign investors
followed by the USA, China and Belgium (the former colonial power). The EAC community accounts
for 37 and Sub-Saharan Africa for 51. The EU accounts for 43 in total. Of the countries targeted for
attracting FDI from the USA was the leading one with 24, China second with 16, Belgium third with
14, India fourth with 12, and the UK last with six in the five years period.
Table 9: Countries of Domicile of Registered FDI 2006-1015
Sub-Saharan Africa North Africa Asia North America Europe Middle East Australasia
Kenya (29)
South Africa (8)
Tanzania (5)
Mauritius (3)
Uganda (2)
Somalia (2)
Burundi (1)
Togo (1)
Libya (2) China (16)
India (12)
Pakistan
(3)
Japan (3)
South
Korea (3)
Kazakhstan
(1)
USA (24)
Canada (8)
Belgium (14)
Netherlands (6)
UK (6)
Germany (5)
Italy (4)
Switzerland (4)
France (3)
Russia (2)
Cyprus (1)
Ireland (1)
Spain (1)
Bulgaria (1)
Slovakia (1)
Israel (4)
Lebanon (2)
Saudi Arabia
(1)
UAE (1)
Iran (1)
Australia
(1)
51 (37 EAC) 2 38 32 49 (EU 43) 9 1 (Source: Data Supplied by RDB)
Table 10 shows the sectors of investment of the leading local investors. They are in a range of the
priority areas for investment, but with half being in construction/property/real estate.
Table 10: Leading Registered Domestic Investors in Rwanda 2006-10 (10 Billion RWF+) Company Sector Investment in RWF
Rwanda Energy Company Energy 58,297,398,850
EPCHER Agribusiness 14,822,527,500
Kigali Limousine VIP Tours Travel Transport 1,421,263,757,86
Rwanda Free Zone Company Ltd Construction 36,978,461,800
Ultimate concepts LTD Real Estate 11,660, 000,000
Rwanda Investment Group/KIP Finance 27,763,979,100
CIMERWA Construction Manufacturing 30,800,000,000
Real Contract Property 227,327,955,620
Market shopping Centre Property 12,028,000,000
Caisse Sociale/Kagugu Project Real Estate 17,400,000,000
4G Networks ICT 11,600,000,000 (Source: Data Supplied by RDB)
15 Includes those involved in joint ventures.

32
Figure 5 shows the investment projects by sector from 2000 to 2010 for business with investors’
certificates, and separately from 2000 to 2005 and 2006 to 2010. 2006 was when the 2005 Tax Law
came into force together with the Law on investment promotion. Investment was highest in tourism,
manufacturing and construction over the 10-year period. The increase since 2006 has been high
compared with the numbers in the previous 5 years in tourism, construction, energy and mining all
priority areas for private sector growth. However, in manufacturing and agriculture, two other priority
areas for investment there was little change in the number of investment projects between the two
periods.
Figure 5: Investment Projects by Sector Registered Foreign and Domestic Investors 2000-2010
(Source: Data Supplied by RDB)
7.3. Are Tax Incentives and Exemptions Working?
The main question that needs to be considered is if the benefits of giving tax incentives and
exemptions outweigh the costs. Is the tax revenue foregone or to put it a different way the money
spend by government on attracting private sector investment, compensated for by other factors. In
other words, is the money being well spent? In order to try and evaluate the impact we need to
understand what the Government’s objectives are. They are economic growth, growth of the private
sector, an increase in tax revenue, employment creation and a diversification in exports as well as an
increase in the value of goods exported. The government also wants to leverage foreign investment in
the private sector to transfer technology and skills.
Measuring whether tax exemptions and incentives work and are working (achieving the desired
objectives) is difficult. It is virtually impossible to determine the full costs and even harder to tell
what is responsible for attracting inward and domestic investment (Klemm 2009). There are five
main factors in Rwanda that may account for increased investment other than tax incentives: the
investors would have invested without incentives; post-conflict recovery; improved infrastructure and
training; anti-corruption; and, the Doing Business reforms (see Table A2.1). Furthermore even if an
investor was attracted by tax incentives and exemptions there may well have been other investors who
would have invested without the incentives. This crowding out is an unknown. On the other hand
increased investment by or start up of firms not getting tax incentives may be due to the increased
demand created directly and indirectly by firms in receipt of incentives.
The Views of Our Key Informants
Given that there has been no monitoring and evaluation of the impact of tax incentives and
exemptions the views of our respondents are subjective and few had a comprehensive knowledge of

33
the range of incentives. Respondents representing government institutions thought that incentives for
large businesses were working and some thought incentives for new businesses were as well. A
number pointed to the growth in business as evidence to support their views However, the respondent
from RDB thought that there needed to be more incentives for local investors and the respondents
from RRA and RDB said that more tax concessions are being considered. However, others were less
certain. Two of the large businesses interviewed said that tax incentives were important and one
thought they were important for attracting new investment but not of benefit to existing businesses.
One agreed with the view of the academics that factors like infrastructure are more important and one
said they had had no influence on their decision to invest. The representative of KPMG thought that
tax incentives do not attract investment and do not work for existing large businesses and the IMF
representative said that he and the IMF were opposed to tax incentives. ODPs generally did not know.
Performance in Attracting FDI
Table 11 shows Rwanda’s relative performance (rank in attracting inward investment) and its
potential for attracting inward investment. We can see that its performance has improved significantly
since 2006. Between 2006 and 2009 it moved from being ranked 123rd
in the world to being ranked
68. However, its rank for potential has remained virtually unchanged. This suggests that Rwanda is
performing better in attracting inward investment than would be predicted from the economic
structural variables that are used to measure investment potential. This may be related to post-conflict
recover and the stable government that has been created with a reputation for fighting corruption but
this is only speculation.
Table 11: Rwanda Ranking UNCTAD FDI Performance Index and Potential Index 2000-200916
Rank out of 141 countries 2000 2005 2006 2007 2008 2009
Performance Rank17 121 128 123 105 97 68
Potential Rank18 138 130 136 140 139 (Source: UNCTAD www.unctad.org/sections/dite_dir/docs last accessed 1.05.2011)
Economic Growth
We have already discussed above the impressive growth in GDP between 2000 and 2010 and
especially since 2008. We have seen above that there has been a large growth in the number of
projects started by those issued with investors’ certificates. However as Figure 6 shows the number of
new business registrations by both companies and individuals greatly exceeds the number of projects
stated by investors issued with certificates. The pattern of increase follows much the same for new
company registrations as the starting of new projects by those issued with an investor’s certificate.
Figure 6: New Business Registration and Investment Certificates Issued for New Start-ups –
FDI and Domestic Investment
16
The FDI Potential Index is a composite measure of a country’s attractiveness to FDIs and is made up of 12 economic and structural
variables including measures of the size of the market, openness, ICT, energy use, education, country risks and investment in research and
development. 17
The ratio of the country’s share in Global FDI inflows and its share in global GDP. 18 A composite index of 12 economic and structural variables that have been shown to influence FDI, see Section 8, Conclusions and Recommendations, for more information.

34
(Source: Data supplied by RDB May 2011)
Increase in Tax Revenues
Fiscal revenue has increased every year since 2000 (Figure7). It stood at 68 billion RWF in 1998 and
by 2010 had risen to 426 billion RWF, a 626.5 per cent increase in revenue. However, while the
amount collected in taxes has risen, the proportion of revenue to GDP has increased only marginally.
It stood at 11.1 per cent of GDP in 1999 and 12.4 per cent in 2010. The proportion of taxes
contributed by direct taxes and taxes on goods and services increased sufficiently to compensate for
the decline in customs duty as a result of EAC harmonisation between 2007 and 2010.
Figure 7: Fiscal Revenue (Including TCCs) 1998-2010 in Billions RWF
(Source: Data supplied by RRA
A number of our respondents argued that the tax foregone through tax incentives to investors was
compensated for by the increase in PAYE revenue. It is difficult to determine which types of
businesses are contributing to increased tax revenues. The number of new large taxpayers registered
with RRA has been very modest and the main increase in numbers has come through the increase in
small and medium companies paying profit tax and the increase in the number of tax payers. The
growth in the number of tax payers is likely to have come mainly from new business not in receipt of
investors’ certificates and from the RRA drive to register businesses in the informal sector. The
number of people paying PAYE doubled from just under four and a half thousand to just under nine
thousand but it is not possible to tell how much of this increase was due to a growth in the labour
market because of new investment by those with investors’ certificates, new start ups by those without
certificates or due to the successful drive by RAA to register firms previously in the informal sector
(Table 12).
Table 12: Growth of Registered Taxpayers
Registered for
2006 2007 2008 2009 2010
VAT 2,637 3,741 4,644 6,811 8 ,173
PAYE 4,495 9,285 8,929 13,687 17,508
Profit Taxes 4,205 11,842 20,676 29,900 40,604
Large Taxpayers 284 289 311 334 339 (Source: RRA 2007, RRA 2008, Data supplied by RRA)

35
Employment Creation
Figure 8 shows the number of jobs created by investment projects19
since 2000. It shows a dramatic
increase. It also shows that domestic investment projects have created more jobs than FDI although
the latter have invested more money in projects. In total 44,048 new jobs were created by investors
between 2006 and 2010, an average of 8,810 a year. This is an impressive figure but has to be seen in
the context of Rwanda needing to create around 143,000 jobs each year just to absorb new labour
market entrants (UNCTAD 2006). Investment projects have created only about six percent of the jobs
needed a year on average
Figure 8: Number of Jobs Created by Registered Investors 2000-2010
(Source: Data supplied by RDB)
Exports and Balance of Trade
There was a growth in exports between 2003 and 2008, but with a decline in 2009 due to the world
economic crisis. Rwanda’s merchandised exports as a per cent of GDP increased from 40.8 per cent in
2000 to 53.1 per cent in 2008 but fell back to 42.8 per cent in 2009 (Figure 9). Over the same period
the trade in services increased from 5,5 per cent of GDP to 12,3 per cent falling back to 11.5 per cent
in 2009.Rwanda’s exports are dominated by three products - tea, coffee and base metal accounting for
71.9 per cent of commodity exports by value in 2008, down from 94.4 per cent in 2001. There is some
evidence of export diversification, although of the twenty top exports by value in 2008 seven were
primary, eight were resource based, three were low technology, and one was medium technology and
there was one other transaction (UN Comtrade). Tea (362%), coffee (15.6%) and metals (27.3%)
continue to dominate. The highest growth rate between 2001 and 2008 for other products was 126 per
cent for alcoholic beverages, 235 per cent for vegetables and 138 per cent for non-alcoholic
beverages, but these only accounted for 5.4 per cent, 3.7 per cent and 3.7 per cent of exports in 2008.
Of areas prioritised by government for growth the export value of vegetables and hides and skins,
both in the top twenty of exports by value grew by 138 per cent and 17 per cent respectively.
Figure 9: Merchandised Trade and Trade in Services as Per Cent GDP 2000-2009
19 RDB records the number of jobs investors plan to create not the number they actually provide.

36
(Source: World Bank Data http://data.worldbank.org/topic/private-sector last accessed 03.05.2011)
Although there has been a growth in exports the balance of trade has worsened as imports have also
increased significantly. Exports grew from 71 billion RWF in 2000 to 245 million RWF in 2010 while
at the same time imports grew from 270 billion RWF in 2000 to 718 billion RWF in 2010, in constant
2006 prices. The trade deficit worsened as a consequence from -199 billion RWF in 2000 to -476
billion RWF in 2010 (NISR 2011a) (Figure 10).
Figure 10: Net Barter Terms of Trade Index 2000-2009 (2000=100)
(Source: World Bank Data http://data.workldbank.org/topic/private-sector last accessed 03.04.2011)
It is worth noting that rate of increase in imports of capital goods and intermediary goods (measured
by value) has gone up at a marginally faster rate than has that of consumer goods, although there was
a decline in the growth in 2009 while the imports of consumer goods and fuel continued to increase
(Figure 11). The growth in capital and intermediary goods could been seen as the initial requirements
for investing in the manufacturing and service sectors but the continuing growth in imports also
indicates that growing demand is driving an increase in imports. Domestic production is not able to
neither absorb this increased in demand nor increase exports to match the growth in imports.
Figure 11: Growth in Imports in US$ Million
(Source: NBR 2010, P54)
Conclusions
Our analysis has shown a strong correlation between the introduction of a number of tax incentives
for foreign and domestic investors, as well as some more broadly targeted at the private sector and
process in achieving government objectives. There has been economic growth, an increase in
investment in new businesses, an increase in employment in the formal sector, an increase in tax
revenues and a diversification and increase in exports. However, we cannot demonstrate causation.
The increase in investment may not be due to the availability of incentives but to other factors making
Rwanda a more attractive country in which to invest. Most notable is the dramatic improvement in

37
Rwanda’s rank in the Doing Business Index (see Table A2.1 and e.g. Esson and Zolt 2010; Groh and
Wich 2009; IMF2006; Krugell and Matthe 2008; Perry 2011b).
However, we have been able to show that registered investors only account for a small proportion of
newly registered business, that the increase in taxes is due to RRA’s drive to formalise the informal
sector and the growth more generally in enterprises. Employment created by registered investors is at
best only six per cent of the new jobs required to absorb new entrants to the labour market. Even then
domestic investors have created more jobs than foreign ones. There has been investment by registered
investors in the sectors prioritised by the government but it has been uneven. The number of
registered projects in tourism and construction increased significantly between 2006 and 2010
compared to 200-0 and 2005 but the number in manufacturing registered a slight decline and remains
low in total. Yet investment in the manufacture of high value goods like pharmaceuticals for export is
essential for export diversification and the sustainability of increasing exports.
There is clearly a need for further analysis, although as we have pointed out it is difficult to carry out
a cost benefit analysis. The cost is clearly the amount of tax foregone and the benefits are the extent to
which the money invested has brought an adequate return in terms of meeting the government’s
objectives for the investment. Such an analysis would require collecting data at the level of the firm
on a range of factors including: jobs created for Rwandans and the quality of the jobs; taxes paid
including PAYE; the goods or services produced; the value of exports; the importing countries; the
training and research and development budget; local purchasing; and local subcontracting.

38
8. Conclusions and Recommendations
Taxation is essential for sustainable development; it supports the basic function of a sustainable state
and sets the context for economic growth. It is also essential for responsive government. The OECD
countries have an average domestic resource mobilisation of 35 per cent of GDP (Prichard 2010b)
compared with 13 per cent in Rwanda. Yet Rwanda foregoes a significant (and unknown) amount of
tax year each year without considering the costs and benefits of doing so or having any public
discussion. They are in effect hidden expenditures. Rwanda is the most generous of the EAC countries
in providing tax incentives for FDI and domestic investment. The government foregoes about a
quarter of its potential revenue each year in tax incentives from businesses alone.
The main purpose of this report was to raise the issue of tax incentives and exemptions. Are they too
generous for a country like Rwanda that is struggling to raise money to fund its development strategy?
Are they targeted at the right groups? Are they achieving the government’s objectives for them?
Would the money be better spent on other policy priorities like education or health? Why are the
amounts foregone not made publically available? Why is there no monitoring and evaluation of their
effectiveness and why has there been no cost benefit analysis of tax incentives for attract investment?
Should the amount foregone be considered as part of the Government’s budget so that it becomes
transparent expenditure?
We have shown that the amount foregone just in incentives and exemptions to businesses is
significant, amounting to 25 per cent of potential government revenue and 14 percent of the potential
government budget. It could be used to reduce reliance on ODA or external borrowing or increase
spending on health or education. The tax exemptions and incentives are generous relative to those
given in the other EAC member states.
Exempting a range of essential goods and services from VAT, (a regressive tax) benefits everyone
and especially the poor. The exemption of agricultural inputs from VAT is also of benefit to a large
percentage of the Rwandan population, and by keeping prices lower than they would otherwise be,
supports the Government’s efforts to get farmers to use more agricultural inputs to improve
production and reduce poverty. Tax exempt status for registered NGOs and religious organisations is
a way for the government to support from public funds social goods that are of benefit to society
generally or to specific groups. Often the services provided by these organisations would be provided
by government if they were not provided by the NGOs. Nevertheless VAT exemption and zero rating
is still tax foregone and there needs to be explicit criteria for determining what goods and services are
exempt or zero rated.
The exemption of a proportion of income from taxation so that the poor are exempt from paying tax is
also a widespread practice. However, exempting the first 12 million of turnover from taxation for
farmers may be considered over-generous. Non-farm small enterprises have to start paying tax when
their turnover exceeds 1.4 million RFW and a proportion with incomes below this threshold pay local
taxes from which farmers are also exempt. The same arguments for bring farmers into the tax net
applies as for other small businesses, developing a culture of tax compliance and holding government
to account for the expenditure of public (tax payers) money.
More controversial are the tax incentives and exemptions given to businesses. These include
businesses registered with the RDB as investors. The main beneficiaries are big businesses, many of
which are foreign owned although domestically owned businesses can benefit from some of the

39
incentives and exemptions. The largest amount is exemptions on imported goods amounting to 84 per
cent of the total while only 0.17 per cent is for employing Rwandans. The latter is generally regarded
as a preferable type of incentive as it rewards output. Our analysis of the costs of benefits of providing
tax incentives for businesses including attracting FDI and domestic investment is inconclusive but
there is a growing consensus that tax incentives may not work, or to the extent they do they have to be
used selectively and for a limited period (AfDB 2010; Klemm 2009; Petersen 2010, OECD 2011,
UNCTAD 2006). The government needs to balance supporting investment by providing a competitive
tax environment and ensuring that investors pay an appropriate share of the fiscal revenue. There is a
need to protect the tax base against sophisticated tax planning, that is businesses avoiding taxation by
taking advantage of incentives and then moving when they are no longer entitled to them. Also to be
aware that once introduced it is difficult to remove tax incentives.
Whether tax incentives and exemptions work or not, there is a need for transparency, public scrutiny
and dialogue, equity and bargaining are essential to building a culture of tax compliance.
Accountability of government to citizens is essential and taxation encourages citizens to make claims
on governments and hold them accountable for public expenditure (Brautigam 2008, Prichard 2010a;
see also Petersen ed. 2010).
Recommendations
The government:
1. develops an efficient and effective personal anc corporate tax system that is transparent and
fair to all;
2. publishes comprehensive information on all tax exemptions in an annex to the annual budget
giving details of the amount of revenue foregone due to tax incentives and exemptions;
3. puts in place mechanisms to monitor and evaluate tax incentives;
4. carries out a cost-benefit analysis of tax incentives for business
5. reviews the tax incentives that it offers and the list of goods that are exempt from VAT;
6. it works with the other members of the EAC to harmonise taxes including tax incentives and
exemptions.
40
References
African Development Bank Group (2010) Domestic Resource Mobilisation for Poverty Reduction in
East Africa: Rwanda Case Study. Regional Department East Africa.
Biggs, P. (2007). Tax Incentives to Attract Foreign Direct Investment. Meeting of Experts on FDI,
Technology and Competitiveness, UNCTAD, Paris, March.
Bigsten, A and Isaksson, A. (2008). Growth and Poverty in Rwanda: Evaluating EDPRS 2008 - 2012.
Stockholm: Swedish International Development Cooperation Agency.
Brautigam, D. (2008). Taxation and Governance in Africa: Take a Second Look. American Enterprise
for Public Policy Research: 1.
Byiers, B. (2009). Rwanda Industrial Capacity and Performance. Kigali: Kgali: Ministry of Trade
and Industry.
Cichello, P. and Sienaert, A. (2009). Making Work Pay in Rwanda: Employment, Growth and Poverty
Reduction.Washington DC: The World Bank.
Commission on Growth and Development (2008). The Growth Report: Strategies for Sustained
Growth and Inclusive Development. Washington DC: The International Bank for Reconstruction and
Development/The World Bank.
Doya, D. M. (2011). Rwanda Reported $381 million worth of investment Last Year. Bloomer: 17th
February.
East African Community (2010). A Draft Code of Conduct Against Harmful Tax Competition in the
East African Community.
Easson, A. and Zolt, M. (2010). Tax Incentive. Washington DC: World Bank Institute.
Flatters, F. (nd) Fiscal Challenges of Regional Integration www.frankflatters.com last accesses
26.03.2011.
Foreign Investment Advisory Service (2006) Sector Study of the Effective Tax Burden: Rwanda.
Gayi, S., Nkurunziza, J., Halle, M. and Kahra, S. (2007). Economic Development in Africa:
Reclaiming Policy space domestic Resource Mobilization and Development States. New York and
Geneva: United Nations.
Groh, P. and Wich, M. (2009). A Composite Measure to Determine a Host country’s Attractiveness
for Foreign Direct Investment. Madrid: IESE Business School, University of Navarra.
Godbout, A. (2009). Tax Informal Sector to Increase Revenue – Expert Rwanda News Agency
29.09.2009.
Gupta, S (2011). Domestic Resource Mobilization, Aid Dependency and Taxation. Paper given at
OECD Task Force Subgroup Meeting On Taxation, State Building and Aid, January.
Hansl, B., Niyibizi, P., Ronchi, L. and Mwumvaneza, V. (2011). Rwanda Economic Update: spring
Edition 2011. Kigali: The World Bank Group.
International Monetary Fund (2000). Rwanda: Recent Economic Development. IMF Report No 4.

41
International Monetary Fund (2006). Rwanda: Sixth Review Under the Three-Year Arrangement
Under the Poverty Reduction and Growth Facility, Requests for Waivers of No Observance Criteria
and Request for a New Three-Year Arrangement Under the PRGF- Staff Report. IMF Report No
06/245. Washington DC: International Monetary Fund.
International Monetary Fund (2007). Rwanda : Next Steps in RRA Modernisation. Washington DC:
International Monetary Fund, Fiscal Affairs Department.
International Monetary Fund (2011), Country Report No 11/19 Rwanda: 2010 Article IV Consultation
and First Review Under the Policy Support Instrument—Staff Report; Public Information Notice and
Press Release on the Executive Board Discussion; and Statement by the Executive Director for
Rwanda. www.imf.org/external/country/RWA/index last accessed 01.05.2011.
Kadede, T. (2011). EAC Experience in Regional Integration – Customs Policy Reforms and Taxation
Harmonization. Nairobi: IMF Conference on Resource Mobilization, March.
Kagarama, B. (2010). Reforms in Domestic Revenue Mobilisation: The Rwanda Revenue Authority
Story. Paper given at EAD Conference, Nairobi, March.
Kansdorff, M. (2010) Tax Incentives and foreign direct Investment in south Africa. Consilience: The
Journal of Sustainable Development 3: 68-86.
Klemm, A. (2009). Causes, Benefits and Risks of Business Tax Incentives. Washington DC:
International Monetary Fund.
Krugell, W. and Matthee, M. (2008) Measuring the Inward FDI Potential of South African Regions.
Paper given at the Regional Studies Association International Conference, Prague, May.
Ministry of Finance and Economic Planning (2007). Economic Development and Poverty Reduction
Strategy. Kigali: Government of Rwanda.
Ministry of Trade and Industry and Private Sector Federation (2011). Status of NTBs along the
Northern and Central Corridors – 2010. Kigali: Ministry of Trade and Industry and Private Sector
Federation.
Maliyamkono, T., Mason, H., Ndunguru, A., Osoro, N. E. and Ryder, A. (2009). Why Pay Tax? Dar
es Salaam: Tem Publishers and Siyaya Publishing (Pty) Ltd.
Malunda, D. And Musana, S. (2011) Rwanda Case Study on Economic Growth and Structural
Transformation: Report for the African Centre for Economic Transformation. Kigali: Institute of
Policy analysis and Research-Rwanda.
Mittah, H. (2009). Strategies for Improving the Quality and Accuracy of SMEs Bookkeeping. Paper
Presented to ITD Conference on Taxing micro and small Businesses, From Confrontation to
Cooperation. Kigali:April.
Mutsotso, C. (2010). Harmonisation of EAC Tax Policies and Laws. Geneva: CUTS Geneva Resource
Centre.
National Bank of Rwanda (2009). Annual Report 2009. Kigali: National Bank of Rwanda.
National Institute of Statistics (2011a). GDP Annual Estimates (2010) Based on 2006 Benchmark.
Kigali: Government of Rwanda.
42
National Institute of Statistics (2011b). National Accounts of Rwanda fiscal Year Estimates 2009/10.
Kigali: Government of Rwanda.
Newfarmer, R. (2010). Rwanda: Sustaining Rapid Growth. London: International Growth Centre.
OECD (2011). Task Force Subgroup Meeting on Taxation, State Building and Aid, January,
Washington DC.
Oluoch-Ojiwah, F. (2009). Rwanda FDI Worth US$600m Recorded in 2009. Kigali: The New Times,
31.12.2009.
Perry, V. (2011a). Revenue Mobilisation in Sub-Saharan Africa International Monetary Fund . Paper
given Nairobi, March.
Perry, V. (2011b). Corporate Taxation in Developing Countries. Paper given at OECD Task Force
Subgroup Meeting On Taxation, State Building and Aid, January.
Petersen, H. (ed) (2010). Tax Systems and Tax Harmonisation in the East African Community:
Report for GTZ and the General Secretariat of the EAC on Tax Harmonization and Regional
Intergreation. Potsdam: University of Potsdam.
Prichard, W. (2010a). Taxation and State Building: Towards a Governance Focused Tax Reform
Agenda. Institute of Development Studies Working Paper Number 341. Sussex: University of
Sussex.
Prichard, W. (2010b). Citizen- State Relations: Improving Governance Through Reform in Taxation.
Organisation for Economic Cooperation and Development.
Private Sector Federation (2008). Business and Investment Climate Survey. Kigali: Private Sector
Federation.
Roburika, S. (2011). Rwanda to Look Beyond doing Business. The Rwanda Focus: March 30th
Roca, J. (2010). Evaluation of the Effectiveness and Efficiency of Tax Benefits. Washington DC: Inter-
American Development Bank.
Rusuhuzwa, T. and Baricako, J. (2009). The Global Finacial Crisis ,Sslowing Private Capital Inflows
and Economic Growth in Rwanda and Burundi. Africa Economic conference 2009: Fostering
Development in an Era of finical and Economic Crisis. November, Addis Ababa.
Rwanda Development Board (2010). Trade Policy (draft). Kigali: Government of Rwanda.
Rwanda Development Board (2010). Rwanda Investors Info Pack. Kigali: Government of Rwanda.
Rwanda Revenue Authority (2011). Annual Activity Report for 2009/2010. Kigali Rwanda Revenue
Authority.
Rwanda Revenue Authority (2009). Annual Activity Report for2008. Kigali Rwanda Revenue
Authority.
Rwanda Revenue Authority (2008). Annual Activity Report for2007. Kigali Rwanda Revenue
Authority.

43
Rwanda Revenue Authority (2007). Annual Activity Report for2006. Kigali Rwanda Revenue
Authority.
Schneider, F. (2007). Shadow Economies and Corruption all Over the World: New Estimate for 145
Economies. The Open- Access E-Journal:1
Schwab, K. (ed) (2010) (Almonia, J., Blanke, J., Browne, C., Annoni, P., Hanouz, M., Nardo, M.,
Geiger, T., Xavier, S. and Mia, I.). The Global Competitiveness Report 2010-2011. Geneva: The
World Economic Forum.
United Nations Conference on Trade and Development (2011a). Foreign Direct Investment in LDCs:
Lessons Learnt form the Decade 2001-2010 and the Way Forward. New York and Geneva: United
Nations.
United Nations Conference on Trade and Development (2011b). World Investment Report 2010. New
York and Geneva: United Nations.
United Nations Conference on Trade and Development (2010). Rwanda’s Development Driven Trade
Policy Framework (prepared by UNCTAD and the Ministry of Trade and Industry Rwanda). New
York and Geneva: United Nations.
United Nations Conference on Trade and Development (2006). Investment Policy Review Rwanda.
New York and Geneva: United Nations.
United Nations Industrial Development Organisation (2007) (2nd ed). Africa Foreign Investors
Survey 2005. Understanding the Contribution of Different Investor Catrgories to Development-
Implications for Targeting Strategies. Vienna:UNIDO.
Uwazi (2010) Tanzania’s Tax Exemptions: Are they Too High and Making us Too Dependent on
Foreign Aid. Policy Brief TZ.12/2010E. Dar es Salaam: Uwazi at Uwaweza.
World Bank and International Finance Corporation (2010). Doing Business 2011: Making a
Difference for Entrepreneurs. Washington: The International Bank for Reconstruction/The World
Bank.
World Bank (2009). Paying Taxes 2010: The Global Picture. Washington: World Bank.
World Bank (2007). Rwanda. Toward Sustained Growth and Competitiveness. Kigali: World Bank.
Laws and Ministerial Orders
Commissioner General’s Rules No 01/2001of 01/08/2001 Governing VAT. No 02/2002 of 30/12/2002
and No 04 of 02/06/2005.
Law N° 06/2001 of 20.01.2001 On the Code of Value Added Tax.
Law N° 25/2002 OF 18/07/2002 Fixing the Import Duty Tariff on Imported Products.
Law Nº 16/2005 of 18.08.2005 on Direct Taxes on Income.
Law No 26/2005 of 17/12/2005 Relating to Investment and Export Promotion and Facilitation.

44
Law n° 26/2006 of 27.05.2006 Determining and Establishing Consumption Tax on Some Imported
and Locally Manufactured Products.
Law No 32/2007 of 30/07/2007 Establishing the Rwanda Commercial Registration of Services Agency
and Determining its Responsibilities, Organisation and Functioning.
Law No 005/2008 of 14/02/2008 On Arbitration and Conciliation in Commercial Matters
Law No 53/2008 of 02/09/2008 Establishing the Rwanda Development Board.
Law n° 73/2008 and Law n° 74/2008 of 31.12.2008 Modifying and Implementing Law No. 16/2005 of
18.08.2005 on Direct Taxes on Income.
Law No75/2008 of 31/12/2008 Modifying and Complementing Law No 26/2006 of 27/05/2006
Determining and Establishing Consumption Tax on Some Imported and Locally Manufactured
Products.
Law N° 19/2009 of 30/06/2009 Law Modifying and Complementing the Law n° 26/2006 of
27/05/2006 Determining and Establishing Consumption Tax on some Imported and Locally
Manufactured Products.
Law Nº 24/2010 of 28/05/2010 Law Modifying and Complementing Law n° 16/2005 of 18/08/2005 on
Direct Taxes on Income.
Law No 26/2010 of 28/05/2010 Governing the Holding and Circulation of Securities.
Law No 28/2010 Modifying and Complementing Law N0 26/2006 of 27/05/2006 Determining and
Establishing Consumption Tax on Some imported and Locally Manufactured Products as Modified
and Complemented to Date.
Law N° 29/2010 of 30/06/2010 Law modifying and Complementing Law n°06/2001 of 20/0.1/2001 on
the Code of Value Added Tax.
Law No 30/2010 of 30/06/2010 Determining the State of Finances for the 2010 Fiscal Year.
Ministerial Order No 001 of 13/01/2003 Providing for Value Added Tax Rules and Taxation
Procedure.
Web sites
Fiscal Reform and Economic Governance www.fiscalreform.net
Heritage foundation wwww.heritage.org
International Monetary Fund www.imf.org
Ministry of Finance and Economic Planning www.minecofin.gov.rw

45
Ministry of Trade and Industry www.minicom.gov.rw
National Institute of statistics Rwanda http://statistics.gov.rw
Rwanda Development Board http://www.rdb.rw
Rwanda Revenue Authority http://rra.rw
Transparency International www.transparency .org
Data Bases
OECD International Development Statistics Database http://www.imf.org/external/data.htm
World Bank Data http://data.worldbank.org
World Bank Trade Restrictiveness Index http://info.worldbankorg/etools/wti
International Trade Centre http://investmentmentmap.org
World Trade Organisation http://stat.org/CountryProfile/WSDBCountryPSView.aspx?

46
Appendices

47
Appendix 1 Institutions and Individuals Interviewed
Rwanda Revenue Authority (4)
Rwanda Development Board (3)
Ministry of Trade and Industry
Ministry of Finance and Economic Planning
Ministry of East African Community
Ministry of Infrastructure (2)
Trade Unions (2)
Parliament
AfDB
GTZ
DfID
IMF
EC
KPMG
Gender Monitoring Office
NUR (3)
SFB
UN Women
Bralirwa (nominated by PSF)
Investors
TIGO (telecommunications)
KCB (financial services)
Ameki Colour

48
Appendix 2 Additional Tables
Table A2.1: Location F actors Ranked by Importance for Investing in Sub-Saharan Africa
Rank Factor Score
1 Economic stability 4.11
2 Political stability 4.08
3 Physical security 3.96
4 Local market 3.93
5 Skilled labour 3.83
6 Quality of infrastructure 3.79
7 Legal framework 3.68
8 Presence of key clients 3.65
9 Labour costs 3.65
10 Transparency of investment climate 3.61
11 Quality of life 3.49
12 Raw materials 3.41
13 Incentive package 3.3
14 Local supplier 3.23
15 Existence of foreign investor 3.12
16 Government agency support services 3.10
17 Regional market 3.08
18 Double taxation treaties 2.74
19 Bilateral trade agreements 2.74
20 IPA assistance 2.72
21 Acquisition of existing assets 2.63
22 Availability of export processing zones 2.55
23 Specific investment project proposal 2.23
24 Presence of JV partner 2.23
25 Taking advantage of AGOA 2.03
26 Taking advantage of EBA 1.94 (Source UNID0 2007)
This score reflects the mean value of the5-point Likert Scale (1=not important, 2=helpful,3=important, 4= very important, 5= crucial) in a
survey of 1,216 foreign affiliates in sub-Saharan Africa undertaken in 2005.

49

50
Table A2.2: Summary of Taxes in the EAC
Tax Burundi Kenya Rwanda Uganda Tanzania Corporation
Reductions/Exemptions
35%
Zone Franche – tax relief on
certain conditions.
Export non-traditional products -
17.5%
Certain enterprises exempt for 10
years and then taxes at 15%
10% reduction enterprises meet
conditions who employ more
than 100 Burundians Leasing and hire purchase
enterprises exempt for 3 years
and the 20% for next 4 years.
30% (non-resident 37.5%)
EPZ -10 years 0%
10 years 25%
Newly Listed Companies
Listed under the Capital
Markets Act
20% issued shares listed 1st 3
years – 27%
30% issued shares listed 1st -5
years – 25%
40% issued shares listed 1st 5
years – 20%
Non resident
Shipping operators- 2.5% of gross
Transmission of messages – 5%
Capital Allowances
Qualifying investment exceeding
230m US$ outside /Nairobi/Mombassa/Kismu.
150%
Other qualifying investment 100%
Hotels/education building 50%,
qualifying residential/commercial building
25%, other qualifying building
10% (all once only)
Farms works – 100% (once only)
30%
FTZ – 0% indefinitely (exempt
from withholding tax and can
repatriate profits tax free)
Registered Investors
Profit tax discount of 2% if employs 100-200
Rwandans
5% if employs between 201-400 6% if employs between 401-900
7% if employs over 900
Export Tax Discount
Bring to country revenue
US$3m-5m 3% US$ 5m + 5%
Investment Allowance
Registered Investor
Kigali – 40%
Outside Kigali – 50%
30%
Exporters of 80+ finished
consumer r +capital goods out
of EAC exempt for 10 years
Agro-processing for
consumption in Uganda – exempt.
Operators of aircrafts – exempt Education institutions- exempt.
Capital Allowance
Industrial buildings/hotels (20%
initial + 5% annual write down allowance)
Plant/machinery (50%/75%
initial20 + annually on reducing balance 2030/35/40%)’
Commercial buildings (straight
line 5%)
30%
EPZ/SEZ- 10 years tax holiday
Newly listed company -25% for 3 years
Capital Deductions
Buildings (straight line)
(agriculture/livestock/fisheries
20%. other 5%) Plant/machinery (initial
allowance) (agriculture 110%,
manufacturing 50%) Plant/machinery (reducing
balance Class 1 37.5%, Class 2
25%, Class 3 12.5%
Mining exploration/development
-100% Agriculture-
improvements/research and
development 100%
Capital Gains 35% Suspended June 1985 Taxed as business profit (none
on private property)
30% 30% (individual 10% for
Tanzania asset)
Presumptive Tax on Small
Businesses
3% (Turnover below 58,000
US$)
less than 2,400 US$ - 0%
2,400 US$ - 34.000 US$ - 4%
Less than 2,100 US$ - 0%
2,100 US$ - 21,000 US$ - 1%
Less than 16,000US$ - graded
from about 1.1% to 3.3%
PAYE - Taxable Income and
rate - month
Top rate 35 % Tax free income 130 US$
11921
Tax Bands
1.51US$- 0%
2. 119US$ -20%
3. over 119US$ -30%
1. 56US$ - 0%
2. 97US$ -10%
3. 172 US$ - 20%
5. 84US$- 0%
6. 234US$ - 14%
7. 351US$ - 20%
20
50% Entebbe, Jinja, KAMPALA, Namanve, Njeru/75% other 21
XE Converter www.xe.com as 28th
May 2011
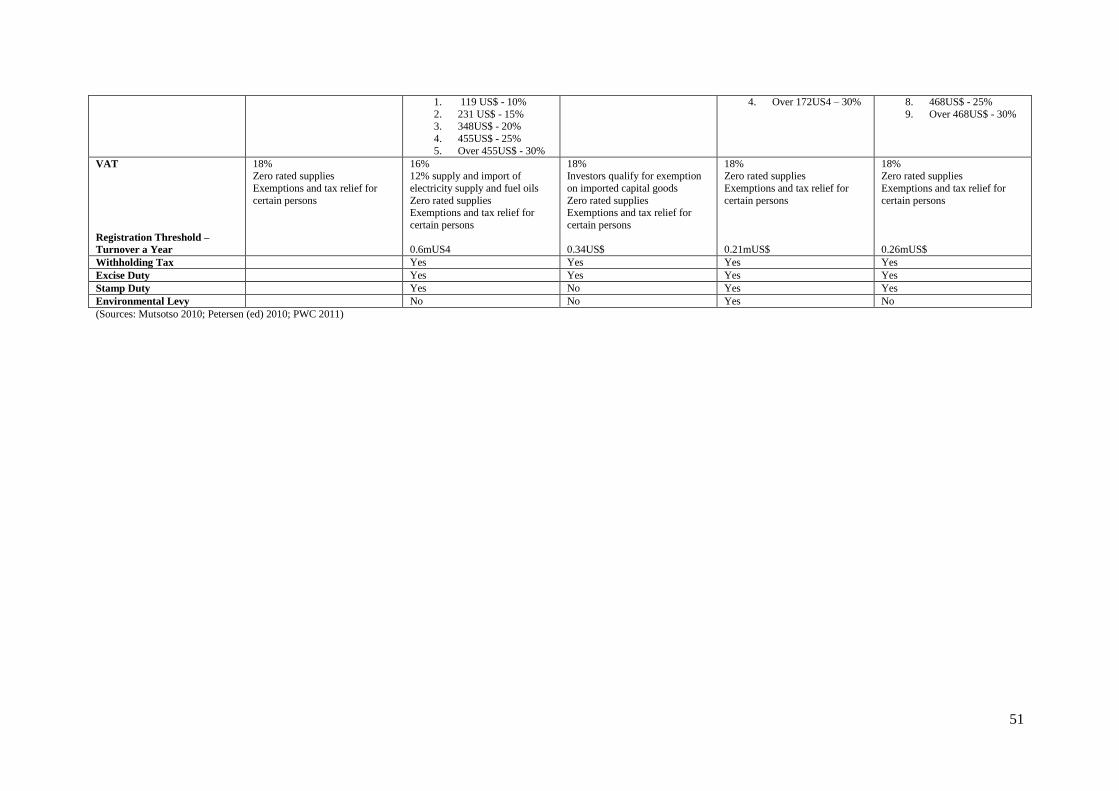
51
1. 119 US$ - 10%
2. 231 US$ - 15% 3. 348US$ - 20%
4. 455US$ - 25%
5. Over 455US$ - 30%
4. Over 172US4 – 30% 8. 468US$ - 25%
9. Over 468US$ - 30%
VAT
Registration Threshold –
Turnover a Year
18% Zero rated supplies
Exemptions and tax relief for
certain persons
16% 12% supply and import of
electricity supply and fuel oils
Zero rated supplies
Exemptions and tax relief for
certain persons
0.6mUS4
18% Investors qualify for exemption
on imported capital goods
Zero rated supplies
Exemptions and tax relief for
certain persons
0.34US$
18% Zero rated supplies
Exemptions and tax relief for
certain persons
0.21mUS$
18% Zero rated supplies
Exemptions and tax relief for
certain persons
0.26mUS$
Withholding Tax Yes Yes Yes Yes
Excise Duty Yes Yes Yes Yes
Stamp Duty Yes No Yes Yes
Environmental Levy No No Yes No
(Sources: Mutsotso 2010; Petersen (ed) 2010; PWC 2011)
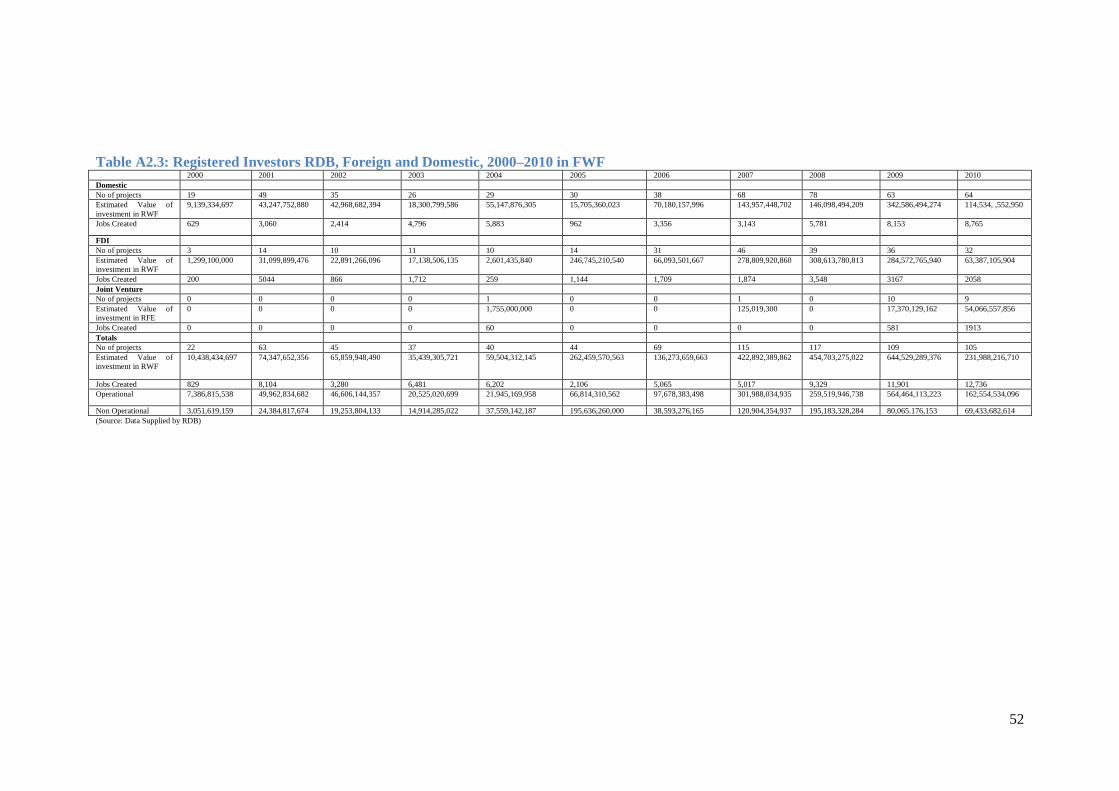
52
Table A2.3: Registered Investors RDB, Foreign and Domestic, 2000–2010 in FWF 2000 2001 2002 2003 2004 2005 2006 2007 2008 2009 2010
Domestic
No of projects 19 49 35 26 29 30 38 68 78 63 64
Estimated Value of
investment in RWF
9,139,334,697 43,247,752,880 42,968,682,394 18,300,799,586 55,147,876,305 15,705,360,023 70,180,157,996 143,957,448,702 146,098,494,209 342,586,494,274 114,534, ,552,950
Jobs Created 629 3,060 2,414 4,796 5,883 962 3,356 3,143 5,781 8,153 8,765
FDI
No of projects 3 14 10 11 10 14 31 46 39 36 32
Estimated Value of
investment in RWF
1,299,100,000 31,099,899,476 22,891,266,096 17,138,506,135 2,601,435,840 246,745,210,540 66,093,501,667 278,809,920,860 308,613,780,813 284,572,765,940 63,387,105,904
Jobs Created 200 5044 866 1,712 259 1,144 1,709 1,874 3,548 3167 2058
Joint Venture
No of projects 0 0 0 0 1 0 0 1 0 10 9
Estimated Value of
investment in RFE
0 0 0 0 1,755,000,000 0 0 125,019,300 0 17,370,129,162 54,066,557,856
Jobs Created 0 0 0 0 60 0 0 0 0 581 1913
Totals
No of projects 22 63 45 37 40 44 69 115 117 109 105
Estimated Value of
investment in RWF
10,438,434,697 74,347,652,356 65,859,948,490 35,439,305,721 59,504,312,145 262,459,570,563 136,273,659,663 422,892,389,862 454,703,275,022 644,529,289,376 231,988,216,710
Jobs Created 829 8,104 3,280 6,481 6,202 2,106 5,065 5,017 9,329 11,901 12,736
Operational 7,386,815,538 49,962,834,682 46,606,144,357 20,525,020,699 21,945,169,958 66,814,310,562 97,678,383,498 301,988,034,935 259,519,946,738 564,464,113,223 162,554,534,096
Non Operational 3,051,619,159 24,384,817,674 19,253,804,133 14,914,285,022 37,559,142,187 195,636,260,000 38,593,276,165 120,904,354,937 195,183,328,284 80,065.176,153 69,433,682,614
(Source: Data Supplied by RDB)

53

54
Table A2.4: Registered Investors RDB, Projects by Sector, FDI and Domestic 2000-2010 Sector 2000 2001 2002 2003 2004 2005 2006 2007 2008 2009 2010
Infrastructure/Tr
ansport
No 0 1 2 0 1 1 0 1 2 4 0
Value 0 28801500 1588829481 0 2942443795 68432280 0 1685600000 1784100126 462894595
0
0
Energy No 0 0 0 0 1 4 2 6 5 9 10
Value 0 0 0 18135000000 120570292600 3639350707 62220750574 9336080200 195969113
753
36547194602
Mining No 0 5 2 1 1 1 5 7 11 2 8
Value 0 2633437884 2299500000 97588461 29000000 2697600000 30585520000 9591632944 26899559650 676875000
0
7188413025
ICT No 0 6 4 2 2 1 4 8 1 2 3
Value 0 9426861218 14290710850 4941039140 693300000 11200000000 3016104800 111518304800 550000000 682394000
00
15209000000
Financial Sector No 0 0 0 0 0 1 1 2 4 1 0
Value 0 0 0 0 0 1500000000 3292800000 7574249000 158733550461 553468084
6
0
Construction No 1 5 0 0 1 5 15 13 18 24 17
Value 1232369338 7249265140 0 0 13700000000 83346747962 30900883362 20875067279 33205478965 270718950
722
53022899149
Tourism No 5 11 6 6 7 5 18 31 35 32 24
Value 3533326778 13706453355 7684328079 4021964000 14897556185 2689268377 30021551011 153576348955 155042333484 267884995
73
62067323103
Manufacturing No 10 16 13 18 8 8 4 16 12 19 16
Value 3937725102 6769384312 4537943469 6518437481 5581970500 32545800000 5669221828 6950113456 9580724682 380115351
21
7491323500
Media No 1 2 2 0 3 3 3 9 9 3 5
Value 250000000 774017000 321600000 0 343093355 581660000 6670161258 2622344600 2058435432 72406283 1724631209
Agriculture No 3 9 6 4 11 11 9 13 10 6 15
Value 281693400 9467678948 1737743285 5972701600 4010352858 2600376044 16355919447 31762366108 3751077508 235204659
46
41136989326
Services No 2 4 10 5 4 2 3 5 7 3 2
Value 1203320079 1931475825 33399293326 13807875039 1678536230 187485800 606524000 3411893000 48143109546 195766915
8
1659502610
Education and
Health
No 0 0 0 0 0 1 2 3 2 1 4
Value 0 0 0 0 0 266321440 622707250 10530495814 1218824968 228000000 5752325186
Others1 No 0 4 0 1 1 1 3 1 1 3 1
Value 0 22360277174 0 79700000 141259222 3580695540 4892916000 573773332 4400000000 143907202
4
188615000
Total 22 63 45 37 40 44 69 115 117 109 105
(Source: Data Supplied by RDB)
1 Beverage, Textiles, Hides and Skins, Fishery, Leather,