Embed Size (px)
Citation preview
Policy Research Working Paper 5844
East Africa’s Infrastructure
A Continental Perspective
Rupa RanganathanVivien Foster
The World BankAfrica RegionSustainable Development UnitSeptember 2011
WPS5844P
ublic
Dis
clos
ure
Aut
horiz
edP
ublic
Dis
clos
ure
Aut
horiz
edP
ublic
Dis
clos
ure
Aut
horiz
edP
ublic
Dis
clos
ure
Aut
horiz
edP
ublic
Dis
clos
ure
Aut
horiz
edP
ublic
Dis
clos
ure
Aut
horiz
edP
ublic
Dis
clos
ure
Aut
horiz
edP
ublic
Dis
clos
ure
Aut
horiz
ed
Produced by the Research Support Team
Abstract
The Policy Research Working Paper Series disseminates the findings of work in progress to encourage the exchange of ideas about development issues. An objective of the series is to get the findings out quickly, even if the presentations are less than fully polished. The papers carry the names of the authors and should be cited accordingly. The findings, interpretations, and conclusions expressed in this paper are entirely those of the authors. They do not necessarily represent the views of the International Bank for Reconstruction and Development/World Bank and its affiliated organizations, or those of the Executive Directors of the World Bank or the governments they represent.
Policy Research Working Paper 5844
Sound infrastructure is critical for growth in East Africa. During 1995–2005, improvements in infrastructure boosted growth by one percentage point per year, due largely to wider access to information and communication technologies (ICTs). Although power infrastructure sapped growth in other regions of Africa, it contributed 0.2 percentage points per year growth in East Africa. If East Africa’s infrastructure could be improved to the level of the strongest performing country in Africa (Mauritius), regional growth performance would be boosted by some six percentage points, with power making the strongest contribution. East Africa’s infrastructure ranks behind that of southern and western Africa across a range of indicators, though in terms of access to improved sources of water and sanitation and Internet density, it is comparable with or superior to the subcontinent’s leader, southern Africa. By contrast, density of fixed-line telephones, power
This paper is a product of the Sustainable Development Unit, the Africa Region. It is part of a larger effort by the World Bank to provide open access to its research and make a contribution to development policy discussions around the world. Policy Research Working Papers are also posted on the Web at http://econ.worldbank.org. The author may be contacted at [email protected].
generation capacity, and access to electricity remain extremely low, though utility performance is improving through regional power trades. The road network is relatively good, although with some lengths of poor-quality or unpaved roads. Surface transport is challenged by border crossings, port delays, slow travel, limited railways, and trade logistics, but the region has a relatively mature and competitive trucking industry. Air transport benefits from a strong hub-and-spoke structure but has made little progress toward market liberalization. Of the seven countries in the region, four are landlocked, two have populations of fewer than 10 million people, and two have an annual gross domestic product of less than $10 billion. The difficult economic geography of East Africa makes a regional approach to infrastructure development necessary to achieve further improvement.
East Africa’s Infrastructure: A Regional Perspective
Rupa Ranganathan and Vivien Foster
Acknowledgments
This paper draws on contributions from sector specialists from the Africa Infrastructure Country
Diagnostic Team; notably, Heinrich Bofinger on air transport, Michael Minges on information and
communication technologies, and Alvaro Federico Barra on spatial analysis.
The paper is based on data collected by local consultants and benefited greatly from feedback
provided by colleagues in the relevant World Bank teams; notably Yusupha Crookes (director of the
Africa Regional Integration Department), Andrew Roberts (Africa Regional Integration Department),
Gael Raballand (transport), and Charles Kunaka (International Trade Department). The paper benefited
from feedback provided by REC staff at a May 2010 Workshop organized by the Infrastructure
Consortium for Africa in Tunis and at other meetings.
iii
Contents
List of figures iii
List of tables iv
Synopsis v
1 Introduction 1
Why infrastructure matters 2 Why regional integration matters 3 The state of East Africa’s infrastructure 5
2 Transport 7
Surface transport 9 Roads 17 Railways 18 Ports 21 Air transport 27
3 Power 36
4 Information and communication technologies 47
5 Regional infrastructure funding 58
Bibliography 61
List of figures
Figure 1.1a. Infrastructure‘s historic contribution to economic growth, 1995-05 2 Figure 1.1b. Infrastructure‘s potential future contribution to economic growth (% GDP per capita per year) 2 Figure 1.2a. Topographical profile of East Africa 3 Figure 1.2b. Spatial distribution of economic activity within East Africa 4 Figure 2.1a . Condition of East Africa‘s regional road network 7 Figure 2.1b . Traffic volumes on East Africa‘s regional roads 8 Figure 2.1c . East Africa‘s regional railways and ports 9 Figure 2.2. EAC‘s main regional road corridors 12 Figure 2.3. Time required to import goods by road through alternative gateways 16 Figure 2.4. Cost of importing goods by road through alternative gateways 17 Figure 2.5. East Africa‘s railway network 19 Figure 2.6. Traffic density on African railways 20 Figure 2.7. East Africa‘s port network 22 Figure 2.8. Ratio of current demand to reported capacity 23 Figure 2.9. Average wait times in East Africa compared with ports worldwide 25 Figure 2.10. East Africa‘s regional airports and air traffic flows 27 Figure 2.11. International routes within Sub-Saharan Africa in 2007 28 Figure 2.12. Seats for intraregional travel within East Africa 29 Figure 2.13. Status of African safety oversight, using several criteria 32 Figure 2.14. Age distribution of airline fleet in East Africa 33 Figure 3.1. East Africa‘s regional power network and infrastructure 36 Figure 3.2. Regional spending needs as a percentage of GDP 40 Figure 3.3. Existing and simulated patterns of future power trade in EAPP, 2015 (TWh) 41
iv
Figure 3.4. Trade flows in EAPP in 2015 (TWh) 42 Figure 3.5. Net imports as a share of domestic demand (percentage) 43 Figure 3.6. Power generation mix 44 Figure 4.1. East Africa‘s ICT backbone infrastructure 47 Figure 4.2. Proposed fiber optic connectivity in East Africa 53 Figure 5.1. Spending for regional infrastructure as a share of GDP 59 Figure 5.2. Spending for regional infrastructure as a percentage of national infrastructure spending 59
List of tables
Table 1.2. Progress and challenges for regional integration in East Africa 6 Table 2.1. Relative performance of transport corridors in Africa 10 Table 2.2. Road condition along major transit corridors in East Africa 14 Table 2.3. Condition of East Africa‘s regional road network by member country, based on 2008 data 18 Table 2.4 . Performance of East African railways, 2005 21 Table 2.5. Growth in containerized and general cargo traffic between 1995 and 2005 22 Table 2.6. Comparative port performance across African regions 24 Table 2.7. Comparative performance across East African ports 24 Table 2.8. Benchmarking air transport in EAC and other regional economic communities 28 Table 2.9. International and domestic connectivity for 2007 (number of city pairs served) 29 Table 2.10. All flights from one week in November 2007 for EAC and East Africa 30 Table 2.11. Proportion of direct flights and speed of air service in East Africa 31 Table 2.12. Grading of the level of the implementation of the Yamoussoukro Decision 31 Table 2.13. Changes in air transport market in East Africa, 2001–07 32 Table 2.14. Air cargo freight rates 34 Table 3.1. Benchmarking power infrastructure and capacity, access, and utility performance 37 Table 3.2. Demand and suppressed demand in the East Africa Power Pool–Nile Basin countries 38 Table 3.3. Annualized costs of system expansion in EAPP, 2015 39 Table 3.4. Additional infrastructure requirements for trade expansion (MW) 39 Table 3.5. Differences in electricity production and CO2 emissions in trade expansion and stagnation 44 Table 3.6. Long-run marginal costs of power in EAPP 45 Table 3.7. Rate of return to power trade at country level 46 Table 4.1. Benchmarking ICT infrastructure across Africa‘s regional communities 48 Table 4.2. Benchmarking ICT in EAC member states 49 Table 4.3. GSM roaming in East Africa 49 Table 4.4. Foreign investors in the East Africa‘s telecom sector 51 Table 4.5. Prices of Internet and phone calls in Sub-Saharan Africa, with and without access to submarine cables 53 Table 4.6. ICT pricing trends for EAC countries, 2005–10 (US$) 54 Table 4.7. Gaps in intraregional connectivity and total investment required to attain minimum levels of regional connectivity 55 Table 4.8. Intercontinental and intraregional spending needs for East Africa for 10 years 55 Table 4.9. Summary of cost-benefit analysis of regional integration 56 Table 5.1. Annual regional spending requirements by sector over 10 years 58
Synopsis
Sound infrastructure is a critical determinant of growth in East Africa. Over the period 1995–2005,
improvements in infrastructure boosted growth in East Africa by one percentage point per year, an effect
attributable largely to the revolution in information and communication technologies (ICTs). Unlike other
regions of Africa, in which power infrastructure eroded growth, in East Africa, power infrastructure
contributed 0.2 percentage points per year. If East Africa’s infrastructure could be improved to the level
of the strongest performing country in Africa (Mauritius), regional growth performance would be boosted
by some six percentage points, with power making the strongest contribution.
East Africa’s infrastructure ranks consistently behind that of southern and western Africa across a
range of indicators. In areas such as access to improved sources of water and sanitation and Internet
density, however, East Africa’s performance is comparable with or superior to that of the regional
leader—southern Africa. Nevertheless, density of fixed-line telephones, power generation capacity, and
access to electricity in East Africa are extremely low even by African standards.
The difficult economic geography of East Africa makes it particularly important to take a regional
approach to infrastructure development. East Africa is characterized by small-scale economies, many of
which are physically cut off from key resources. The small size of these economies prevents the capture
of scale economies, making it difficult for governments to afford the high fixed costs associated with
infrastructure development. Of the seven countries in the region, four are landlocked, two have
populations of less than 10 million people, and two have a gross domestic product (GDP) of less than $10
billion. The Nile is the major transnational river that runs through the region, and most of the countries in
the region are riparian.
East Africa’s road network is in relatively good condition, with prominent patches of poor-quality
roads along some corridors and significant stretches of unpaved road. There are three main corridors in
the region. The northern corridor—which connects Kenya, Uganda, Rwanda, and Burundi, with a branch
heading north to Sudan—is the main trading corridor. The central corridor competes directly with the
northern corridor. It connects Tanzania, Burundi, Rwanda, and Uganda and extends into the northeastern
part of the Democratic Republic of Congo. The third corridor connects Addis Ababa to Djibouti in the
northern part of East Africa.
Surface transport in East Africa is challenged by border crossings and trade logistics but faces fewer
obstacles from the trucking industry which is comparatively mature and more competitive than in some
other subregions. In East Africa, road transport tariffs are on the order of $0.07 per tonne-kilometer,
compared with $0.05 per tonne-kilometer in southern Africa and $0.04 per tonne-kilometer in much of
the rest of the developing world. Nevertheless, in East Africa, trucking industry prices are determined by
market forces rather than restrictive regulations. Recent surveys based on transporter perceptions (World
Bank 2010b) indicate that logistics in East Africa are the worst in Africa, with bottlenecks exceeding
those in West Africa. The primary reason for the challenges appears to be a steep increase in traffic and
trade flows across borders without a corresponding improvement in infrastructure and in the policy
environment and institutions associated with cross-border trade.
EAST AFRICA’S INFRASTRUCTURE: A REGIONAL PERSPECTIVE
vi
Surface transport in East Africa is very slow when viewed against that of southern Africa and against
global standards. Widespread delays occur in ports, at border crossings, and in other processes. The
average effective velocity of road freight in East Africa is around 8 miles per hour, slower than the 11
miles per hour found in southern Africa. In both cases, freight is moving no faster than a horse and buggy.
This slow speed of freight movement has something to do with road infrastructure but even more to do
with the extensive delays suffered in ports, in administrative procedures such as border crossings and
customs clearance, and at informal checkpoints and roadblocks that keep trucks stationary for extended
periods of time.
The overall cost of moving a tonne of freight along East Africa’s key trade routes is on the order of
$200–300 and takes between 200 and 600 hours. The extensive dwell times in ports and in customs
clearance account for about 80 percent of the time. Shortening those delays could greatly reduce the time
needed to move imports from ports to landlocked capitals. The high costs of moving freight along East
African corridors correspond well with observed traffic patterns on roads and in ports. Reducing delays at
ports alone could shave off between $70 and $100 from the cost of moving a tonne of imports.
Except for Tazara, there is no real regional rail network within the East Africa, and the existing rail
networks are very lightly used, which complicates further regional integration. The national rail networks
of East African member states are mostly independent from each other, again with the exception of
Tazara, which is linked into the southern African network. This situation poses a stark contrast to
southern Africa, where interconnected national railway systems form a regional railway network that
spans half a dozen countries. Further integration of East Africa’s rail systems is complicated by the use
of various gauges in the region. The meter gauge is prevalent in most of East Africa, but in Tanzania, for
example, two railways lines operating in the same area use two different gauges. Only three East African
railway lines span more than one country. Poor operational performance, with the exception of Tazara
and TRC, and light use of existing rail networks, makes the economic case for integration even less clear.
The more pressing priority is to improve the performance of national systems to allow them to compete
more effectively with road transport.
In the ports sector, East Africa has two maritime hubs that anchor the regional transshipment
network but need significant improvements in performance across the board. The performance of East
African ports compares unfavorably with ports in southern Africa ports and lags far behind global best
practice in their costliness and timeliness. The services provided by East African ports cost nearly twice
as much as those in other global ports. Ports in East Africa also suffer from serious issues of overcapacity
and congestion. The international standard for dwell time is seven days or less, but in East Africa,
containers routinely spend more than a week in the terminal. The result is terminal congestion and port
inefficiencies.
With respect to air transport, East Africa has a strong hub-and-spoke structure that centers on two
regional hubs, but the region has made little progress toward market liberalization. Even if bilateral
connectivity is not strong among East Africa countries, connectivity with Nairobi or Addis Ababa, the
two regional hubs, ensures good connectivity across the region. In terms of market liberalization,
according to a recent study, the East African Community (EAC) has earned a middling score in its
implementation of the Yamoussoukro Decision. The rating is based on the percentage of flights in the
region that are flown under so-called fifth-freedom arrangements. Owing to the presence of two strong
EAST AFRICA’S INFRASTRUCTURE: A REGIONAL PERSPECTIVE
vii
regional carriers and a clear hub system, such flights are not as common in EAC as in Central or West
Africa, because the dominant carriers are able to work out bilateral agreements that preempt regional
cooperation (or make it more difficult). On the other hand, most countries in East Africa have made good
progress toward achieving international standards in air safety, and regional collaboration in this area is
already well underway. Ethiopia is the only country in all of Africa, other than South Africa, that has
complied with all international standards in air safety.
The power situation in East Africa is grave compared with other regions of Africa. East Africa’s
overall generation capacity is the smallest after Central Africa, but per capita generation is the smallest.
Access to power is also the lowest in Africa. On the other hand, utility performance in EAC is
encouraging. Systems losses and hidden costs are less serious than in other regions of the continent, and
the region’s cost-recovery record is the highest in Africa. In terms of pricing for power, the average
historic costs of power in the region are high—almost $0.20 per kilowatt-hour. With demand for power
expected to increase by 70 percent, expanding power infrastructure is critical to the region’s economic
infrastructure.
East Africa already practices regional power trade, albeit much less actively than western and
southern Africa; greater trade could bring substantial benefits. The potential to develop trade is great,
because many countries in the region would be better off by importing a sizable share of their power
needs. Realizing the benefits of trade depends, however, on the ability of Ethiopia and Sudan (as well as
Uganda and Rwanda, to a lesser extent) to develop their hydropower capacity. Ethiopia and Sudan would
have to build more than 6,700 MW and 3,100 MW of additional hydropower capacity to deliver the full
benefits of trade, and the members of the East African Power Pool would have to build more than 27,700
MW of interconnectors. If these targets could be met, the region’s cost of energy would be reduced by $1
billion annually. Several countries would save significantly on their national power development and a
number of smaller countries could substantially reduce their long-run marginal cost of power. In addition,
regional trade would allow a shift to cleaner energy that would reduce regional carbon emissions by more
than 20 million tonnes annually, the second-largest savings of any subregion (after those of the Southern
African Power Pool). Overall, the returns on investments in regional interconnection would yield an
average rate of return of 20 percent.
Compared with the continent’s other regional economic communities, EAC has performed poorly in
terms of ICT access and, in 2007, faced relatively high prices for critical ICT services. But with access to
submarine cable in several countries, ICT prices have dropped significantly, and access has improved.
East Africa pioneered the ―borderless roaming arrangements‖ across several countries, with free incoming
calls and billing based on local tariffs. All countries except Ethiopia have opened their
telecommunications market to some level of foreign investment. While there are several large mobile
groups that operate in multiple countries in the region, no single operator dominates the region. Countries
with submarine cable have seen a dramatic decline in prices for basic ICT services. The landlocked
countries are also expected to see a drop in prices as soon as their overland connection to the undersea
cable becomes available. As of 2007, however, East Africa needed to complete over 3,500 kilometers of
terrestrial fiber optic network. Only a fraction of the needed cable has been accomplished in the course of
connecting to the submarine cable.
1 Introduction
The Africa Infrastructure Country Diagnostic (AICD) has conducted extensive data collection and
analysis of the infrastructure situation in Africa, including East Africa. The results have been presented in
a variety of continental reports covering different areas of infrastructure— information and
communication technology (ICT), irrigation, power, transport, water, and sanitation—and in different
policy areas—including investment needs, fiscal costs, and sector performance.
The purpose of this regional report is to pull together in one place the key AICD findings relevant for
East Africa. The main value in doing so is that it makes it possible to benchmark the infrastructure
situation in the region against that of other African peers, to identify the main gaps in the regional
infrastructure backbones, and to quantify the costs and benefits of regional integration, as well as their
distribution across member states.
A number of methodological issues should be borne in mind.
First, due to the cross-country nature of the data collection, there is inevitably a time lag in the data.
The period covered by AICD runs from 2001 to 2006. Most technical data presented are for 2006 (or the
most recent year available), while financial data are typically averaged over the available period to
smooth out the effect of short-term fluctuations. Given the fast pace of regional integration, the snapshot
presented here does not necessarily correspond to today’s situation but rather represents the 2006 baseline
against which subsequent progress can be measured.
Second, given the need to make comparisons across countries, indicators and analysis had to be
standardized and made consistent. That means that some of the indicators may be slightly different from
those routinely reported and discussed at the country level.
Third, the database on which the analysis is based was designed to give a national and continental
picture of infrastructure, as opposed to an explicitly regional picture. But national infrastructure provides
the basic building blocks for regional integration, and hence can be used to build up a picture of the
regional situation. Nevertheless, some specifically regional issues—particularly of the regulatory and
institutional variety—may not have been explicitly addressed in the national data collection effort.
Fourth, for the purposes of this review, an extended East Africa is discussed. This includes the East
African Community (Burundi, Kenya, Rwanda, Tanzania, and Uganda), as well as Sudan and Ethiopia.
This group of seven countries is referred to in this report as East Africa.
Fifth, while water resource management is an important aspect of regional integration in Africa, this
report does not explore water resource issues. The reason is that the AICD project did not cover water
resources per se, but rather the specific water resource needs associated with the power, irrigation, and
water supply sectors.
EAST AFRICA’S INFRASTRUCTURE: A REGIONAL PERSPECTIVE
2
Why infrastructure matters
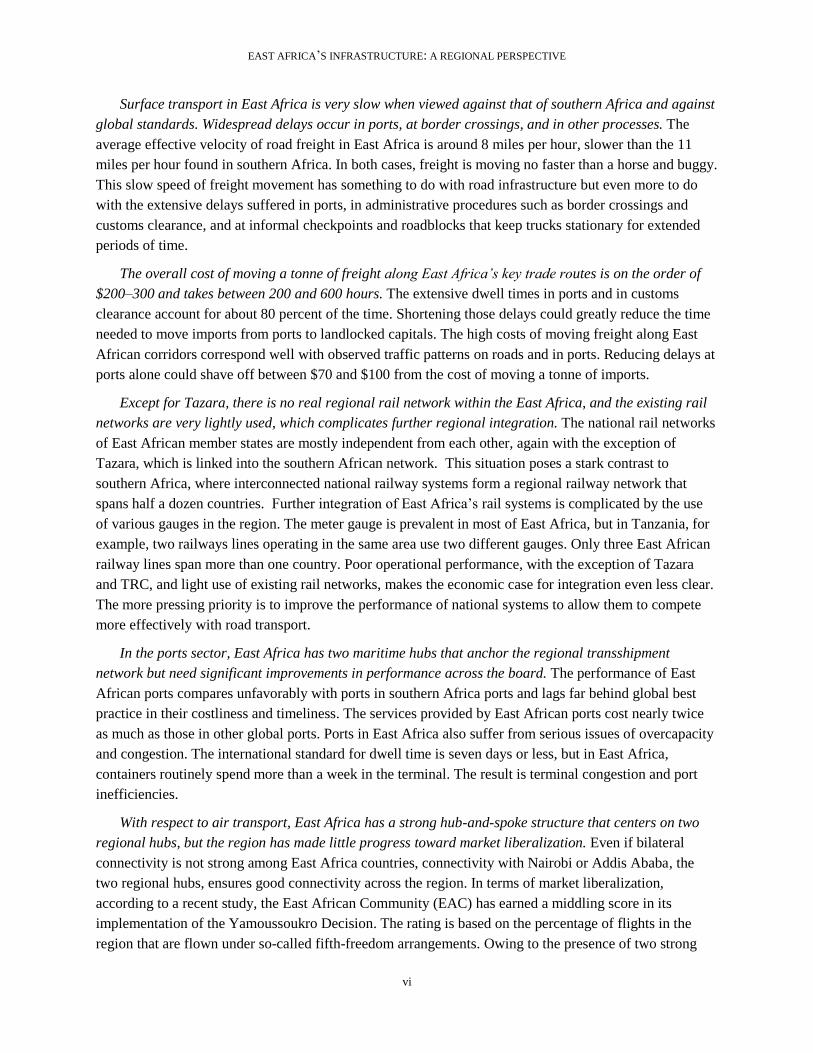
For the period 2003–08, all East African countries experienced economic growth, albeit at different
rates. On average, East African countries grew at an annual rate of 5 percent, and EAC countries at 4
percent, from 2003 to the onset of the global financial crisis. During this period, infrastructure contributed
one percentage point to growth among East African countries. As in other regions of Africa, most of that
growth can be traced to the introduction and spread of mobile telephony (figure 1.1a). Yet unlike other
regions where power infrastructure has constrained growth, in East Africa power infrastructure has
contributed around 0.2 percentage points per capita to growth per year.
Figure 1.1a. Infrastructure’s historic contribution to economic growth, 1995-05
Source: Calderon 2008.
Figure 1.1b. Infrastructure’s potential future contribution to economic growth (% GDP per capita per year)
Source: Calderon, 2008.
Infrastructure could potentially contribute much more to economic growth than it has in the past
(figure 1.1b). Simulations suggest that if East Africa’s growth infrastructure were upgraded to the level of
the best-performing country in Africa (Mauritius), per capita growth would increase by almost 6
percentage points. Interestingly, improvements in infrastructure make a greater contribution to per capita
growth in East Africa than in the other regions of Africa. While all areas of infrastructure—ICT, power,
-0.5
0.0
0.5
1.0
1.5
North A
frica
West A
frica
East A
frica
Southern A
frica
Central A
frica
Africa
Ad
dit
ion
al
per
cen
tag
e p
oin
ts o
f
per
ca
pit
a e
con
om
ic g
ro
wth
Telecom Power Roads
0123456
North Africa
West Africa
East Africa Southern Africa
Central Africa
Africa
Po
ten
tia
l of
bet
ter
infr
ast
ruct
ure
on
gro
wth
per
cap
ita
Telecom Power Roads
EAST AFRICA’S INFRASTRUCTURE: A REGIONAL PERSPECTIVE
3
and transport—need to be upgraded, improvements in power would have the largest impact on growth,
raising it by up to 2.7 percentage points.
Why regional integration matters
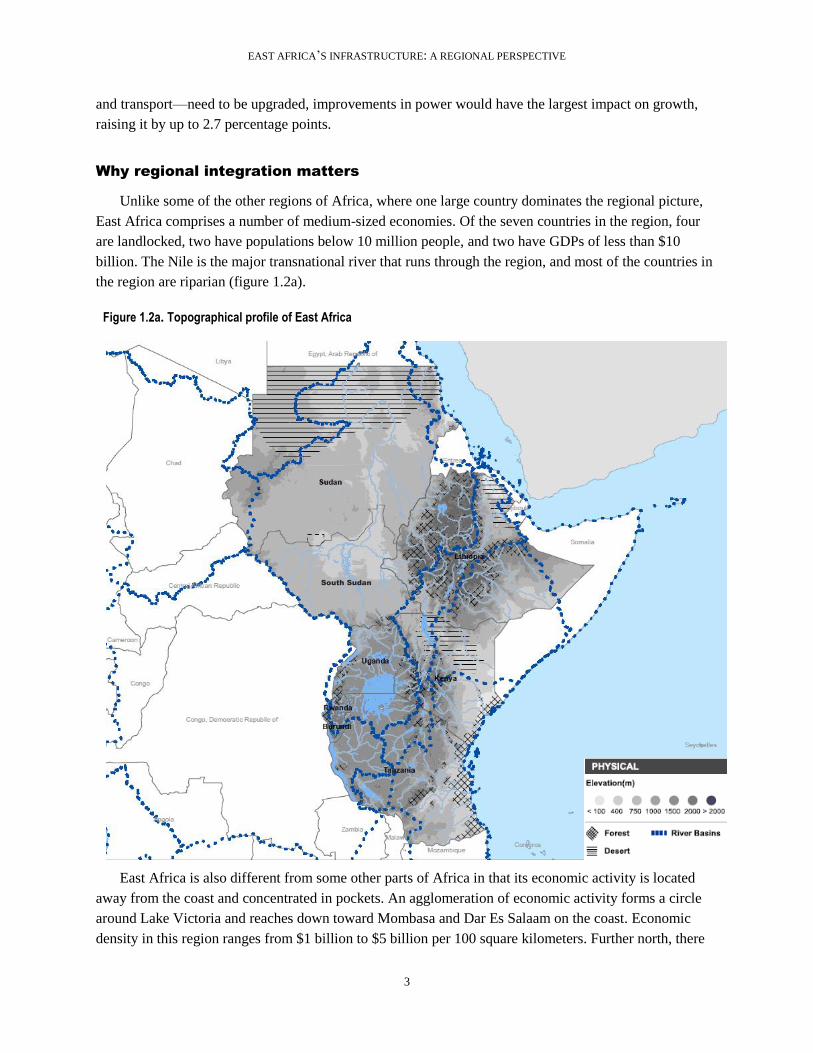
Unlike some of the other regions of Africa, where one large country dominates the regional picture,
East Africa comprises a number of medium-sized economies. Of the seven countries in the region, four
are landlocked, two have populations below 10 million people, and two have GDPs of less than $10
billion. The Nile is the major transnational river that runs through the region, and most of the countries in
the region are riparian (figure 1.2a).
Figure 1.2a. Topographical profile of East Africa
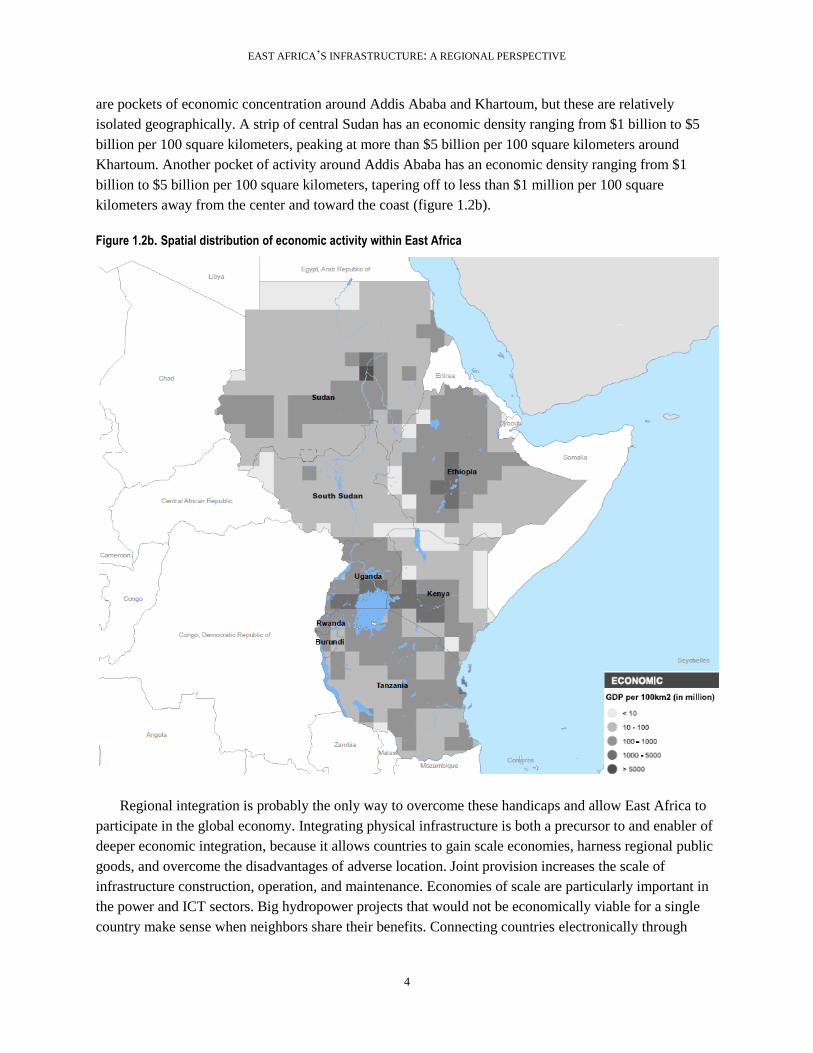
East Africa is also different from some other parts of Africa in that its economic activity is located
away from the coast and concentrated in pockets. An agglomeration of economic activity forms a circle
around Lake Victoria and reaches down toward Mombasa and Dar Es Salaam on the coast. Economic
density in this region ranges from $1 billion to $5 billion per 100 square kilometers. Further north, there
South Sudan
EAST AFRICA’S INFRASTRUCTURE: A REGIONAL PERSPECTIVE
4
are pockets of economic concentration around Addis Ababa and Khartoum, but these are relatively
isolated geographically. A strip of central Sudan has an economic density ranging from $1 billion to $5
billion per 100 square kilometers, peaking at more than $5 billion per 100 square kilometers around
Khartoum. Another pocket of activity around Addis Ababa has an economic density ranging from $1
billion to $5 billion per 100 square kilometers, tapering off to less than $1 million per 100 square
kilometers away from the center and toward the coast (figure 1.2b).
Figure 1.2b. Spatial distribution of economic activity within East Africa
Regional integration is probably the only way to overcome these handicaps and allow East Africa to
participate in the global economy. Integrating physical infrastructure is both a precursor to and enabler of
deeper economic integration, because it allows countries to gain scale economies, harness regional public
goods, and overcome the disadvantages of adverse location. Joint provision increases the scale of
infrastructure construction, operation, and maintenance. Economies of scale are particularly important in
the power and ICT sectors. Big hydropower projects that would not be economically viable for a single
country make sense when neighbors share their benefits. Connecting countries electronically through
South Sudan
EAST AFRICA’S INFRASTRUCTURE: A REGIONAL PERSPECTIVE
5
undersea cables or satellite communications requires large up-front investments that demand a regional
approach.
The state of East Africa’s infrastructure
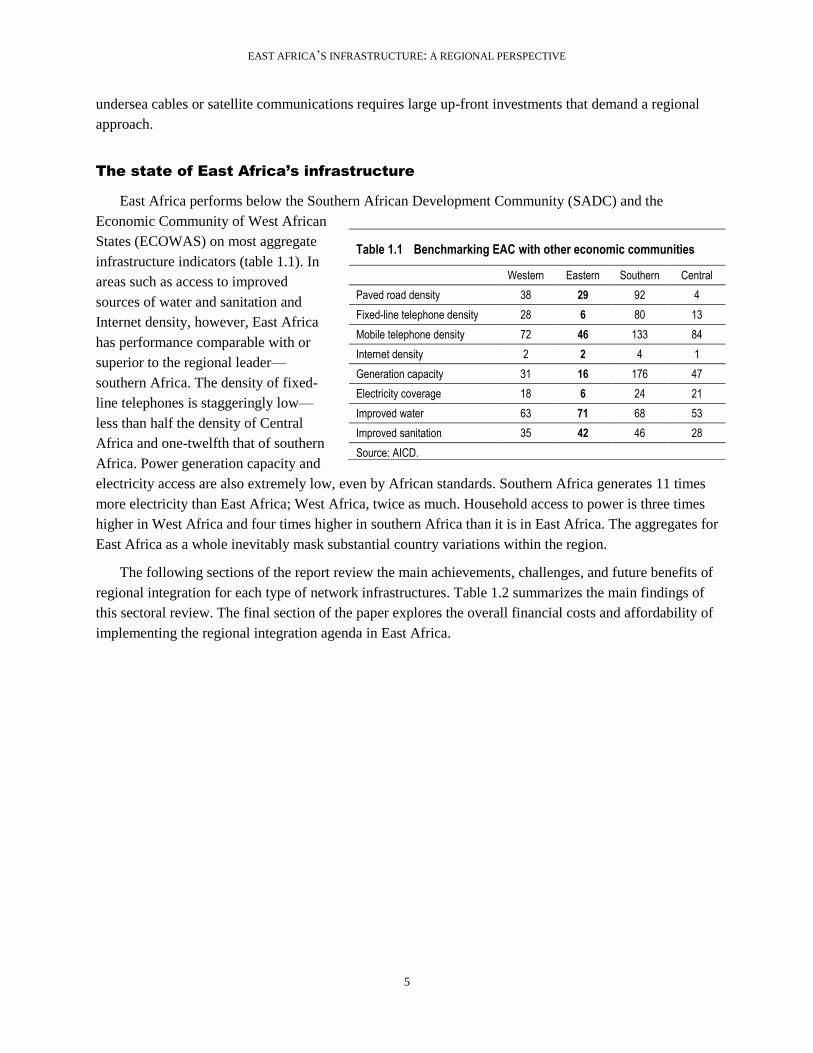
East Africa performs below the Southern African Development Community (SADC) and the
Economic Community of West African
States (ECOWAS) on most aggregate
infrastructure indicators (table 1.1). In
areas such as access to improved
sources of water and sanitation and
Internet density, however, East Africa
has performance comparable with or
superior to the regional leader—
southern Africa. The density of fixed-
line telephones is staggeringly low—
less than half the density of Central
Africa and one-twelfth that of southern
Africa. Power generation capacity and
electricity access are also extremely low, even by African standards. Southern Africa generates 11 times
more electricity than East Africa; West Africa, twice as much. Household access to power is three times
higher in West Africa and four times higher in southern Africa than it is in East Africa. The aggregates for
East Africa as a whole inevitably mask substantial country variations within the region.
The following sections of the report review the main achievements, challenges, and future benefits of
regional integration for each type of network infrastructures. Table 1.2 summarizes the main findings of
this sectoral review. The final section of the paper explores the overall financial costs and affordability of
implementing the regional integration agenda in East Africa.
Table 1.1 Benchmarking EAC with other economic communities
Western Eastern Southern Central
Paved road density 38 29 92 4
Fixed-line telephone density 28 6 80 13
Mobile telephone density 72 46 133 84
Internet density 2 2 4 1
Generation capacity 31 16 176 47
Electricity coverage 18 6 24 21
Improved water 63 71 68 53
Improved sanitation 35 42 46 28
Source: AICD.
EAST AFRICA’S INFRASTRUCTURE: A REGIONAL PERSPECTIVE
6
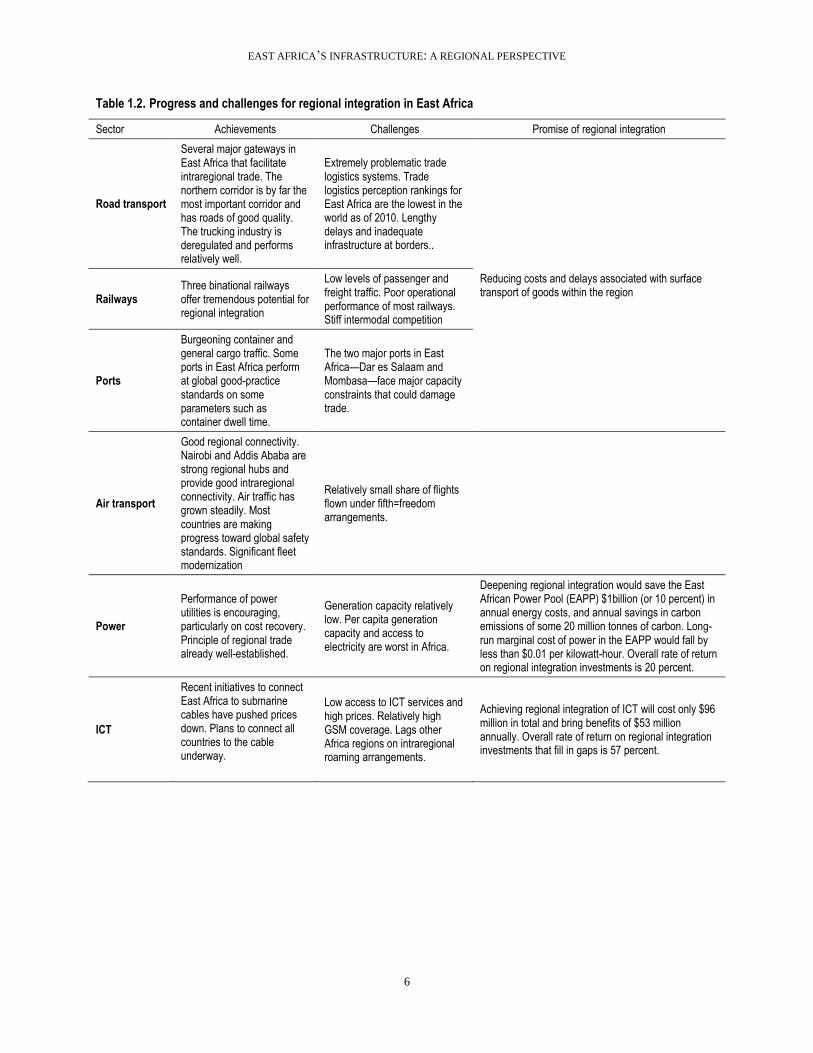
Table 1.2. Progress and challenges for regional integration in East Africa
Sector Achievements Challenges Promise of regional integration
Road transport
Several major gateways in East Africa that facilitate intraregional trade. The northern corridor is by far the most important corridor and has roads of good quality. The trucking industry is deregulated and performs relatively well.
Extremely problematic trade logistics systems. Trade logistics perception rankings for East Africa are the lowest in the world as of 2010. Lengthy delays and inadequate infrastructure at borders..
Reducing costs and delays associated with surface transport of goods within the region
Railways Three binational railways offer tremendous potential for regional integration
Low levels of passenger and freight traffic. Poor operational performance of most railways. Stiff intermodal competition
Ports
Burgeoning container and general cargo traffic. Some ports in East Africa perform at global good-practice standards on some parameters such as container dwell time.
The two major ports in East Africa—Dar es Salaam and Mombasa—face major capacity constraints that could damage trade.
Air transport
Good regional connectivity. Nairobi and Addis Ababa are strong regional hubs and provide good intraregional connectivity. Air traffic has grown steadily. Most countries are making progress toward global safety standards. Significant fleet modernization
Relatively small share of flights flown under fifth=freedom arrangements.
Power
Performance of power utilities is encouraging, particularly on cost recovery. Principle of regional trade already well-established.
Generation capacity relatively low. Per capita generation capacity and access to electricity are worst in Africa.
Deepening regional integration would save the East African Power Pool (EAPP) $1billion (or 10 percent) in annual energy costs, and annual savings in carbon emissions of some 20 million tonnes of carbon. Long-run marginal cost of power in the EAPP would fall by less than $0.01 per kilowatt-hour. Overall rate of return on regional integration investments is 20 percent.
ICT
Recent initiatives to connect East Africa to submarine cables have pushed prices down. Plans to connect all countries to the cable underway.
Low access to ICT services and high prices. Relatively high GSM coverage. Lags other Africa regions on intraregional roaming arrangements.
Achieving regional integration of ICT will cost only $96 million in total and bring benefits of $53 million annually. Overall rate of return on regional integration investments that fill in gaps is 57 percent.
2 Transport
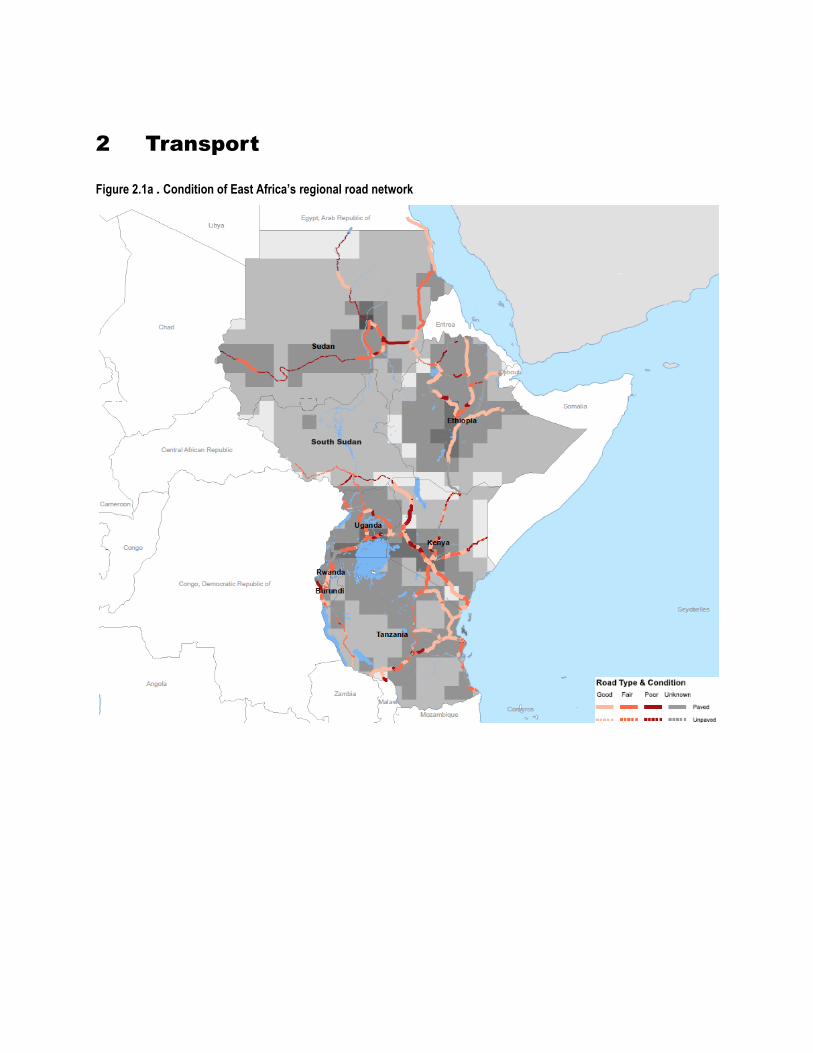
Figure 2.1a . Condition of East Africa’s regional road network
South Sudan
EAST AFRICA’S INFRASTRUCTURE: A REGIONAL PERSPECTIVE
8
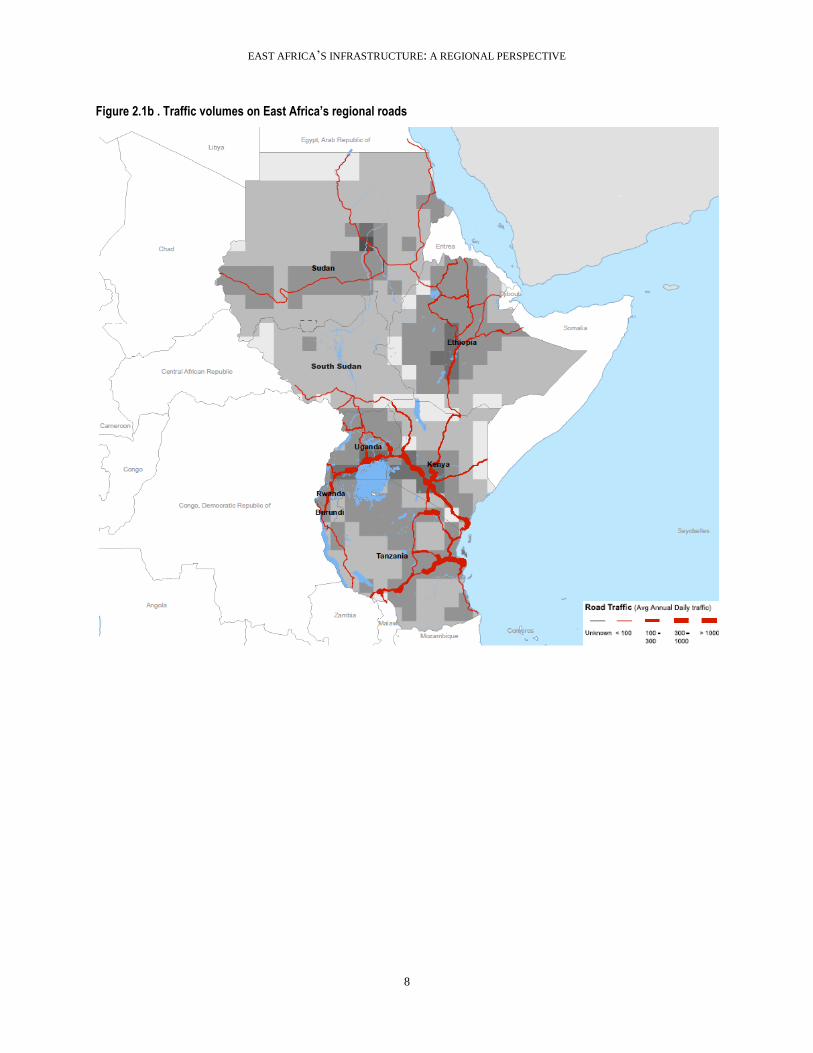
Figure 2.1b . Traffic volumes on East Africa’s regional roads
South Sudan
EAST AFRICA’S INFRASTRUCTURE: A REGIONAL PERSPECTIVE
9
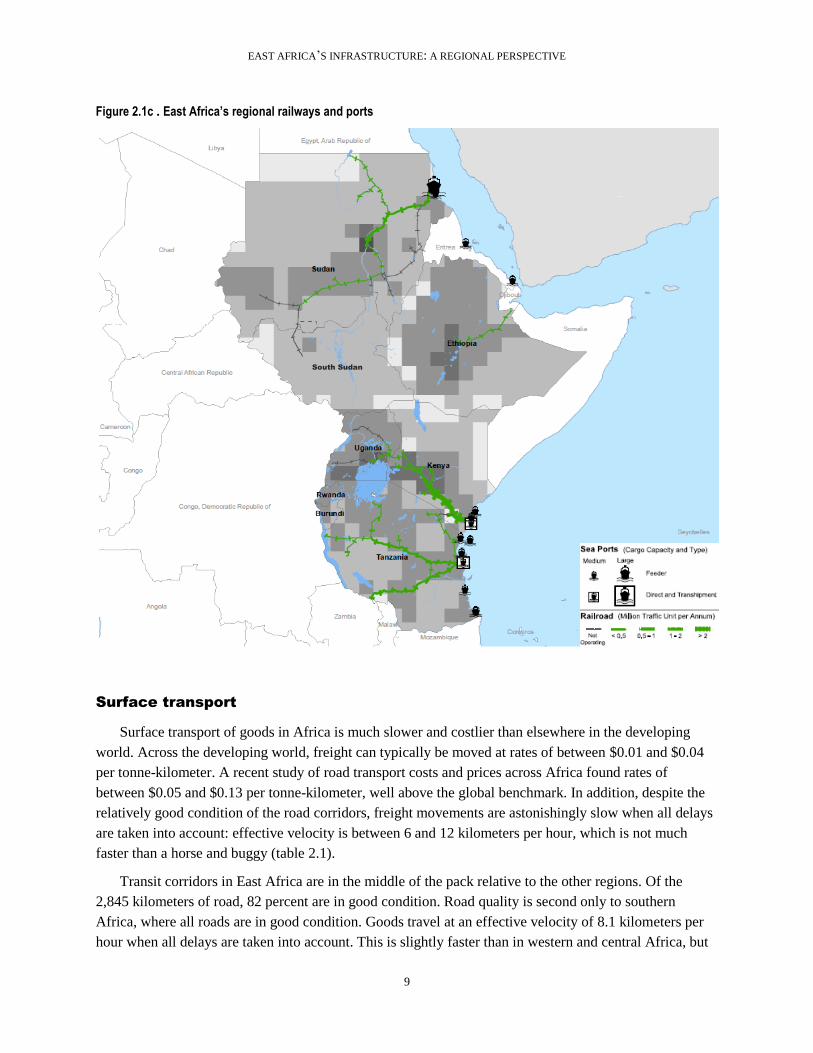
Figure 2.1c . East Africa’s regional railways and ports
Surface transport
Surface transport of goods in Africa is much slower and costlier than elsewhere in the developing
world. Across the developing world, freight can typically be moved at rates of between $0.01 and $0.04
per tonne-kilometer. A recent study of road transport costs and prices across Africa found rates of
between $0.05 and $0.13 per tonne-kilometer, well above the global benchmark. In addition, despite the
relatively good condition of the road corridors, freight movements are astonishingly slow when all delays
are taken into account: effective velocity is between 6 and 12 kilometers per hour, which is not much
faster than a horse and buggy (table 2.1).
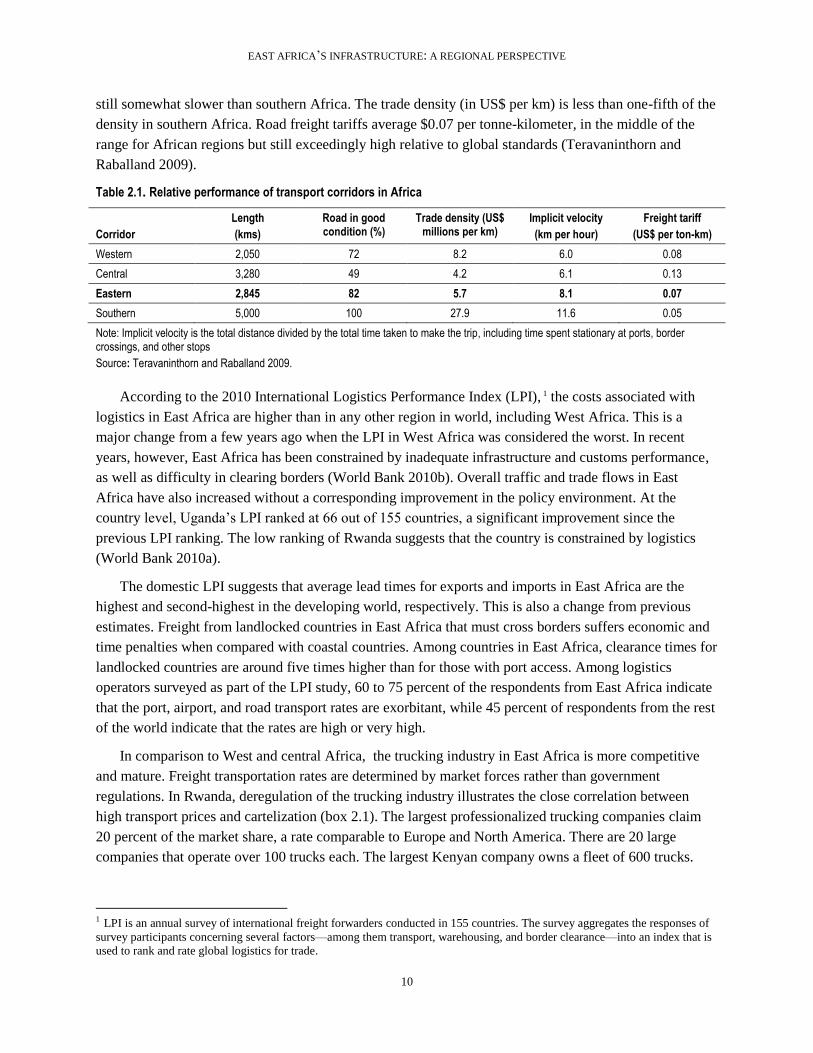
Transit corridors in East Africa are in the middle of the pack relative to the other regions. Of the
2,845 kilometers of road, 82 percent are in good condition. Road quality is second only to southern
Africa, where all roads are in good condition. Goods travel at an effective velocity of 8.1 kilometers per
hour when all delays are taken into account. This is slightly faster than in western and central Africa, but
South Sudan
EAST AFRICA’S INFRASTRUCTURE: A REGIONAL PERSPECTIVE
10
still somewhat slower than southern Africa. The trade density (in US$ per km) is less than one-fifth of the
density in southern Africa. Road freight tariffs average $0.07 per tonne-kilometer, in the middle of the
range for African regions but still exceedingly high relative to global standards (Teravaninthorn and
Raballand 2009).
Table 2.1. Relative performance of transport corridors in Africa
Corridor
Length
(kms)
Road in good condition (%)
Trade density (US$ millions per km)
Implicit velocity
(km per hour)
Freight tariff
(US$ per ton-km)
Western 2,050 72 8.2 6.0 0.08
Central 3,280 49 4.2 6.1 0.13
Eastern 2,845 82 5.7 8.1 0.07
Southern 5,000 100 27.9 11.6 0.05
Note: Implicit velocity is the total distance divided by the total time taken to make the trip, including time spent stationary at ports, border crossings, and other stops
Source: Teravaninthorn and Raballand 2009.
According to the 2010 International Logistics Performance Index (LPI), 1 the costs associated with
logistics in East Africa are higher than in any other region in world, including West Africa. This is a
major change from a few years ago when the LPI in West Africa was considered the worst. In recent
years, however, East Africa has been constrained by inadequate infrastructure and customs performance,
as well as difficulty in clearing borders (World Bank 2010b). Overall traffic and trade flows in East
Africa have also increased without a corresponding improvement in the policy environment. At the
country level, Uganda’s LPI ranked at 66 out of 155 countries, a significant improvement since the
previous LPI ranking. The low ranking of Rwanda suggests that the country is constrained by logistics
(World Bank 2010a).
The domestic LPI suggests that average lead times for exports and imports in East Africa are the
highest and second-highest in the developing world, respectively. This is also a change from previous
estimates. Freight from landlocked countries in East Africa that must cross borders suffers economic and
time penalties when compared with coastal countries. Among countries in East Africa, clearance times for
landlocked countries are around five times higher than for those with port access. Among logistics
operators surveyed as part of the LPI study, 60 to 75 percent of the respondents from East Africa indicate
that the port, airport, and road transport rates are exorbitant, while 45 percent of respondents from the rest
of the world indicate that the rates are high or very high.
In comparison to West and central Africa, the trucking industry in East Africa is more competitive
and mature. Freight transportation rates are determined by market forces rather than government
regulations. In Rwanda, deregulation of the trucking industry illustrates the close correlation between
high transport prices and cartelization (box 2.1). The largest professionalized trucking companies claim
20 percent of the market share, a rate comparable to Europe and North America. There are 20 large
companies that operate over 100 trucks each. The largest Kenyan company owns a fleet of 600 trucks.
1 LPI is an annual survey of international freight forwarders conducted in 155 countries. The survey aggregates the responses of
survey participants concerning several factors—among them transport, warehousing, and border clearance—into an index that is
used to rank and rate global logistics for trade.
EAST AFRICA’S INFRASTRUCTURE: A REGIONAL PERSPECTIVE
11
These large companies obtain loads from long-term direct contracting and reach a much higher mileage
than companies in other parts of Africa (Teravaninthorn and Raballand 2009).
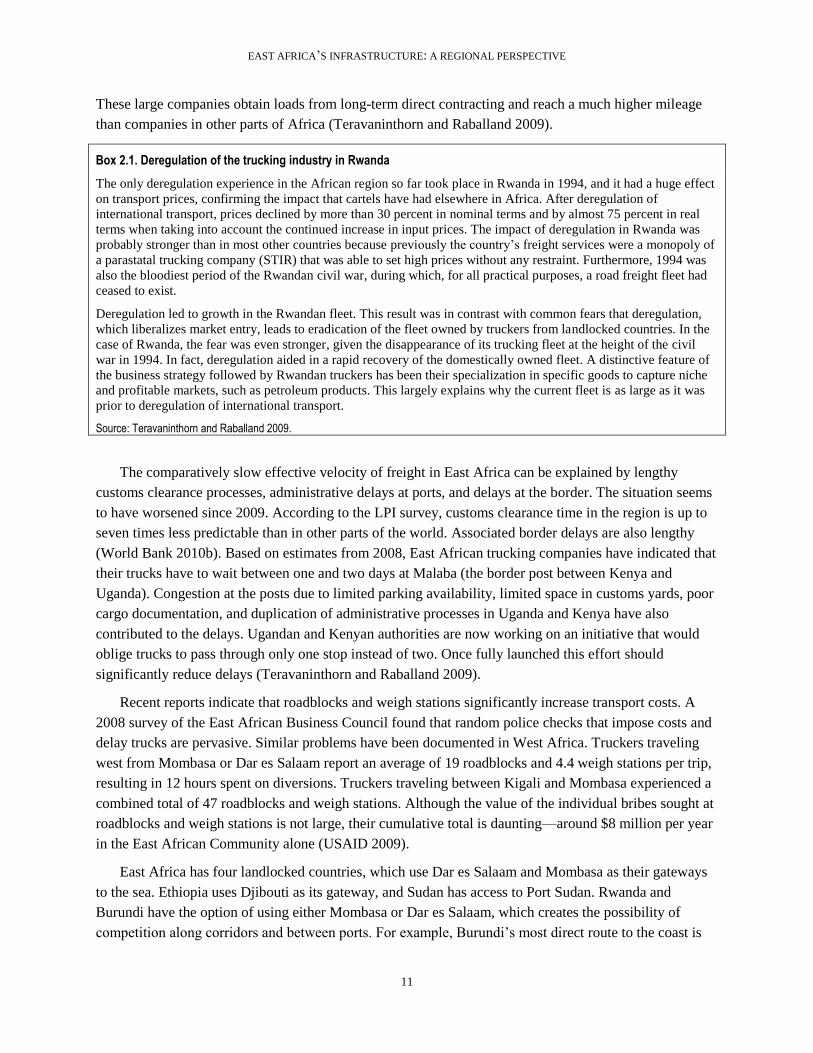
Box 2.1. Deregulation of the trucking industry in Rwanda
The only deregulation experience in the African region so far took place in Rwanda in 1994, and it had a huge effect
on transport prices, confirming the impact that cartels have had elsewhere in Africa. After deregulation of
international transport, prices declined by more than 30 percent in nominal terms and by almost 75 percent in real
terms when taking into account the continued increase in input prices. The impact of deregulation in Rwanda was
probably stronger than in most other countries because previously the country’s freight services were a monopoly of
a parastatal trucking company (STIR) that was able to set high prices without any restraint. Furthermore, 1994 was
also the bloodiest period of the Rwandan civil war, during which, for all practical purposes, a road freight fleet had
ceased to exist.
Deregulation led to growth in the Rwandan fleet. This result was in contrast with common fears that deregulation,
which liberalizes market entry, leads to eradication of the fleet owned by truckers from landlocked countries. In the
case of Rwanda, the fear was even stronger, given the disappearance of its trucking fleet at the height of the civil
war in 1994. In fact, deregulation aided in a rapid recovery of the domestically owned fleet. A distinctive feature of
the business strategy followed by Rwandan truckers has been their specialization in specific goods to capture niche
and profitable markets, such as petroleum products. This largely explains why the current fleet is as large as it was
prior to deregulation of international transport.
Source: Teravaninthorn and Raballand 2009.
The comparatively slow effective velocity of freight in East Africa can be explained by lengthy
customs clearance processes, administrative delays at ports, and delays at the border. The situation seems
to have worsened since 2009. According to the LPI survey, customs clearance time in the region is up to
seven times less predictable than in other parts of the world. Associated border delays are also lengthy
(World Bank 2010b). Based on estimates from 2008, East African trucking companies have indicated that
their trucks have to wait between one and two days at Malaba (the border post between Kenya and
Uganda). Congestion at the posts due to limited parking availability, limited space in customs yards, poor
cargo documentation, and duplication of administrative processes in Uganda and Kenya have also
contributed to the delays. Ugandan and Kenyan authorities are now working on an initiative that would
oblige trucks to pass through only one stop instead of two. Once fully launched this effort should
significantly reduce delays (Teravaninthorn and Raballand 2009).
Recent reports indicate that roadblocks and weigh stations significantly increase transport costs. A
2008 survey of the East African Business Council found that random police checks that impose costs and
delay trucks are pervasive. Similar problems have been documented in West Africa. Truckers traveling
west from Mombasa or Dar es Salaam report an average of 19 roadblocks and 4.4 weigh stations per trip,
resulting in 12 hours spent on diversions. Truckers traveling between Kigali and Mombasa experienced a
combined total of 47 roadblocks and weigh stations. Although the value of the individual bribes sought at
roadblocks and weigh stations is not large, their cumulative total is daunting—around $8 million per year
in the East African Community alone (USAID 2009).
East Africa has four landlocked countries, which use Dar es Salaam and Mombasa as their gateways
to the sea. Ethiopia uses Djibouti as its gateway, and Sudan has access to Port Sudan. Rwanda and
Burundi have the option of using either Mombasa or Dar es Salaam, which creates the possibility of
competition along corridors and between ports. For example, Burundi’s most direct route to the coast is
EAST AFRICA’S INFRASTRUCTURE: A REGIONAL PERSPECTIVE
12
through neighboring Tanzania. Yet infrastructure along that route has traditionally been poor, which
diverts Burundian transit to the route through Rwanda and Uganda into Kenya, which is 600 kilometers
longer.
The northern corridor that runs inland from Mombasa is by far the most significant trading corridor in
the region, greater even than the southern corridor through Tanzania (the central corridor). Further north,
a corridor connects Addis Ababa with Djibouti, and another connects Addis Ababa with Sudan.
Strikingly, no major road routes link Ethiopia and Sudan with the EAC.
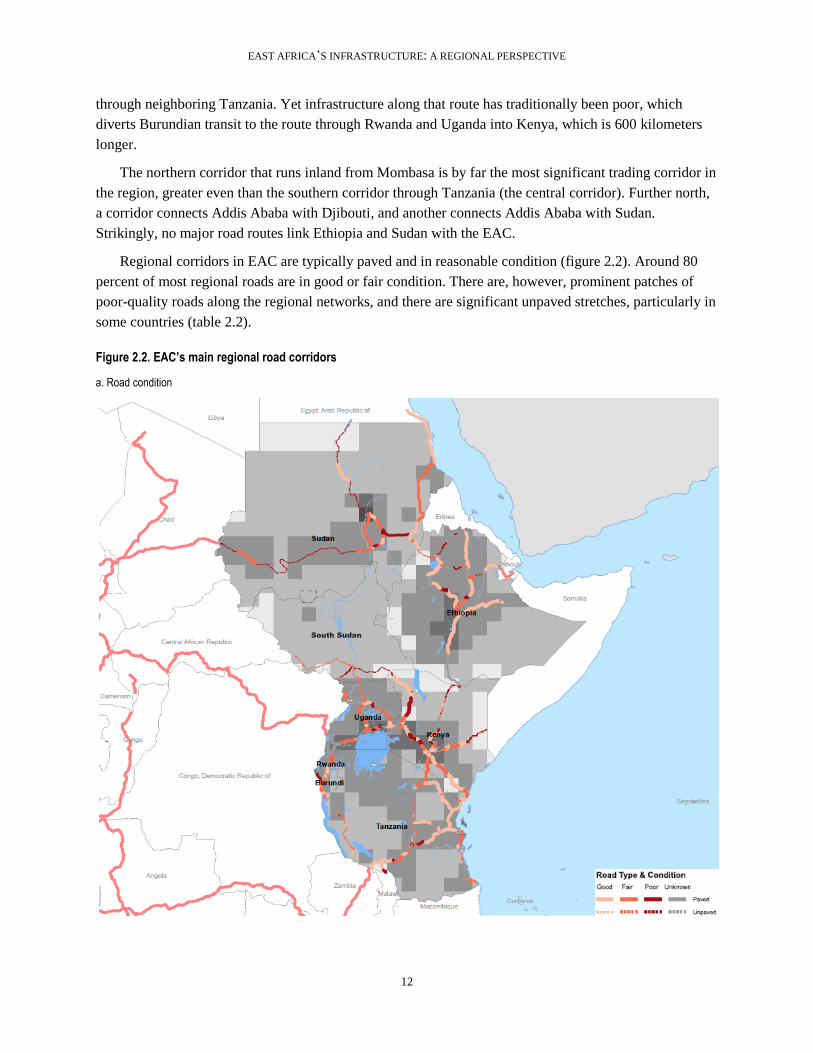
Regional corridors in EAC are typically paved and in reasonable condition (figure 2.2). Around 80
percent of most regional roads are in good or fair condition. There are, however, prominent patches of
poor-quality roads along the regional networks, and there are significant unpaved stretches, particularly in
some countries (table 2.2).
Figure 2.2. EAC’s main regional road corridors
a. Road condition
South Sudan
EAST AFRICA’S INFRASTRUCTURE: A REGIONAL PERSPECTIVE
13
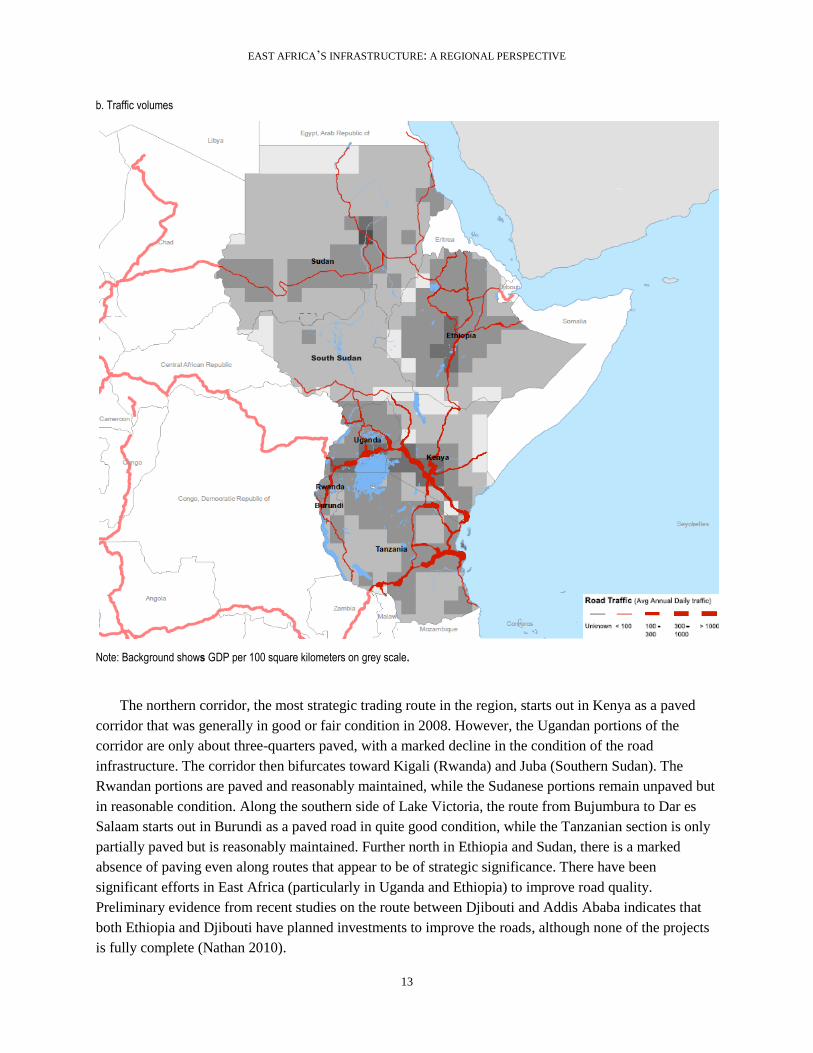
b. Traffic volumes
Note: Background shows GDP per 100 square kilometers on grey scale.
The northern corridor, the most strategic trading route in the region, starts out in Kenya as a paved
corridor that was generally in good or fair condition in 2008. However, the Ugandan portions of the
corridor are only about three-quarters paved, with a marked decline in the condition of the road
infrastructure. The corridor then bifurcates toward Kigali (Rwanda) and Juba (Southern Sudan). The
Rwandan portions are paved and reasonably maintained, while the Sudanese portions remain unpaved but
in reasonable condition. Along the southern side of Lake Victoria, the route from Bujumbura to Dar es
Salaam starts out in Burundi as a paved road in quite good condition, while the Tanzanian section is only
partially paved but is reasonably maintained. Further north in Ethiopia and Sudan, there is a marked
absence of paving even along routes that appear to be of strategic significance. There have been
significant efforts in East Africa (particularly in Uganda and Ethiopia) to improve road quality.
Preliminary evidence from recent studies on the route between Djibouti and Addis Ababa indicates that
both Ethiopia and Djibouti have planned investments to improve the roads, although none of the projects
is fully complete (Nathan 2010).
South Sudan
EAST AFRICA’S INFRASTRUCTURE: A REGIONAL PERSPECTIVE
14
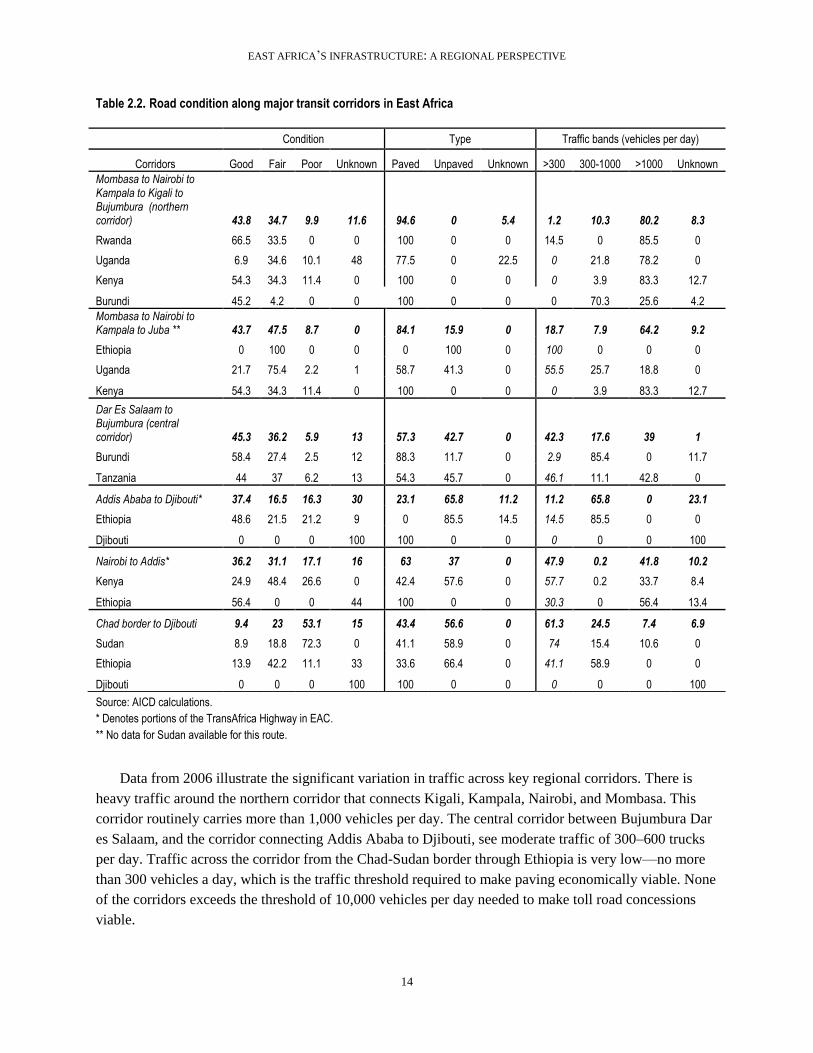
Table 2.2. Road condition along major transit corridors in East Africa
Source: AICD calculations.
* Denotes portions of the TransAfrica Highway in EAC.
** No data for Sudan available for this route.
Data from 2006 illustrate the significant variation in traffic across key regional corridors. There is
heavy traffic around the northern corridor that connects Kigali, Kampala, Nairobi, and Mombasa. This
corridor routinely carries more than 1,000 vehicles per day. The central corridor between Bujumbura Dar
es Salaam, and the corridor connecting Addis Ababa to Djibouti, see moderate traffic of 300–600 trucks
per day. Traffic across the corridor from the Chad-Sudan border through Ethiopia is very low—no more
than 300 vehicles a day, which is the traffic threshold required to make paving economically viable. None
of the corridors exceeds the threshold of 10,000 vehicles per day needed to make toll road concessions
viable.
Condition Type Traffic bands (vehicles per day)
Corridors Good Fair Poor Unknown Paved Unpaved Unknown >300 300-1000 >1000 Unknown
Mombasa to Nairobi to Kampala to Kigali to Bujumbura (northern corridor) 43.8 34.7 9.9 11.6 94.6 0 5.4 1.2 10.3 80.2 8.3
Rwanda 66.5 33.5 0 0 100 0 0 14.5 0 85.5 0
Uganda 6.9 34.6 10.1 48 77.5 0 22.5 0 21.8 78.2 0
Kenya 54.3 34.3 11.4 0 100 0 0 0 3.9 83.3 12.7
Burundi 45.2 4.2 0 0 100 0 0 0 70.3 25.6 4.2
Mombasa to Nairobi to Kampala to Juba ** 43.7 47.5 8.7 0 84.1 15.9 0 18.7 7.9 64.2 9.2
Ethiopia 0 100 0 0 0 100 0 100 0 0 0
Uganda 21.7 75.4 2.2 1 58.7 41.3 0 55.5 25.7 18.8 0
Kenya 54.3 34.3 11.4 0 100 0 0 0 3.9 83.3 12.7
Dar Es Salaam to Bujumbura (central corridor) 45.3 36.2 5.9 13 57.3 42.7 0 42.3 17.6 39 1
Burundi 58.4 27.4 2.5 12 88.3 11.7 0 2.9 85.4 0 11.7
Tanzania 44 37 6.2 13 54.3 45.7 0 46.1 11.1 42.8 0
Addis Ababa to Djibouti* 37.4 16.5 16.3 30 23.1 65.8 11.2 11.2 65.8 0 23.1
Ethiopia 48.6 21.5 21.2 9 0 85.5 14.5 14.5 85.5 0 0
Djibouti 0 0 0 100 100 0 0 0 0 0 100
Nairobi to Addis* 36.2 31.1 17.1 16 63 37 0 47.9 0.2 41.8 10.2
Kenya 24.9 48.4 26.6 0 42.4 57.6 0 57.7 0.2 33.7 8.4
Ethiopia 56.4 0 0 44 100 0 0 30.3 0 56.4 13.4
Chad border to Djibouti 9.4 23 53.1 15 43.4 56.6 0 61.3 24.5 7.4 6.9
Sudan 8.9 18.8 72.3 0 41.1 58.9 0 74 15.4 10.6 0
Ethiopia 13.9 42.2 11.1 33 33.6 66.4 0 41.1 58.9 0 0
Djibouti 0 0 0 100 100 0 0 0 0 0 100
EAST AFRICA’S INFRASTRUCTURE: A REGIONAL PERSPECTIVE
15
The competitiveness of each corridor can be gauged by aggregating the time and costs associated with
transport, administrative processes (customs), ports, and long waits incurred along the route. The cost of
moving imports (or exports) along each of these key arteries and the times taken for this movement are
key elements of competitiveness for both international and intraregional trade.
These times can be broken down into four components: the travel times of moving goods, determined
by time of travel based on effective velocity along each corridor; administrative time spent importing
goods to a country; port time, based on the time taken to clear goods at ports; and border time, the delays
incurred in crossing borders. Transport costs are based on unit costs of moving freight along specific
corridors, whereas administrative costs are based on costs involved in transporting imports into a country.
Port delays and border delays were quantified into costs based on the assumption that delays cost $5 per
day per tonne of imports.
Comparing the rail and road options for transport along corridors where a parallel railway exists
presents a mixed story. Two railways in East Africa connect landlocked countries to the sea: the Kenya-
Uganda railway connects Mombasa with Kampala, and CDE connects Addis Ababa to Djibouti. A
comparison of these parallel road and rail corridors suggests that in the case of importing goods from
Djibouti to Addis, the CDE railway tariff (0.13 cents per tonne-kilometer) is slightly more expensive than
the road tariff (between 0.10 and 0.11 cents per tonne-kilometer). On the other hand, freight tariffs on the
northern corridor are between 0.07 and 0.09 cents per tonne-kilometer, slightly more than the Kenya-
Uganda railway tariff (0.05 cents per tonne-kilometer) assuming that the railway does not encounter
additional delays due to disrepair or service disruptions.
Recent studies on the rail network between Djibouti and Addis have found that the axle load of the
railway line is rather limited. In addition, several of the bridges need rehabilitation, which is already
underway. In the case of the Kenya-Uganda railway, whose tariffs are competitive with road freight
tariffs, a concession has been upgrading the railway line, which had been in a state of serious disrepair.
The railway line is operational, but traffic utilization is extremely poor (5 percent of corridor traffic). If
the railway line were fully operational, it would help decongest the port at Mombasa and reduce time
spent in port (Nathan 2010).
Importing goods to landlocked countries along East Africa’s major corridors is an expensive and a
lengthy process due to inefficient ports, high transport costs, and delays at borders. Dwell times at ports
add between 200 and 800 hours to the total travel times.
It is striking that it takes more time to travel to Bujumbura from Dar es Salaam than it does from
Mombasa, even though Dar es Salaam is closer. The extensive delays at the border (on the order of entire
day), long port times, and slow travel owing at least partly to the poor condition of the route, add to the
total time.
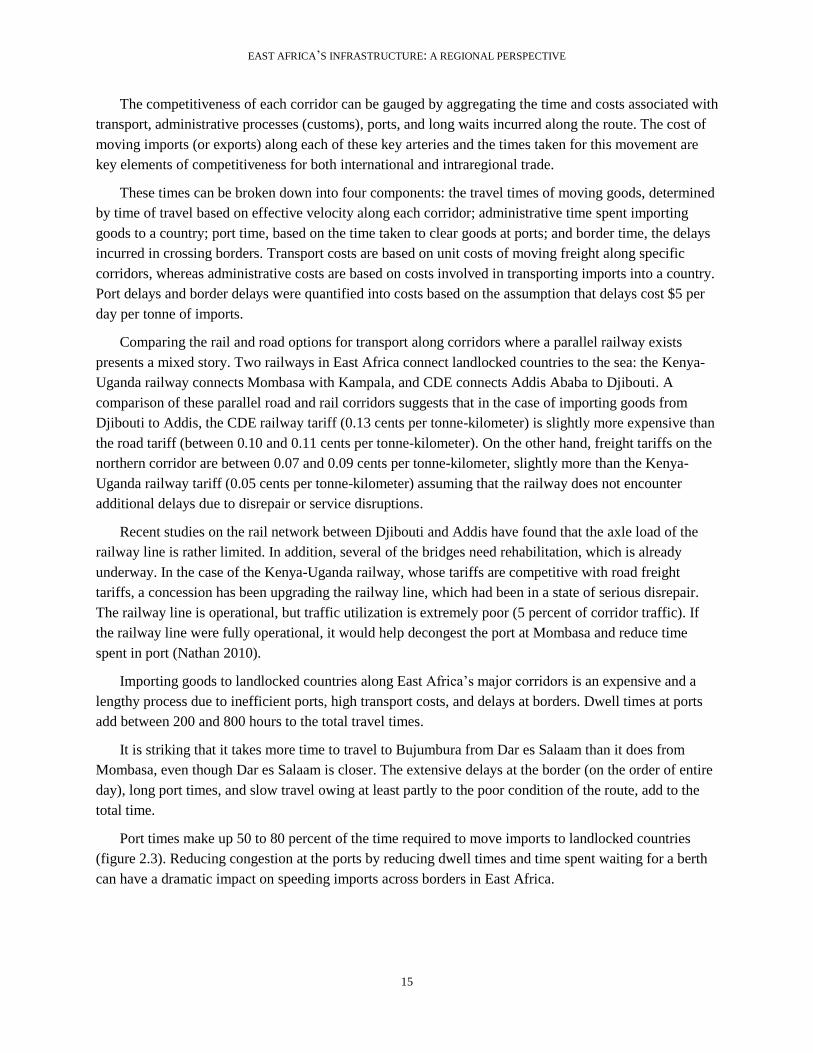
Port times make up 50 to 80 percent of the time required to move imports to landlocked countries
(figure 2.3). Reducing congestion at the ports by reducing dwell times and time spent waiting for a berth
can have a dramatic impact on speeding imports across borders in East Africa.
EAST AFRICA’S INFRASTRUCTURE: A REGIONAL PERSPECTIVE
16
Among road
corridors serving
landlocked
countries, there are
significant cost
differences. Based
on the three main
intraregional
arteries in East
Africa, the cost of
importing goods
from a landlocked
country lies in the
range of $170 to
$370 per tonne-
kilometer. Overall,
travel to landlocked
Burundi, Rwanda,
and Uganda is
cheaper via the
northern corridor
than the central
corridor. For
Burundi, the
northern corridor
has a competitive
edge over the
central corridor.
This is striking
because Bujumbura
is closer to Dar es
Salaam than to
Mombasa.
Even though
both Dar es Salaam and Mombasa have significantly exceeded their handling thresholds, Mombasa is
slightly cheaper and more efficient than Dar es Salaam, making it the preferred port of entry for goods
destined for landlocked Burundi. Costs incurred at ports and high transport costs make up more than 90
percent of the total cost of importing goods (figure 2.4).
Figure 2.3. Time required to import goods by road through alternative gateways
a. In hours
b. By step (% of total time)
Source: Source: Data collected from ―Trading Across Borders‖; Nathan Associates 2010; and AICD ports database.
0100200300400500600700800900
1000
Djibouti-Addis Dar es Salaam-Bujumbura
Dar es Salaam-Kigali Dar es Salaam-KampalaTo
tal t
ime
re
qu
ire
d t
o im
po
rt g
oo
ds
Customs Border Transport Ports
0%
20%
40%
60%
80%
100%
Djibouti-Addis Dar es Salaam-Bujumbura
Dar es Salaam-Kigali Dar es Salaam-Kampala
Shar
e o
f t
ime
re
qu
ire
d t
o im
po
rt g
oo
ds
Customs Border Transport Ports
EAST AFRICA’S INFRASTRUCTURE: A REGIONAL PERSPECTIVE
17
Figure 2.4. Cost of importing goods by road through alternative gateways
a. In U.S. dollars
b. By step (% of total time)
Source: Data collected from ―Trading Across Borders‖; Nathan Associates 2010; and AICD ports database.
In order to understand overall corridor performance, it is helpful to examine the national performance
of the various modal components. The performance of the corridor can be only as good as the
performance of the national transport systems that comprise it. To this end, the performance of the
national road, rail, and ports sectors is briefly reviewed in the remainder of the section, with a view to
identifying national weaknesses that may have serious repercussions at the regional level.
Roads
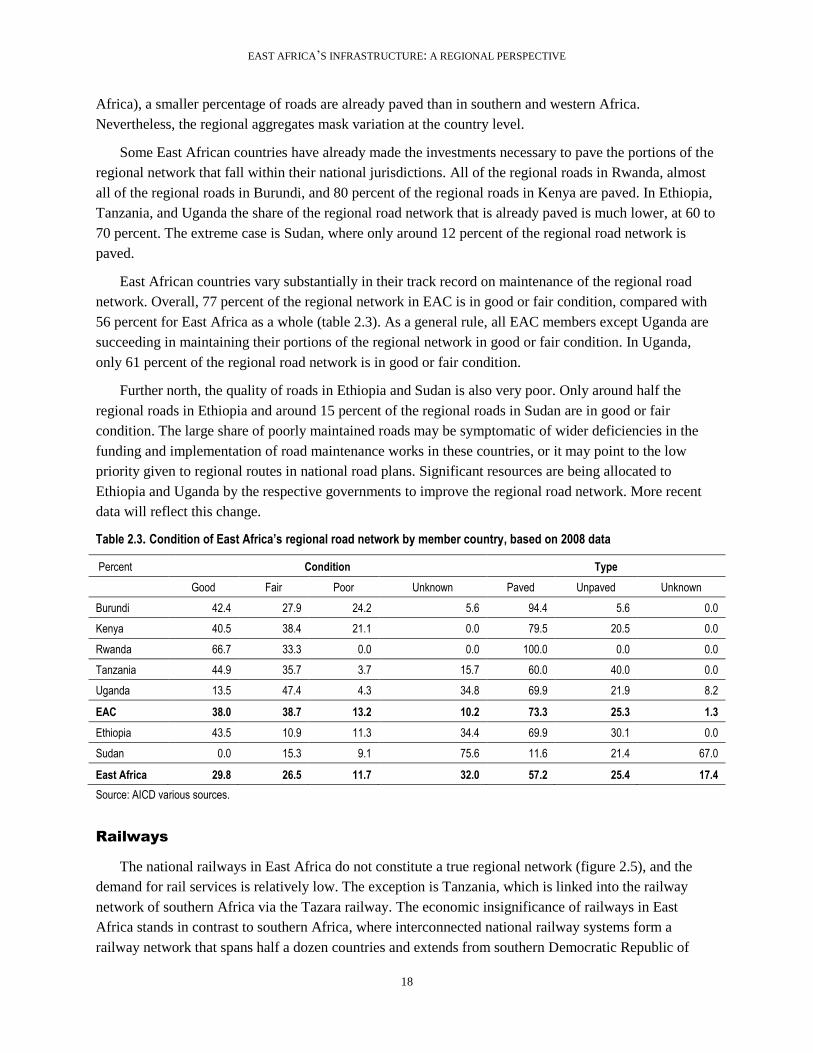
Data from 2008 reveal that around 73 percent of roads in EAC are paved. A much lower 57 percent of
the regional road network in East Africa is paved (table 2.3). This section takes a national perspective on
the regional road network. For this purpose, the regional road network is defined as the network needed to
connect all national capitals with one another and with the major deep sea ports. In EAC (and East
050
100150200250300350400450
Djibouti-Addis Dar es Salaam-Bujumbura
Dar es Salaam-Kampala
Dar es Salaam- Kigali
Co
sts
(US$
pe
r to
nn
e)
of
imp
ort
ing
goo
ds
Customs Border Transport Ports
0%
20%
40%
60%
80%
100%
Djibouti-
Addis
Mombassa-
Bujumbura
Dar es
Salaam-
Bujumbura
Mombasa-
Kampala
Dar es
Salaam-
Kampala
Mombasa-
Kigali
Dar es
Salaam-
Kigali
Mombasa-
Juba
Sh
are
of
cost
s fo
r im
po
rtin
g g
oo
ds
Ports Transport Border Customs
EAST AFRICA’S INFRASTRUCTURE: A REGIONAL PERSPECTIVE
18
Africa), a smaller percentage of roads are already paved than in southern and western Africa.
Nevertheless, the regional aggregates mask variation at the country level.
Some East African countries have already made the investments necessary to pave the portions of the
regional network that fall within their national jurisdictions. All of the regional roads in Rwanda, almost
all of the regional roads in Burundi, and 80 percent of the regional roads in Kenya are paved. In Ethiopia,
Tanzania, and Uganda the share of the regional road network that is already paved is much lower, at 60 to
70 percent. The extreme case is Sudan, where only around 12 percent of the regional road network is
paved.
East African countries vary substantially in their track record on maintenance of the regional road
network. Overall, 77 percent of the regional network in EAC is in good or fair condition, compared with
56 percent for East Africa as a whole (table 2.3). As a general rule, all EAC members except Uganda are
succeeding in maintaining their portions of the regional network in good or fair condition. In Uganda,
only 61 percent of the regional road network is in good or fair condition.
Further north, the quality of roads in Ethiopia and Sudan is also very poor. Only around half the
regional roads in Ethiopia and around 15 percent of the regional roads in Sudan are in good or fair
condition. The large share of poorly maintained roads may be symptomatic of wider deficiencies in the
funding and implementation of road maintenance works in these countries, or it may point to the low
priority given to regional routes in national road plans. Significant resources are being allocated to
Ethiopia and Uganda by the respective governments to improve the regional road network. More recent
data will reflect this change.
Table 2.3. Condition of East Africa’s regional road network by member country, based on 2008 data
Percent Condition Type
Good Fair Poor Unknown Paved Unpaved Unknown
Burundi 42.4 27.9 24.2 5.6 94.4 5.6 0.0
Kenya 40.5 38.4 21.1 0.0 79.5 20.5 0.0
Rwanda 66.7 33.3 0.0 0.0 100.0 0.0 0.0
Tanzania 44.9 35.7 3.7 15.7 60.0 40.0 0.0
Uganda 13.5 47.4 4.3 34.8 69.9 21.9 8.2
EAC 38.0 38.7 13.2 10.2 73.3 25.3 1.3
Ethiopia 43.5 10.9 11.3 34.4 69.9 30.1 0.0
Sudan 0.0 15.3 9.1 75.6 11.6 21.4 67.0
East Africa 29.8 26.5 11.7 32.0 57.2 25.4 17.4
Source: AICD various sources.
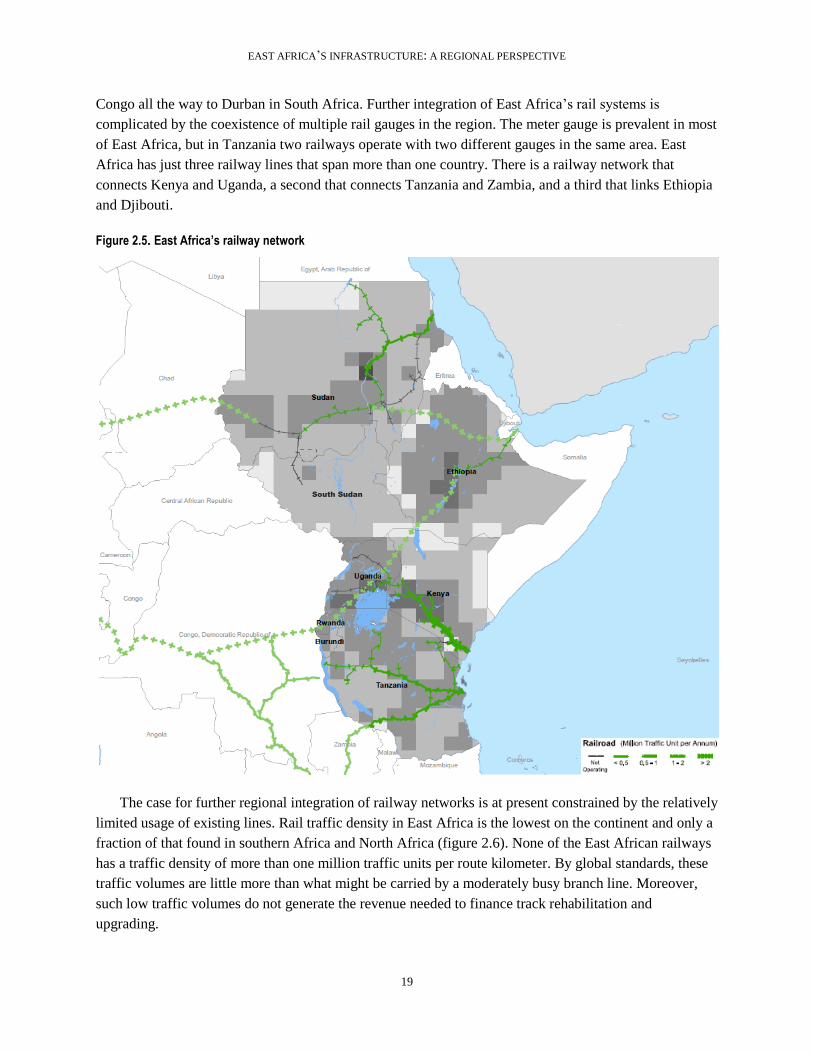
Railways
The national railways in East Africa do not constitute a true regional network (figure 2.5), and the
demand for rail services is relatively low. The exception is Tanzania, which is linked into the railway
network of southern Africa via the Tazara railway. The economic insignificance of railways in East
Africa stands in contrast to southern Africa, where interconnected national railway systems form a
railway network that spans half a dozen countries and extends from southern Democratic Republic of
EAST AFRICA’S INFRASTRUCTURE: A REGIONAL PERSPECTIVE
19
Congo all the way to Durban in South Africa. Further integration of East Africa’s rail systems is
complicated by the coexistence of multiple rail gauges in the region. The meter gauge is prevalent in most
of East Africa, but in Tanzania two railways operate with two different gauges in the same area. East
Africa has just three railway lines that span more than one country. There is a railway network that
connects Kenya and Uganda, a second that connects Tanzania and Zambia, and a third that links Ethiopia
and Djibouti.
Figure 2.5. East Africa’s railway network
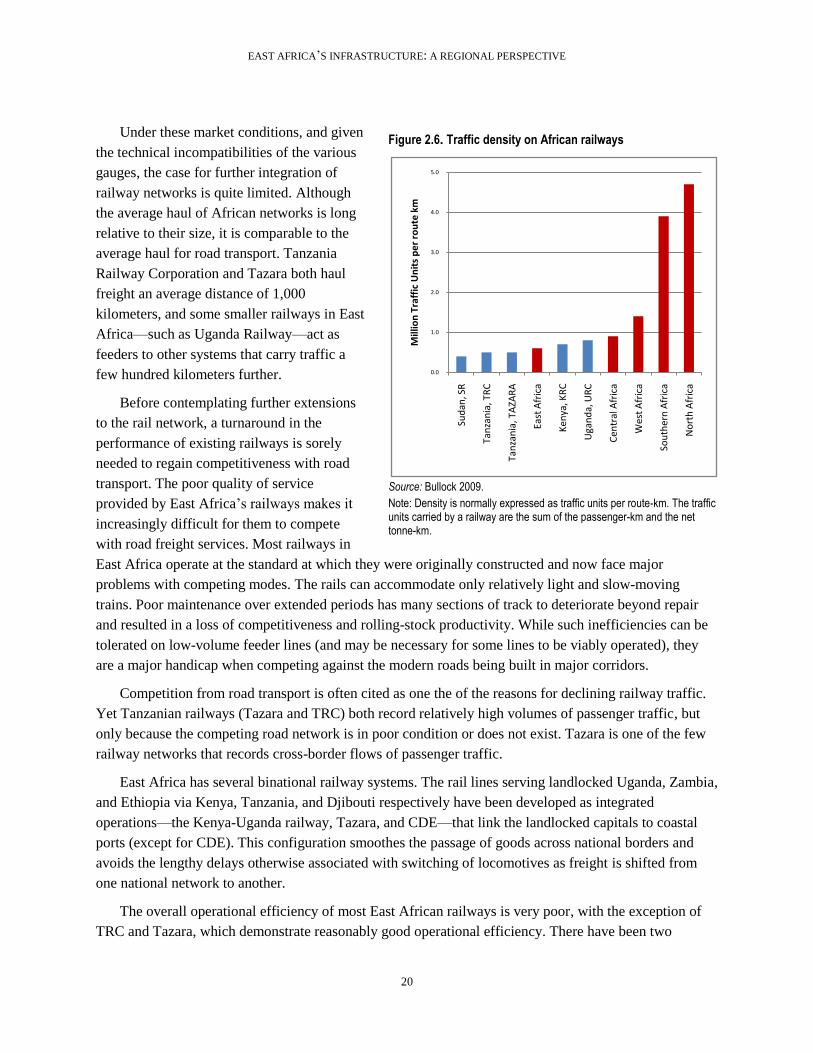
The case for further regional integration of railway networks is at present constrained by the relatively
limited usage of existing lines. Rail traffic density in East Africa is the lowest on the continent and only a
fraction of that found in southern Africa and North Africa (figure 2.6). None of the East African railways
has a traffic density of more than one million traffic units per route kilometer. By global standards, these
traffic volumes are little more than what might be carried by a moderately busy branch line. Moreover,
such low traffic volumes do not generate the revenue needed to finance track rehabilitation and
upgrading.
South Sudan
EAST AFRICA’S INFRASTRUCTURE: A REGIONAL PERSPECTIVE
20
Under these market conditions, and given
the technical incompatibilities of the various
gauges, the case for further integration of
railway networks is quite limited. Although
the average haul of African networks is long
relative to their size, it is comparable to the
average haul for road transport. Tanzania
Railway Corporation and Tazara both haul
freight an average distance of 1,000
kilometers, and some smaller railways in East
Africa—such as Uganda Railway—act as
feeders to other systems that carry traffic a
few hundred kilometers further.
Before contemplating further extensions
to the rail network, a turnaround in the
performance of existing railways is sorely
needed to regain competitiveness with road
transport. The poor quality of service
provided by East Africa’s railways makes it
increasingly difficult for them to compete
with road freight services. Most railways in
East Africa operate at the standard at which they were originally constructed and now face major
problems with competing modes. The rails can accommodate only relatively light and slow-moving
trains. Poor maintenance over extended periods has many sections of track to deteriorate beyond repair
and resulted in a loss of competitiveness and rolling-stock productivity. While such inefficiencies can be
tolerated on low-volume feeder lines (and may be necessary for some lines to be viably operated), they
are a major handicap when competing against the modern roads being built in major corridors.
Competition from road transport is often cited as one the of the reasons for declining railway traffic.
Yet Tanzanian railways (Tazara and TRC) both record relatively high volumes of passenger traffic, but
only because the competing road network is in poor condition or does not exist. Tazara is one of the few
railway networks that records cross-border flows of passenger traffic.
East Africa has several binational railway systems. The rail lines serving landlocked Uganda, Zambia,
and Ethiopia via Kenya, Tanzania, and Djibouti respectively have been developed as integrated
operations—the Kenya-Uganda railway, Tazara, and CDE—that link the landlocked capitals to coastal
ports (except for CDE). This configuration smoothes the passage of goods across national borders and
avoids the lengthy delays otherwise associated with switching of locomotives as freight is shifted from
one national network to another.
The overall operational efficiency of most East African railways is very poor, with the exception of
TRC and Tazara, which demonstrate reasonably good operational efficiency. There have been two
Figure 2.6. Traffic density on African railways
Source: Bullock 2009.
Note: Density is normally expressed as traffic units per route-km. The traffic units carried by a railway are the sum of the passenger-km and the net tonne-km.
0.0
1.0
2.0
3.0
4.0
5.0
Sud
an, S
R
Tan
zan
ia, T
RC
Tan
zan
ia, T
AZA
RA
East
Afr
ica
Ken
ya, K
RC
Uga
nd
a, U
RC
Cen
tral
Afr
ica
Wes
t A
fric
a
Sou
ther
n A
fric
a
No
rth
Afr
ica
Mill
ion
Tra
ffic
Un
its
pe
r ro
ute
km
EAST AFRICA’S INFRASTRUCTURE: A REGIONAL PERSPECTIVE
21
concession arrangements in East Africa, the first for TRC and the second for the for Kenya-Uganda
railway. The concession arrangements have helped to boost operational efficiency for TRC in particular,
and its performance is now substantially better than the region’s major publicly owned railways based on
measures of labor and rolling stock productivity (table 2.4).
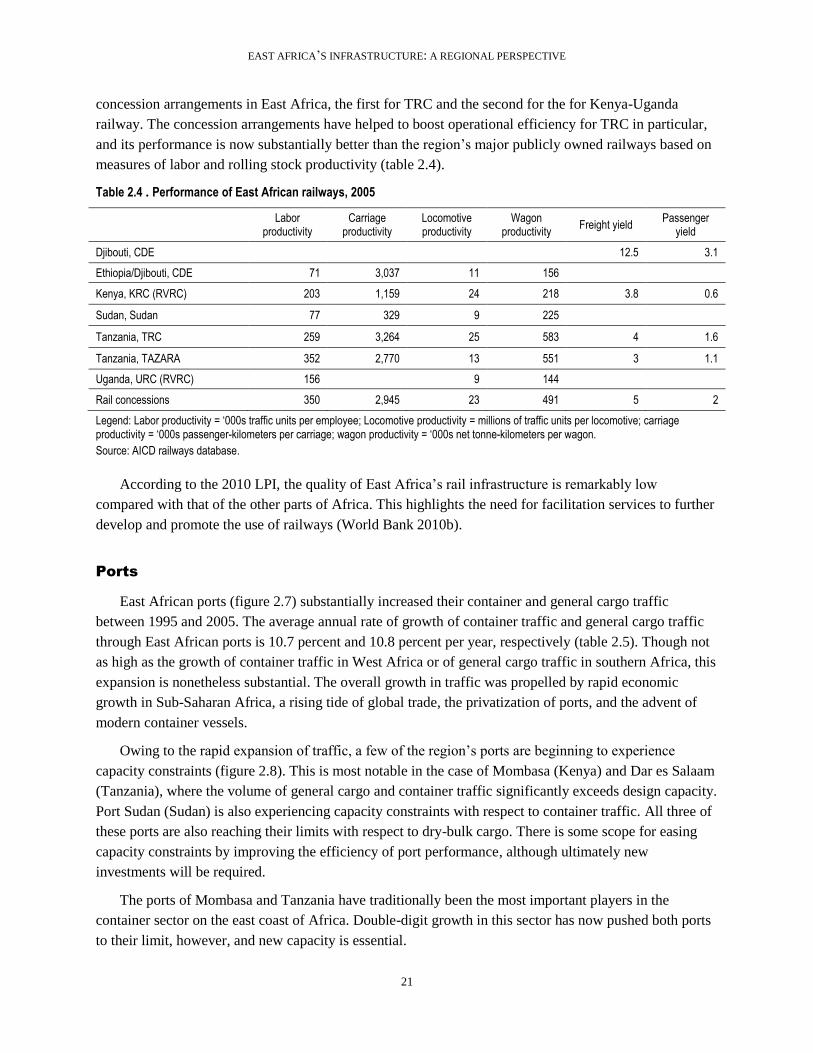
Table 2.4 . Performance of East African railways, 2005
Labor
productivity Carriage
productivity Locomotive productivity
Wagon productivity
Freight yield Passenger
yield
Djibouti, CDE 12.5 3.1
Ethiopia/Djibouti, CDE 71 3,037 11 156
Kenya, KRC (RVRC) 203 1,159 24 218 3.8 0.6
Sudan, Sudan 77 329 9 225
Tanzania, TRC 259 3,264 25 583 4 1.6
Tanzania, TAZARA 352 2,770 13 551 3 1.1
Uganda, URC (RVRC) 156 9 144
Rail concessions 350 2,945 23 491 5 2
Legend: Labor productivity = ‗000s traffic units per employee; Locomotive productivity = millions of traffic units per locomotive; carriage productivity = ‗000s passenger-kilometers per carriage; wagon productivity = ‗000s net tonne-kilometers per wagon.
Source: AICD railways database.
According to the 2010 LPI, the quality of East Africa’s rail infrastructure is remarkably low
compared with that of the other parts of Africa. This highlights the need for facilitation services to further
develop and promote the use of railways (World Bank 2010b).
Ports
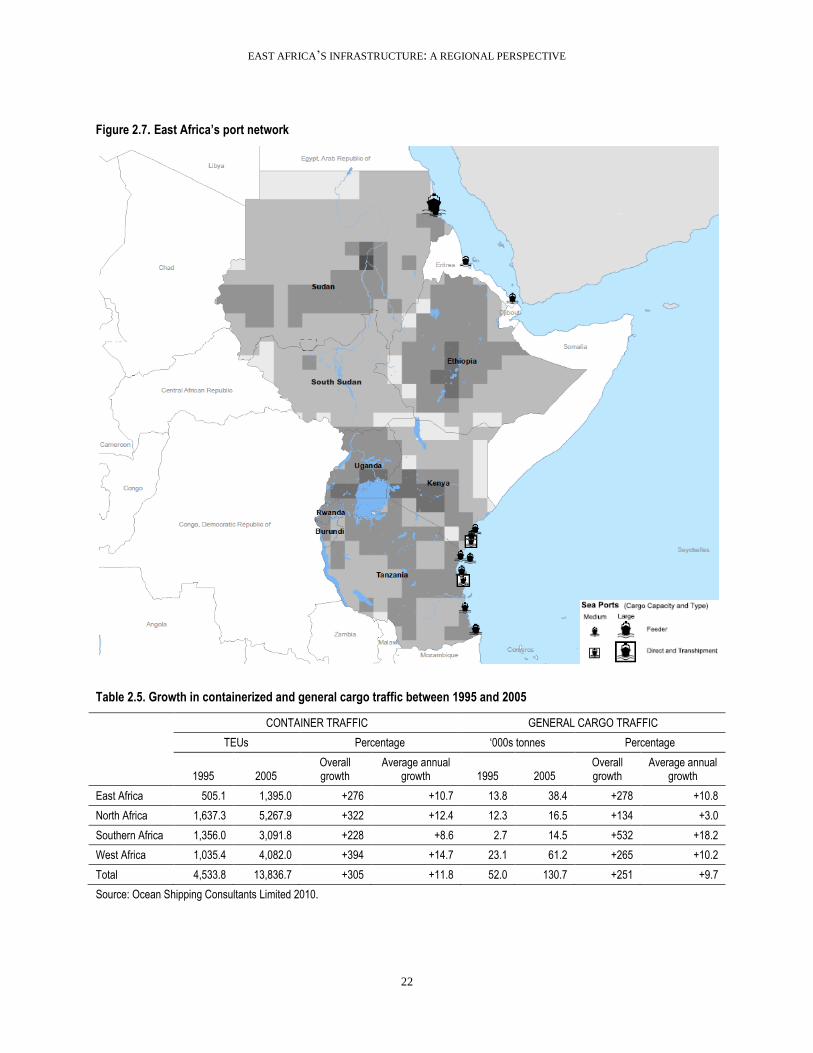
East African ports (figure 2.7) substantially increased their container and general cargo traffic
between 1995 and 2005. The average annual rate of growth of container traffic and general cargo traffic
through East African ports is 10.7 percent and 10.8 percent per year, respectively (table 2.5). Though not
as high as the growth of container traffic in West Africa or of general cargo traffic in southern Africa, this
expansion is nonetheless substantial. The overall growth in traffic was propelled by rapid economic
growth in Sub-Saharan Africa, a rising tide of global trade, the privatization of ports, and the advent of
modern container vessels.
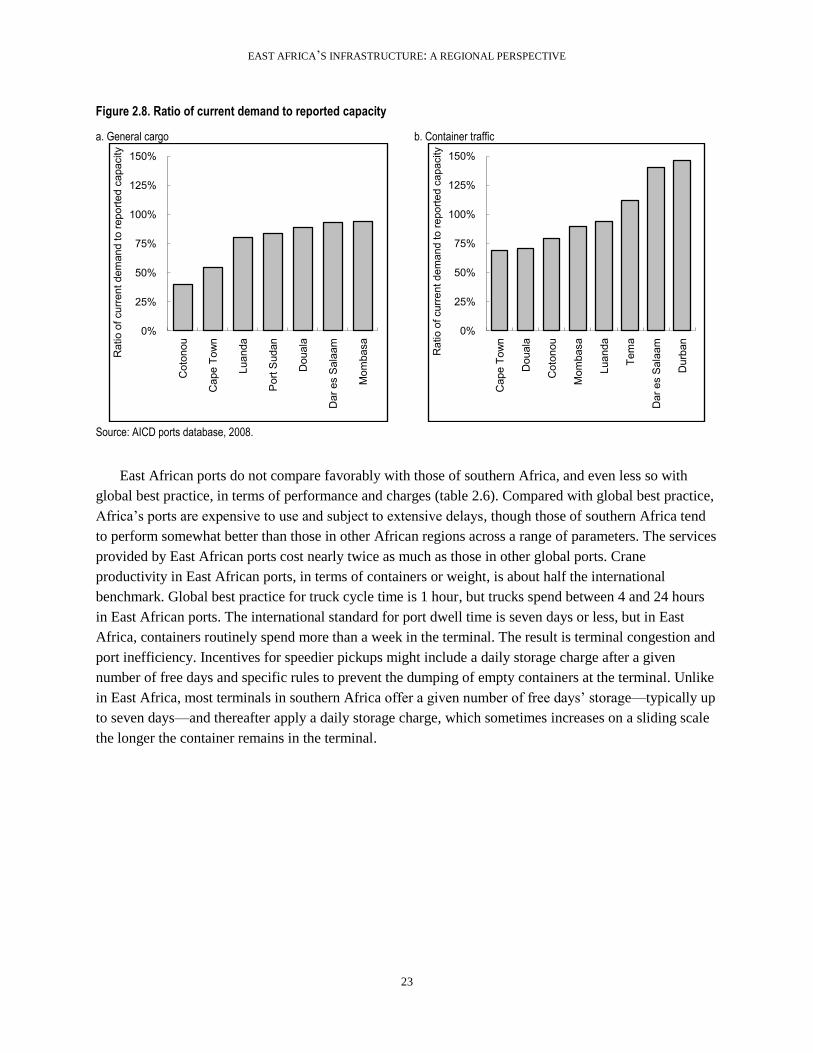
Owing to the rapid expansion of traffic, a few of the region’s ports are beginning to experience
capacity constraints (figure 2.8). This is most notable in the case of Mombasa (Kenya) and Dar es Salaam
(Tanzania), where the volume of general cargo and container traffic significantly exceeds design capacity.
Port Sudan (Sudan) is also experiencing capacity constraints with respect to container traffic. All three of
these ports are also reaching their limits with respect to dry-bulk cargo. There is some scope for easing
capacity constraints by improving the efficiency of port performance, although ultimately new
investments will be required.
The ports of Mombasa and Tanzania have traditionally been the most important players in the
container sector on the east coast of Africa. Double-digit growth in this sector has now pushed both ports
to their limit, however, and new capacity is essential.
EAST AFRICA’S INFRASTRUCTURE: A REGIONAL PERSPECTIVE
22
Figure 2.7. East Africa’s port network
Table 2.5. Growth in containerized and general cargo traffic between 1995 and 2005
CONTAINER TRAFFIC GENERAL CARGO TRAFFIC
TEUs Percentage ‗000s tonnes Percentage
1995 2005 Overall growth
Average annual growth 1995 2005
Overall growth
Average annual growth
East Africa 505.1 1,395.0 +276 +10.7 13.8 38.4 +278 +10.8
North Africa 1,637.3 5,267.9 +322 +12.4 12.3 16.5 +134 +3.0
Southern Africa 1,356.0 3,091.8 +228 +8.6 2.7 14.5 +532 +18.2
West Africa 1,035.4 4,082.0 +394 +14.7 23.1 61.2 +265 +10.2
Total 4,533.8 13,836.7 +305 +11.8 52.0 130.7 +251 +9.7
Source: Ocean Shipping Consultants Limited 2010.
South Sudan
EAST AFRICA’S INFRASTRUCTURE: A REGIONAL PERSPECTIVE
23
Figure 2.8. Ratio of current demand to reported capacity
a. General cargo b. Container traffic
Source: AICD ports database, 2008.
East African ports do not compare favorably with those of southern Africa, and even less so with
global best practice, in terms of performance and charges (table 2.6). Compared with global best practice,
Africa’s ports are expensive to use and subject to extensive delays, though those of southern Africa tend
to perform somewhat better than those in other African regions across a range of parameters. The services
provided by East African ports cost nearly twice as much as those in other global ports. Crane
productivity in East African ports, in terms of containers or weight, is about half the international
benchmark. Global best practice for truck cycle time is 1 hour, but trucks spend between 4 and 24 hours
in East African ports. The international standard for port dwell time is seven days or less, but in East
Africa, containers routinely spend more than a week in the terminal. The result is terminal congestion and
port inefficiency. Incentives for speedier pickups might include a daily storage charge after a given
number of free days and specific rules to prevent the dumping of empty containers at the terminal. Unlike
in East Africa, most terminals in southern Africa offer a given number of free days’ storage—typically up
to seven days—and thereafter apply a daily storage charge, which sometimes increases on a sliding scale
the longer the container remains in the terminal.
0%
25%
50%
75%
100%
125%
150%
Cot
onou
Cap
e To
wn
Luan
da
Por
t Sud
an
Dou
ala
Dar
es
Sal
aam
Mom
basa
Rat
io o
f cur
rent
dem
and
to re
porte
d ca
paci
ty
0%
25%
50%
75%
100%
125%
150%
Cap
e To
wn
Dou
ala
Cot
onou
Mom
basa
Luan
da
Tem
a
Dar
es
Sal
aam
Dur
ban
Rat
io o
f cur
rent
dem
and
to re
porte
d ca
paci
ty
EAST AFRICA’S INFRASTRUCTURE: A REGIONAL PERSPECTIVE
24
Table 2.6. Comparative port performance across African regions
East Africa Southern Africa West Africa Global best
practice
Performance
Container Dwell Time (days) 5–28 4–8 11–30 <7
Truck Processing Time (hours) 4–24 2–12 6–24 1
Crane Productivity (containers per hour) 8–20 8–22 7–20 20–30
Crane Productivity (tonnes per hour) 8–25 10–25 7–15 >30
Charges
Container handling (US$ per TEU) 135–275 110–243 100–320 80–150
General cargo handling charge (US$ per tonne) 6–15 11–15 8–15 7–9
Source: AICD ports database.
Performance of individual ports
in East Africa varies (table 2.7).
Mombasa (Kenya) and Dar es
Salaam (Tanzania) exhibit generally
good performance that is within
global best practices on some
indicators. On the other hand, Port
Sudan (Sudan) and Djibouti
(Djibouti) exhibit much lower port
efficiency levels. Container dwell
times in Mombasa and Dar es
Salaam are within global best
practice benchmarks, but the dwell
times in other ports are significantly longer, particularly in Port Sudan. Truck processing time at Port
Sudan is almost five times that at Mombasa or Dar es Salaam. Crane productivity (in terms of containers
handled per hour) in Dar es Salaam is twice that of Mombasa. Dar es Salaam, which performs slightly
better than Mombasa in terms of productivity, levies higher port charge —four times more than Mombasa
(the cheapest port in the region) for container handling. The prices for Mombasa are consistent with
global best practice benchmarks.
Mombasa and Dar es Salaam are natural transshipment points on the East African coastline. While
both ports have pursued transshipment, both now face severe challenges to increase their national cargo
flows over the short term (box 2.2), and their limited capacity is likely to curtail their transshipment
activities. Djibouti, on the other hand, may soon provide a new solution to transshipment along the East
African coast. DP World is scheduled to bring a new container-terminal facility on stream at Djibouti, one
intended specifically to offer significant transshipment capacity for East Africa and the Indian Ocean.
Table 2.7. Comparative performance across East African ports
Djibouti Mombasa Port
Sudan Dar es Salaam
Container dwell time (days) 8 5 28 7
Truck processing time (hours) 12 5 24 5
Container crane productivity (container per hour) 17 10 8 20
Charges
Container cargo handling charge (US$ per TEU) 135 68 150 275
General cargo handling charge (US$ per tonne)
8 7 10 14
Source: AICD ports database.
EAST AFRICA’S INFRASTRUCTURE: A REGIONAL PERSPECTIVE
25
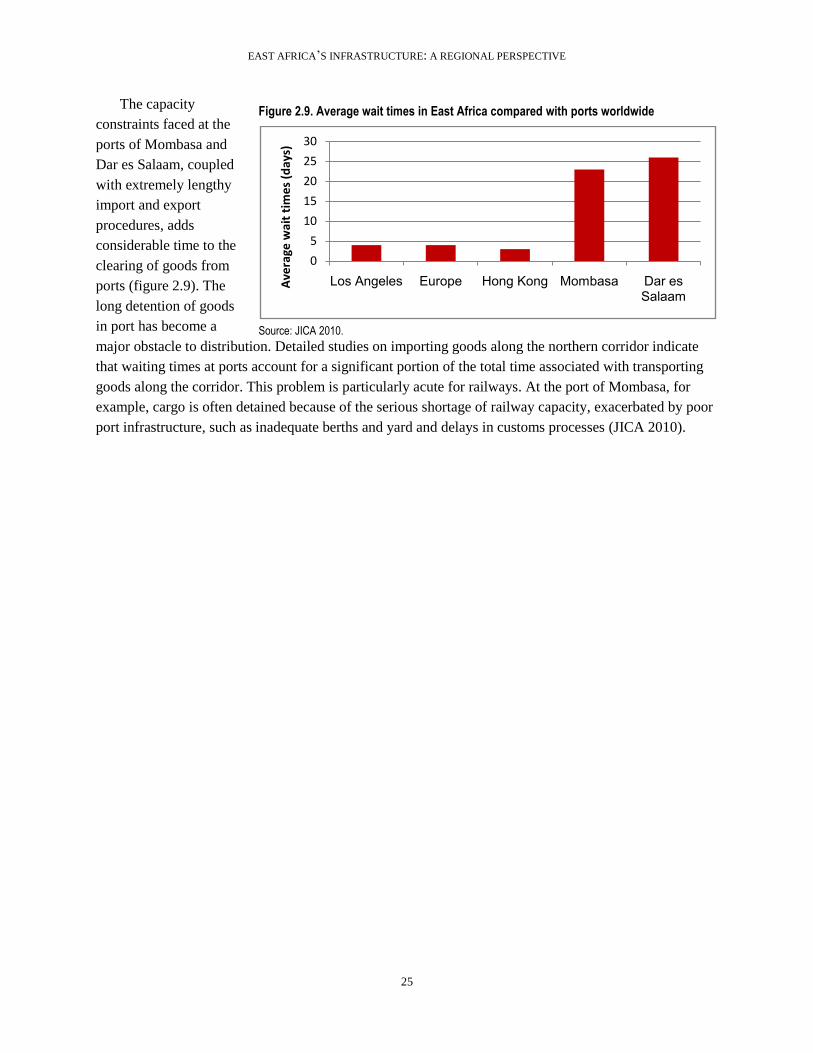
The capacity
constraints faced at the
ports of Mombasa and
Dar es Salaam, coupled
with extremely lengthy
import and export
procedures, adds
considerable time to the
clearing of goods from
ports (figure 2.9). The
long detention of goods
in port has become a
major obstacle to distribution. Detailed studies on importing goods along the northern corridor indicate
that waiting times at ports account for a significant portion of the total time associated with transporting
goods along the corridor. This problem is particularly acute for railways. At the port of Mombasa, for
example, cargo is often detained because of the serious shortage of railway capacity, exacerbated by poor
port infrastructure, such as inadequate berths and yard and delays in customs processes (JICA 2010).
Figure 2.9. Average wait times in East Africa compared with ports worldwide
Source: JICA 2010.
0
5
10
15
20
25
30
Los Angeles Europe Hong Kong Mombasa Dar es Salaam
Ave
rage
wai
t ti
me
s (d
ays)
EAST AFRICA’S INFRASTRUCTURE: A REGIONAL PERSPECTIVE
26
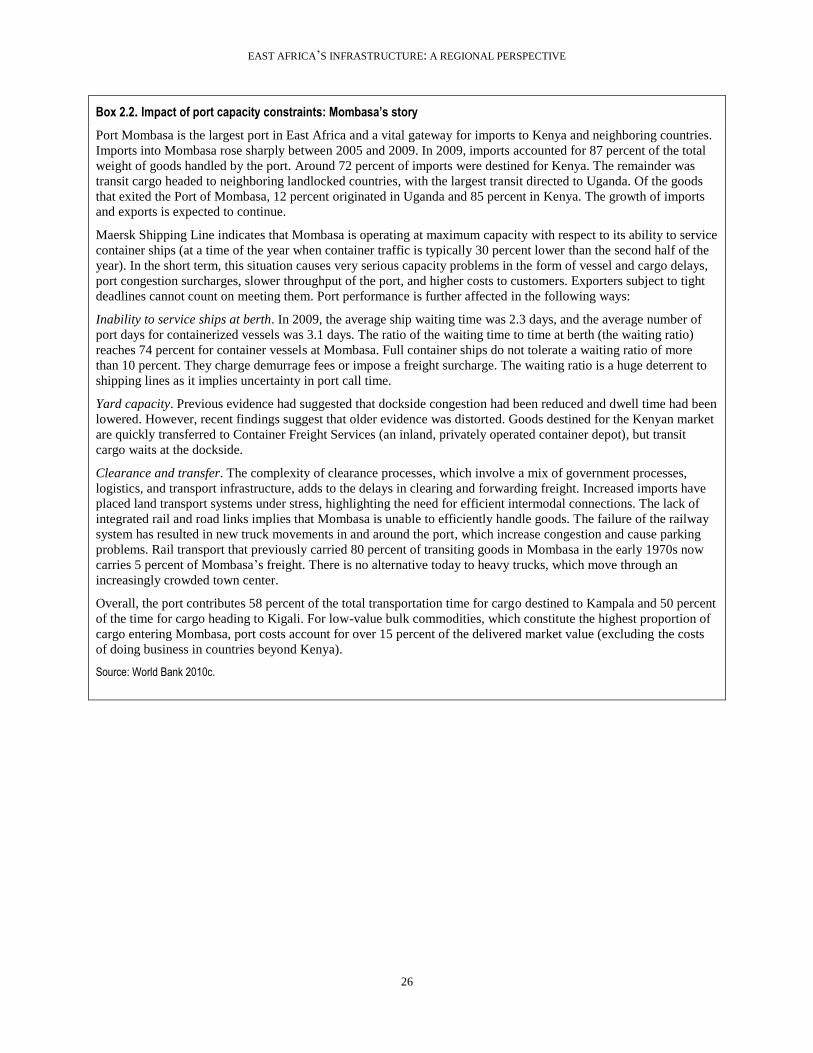
Box 2.2. Impact of port capacity constraints: Mombasa’s story
Port Mombasa is the largest port in East Africa and a vital gateway for imports to Kenya and neighboring countries.
Imports into Mombasa rose sharply between 2005 and 2009. In 2009, imports accounted for 87 percent of the total
weight of goods handled by the port. Around 72 percent of imports were destined for Kenya. The remainder was
transit cargo headed to neighboring landlocked countries, with the largest transit directed to Uganda. Of the goods
that exited the Port of Mombasa, 12 percent originated in Uganda and 85 percent in Kenya. The growth of imports
and exports is expected to continue.
Maersk Shipping Line indicates that Mombasa is operating at maximum capacity with respect to its ability to service
container ships (at a time of the year when container traffic is typically 30 percent lower than the second half of the
year). In the short term, this situation causes very serious capacity problems in the form of vessel and cargo delays,
port congestion surcharges, slower throughput of the port, and higher costs to customers. Exporters subject to tight
deadlines cannot count on meeting them. Port performance is further affected in the following ways:
Inability to service ships at berth. In 2009, the average ship waiting time was 2.3 days, and the average number of
port days for containerized vessels was 3.1 days. The ratio of the waiting time to time at berth (the waiting ratio)
reaches 74 percent for container vessels at Mombasa. Full container ships do not tolerate a waiting ratio of more
than 10 percent. They charge demurrage fees or impose a freight surcharge. The waiting ratio is a huge deterrent to
shipping lines as it implies uncertainty in port call time.
Yard capacity. Previous evidence had suggested that dockside congestion had been reduced and dwell time had been
lowered. However, recent findings suggest that older evidence was distorted. Goods destined for the Kenyan market
are quickly transferred to Container Freight Services (an inland, privately operated container depot), but transit
cargo waits at the dockside.
Clearance and transfer. The complexity of clearance processes, which involve a mix of government processes,
logistics, and transport infrastructure, adds to the delays in clearing and forwarding freight. Increased imports have
placed land transport systems under stress, highlighting the need for efficient intermodal connections. The lack of
integrated rail and road links implies that Mombasa is unable to efficiently handle goods. The failure of the railway
system has resulted in new truck movements in and around the port, which increase congestion and cause parking
problems. Rail transport that previously carried 80 percent of transiting goods in Mombasa in the early 1970s now
carries 5 percent of Mombasa’s freight. There is no alternative today to heavy trucks, which move through an
increasingly crowded town center.
Overall, the port contributes 58 percent of the total transportation time for cargo destined to Kampala and 50 percent
of the time for cargo heading to Kigali. For low-value bulk commodities, which constitute the highest proportion of
cargo entering Mombasa, port costs account for over 15 percent of the delivered market value (excluding the costs
of doing business in countries beyond Kenya).
Source: World Bank 2010c.
EAST AFRICA’S INFRASTRUCTURE: A REGIONAL PERSPECTIVE
27
Air transport
Figure 2.10. East Africa’s regional airports and air traffic flows
Viewed from a continental perspective, there is strong regional air connectivity in East Africa, with
clear transportation hubs. The map of the top 60 intracontinental routes in Africa highlights the main
traffic patterns across the continent, and East Africa figures quite prominently in these routes (figure
2.11). While none of Africa’s Sub-Saharan airports (with the possible exception of Johannesburg) moves
enough traffic to be considered a global air transport hub, a number of regional air transport hubs have
emerged during the last decade. On the eastern and southern side of the continent, a strong hub-and-spoke
structure centered on Johannesburg—and to a lesser extent on Nairobi and Addis Ababa—is apparent. All
East African countries are connected to Nairobi and most to Addis Ababa. Almost all of the countries in
the region also have bilateral connectivity with each other.
South Sudan
EAST AFRICA’S INFRASTRUCTURE: A REGIONAL PERSPECTIVE
28
East Africa has a vibrant
internal air transport market—the
second-largest in Africa after that
of the SADC. Relative to other
regions, EAC lags behind both
the Southern African
Development Community
(SADC) and the Economic
Community of West African
States (ECOWAS) in terms of
domestic seats flown but has the
highest number of seats flown
within Africa. The market has
been growing, although it is
consistently dominated by Kenya
Airways, which now has 60
percent of the market share of
international travel within the
community. An average of 13
pairs of domestic cities and 29
international city-pairs are served
within the community. The number of international pairs served is the highest in the continent (table 2.8).
Table 2.8. Benchmarking air transport in EAC and other regional economic communities
ECOWAS CEMAC EAC SADC
Annual seats, domestic (‗000s) 2,034 235 1,345 3,076
Annual seats, international within SSA (‗000s) 362 187 1,196 964
Domestic city pairs served (number) 8 4 13 17
International city pairs (number) 20 15 29 26
Seat-km in old aircraft ( of total) 43 30 33 29
Seat-km in recent aircraft ( of total) 57 70 67 71
Domestic market Herfindahl Index 0.84 0.83 0.64 0.73
International market Herfindahl Index 0.19 0.24 0.25 0.34
Market Herfindahl Index (domestic and international) 0.21 0.30 0.27 0.42
Source: AICD database.
Note: ECOWAS = Economic Community of West African States; CEMAC = Economic and Monetary Community of Central Africa; EAC = East African Community; SADC = Southern African Development Community.
Air transport capacity within the East African countries increased markedly during the last decade. A
similar, although less pronounced, trend is visible for the EAC group (figure 2.12). In East Africa, the
number of seats grew 50 percent from 8 million in 2001 to 12 million in 2007, and in EAC the number of
seats increased from 7.1 million in 2001 to 8.9 million in 2007 (a 24 percent increase) .
Figure 2.11. International routes within Sub-Saharan Africa in 2007
Source: Bofinger 2009.
EAST AFRICA’S INFRASTRUCTURE: A REGIONAL PERSPECTIVE
29
In per capita terms, East Africa had the second-most aircraft seats in all of Africa in 2007 after
SADC. This is striking for a region that has one of the lowest per capita incomes in Africa. Two
of the three strongest carriers in Sub-Saharan Africa—Kenya Airways and Ethiopian Airlines—
are very active in the market. The routes between Kenya and Tanzania are frequently traveled,
reflecting tourist travel for the game parks and Mount Kilimanjaro, as are the routes between
Kenya and landlocked Uganda
Figure 2.12. Seats for intraregional travel within East Africa
a. East Africa b. EAC
Source: Bofinger 2009.
Air transport connectivity for countries within East Africa
is rather mixed. All countries except Burundi and Rwanda
have relatively good international connectivity. Burundi is
connected through five international city pairs, and Rwanda
through seven. The other countries have a much higher
number of international city pairs and are well connected with
the regional hub in Kenya. It is because of its hub status—
both in East Africa and beyond—that Kenya has exceptionally
high international connectivity. Domestic connectivity within
Ethiopia is the highest in the region. Kenya, on the other hand,
has low domestic connectivity, which reflects the limited
purchasing power of its domestic market. Burundi and
Rwanda have no domestic connectivity (table 2.9).
Not all countries within EAC and the broader East Africa region are connected with one another.
They do, however, have direct flights to either Kenya or Ethiopia, which then have frequent direct flights
to all of the EAC and East African countries (table 2.10). Most countries in the region have at least seven
flights per week to one of the main regional hubs. The route between Tanzania and Kenya is the most
frequently travelled, followed by the route between Kenya and Uganda.
0
2,000,000
4,000,000
6,000,000
8,000,000
10,000,000
12,000,000
14,000,000
2001 2004 2007
0
1,000,000
2,000,000
3,000,000
4,000,000
5,000,000
6,000,000
7,000,000
8,000,000
9,000,000
10,000,000
2001 2004 2007
Table 2.9. International and domestic connectivity for 2007 (number of city pairs served)
Domestic city
pairs International city
pairs
Burundi 0 5
Ethiopia 45 52
Kenya 15 77
Rwanda 0 7
Sudan 13 32
Tanzania 19 38
Uganda 4 19
Source: Derived from Bofinger 2009.
EAST AFRICA’S INFRASTRUCTURE: A REGIONAL PERSPECTIVE
30
Table 2.10. All flights from one week in November 2007 for EAC and East Africa
a. East Africa b. EAC
Destination
Bur
undi
Eth
iop
ia
Ken
ya
Rw
anda
Sud
an
Tan
zani
a
Uga
nda
Orig
in
Burundi 7 8 20 7
Ethiopia 7 11 7 15 21 14
Kenya 7 11 15 34 87 39
Rwanda 20 7 14 1 11
Sudan 12 17 4
Tanzania 7 48 6
Uganda 7 14 39 11 12 16
Destination
Bur
undi
Ken
ya
Rw
anda
Tan
zani
a
Uga
nda
Orig
in
Burundi 8 20 7
Kenya 7 15 87 39
Rwanda 20 14 1 11
Tanzania 48 6
Uganda 7 39 11 16
Beyond basic connectivity, it is also important to evaluate the convenience and speed of air travel.
For most countries, most flights that originate from within the country are direct. About 70 percent of
flights originating in all countries except Tanzania are direct. Many flights that originate in Nairobi or
Addis are direct, reflecting the status of those cities as hubs for air transport in East Africa. Of the 61
flights that originate in Tanzania, however, only 36 are direct (table 2.11a). The travel times for flights
from Rwanda to Uganda and Burundi are longer than for flights in other parts of the regional economic
community, which is largely due to waiting time at airports (table 2.11b).
According to a recent study, EAC has been rated as having an overall implementation score of three
out of five for the Yamoussoukro Decision. The rating is based on the percentage of flights in the region
that are flown under so-called fifth-freedom arrangements. Owing to the presence of two strong regional
carriers and a clear hub system, such flights are not as common in EAC as in central or West Africa. The
EAC council issued a directive to amend bilateral agreements among EAC states to conform to the
Yamoussoukro Decision. The amendments remain pending, however, and air services have not been
liberalized. Despite having some of the larger and more dominant airlines in Africa (Kenya and Ethiopia),
East Africa has a poor liberalization record, which can be attributed to the presence of power airlines that
are able to negotiate bilateral contracts individually to their own best interest rather than following
regional initiatives.
The evolution of the regional market structure since 2001 has been in the direction of consolidating
the position of the two dominant carriers, while at the same time providing space for newcomers to
emerge (table 2.12). As of 2007, Kenya Airlines still maintained a large share of the market, and
Ethiopian Airlines remained the second-most significant player in the market. Kenyan airlines controlled
around 42 percent of the market in 2001 and now controls 47 percent. Ethiopian Airlines now controls 19
percent of the market, up from 11 percent in 2007. These two airlines remain the dominant carriers in the
region. Nevertheless, some of the smaller players are gaining a larger share of the market. For example,
Africa Start Airways and Rwandair Express, both of which had no market share in 2001, controlled
around 8 percent and 11 percent of the market, respectively, in 2007.
EAST AFRICA’S INFRASTRUCTURE: A REGIONAL PERSPECTIVE
31
Table 2.11. Proportion of direct flights and speed of air service in East Africa
a. Directness of service b. Speed of service
All flights Direct flights
Burundi 42 31
Ethiopia 75 54
Kenya 193 168
Rwanda 53 49
Sudan 33 24
Tanzania 61 36
Uganda 99 78
Destination
Bur
undi
Eth
iopi
a
Ken
ya
Rw
anda
Sud
an
Tan
zani
a
Uga
nda
Orig
in
Burundi 460 410 296 512
Ethiopia 460 582 620 497 557 610
Kenya 350 582 363 298 275 436
Rwanda 16 620 305 590 73
Sudan 572 330 513
Tanzania 662 193 661
Uganda 256 610 440 176 332 307
Source: Bofinger 2009.
Ethiopian Airlines and Kenya Airways have been gaining a larger share outside of East Africa in
markets in West and Central Africa (table 2.13). They are using fifth-freedom provisions to take over
routes discontinued following the collapse of major carriers in West Africa. One effect of the two
carriers’ expansion is a slow rise in east-west traffic.
Table 2.12. Grading of the level of the implementation of the Yamoussoukro Decision
Community General status of YD implementation Status of air services liberalization Overall implementation score
AMU No implementation. No liberalization within the AMU initiated, but need is recognized.
1
Banjul Accord Group Principles of the YD agreed upon in a multilateral air services agreement.
Up to fifth freedom granted, tariffs are free, and capacity/frequency is open.
4
Economic and Monetary Community of Central Africa
Principles of the YD agreed upon in an air transport program. Some minor restrictions remain.
Up to fifth freedom granted, tariffs are free, and capacity/frequency is open. Maximum two carriers per state may take part.
5
Common Market for Eastern and Southern Afric
Full liberalization agreed upon (―legal Notice No. 2‖), but application and implementation remain pending until a joint competition authority is established.
Pending. Operators will be able to serve any destination (all freedoms), and tariffs and capacity/frequency will be free.
3
East African Community
EAC council issued a directive to amend bilaterals among the EAC states to conform with the YD.
Air services are not liberalized, as the amendments of bilaterals remain pending.
3
Southern African Development Community
No steps taken toward implementation, although the civil aviation policy includes gradual liberalization of air services within the SADC.
No liberalization has been initiated. 2
West African Economic and Monetary Union
The YD is fully implemented. All freedoms, including cabotage, granted. Tariffs have been liberalized.
5
EAST AFRICA’S INFRASTRUCTURE: A REGIONAL PERSPECTIVE
32
Most countries in EAC have made good progress toward achieving international standards in air
safety, and regional collaboration in this area is already well underway (figure 2.13). Ethiopia is the only
country in all of Africa, other than South Africa, that has complied with all international standards in air
safety. Ethiopia is one of the few countries in Africa
that carry the U.S. FAA category 1 rating for good
safety oversight; that rating entitles it to fly directly
into the United States. Kenya and Tanzania are in the
process of improving their oversight agencies. In
addition, the EAC countries are pooling resources to
bolster their newly formed regional safety oversight
organization—the East African Civil Aviation
Authority—with support from the U.S. Department of
Transportation’s Safe Skies for Africa program.
Though not yet fully operational, this organization is
now collocated with the EAC headquarters in Arusha,
Tanzania. Countries still facing hurdles in their
oversight include Uganda and Rwanda, which have
had difficulties in modernizing their standards for
awarding air carrier certificates; and Burundi, owing to
its legacy of conflict.
Figure 2.13. Status of African safety oversight, using several criteria
Source: Bofinger 2009.
Table 2.13. Changes in air transport market in East Africa, 2001–07
Market share (%) 2001 2004 2007
Kenya Airways 42 51 47
Ethiopian Airlines Enterprise 11 17 19
Rwandair Express 8 11
African Star Airways Ltd. 8
Precision Air Services Ltd. <1 3 4
Emirates 5 3 3
Air Tanzania Company Ltd. 6 9 1
East African Safari Air 5
East African Airlines Limited 12
FlyGlobeSpan 6
British Airways P.L.C. 5
Source: Bofinger 2009.
EAST AFRICA’S INFRASTRUCTURE: A REGIONAL PERSPECTIVE
33
Several airports in East Africa—including Kenya, Tanzania, Rwanda, and Uganda—are equipped
with air traffic surveillance systems of some sort. Kenya is an exception in the region, with over 90
percent radar coverage. Ethiopia, although it is an important hub, had no radar coverage as of 2008.
Rwanda’s radar is primarily for military use, and Uganda and Tanzania have systems covering the
approaches to their main airports in Entebbe and Dar es Salaam.
The air fleet in East Africa underwent a dramatic modernization in 2007. Across Africa, there has
been substantial investment in new aircraft, leading to an overall renewal in the aircraft fleet. This trend is
dramatically different from that observed in West Africa. The share of aircraft rated ―western recent‖ and
―western somewhat recent‖ in use in East Africa increased by 30 percent between 2001 and 2007
(figure 2.14).
The air cargo of Africa, the Middle East, and Latin America constitutes around 11 percent of global
air cargo traffic. The bulk of Africa’s air cargo traffic is handled by three countries: South Africa (20
percent), Kenya (15 percent), and Egypt (14 percent). Several other East African countries handle smaller
volumes of Africa’s air cargo traffic, namely Sudan (13 percent), Ethiopia (3 percent), and Uganda (3
percent). Europe is the primary destination for African air cargo, accounting for two-thirds of African air
cargo. Air cargo traffic from Africa to Europe is expected to grow at a rate of more than 5 percent
between 2005 and 2025. Primary exports are counter-seasonal flowers and perishables, with relatively
little return cargo. Kenya is a large exporter of flowers to the Netherlands, Nairobi is one of the three
main airports in Africa that handles air cargo traffic. In addition to exporting cut flowers, it handles strong
domestic demand for imports shipped via air. The airport has become one of Africa’s largest air cargo
gateways (box 2.3).
Figure 2.14. Age distribution of airline fleet in East Africa
Source: Derived from Bofinger 2009.
Two East African airlines—Kenya Airways and Ethiopian Airlines—in addition to South African
Airways provide high quality air cargo services in collaboration with other major international operators.
The small volume of air cargo originating from Africa has often placed constraints on air cargo handling
15
15
43
26
2001
Western recent Western somewhat recent
Western old Western age unkown
50
20
28
22007
Western recentWestern somewhat recentWestern oldWestern age unkown
EAST AFRICA’S INFRASTRUCTURE: A REGIONAL PERSPECTIVE
34
operations. Recently, however, governments in Africa have given exclusive rights to third parties for
services such as ground handling and ramp and warehouse services. A growing number of international
operators are handling air cargo. These operators not only provide specialized skills but also provide
business connection services with carriers and forwarders. They have provided standard quality air cargo
handling and have adapted to the complex regulatory environments that are prevalent among African
countries. One such company is Swissport Cargo, which offers services in 20 Latin American countries
and 8 African countries, making use of joint ventures in which it holds a majority stake in Brazil,
Philippines, South Africa, Kenya, and Tanzania.
The freight rates for air cargo from
Europe to East Africa are surprisingly
lower than for several other regions of the
world (table 2.14). The pricing of cargo is
determined by market conditions, and
discriminatory pricing is used to improve
price margins based on level of service.
Prices are increasingly differentiated
according to guaranteed delivery time.
Freight rates computed per kilometer
taper off with distance, in part because
the block costs per kilometer decline and
in part because the costs for cargo
handling are fixed.
Table 2.14. Air cargo freight rates
Trade routes $/kg
South China–Western Europe 4.39
South China–West Coast United States 4.62
South China–Middle East 6.54
West Europe–Middle East 2.01
East Coast United States–Middle East 2.00
West Europe–East Africa 3.45
West Europe–West Africa 6.44
China–Central Europe 8.85
Source: World Bank 2009b. Note: Excludes fuel surcharge which average $1.05 in May 2008.
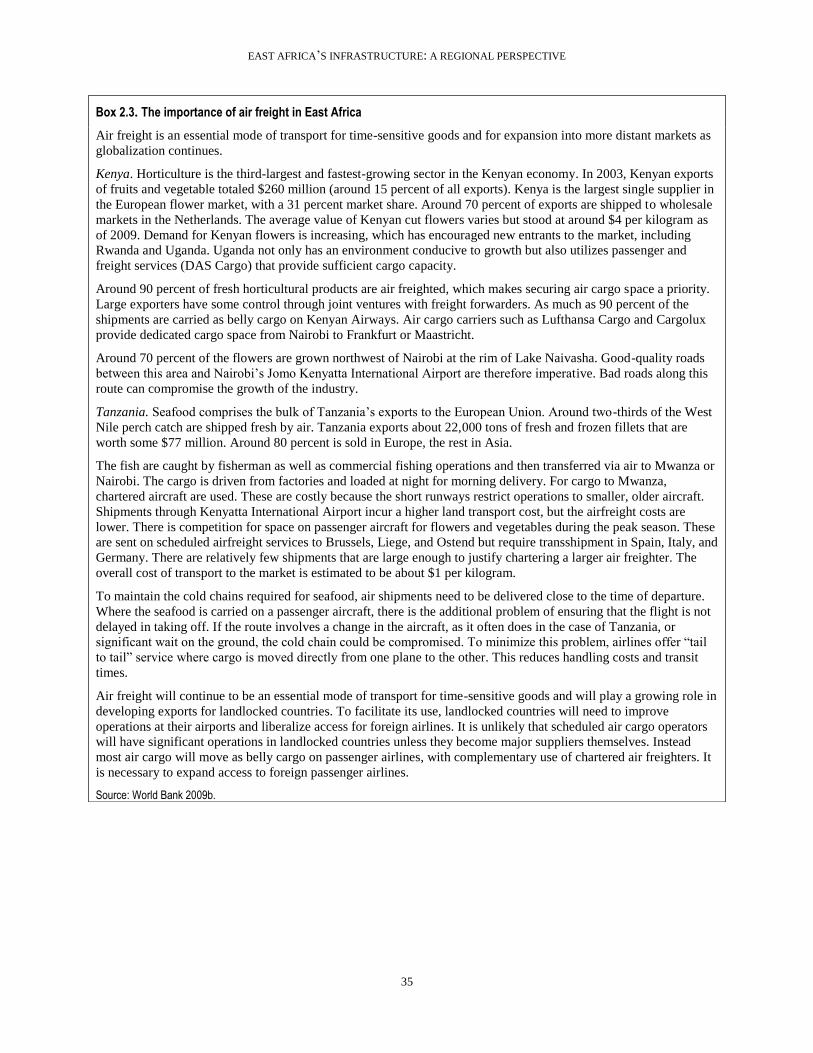
EAST AFRICA’S INFRASTRUCTURE: A REGIONAL PERSPECTIVE
35
Box 2.3. The importance of air freight in East Africa
Air freight is an essential mode of transport for time-sensitive goods and for expansion into more distant markets as
globalization continues.
Kenya. Horticulture is the third-largest and fastest-growing sector in the Kenyan economy. In 2003, Kenyan exports
of fruits and vegetable totaled $260 million (around 15 percent of all exports). Kenya is the largest single supplier in
the European flower market, with a 31 percent market share. Around 70 percent of exports are shipped to wholesale
markets in the Netherlands. The average value of Kenyan cut flowers varies but stood at around $4 per kilogram as
of 2009. Demand for Kenyan flowers is increasing, which has encouraged new entrants to the market, including
Rwanda and Uganda. Uganda not only has an environment conducive to growth but also utilizes passenger and
freight services (DAS Cargo) that provide sufficient cargo capacity.
Around 90 percent of fresh horticultural products are air freighted, which makes securing air cargo space a priority.
Large exporters have some control through joint ventures with freight forwarders. As much as 90 percent of the
shipments are carried as belly cargo on Kenyan Airways. Air cargo carriers such as Lufthansa Cargo and Cargolux
provide dedicated cargo space from Nairobi to Frankfurt or Maastricht.
Around 70 percent of the flowers are grown northwest of Nairobi at the rim of Lake Naivasha. Good-quality roads
between this area and Nairobi’s Jomo Kenyatta International Airport are therefore imperative. Bad roads along this
route can compromise the growth of the industry.
Tanzania. Seafood comprises the bulk of Tanzania’s exports to the European Union. Around two-thirds of the West
Nile perch catch are shipped fresh by air. Tanzania exports about 22,000 tons of fresh and frozen fillets that are
worth some $77 million. Around 80 percent is sold in Europe, the rest in Asia.
The fish are caught by fisherman as well as commercial fishing operations and then transferred via air to Mwanza or
Nairobi. The cargo is driven from factories and loaded at night for morning delivery. For cargo to Mwanza,
chartered aircraft are used. These are costly because the short runways restrict operations to smaller, older aircraft.
Shipments through Kenyatta International Airport incur a higher land transport cost, but the airfreight costs are
lower. There is competition for space on passenger aircraft for flowers and vegetables during the peak season. These
are sent on scheduled airfreight services to Brussels, Liege, and Ostend but require transshipment in Spain, Italy, and
Germany. There are relatively few shipments that are large enough to justify chartering a larger air freighter. The
overall cost of transport to the market is estimated to be about $1 per kilogram.
To maintain the cold chains required for seafood, air shipments need to be delivered close to the time of departure.
Where the seafood is carried on a passenger aircraft, there is the additional problem of ensuring that the flight is not
delayed in taking off. If the route involves a change in the aircraft, as it often does in the case of Tanzania, or
significant wait on the ground, the cold chain could be compromised. To minimize this problem, airlines offer ―tail
to tail‖ service where cargo is moved directly from one plane to the other. This reduces handling costs and transit
times.
Air freight will continue to be an essential mode of transport for time-sensitive goods and will play a growing role in
developing exports for landlocked countries. To facilitate its use, landlocked countries will need to improve
operations at their airports and liberalize access for foreign airlines. It is unlikely that scheduled air cargo operators
will have significant operations in landlocked countries unless they become major suppliers themselves. Instead
most air cargo will move as belly cargo on passenger airlines, with complementary use of chartered air freighters. It
is necessary to expand access to foreign passenger airlines.
Source: World Bank 2009b.
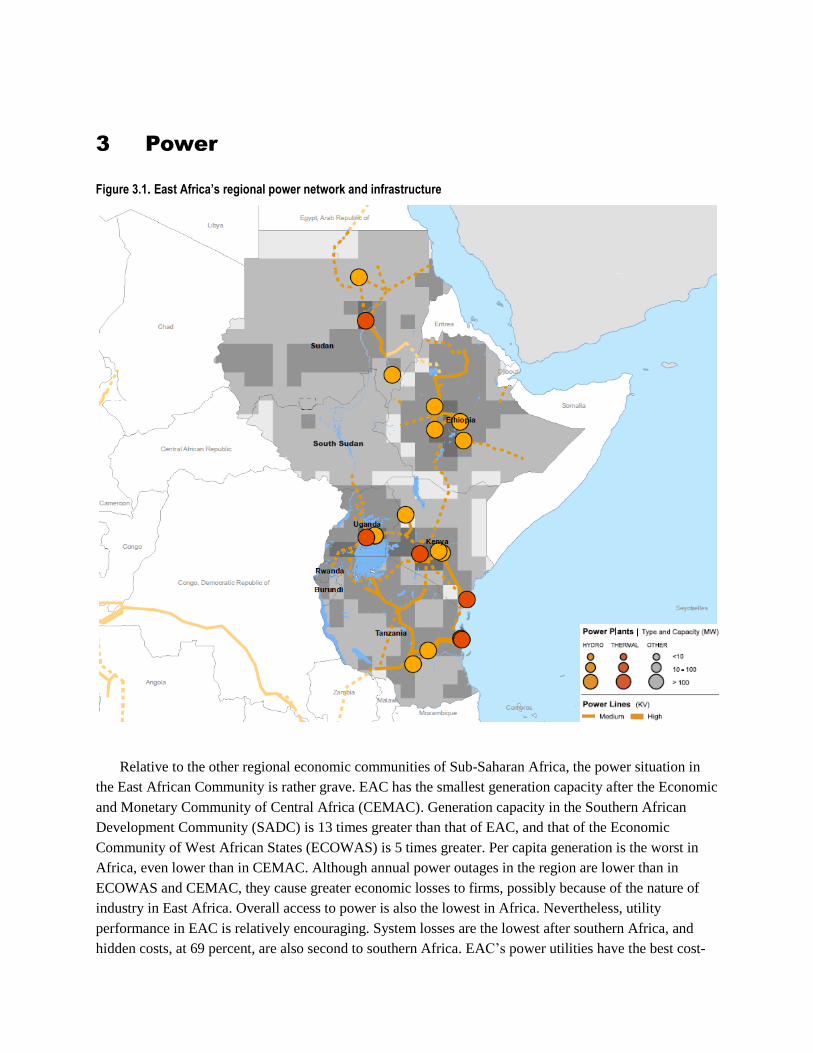
3 Power
Figure 3.1. East Africa’s regional power network and infrastructure
Relative to the other regional economic communities of Sub-Saharan Africa, the power situation in
the East African Community is rather grave. EAC has the smallest generation capacity after the Economic
and Monetary Community of Central Africa (CEMAC). Generation capacity in the Southern African
Development Community (SADC) is 13 times greater than that of EAC, and that of the Economic
Community of West African States (ECOWAS) is 5 times greater. Per capita generation is the worst in
Africa, even lower than in CEMAC. Although annual power outages in the region are lower than in
ECOWAS and CEMAC, they cause greater economic losses to firms, possibly because of the nature of
industry in East Africa. Overall access to power is also the lowest in Africa. Nevertheless, utility
performance in EAC is relatively encouraging. System losses are the lowest after southern Africa, and
hidden costs, at 69 percent, are also second to southern Africa. EAC’s power utilities have the best cost-
South Sudan
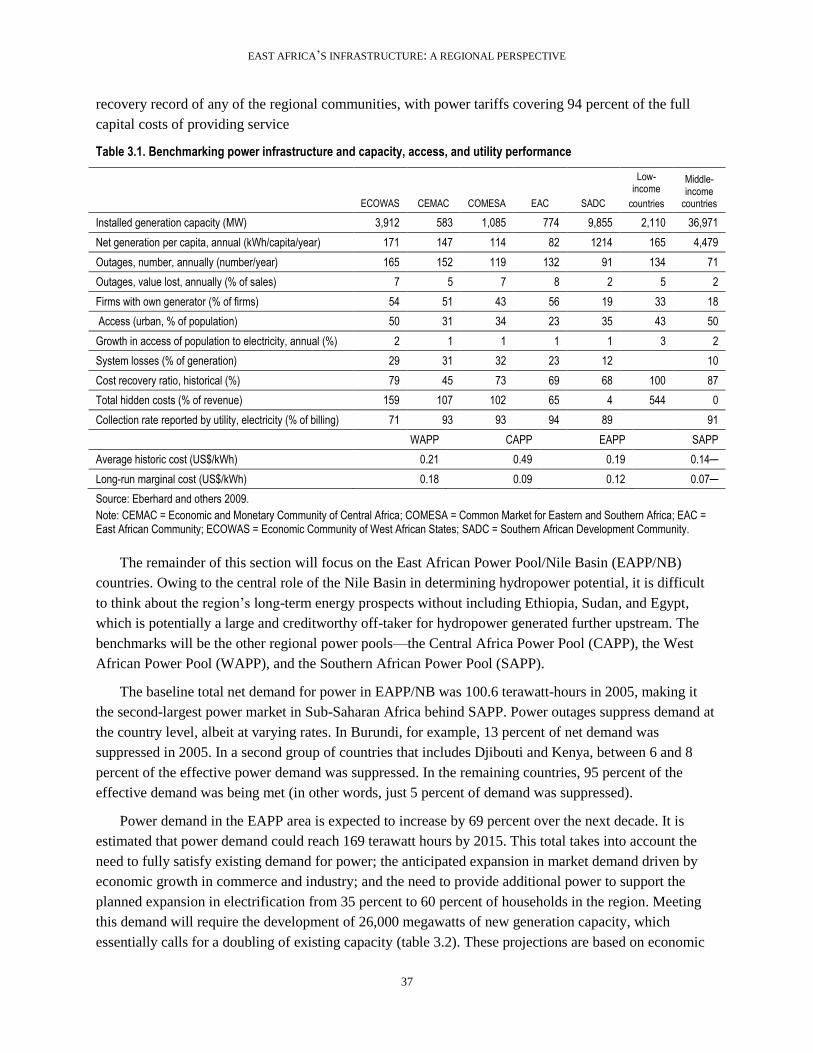
EAST AFRICA’S INFRASTRUCTURE: A REGIONAL PERSPECTIVE
37
recovery record of any of the regional communities, with power tariffs covering 94 percent of the full
capital costs of providing service
Table 3.1. Benchmarking power infrastructure and capacity, access, and utility performance
ECOWAS CEMAC COMESA EAC SADC
Low-income
countries
Middle-income
countries
Installed generation capacity (MW) 3,912 583 1,085 774 9,855 2,110 36,971
Net generation per capita, annual (kWh/capita/year) 171 147 114 82 1214 165 4,479
Outages, number, annually (number/year) 165 152 119 132 91 134 71
Outages, value lost, annually (% of sales) 7 5 7 8 2 5 2
Firms with own generator (% of firms) 54 51 43 56 19 33 18
Access (urban, % of population) 50 31 34 23 35 43 50
Growth in access of population to electricity, annual (%) 2 1 1 1 1 3 2
System losses (% of generation) 29 31 32 23 12 10
Cost recovery ratio, historical (%) 79 45 73 69 68 100 87
Total hidden costs (% of revenue) 159 107 102 65 4 544 0
Collection rate reported by utility, electricity (% of billing) 71 93 93 94 89 91
WAPP CAPP EAPP SAPP
Average historic cost (US$/kWh) 0.21 0.49 0.19 0.14─
Long-run marginal cost (US$/kWh) 0.18 0.09 0.12 0.07─
Source: Eberhard and others 2009.
Note: CEMAC = Economic and Monetary Community of Central Africa; COMESA = Common Market for Eastern and Southern Africa; EAC = East African Community; ECOWAS = Economic Community of West African States; SADC = Southern African Development Community.
The remainder of this section will focus on the East African Power Pool/Nile Basin (EAPP/NB)
countries. Owing to the central role of the Nile Basin in determining hydropower potential, it is difficult
to think about the region’s long-term energy prospects without including Ethiopia, Sudan, and Egypt,
which is potentially a large and creditworthy off-taker for hydropower generated further upstream. The
benchmarks will be the other regional power pools—the Central Africa Power Pool (CAPP), the West
African Power Pool (WAPP), and the Southern African Power Pool (SAPP).
The baseline total net demand for power in EAPP/NB was 100.6 terawatt-hours in 2005, making it
the second-largest power market in Sub-Saharan Africa behind SAPP. Power outages suppress demand at
the country level, albeit at varying rates. In Burundi, for example, 13 percent of net demand was
suppressed in 2005. In a second group of countries that includes Djibouti and Kenya, between 6 and 8
percent of the effective power demand was suppressed. In the remaining countries, 95 percent of the
effective demand was being met (in other words, just 5 percent of demand was suppressed).
Power demand in the EAPP area is expected to increase by 69 percent over the next decade. It is
estimated that power demand could reach 169 terawatt hours by 2015. This total takes into account the
need to fully satisfy existing demand for power; the anticipated expansion in market demand driven by
economic growth in commerce and industry; and the need to provide additional power to support the
planned expansion in electrification from 35 percent to 60 percent of households in the region. Meeting
this demand will require the development of 26,000 megawatts of new generation capacity, which
essentially calls for a doubling of existing capacity (table 3.2). These projections are based on economic
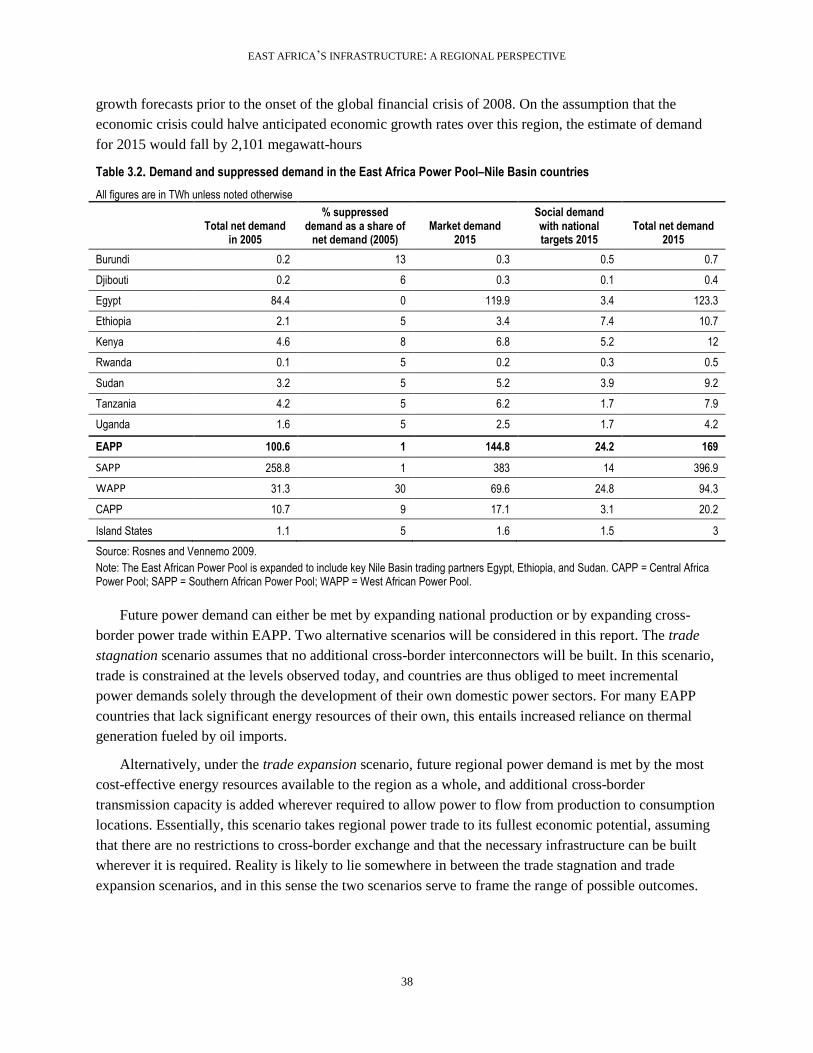
EAST AFRICA’S INFRASTRUCTURE: A REGIONAL PERSPECTIVE
38
growth forecasts prior to the onset of the global financial crisis of 2008. On the assumption that the
economic crisis could halve anticipated economic growth rates over this region, the estimate of demand
for 2015 would fall by 2,101 megawatt-hours
Table 3.2. Demand and suppressed demand in the East Africa Power Pool–Nile Basin countries
All figures are in TWh unless noted otherwise
Total net demand
in 2005
% suppressed demand as a share of
net demand (2005) Market demand
2015
Social demand with national targets 2015
Total net demand 2015
Burundi 0.2 13 0.3 0.5 0.7
Djibouti 0.2 6 0.3 0.1 0.4
Egypt 84.4 0 119.9 3.4 123.3
Ethiopia 2.1 5 3.4 7.4 10.7
Kenya 4.6 8 6.8 5.2 12
Rwanda 0.1 5 0.2 0.3 0.5
Sudan 3.2 5 5.2 3.9 9.2
Tanzania 4.2 5 6.2 1.7 7.9
Uganda 1.6 5 2.5 1.7 4.2
EAPP 100.6 1 144.8 24.2 169
SAPP 258.8 1 383 14 396.9
WAPP 31.3 30 69.6 24.8 94.3
CAPP 10.7 9 17.1 3.1 20.2
Island States 1.1 5 1.6 1.5 3
Source: Rosnes and Vennemo 2009.
Note: The East African Power Pool is expanded to include key Nile Basin trading partners Egypt, Ethiopia, and Sudan. CAPP = Central Africa Power Pool; SAPP = Southern African Power Pool; WAPP = West African Power Pool.
Future power demand can either be met by expanding national production or by expanding cross-
border power trade within EAPP. Two alternative scenarios will be considered in this report. The trade
stagnation scenario assumes that no additional cross-border interconnectors will be built. In this scenario,
trade is constrained at the levels observed today, and countries are thus obliged to meet incremental
power demands solely through the development of their own domestic power sectors. For many EAPP
countries that lack significant energy resources of their own, this entails increased reliance on thermal
generation fueled by oil imports.
Alternatively, under the trade expansion scenario, future regional power demand is met by the most
cost-effective energy resources available to the region as a whole, and additional cross-border
transmission capacity is added wherever required to allow power to flow from production to consumption
locations. Essentially, this scenario takes regional power trade to its fullest economic potential, assuming
that there are no restrictions to cross-border exchange and that the necessary infrastructure can be built
wherever it is required. Reality is likely to lie somewhere in between the trade stagnation and trade
expansion scenarios, and in this sense the two scenarios serve to frame the range of possible outcomes.
EAST AFRICA’S INFRASTRUCTURE: A REGIONAL PERSPECTIVE
39
Deepening regional integration would save
the EAPP/NB area $1 billion in annual energy
costs. Table 3.3 compares the cost of meeting
growing regional power demand over the next
decade in the trade stagnation and trade
expansion scenarios. Overall, under trade
expansion, the total annual cost of producing and
distributing power decreases from $16 billion to
$15 billion, saving the region $1 billion each
year. Under the trade expansion scenario,
countries would have to make larger investments
of $1.8 billion per year in capital-intensive
hydropower generation as well as investments of
$100 million per year in the development of
cross-border transmission capacity. These higher investments of $1.9 billion per year are more than
compensated by reduced variables costs of $2.9 billion per year, which is essentially the annual reduction
in the fuel bill associated with reduced reliance on thermal generation. The net savings are therefore $1
billion per year.
To make trade expansion possible, significant
additional investments would be required. Ethiopia and
Sudan—and to a lesser extent Rwanda, Tanzania, and
Uganda—would have to make sizeable investments to
develop their hydropower potential. Ethiopia, in particular,
would need to develop more than 6,700 megawatts of
additional hydropower capacity to supply export markets in
neighboring countries. Sudan would have to develop 3,100
megawatts of additional hydropower capacity. All countries
in the EAPP region would need to invest significantly in
developing a total of 27,755 megawatts of new cross-border
interconnectors to allow power to flow more readily around
the region (table 3.4). The heaviest transmission
investments would need to be made in Egypt, Ethiopia, and
Sudan, which would need to develop a combined 26,488
megawatts of interconnector capacity—95 percent of the total required for the region. Egypt and Sudan
would need to develop 10,000 and 13,941 megawatts of interconnection capacity, respectively.
The EAPP region would have to spend a sizable portion of its gross domestic product (GDP) to meet
its power needs. For individual countries, the impact of adopting trade can substantially influence the
burden of power sector development on their national economies. Under trade stagnation, three EAPP
countries (Burundi, Egypt, and Ethiopia) would need to spend between 7 and 12 percent of GDP per year
for 10 years to meet their power sector needs, an extremely tall order. Kenya, Tanzania, and Uganda
would all have to spend close to 5 percent of their GDP to meet their power sector needs—also a rather
high share of GDP.
Table 3.3. Annualized costs of system expansion in EAPP, 2015
US$ billions Trade
expansion
Trade stagnation
Base growth Low
growth
New Investment
Generation 4.4 2.6 4.2
Interconnectors 0.1 0 0.1
Distribution 1.1 1.1 1
Refurbishment 0.5 0.5 0.5
Variable cost 6.8 9.7 5.6
Total cost 15 16 13.5
Source: Rosnes and Vennemo 2009.
Table 3.4. Additional infrastructure requirements for trade expansion (MW)
MW Interconnectors Additional
hydropower
EAPP/NBI 27,755 10,968
Burundi 78 0
Egypt 10,000 0
Ethiopia 2,997 6,766
Kenya 266 0
Rwanda 120 236
Sudan 13,491 3,136
Tanzania 266 279
Uganda 537 551
EAST AFRICA’S INFRASTRUCTURE: A REGIONAL PERSPECTIVE
40
Under trade expansion, the pattern of spending shifts. Kenya, Burundi, and Egypt would need to
spend less than they do under trade stagnation to meet the regional power infrastructure needs. Ethiopia,
Sudan, Tanzania, and Uganda would have to spend more under trade expansion to meet their
infrastructure needs. In the extreme case, Ethiopia would have to spend as much as 6 percent more of its
GDP under trade expansion than under trade stagnation. This reflects the important role that Ethiopia
would assume as an exporter of hydropower for the region under trade expansion.
Figure 3.2. Regional spending needs as a percentage of GDP
Source: Derived from Rosnes and Vennemo 2009.
In 2005, power trade flows in the EAPP were just 0.28 terawatt-hours of imports and 0.18 terawatt-
hours of exports, about 2.1 percent of the electricity generated. Although EAPP is the third-most active
regional power pool in Africa, after SAPP and WAPP, the volumes of power involved are very small. The
main flows involve Egypt importing power, and Uganda exporting small amounts of power to Rwanda
and Tanzania (figure 3.3a).
Under trade stagnation, future trade volumes would be 12 terawatt-hours per year up to 2015, and the
pattern of trade would shift somewhat. Most notably, under trade stagnation, gas-fired power capacity and
production would rise in Egypt and Kenya, and less hydropower would be developed in Ethiopia, Sudan,
Uganda, and Rwanda. Because the existing transmission network remains in the trade stagnation scenario,
there would be very little trade (figures 3.3b, 3.4b).
Under trade expansion, the volume of power traded in EAPP could increase substantially to 162
terawatt-hours by 2015. The key change under trade expansion is that Ethiopia and Sudan would fully
develop their hydropower potential and become the major power exporters of the region, sending power
into neighboring countries, particularly Egypt. Under this scenario, Ethiopia could export as much as 200
percent of its domestic consumption and Sudan more than 100 percent of its domestic consumption.
Rwanda and Uganda would also become power exporters. While the volume of their exports would be
0%
2%
4%
6%
8%
10%
12%
14%
16%
18%
20%
Rwanda Kenya Sudan Uganda Tanzania Burundi Egypt Ethiopia
Spe
nd
ing
as a
pe
rce
nta
ge o
f G
DP
Trade expansion Trade stagnation
EAST AFRICA’S INFRASTRUCTURE: A REGIONAL PERSPECTIVE
41
lower than Ethiopia’s and Sudan’s, these countries would be able to export a sizable share of their
domestic consumption (figure 3.3b, 3.4a). As a result, Egypt would decrease its power production
substantially. Burundi and Kenya, which currently import minimal amounts of power, would become
significant power importers.
Under the trade
expansion scenario,
several countries in
EAPP would be able
to rely heavily on
power trade by
importing a large
share of their
domestic power
needs. Figure 3.5
presents the absolute
trade flows between
countries under the
trade stagnation and
trade expansion
scenarios. Under
trade expansion,
power exporters
would export as little
as 22 percent (in the
case of Tanzania) and
as much as 200
percent of their
domestic
consumption. Egypt,
Kenya, and Burundi
would import power.
Egypt and Kenya
would import
significant volumes
of power—between
20 and 30 percent of their domestic consumption. Burundi would import almost all of its power needs
under trade expansion, making it fully dependent on traded power.
The possibility of accelerating regional power trade in EAPP depends critically on the ability of
Ethiopia and Sudan to deliver the massive investments in hydropower that would be needed. A host of
technical, financial, and political challenges will make this difficult. First, from a technical perspective,
the envisaged scale-up is around 10 times the installed generation capacity of Ethiopia and 1.5 times the
generation capacity of Sudan. Increasing installed capacity to such an extent would be a huge technical
Figure 3.3. Existing and simulated patterns of future power trade in EAPP, 2015 (TWh)
a. Existing flows (2005, TWh)
b. Simulated flows (2015, TWh)
Source: Derived from Eberhard and others 2009.
0.00
0.05
0.10
0.15
0.20
0.25
0.30
Egypt Tanzania Rwanda Uganda
Po
we
r Im
po
rts
and
Exp
ort
s in
TW
h
Import
Export
-30
-25
-20
-15
-10
-5
0
5
Burundi Ethiopia Kenya Sudan Tanzania Uganda
Ave
rage
of
Ne
t Ex
po
rts
(TW
h)
Trade Expansion Trade Stagnation
EAST AFRICA’S INFRASTRUCTURE: A REGIONAL PERSPECTIVE
42
challenge for Ethiopia. Second, the cost of developing these hydropower schemes would be around $1
billion annually for a decade in each of these countries, an amount equivalent to around 8 percent of
Ethiopia’s GDP and 4 percent of Sudan’s GDP annually. For a low-income country like Ethiopia,
investing that amount each year would be financially complicated and would require massive capital
contributions from the countries that would ultimately import the power. Third, because Sudan is a fragile
state that has suffered from ongoing conflicts, it is not necessarily the most attractive destination for
investments of this magnitude. If Ethiopia were able to fully harness its hydropower potential as a power
exporter, it could export as much as 26.3 terawatt-hours per year, accruing revenues of $263 million (or 2
percent of GDP per year).
Figure 3.4. Trade flows in EAPP in 2015 (TWh)
a. Trade expansion b. Trade stagnation
Source: Rosnes and Vennemo 2009.
By increasing the share of hydropower in the regional generation portfolio, the trade expansion
scenario would lead to annual savings in carbon emissions of some 20 million tonnes of carbon. The main
impact of trade expansion would be to make possible a shift away from gas-fired generation and relatively
dispersed small-scale hydropower toward larger and more cost-effective hydropower resources. Overall,
the weight of hydropower in the regional generation portfolio would increase substantially from 28 to 48
percent, displacing gas-fired (and to a lesser extent diesel) generation (figure 3.6). Under trade stagnation,
gas-fired power capacity and production would become much higher in Egypt and Kenya, and less
hydropower would be developed in Ethiopia, Sudan, Uganda, and Rwanda. Under trade expansion, an
additional 2.4 terawatt-hours of hydropower would generated, thereby reducing carbon emissions by 20.4
million tons (table 3.5). The savings in carbon emissions would be quite significant, second only to the
savings achievable in the SAPP.
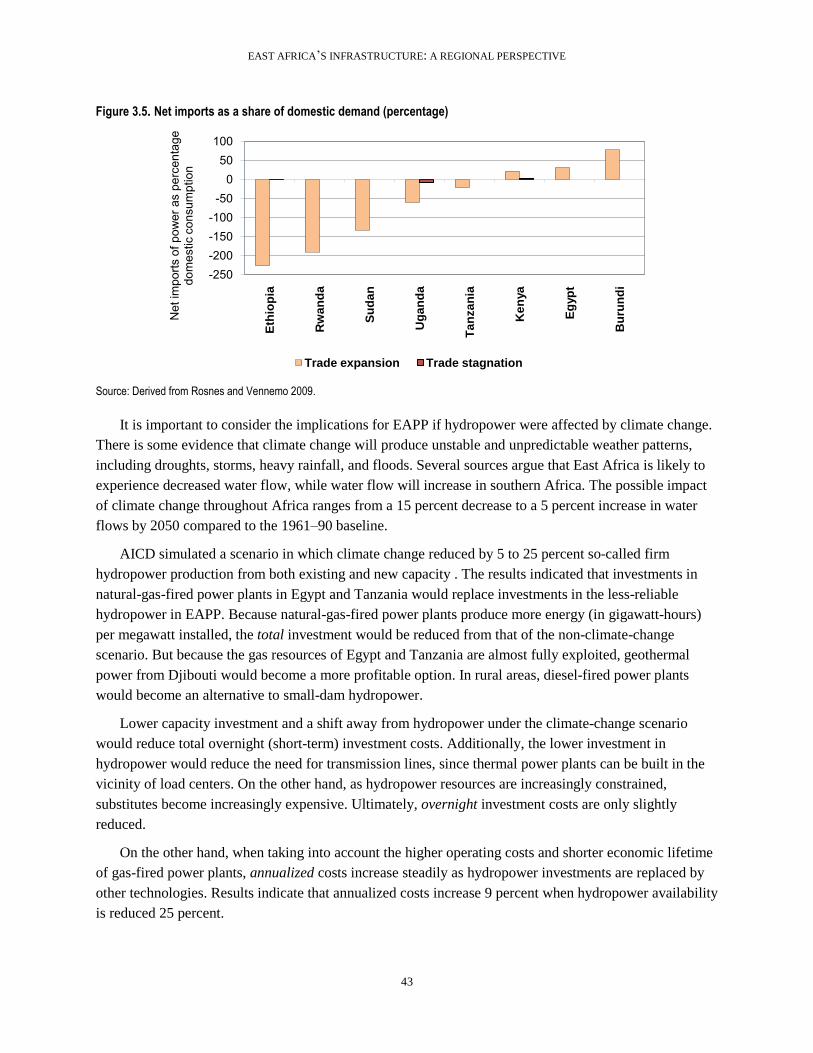
EAST AFRICA’S INFRASTRUCTURE: A REGIONAL PERSPECTIVE
43
Figure 3.5. Net imports as a share of domestic demand (percentage)
Source: Derived from Rosnes and Vennemo 2009.
It is important to consider the implications for EAPP if hydropower were affected by climate change.
There is some evidence that climate change will produce unstable and unpredictable weather patterns,
including droughts, storms, heavy rainfall, and floods. Several sources argue that East Africa is likely to
experience decreased water flow, while water flow will increase in southern Africa. The possible impact
of climate change throughout Africa ranges from a 15 percent decrease to a 5 percent increase in water
flows by 2050 compared to the 1961–90 baseline.
AICD simulated a scenario in which climate change reduced by 5 to 25 percent so-called firm
hydropower production from both existing and new capacity . The results indicated that investments in
natural-gas-fired power plants in Egypt and Tanzania would replace investments in the less-reliable
hydropower in EAPP. Because natural-gas-fired power plants produce more energy (in gigawatt-hours)
per megawatt installed, the total investment would be reduced from that of the non-climate-change
scenario. But because the gas resources of Egypt and Tanzania are almost fully exploited, geothermal
power from Djibouti would become a more profitable option. In rural areas, diesel-fired power plants
would become an alternative to small-dam hydropower.
Lower capacity investment and a shift away from hydropower under the climate-change scenario
would reduce total overnight (short-term) investment costs. Additionally, the lower investment in
hydropower would reduce the need for transmission lines, since thermal power plants can be built in the
vicinity of load centers. On the other hand, as hydropower resources are increasingly constrained,
substitutes become increasingly expensive. Ultimately, overnight investment costs are only slightly
reduced.
On the other hand, when taking into account the higher operating costs and shorter economic lifetime
of gas-fired power plants, annualized costs increase steadily as hydropower investments are replaced by
other technologies. Results indicate that annualized costs increase 9 percent when hydropower availability
is reduced 25 percent.
-250-200-150-100
-500
50100
Eth
iop
ia
Rw
an
da
Su
da
n
Ug
an
da
Ta
nza
nia
Ke
nya
Eg
yp
t
Bu
run
di
Net
impo
rts o
f pow
er a
s pe
rcen
tage
do
mes
tic c
onsu
mpt
ion
Trade expansion Trade stagnation
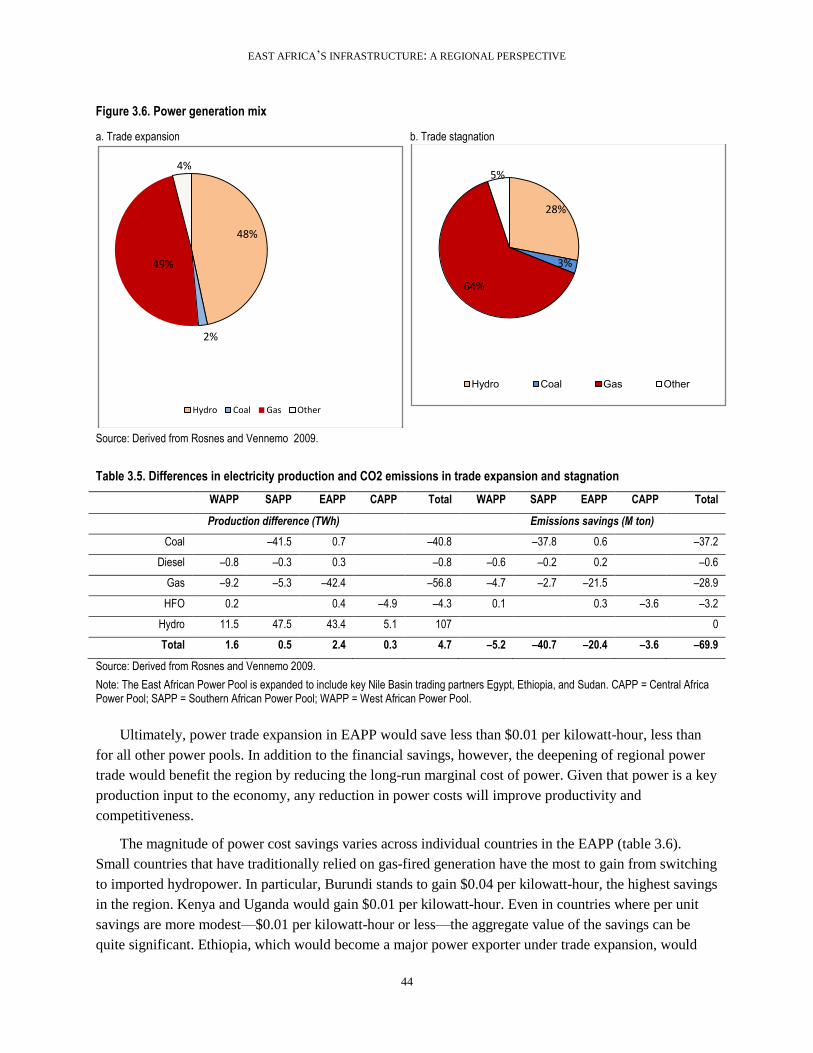
EAST AFRICA’S INFRASTRUCTURE: A REGIONAL PERSPECTIVE
44
Figure 3.6. Power generation mix
a. Trade expansion b. Trade stagnation
Source: Derived from Rosnes and Vennemo 2009.
Table 3.5. Differences in electricity production and CO2 emissions in trade expansion and stagnation
WAPP SAPP EAPP CAPP Total WAPP SAPP EAPP CAPP Total
Production difference (TWh) Emissions savings (M ton)
Coal –41.5 0.7 –40.8 –37.8 0.6 –37.2
Diesel –0.8 –0.3 0.3 –0.8 –0.6 –0.2 0.2 –0.6
Gas –9.2 –5.3 –42.4 –56.8 –4.7 –2.7 –21.5 –28.9
HFO 0.2 0.4 –4.9 –4.3 0.1 0.3 –3.6 –3.2
Hydro 11.5 47.5 43.4 5.1 107 0
Total 1.6 0.5 2.4 0.3 4.7 –5.2 –40.7 –20.4 –3.6 –69.9
Source: Derived from Rosnes and Vennemo 2009.
Note: The East African Power Pool is expanded to include key Nile Basin trading partners Egypt, Ethiopia, and Sudan. CAPP = Central Africa Power Pool; SAPP = Southern African Power Pool; WAPP = West African Power Pool.
Ultimately, power trade expansion in EAPP would save less than $0.01 per kilowatt-hour, less than
for all other power pools. In addition to the financial savings, however, the deepening of regional power
trade would benefit the region by reducing the long-run marginal cost of power. Given that power is a key
production input to the economy, any reduction in power costs will improve productivity and
competitiveness.
The magnitude of power cost savings varies across individual countries in the EAPP (table 3.6).
Small countries that have traditionally relied on gas-fired generation have the most to gain from switching
to imported hydropower. In particular, Burundi stands to gain $0.04 per kilowatt-hour, the highest savings
in the region. Kenya and Uganda would gain $0.01 per kilowatt-hour. Even in countries where per unit
savings are more modest—$0.01 per kilowatt-hour or less—the aggregate value of the savings can be
quite significant. Ethiopia, which would become a major power exporter under trade expansion, would
48%
2%
49%
4%
Hydro Coal Gas Other
28%
3%
64%
5%
Hydro Coal Gas Other
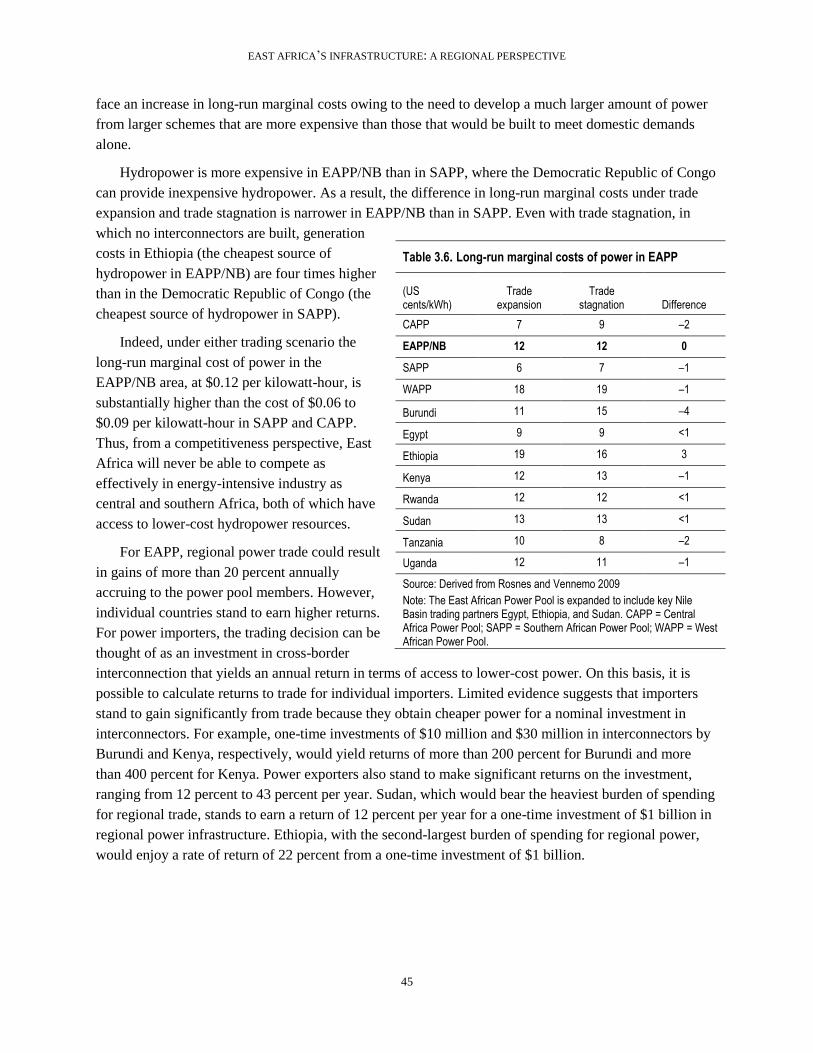
EAST AFRICA’S INFRASTRUCTURE: A REGIONAL PERSPECTIVE
45
face an increase in long-run marginal costs owing to the need to develop a much larger amount of power
from larger schemes that are more expensive than those that would be built to meet domestic demands
alone.
Hydropower is more expensive in EAPP/NB than in SAPP, where the Democratic Republic of Congo
can provide inexpensive hydropower. As a result, the difference in long-run marginal costs under trade
expansion and trade stagnation is narrower in EAPP/NB than in SAPP. Even with trade stagnation, in
which no interconnectors are built, generation
costs in Ethiopia (the cheapest source of
hydropower in EAPP/NB) are four times higher
than in the Democratic Republic of Congo (the
cheapest source of hydropower in SAPP).
Indeed, under either trading scenario the
long-run marginal cost of power in the
EAPP/NB area, at $0.12 per kilowatt-hour, is
substantially higher than the cost of $0.06 to
$0.09 per kilowatt-hour in SAPP and CAPP.
Thus, from a competitiveness perspective, East
Africa will never be able to compete as
effectively in energy-intensive industry as
central and southern Africa, both of which have
access to lower-cost hydropower resources.
For EAPP, regional power trade could result
in gains of more than 20 percent annually
accruing to the power pool members. However,
individual countries stand to earn higher returns.
For power importers, the trading decision can be
thought of as an investment in cross-border
interconnection that yields an annual return in terms of access to lower-cost power. On this basis, it is
possible to calculate returns to trade for individual importers. Limited evidence suggests that importers
stand to gain significantly from trade because they obtain cheaper power for a nominal investment in
interconnectors. For example, one-time investments of $10 million and $30 million in interconnectors by
Burundi and Kenya, respectively, would yield returns of more than 200 percent for Burundi and more
than 400 percent for Kenya. Power exporters also stand to make significant returns on the investment,
ranging from 12 percent to 43 percent per year. Sudan, which would bear the heaviest burden of spending
for regional trade, stands to earn a return of 12 percent per year for a one-time investment of $1 billion in
regional power infrastructure. Ethiopia, with the second-largest burden of spending for regional power,
would enjoy a rate of return of 22 percent from a one-time investment of $1 billion.
Table 3.6. Long-run marginal costs of power in EAPP
(US cents/kWh)
Trade expansion
Trade stagnation Difference
CAPP 7 9 –2
EAPP/NB 12 12 0
SAPP 6 7 –1
WAPP 18 19 –1
Burundi 11 15 –4
Egypt 9 9 <1
Ethiopia 19 16 3
Kenya 12 13 –1
Rwanda 12 12 <1
Sudan 13 13 <1
Tanzania 10 8 –2
Uganda 12 11 –1
Source: Derived from Rosnes and Vennemo 2009
Note: The East African Power Pool is expanded to include key Nile Basin trading partners Egypt, Ethiopia, and Sudan. CAPP = Central Africa Power Pool; SAPP = Southern African Power Pool; WAPP = West African Power Pool.
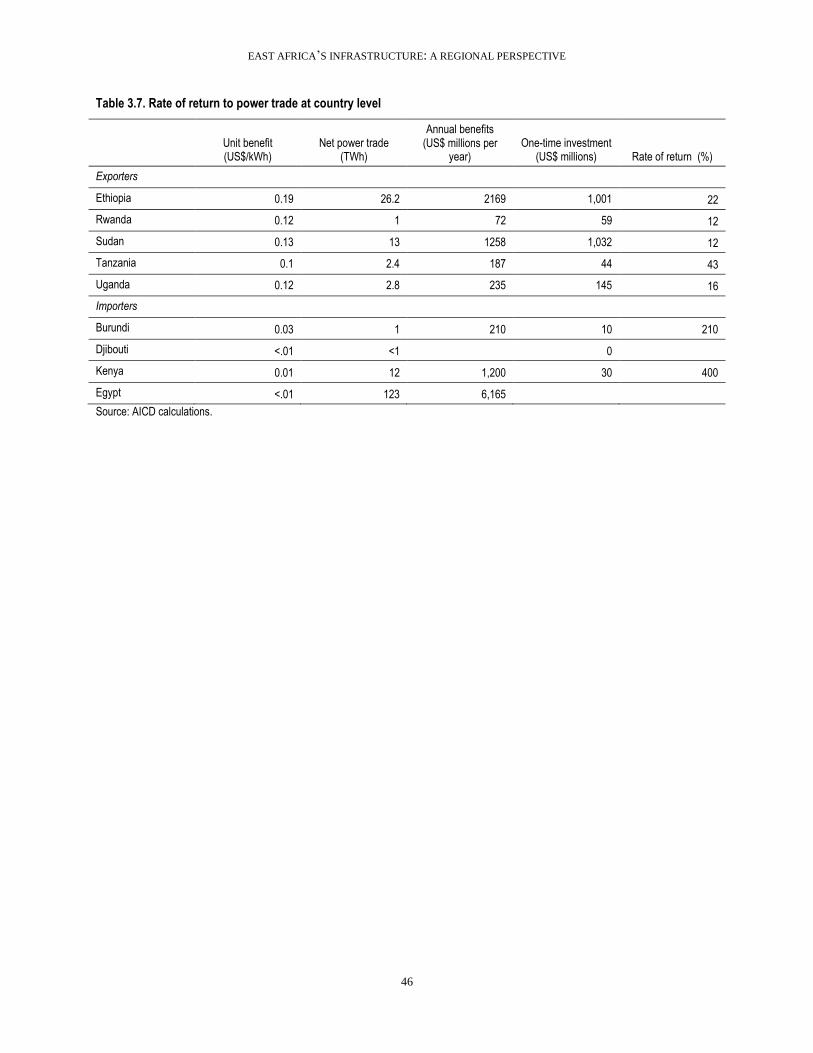
EAST AFRICA’S INFRASTRUCTURE: A REGIONAL PERSPECTIVE
46
Table 3.7. Rate of return to power trade at country level
Unit benefit (US$/kWh)
Net power trade (TWh)
Annual benefits (US$ millions per
year) One-time investment
(US$ millions) Rate of return (%)
Exporters
Ethiopia 0.19 26.2 2169 1,001 22
Rwanda 0.12 1 72 59 12
Sudan 0.13 13 1258 1,032 12
Tanzania 0.1 2.4 187 44 43
Uganda 0.12 2.8 235 145 16
Importers
Burundi 0.03 1 210 10 210
Djibouti <.01 <1 0
Kenya 0.01 12 1,200 30 400
Egypt <.01 123 6,165
Source: AICD calculations.
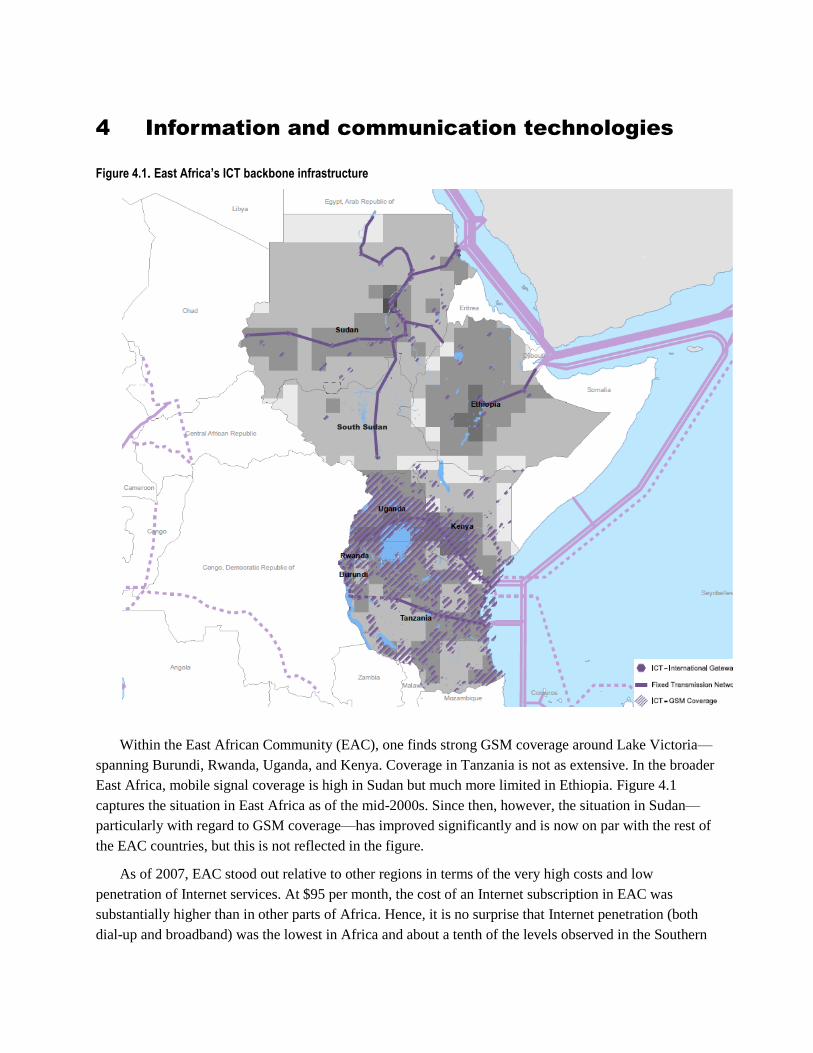
4 Information and communication technologies
Figure 4.1. East Africa’s ICT backbone infrastructure
Within the East African Community (EAC), one finds strong GSM coverage around Lake Victoria—
spanning Burundi, Rwanda, Uganda, and Kenya. Coverage in Tanzania is not as extensive. In the broader
East Africa, mobile signal coverage is high in Sudan but much more limited in Ethiopia. Figure 4.1
captures the situation in East Africa as of the mid-2000s. Since then, however, the situation in Sudan—
particularly with regard to GSM coverage—has improved significantly and is now on par with the rest of
the EAC countries, but this is not reflected in the figure.
As of 2007, EAC stood out relative to other regions in terms of the very high costs and low
penetration of Internet services. At $95 per month, the cost of an Internet subscription in EAC was
substantially higher than in other parts of Africa. Hence, it is no surprise that Internet penetration (both
dial-up and broadband) was the lowest in Africa and about a tenth of the levels observed in the Southern
South Sudan
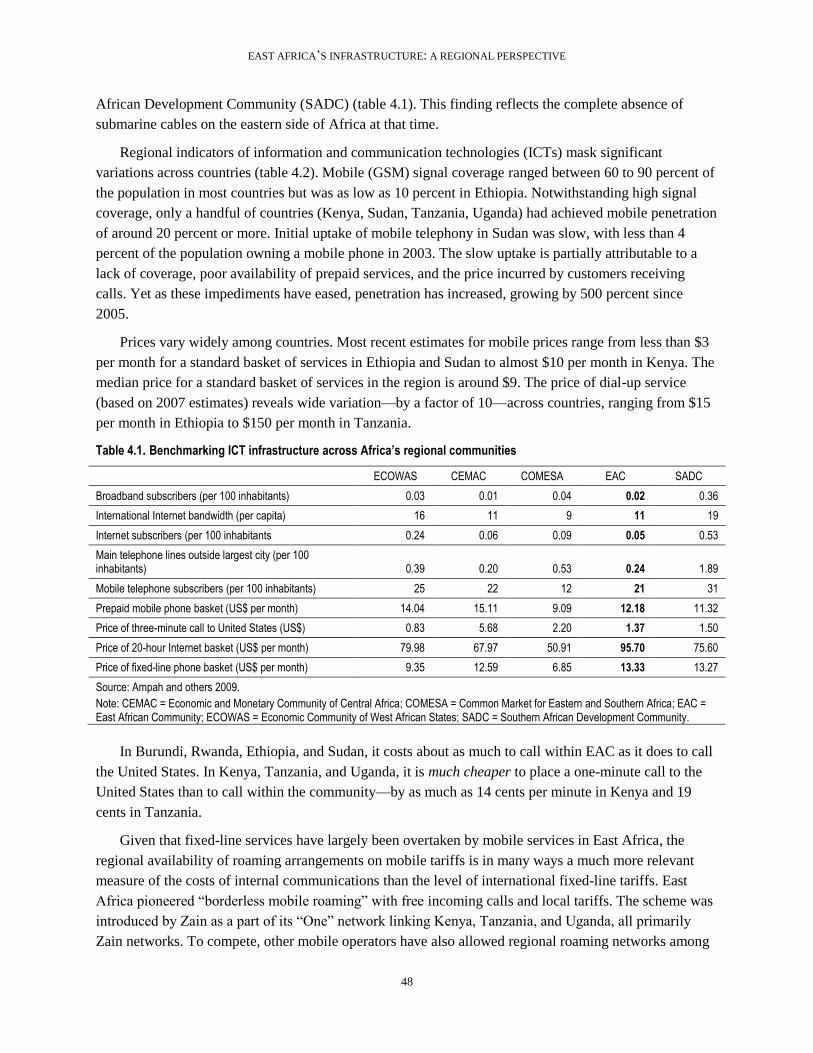
EAST AFRICA’S INFRASTRUCTURE: A REGIONAL PERSPECTIVE
48
African Development Community (SADC) (table 4.1). This finding reflects the complete absence of
submarine cables on the eastern side of Africa at that time.
Regional indicators of information and communication technologies (ICTs) mask significant
variations across countries (table 4.2). Mobile (GSM) signal coverage ranged between 60 to 90 percent of
the population in most countries but was as low as 10 percent in Ethiopia. Notwithstanding high signal
coverage, only a handful of countries (Kenya, Sudan, Tanzania, Uganda) had achieved mobile penetration
of around 20 percent or more. Initial uptake of mobile telephony in Sudan was slow, with less than 4
percent of the population owning a mobile phone in 2003. The slow uptake is partially attributable to a
lack of coverage, poor availability of prepaid services, and the price incurred by customers receiving
calls. Yet as these impediments have eased, penetration has increased, growing by 500 percent since
2005.
Prices vary widely among countries. Most recent estimates for mobile prices range from less than $3
per month for a standard basket of services in Ethiopia and Sudan to almost $10 per month in Kenya. The
median price for a standard basket of services in the region is around $9. The price of dial-up service
(based on 2007 estimates) reveals wide variation—by a factor of 10—across countries, ranging from $15
per month in Ethiopia to $150 per month in Tanzania.
Table 4.1. Benchmarking ICT infrastructure across Africa’s regional communities
ECOWAS CEMAC COMESA EAC SADC
Broadband subscribers (per 100 inhabitants) 0.03 0.01 0.04 0.02 0.36
International Internet bandwidth (per capita) 16 11 9 11 19
Internet subscribers (per 100 inhabitants 0.24 0.06 0.09 0.05 0.53
Main telephone lines outside largest city (per 100 inhabitants) 0.39 0.20 0.53 0.24 1.89
Mobile telephone subscribers (per 100 inhabitants) 25 22 12 21 31
Prepaid mobile phone basket (US$ per month) 14.04 15.11 9.09 12.18 11.32
Price of three-minute call to United States (US$) 0.83 5.68 2.20 1.37 1.50
Price of 20-hour Internet basket (US$ per month) 79.98 67.97 50.91 95.70 75.60
Price of fixed-line phone basket (US$ per month) 9.35 12.59 6.85 13.33 13.27
Source: Ampah and others 2009.
Note: CEMAC = Economic and Monetary Community of Central Africa; COMESA = Common Market for Eastern and Southern Africa; EAC = East African Community; ECOWAS = Economic Community of West African States; SADC = Southern African Development Community.
In Burundi, Rwanda, Ethiopia, and Sudan, it costs about as much to call within EAC as it does to call
the United States. In Kenya, Tanzania, and Uganda, it is much cheaper to place a one-minute call to the
United States than to call within the community—by as much as 14 cents per minute in Kenya and 19
cents in Tanzania.
Given that fixed-line services have largely been overtaken by mobile services in East Africa, the
regional availability of roaming arrangements on mobile tariffs is in many ways a much more relevant
measure of the costs of internal communications than the level of international fixed-line tariffs. East
Africa pioneered ―borderless mobile roaming‖ with free incoming calls and local tariffs. The scheme was
introduced by Zain as a part of its ―One‖ network linking Kenya, Tanzania, and Uganda, all primarily
Zain networks. To compete, other mobile operators have also allowed regional roaming networks among
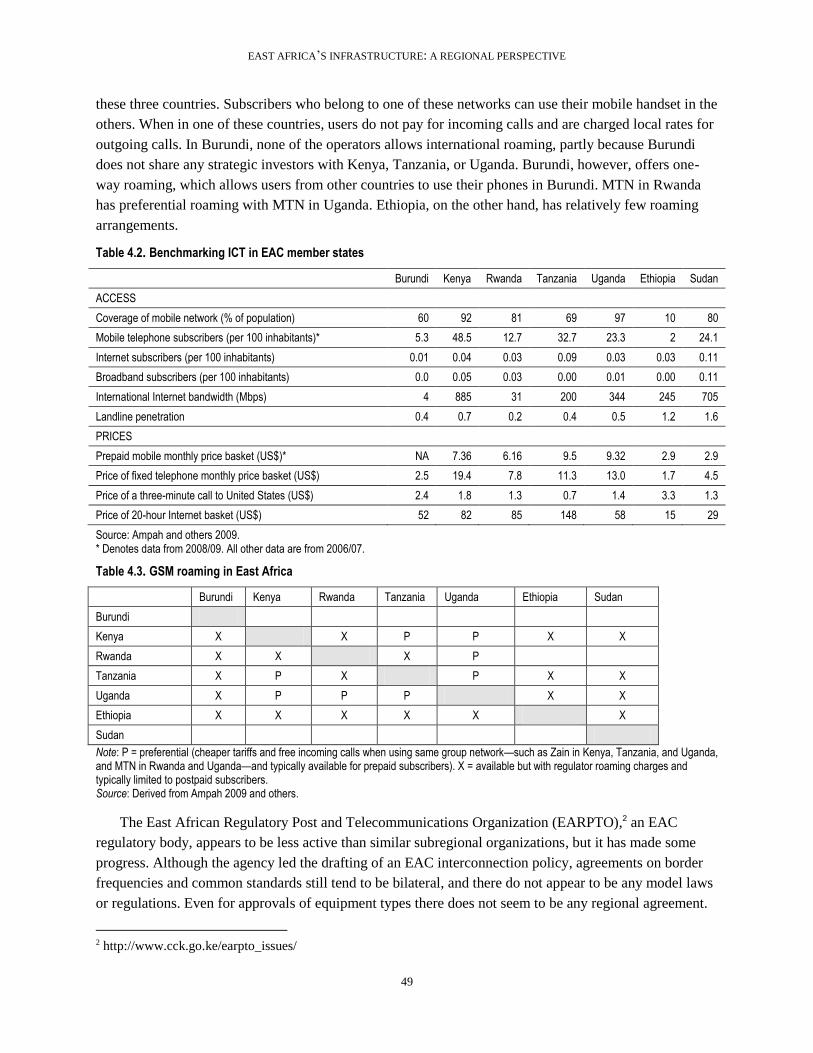
EAST AFRICA’S INFRASTRUCTURE: A REGIONAL PERSPECTIVE
49
these three countries. Subscribers who belong to one of these networks can use their mobile handset in the
others. When in one of these countries, users do not pay for incoming calls and are charged local rates for
outgoing calls. In Burundi, none of the operators allows international roaming, partly because Burundi
does not share any strategic investors with Kenya, Tanzania, or Uganda. Burundi, however, offers one-
way roaming, which allows users from other countries to use their phones in Burundi. MTN in Rwanda
has preferential roaming with MTN in Uganda. Ethiopia, on the other hand, has relatively few roaming
arrangements.
Table 4.2. Benchmarking ICT in EAC member states Burundi Kenya Rwanda Tanzania Uganda Ethiopia Sudan
ACCESS
Coverage of mobile network (% of population) 60 92 81 69 97 10 80
Mobile telephone subscribers (per 100 inhabitants)* 5.3 48.5 12.7 32.7 23.3 2 24.1
Internet subscribers (per 100 inhabitants) 0.01 0.04 0.03 0.09 0.03 0.03 0.11
Broadband subscribers (per 100 inhabitants) 0.0 0.05 0.03 0.00 0.01 0.00 0.11
International Internet bandwidth (Mbps) 4 885 31 200 344 245 705
Landline penetration 0.4 0.7 0.2 0.4 0.5 1.2 1.6
PRICES
Prepaid mobile monthly price basket (US$)* NA 7.36 6.16 9.5 9.32 2.9 2.9
Price of fixed telephone monthly price basket (US$) 2.5 19.4 7.8 11.3 13.0 1.7 4.5
Price of a three-minute call to United States (US$) 2.4 1.8 1.3 0.7 1.4 3.3 1.3
Price of 20-hour Internet basket (US$) 52 82 85 148 58 15 29
Source: Ampah and others 2009. * Denotes data from 2008/09. All other data are from 2006/07.
Table 4.3. GSM roaming in East Africa
Burundi Kenya Rwanda Tanzania Uganda Ethiopia Sudan
Burundi
Kenya X X P P X X
Rwanda X X X P
Tanzania X P X P X X
Uganda X P P P X X
Ethiopia X X X X X X
Sudan
Note: P = preferential (cheaper tariffs and free incoming calls when using same group network—such as Zain in Kenya, Tanzania, and Uganda, and MTN in Rwanda and Uganda—and typically available for prepaid subscribers). X = available but with regulator roaming charges and typically limited to postpaid subscribers. Source: Derived from Ampah 2009 and others.
The East African Regulatory Post and Telecommunications Organization (EARPTO),2 an EAC
regulatory body, appears to be less active than similar subregional organizations, but it has made some
progress. Although the agency led the drafting of an EAC interconnection policy, agreements on border
frequencies and common standards still tend to be bilateral, and there do not appear to be any model laws
or regulations. Even for approvals of equipment types there does not seem to be any regional agreement.
2 http://www.cck.go.ke/earpto_issues/
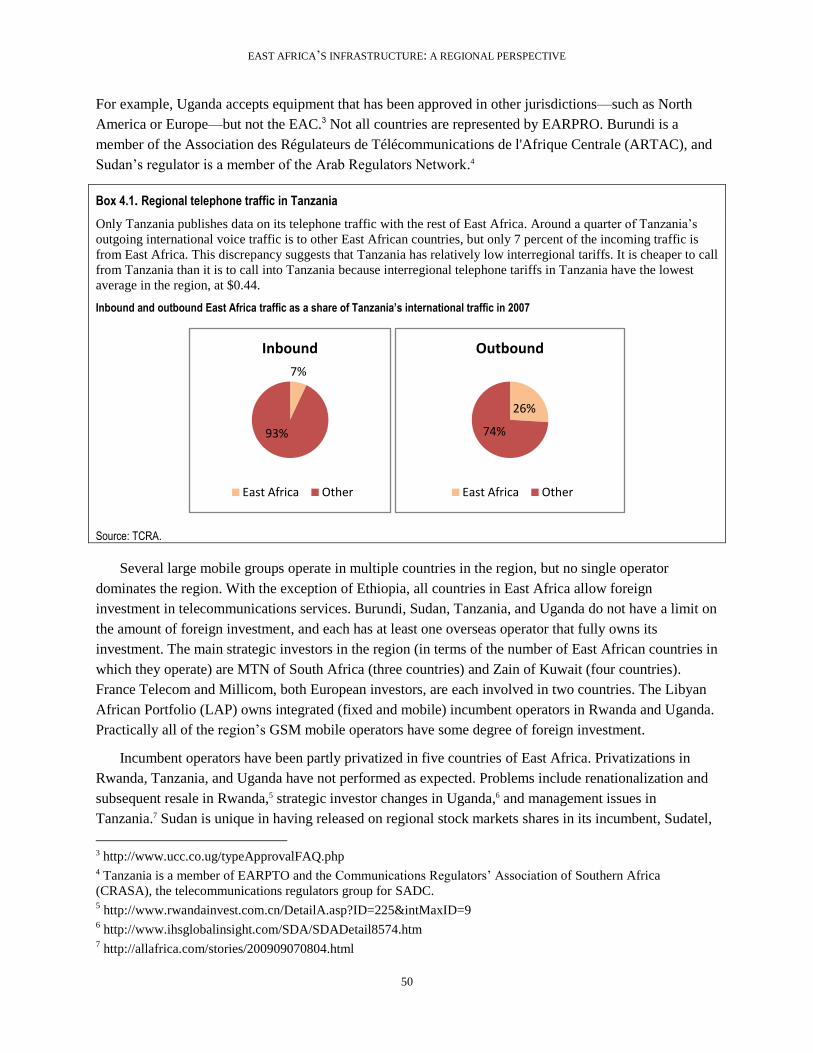
EAST AFRICA’S INFRASTRUCTURE: A REGIONAL PERSPECTIVE
50
For example, Uganda accepts equipment that has been approved in other jurisdictions—such as North
America or Europe—but not the EAC.3 Not all countries are represented by EARPRO. Burundi is a
member of the Association des Régulateurs de Télécommunications de l'Afrique Centrale (ARTAC), and
Sudan’s regulator is a member of the Arab Regulators Network.4
Box 4.1. Regional telephone traffic in Tanzania
Only Tanzania publishes data on its telephone traffic with the rest of East Africa. Around a quarter of Tanzania’s
outgoing international voice traffic is to other East African countries, but only 7 percent of the incoming traffic is
from East Africa. This discrepancy suggests that Tanzania has relatively low interregional tariffs. It is cheaper to call
from Tanzania than it is to call into Tanzania because interregional telephone tariffs in Tanzania have the lowest
average in the region, at $0.44.
Inbound and outbound East Africa traffic as a share of Tanzania’s international traffic in 2007
Source: TCRA.
Several large mobile groups operate in multiple countries in the region, but no single operator
dominates the region. With the exception of Ethiopia, all countries in East Africa allow foreign
investment in telecommunications services. Burundi, Sudan, Tanzania, and Uganda do not have a limit on
the amount of foreign investment, and each has at least one overseas operator that fully owns its
investment. The main strategic investors in the region (in terms of the number of East African countries in
which they operate) are MTN of South Africa (three countries) and Zain of Kuwait (four countries).
France Telecom and Millicom, both European investors, are each involved in two countries. The Libyan
African Portfolio (LAP) owns integrated (fixed and mobile) incumbent operators in Rwanda and Uganda.
Practically all of the region’s GSM mobile operators have some degree of foreign investment.
Incumbent operators have been partly privatized in five countries of East Africa. Privatizations in
Rwanda, Tanzania, and Uganda have not performed as expected. Problems include renationalization and
subsequent resale in Rwanda,5 strategic investor changes in Uganda,6 and management issues in
Tanzania.7 Sudan is unique in having released on regional stock markets shares in its incumbent, Sudatel,
3 http://www.ucc.co.ug/typeApprovalFAQ.php 4 Tanzania is a member of EARPTO and the Communications Regulators’ Association of Southern Africa
(CRASA), the telecommunications regulators group for SADC. 5 http://www.rwandainvest.com.cn/DetailA.asp?ID=225&intMaxID=9
6 http://www.ihsglobalinsight.com/SDA/SDADetail8574.htm
7 http://allafrica.com/stories/200909070804.html
7%
93%
Inbound
East Africa Other
26%
74%
Outbound
East Africa Other
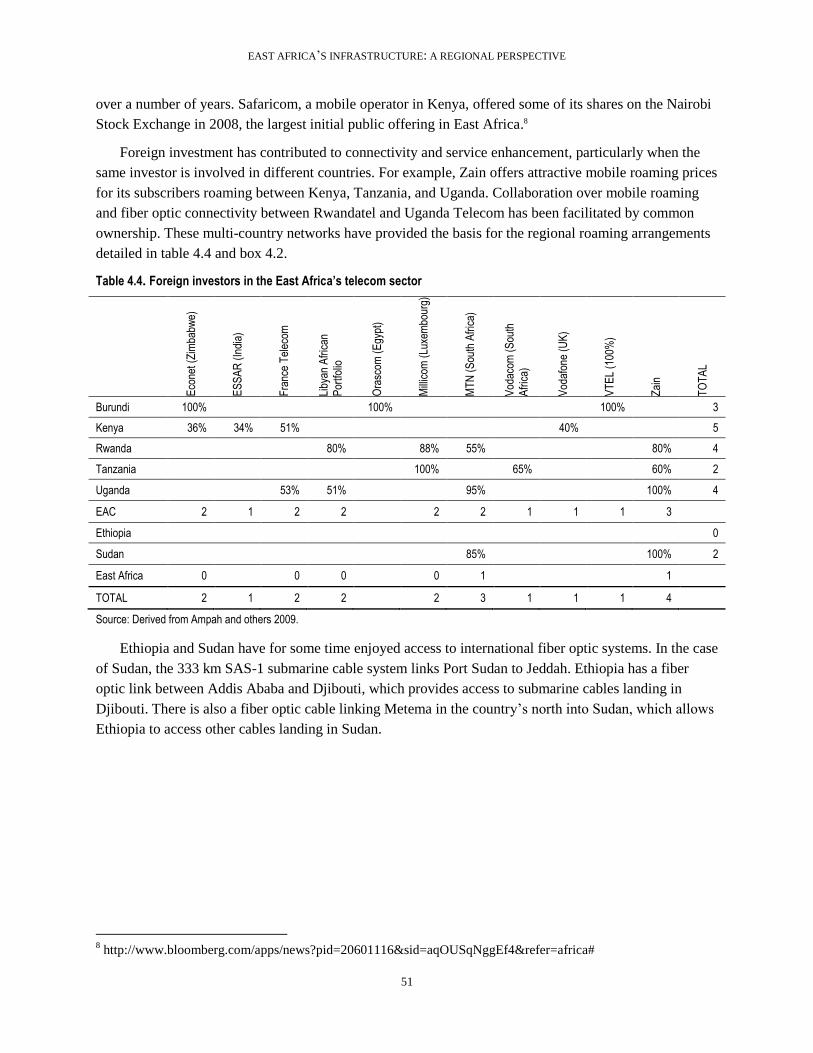
EAST AFRICA’S INFRASTRUCTURE: A REGIONAL PERSPECTIVE
51
over a number of years. Safaricom, a mobile operator in Kenya, offered some of its shares on the Nairobi
Stock Exchange in 2008, the largest initial public offering in East Africa.8
Foreign investment has contributed to connectivity and service enhancement, particularly when the
same investor is involved in different countries. For example, Zain offers attractive mobile roaming prices
for its subscribers roaming between Kenya, Tanzania, and Uganda. Collaboration over mobile roaming
and fiber optic connectivity between Rwandatel and Uganda Telecom has been facilitated by common
ownership. These multi-country networks have provided the basis for the regional roaming arrangements
detailed in table 4.4 and box 4.2.
Table 4.4. Foreign investors in the East Africa’s telecom sector
Eco
net (
Zim
babw
e)
ES
SA
R (
Indi
a)
Fra
nce
Tel
ecom
Liby
an A
fric
an
Por
tfolio
Ora
scom
(E
gypt
)
Mill
icom
(Lu
xem
bour
g)
MT
N (
Sou
th A
fric
a)
Vod
acom
(S
outh
Afr
ica)
Vod
afon
e (U
K)
VT
EL
(100
%)
Zai
n
TO
TA
L
Burundi 100% 100% 100% 3
Kenya 36% 34% 51% 40% 5
Rwanda 80% 88% 55% 80% 4
Tanzania 100% 65% 60% 2
Uganda 53% 51% 95% 100% 4
EAC 2 1 2 2 2 2 1 1 1 3
Ethiopia 0
Sudan 85% 100% 2
East Africa 0 0 0 0 1 1
TOTAL 2 1 2 2 2 3 1 1 1 4
Source: Derived from Ampah and others 2009.
Ethiopia and Sudan have for some time enjoyed access to international fiber optic systems. In the case
of Sudan, the 333 km SAS-1 submarine cable system links Port Sudan to Jeddah. Ethiopia has a fiber
optic link between Addis Ababa and Djibouti, which provides access to submarine cables landing in
Djibouti. There is also a fiber optic cable linking Metema in the country’s north into Sudan, which allows
Ethiopia to access other cables landing in Sudan.
8 http://www.bloomberg.com/apps/news?pid=20601116&sid=aqOUSqNggEf4&refer=africa#
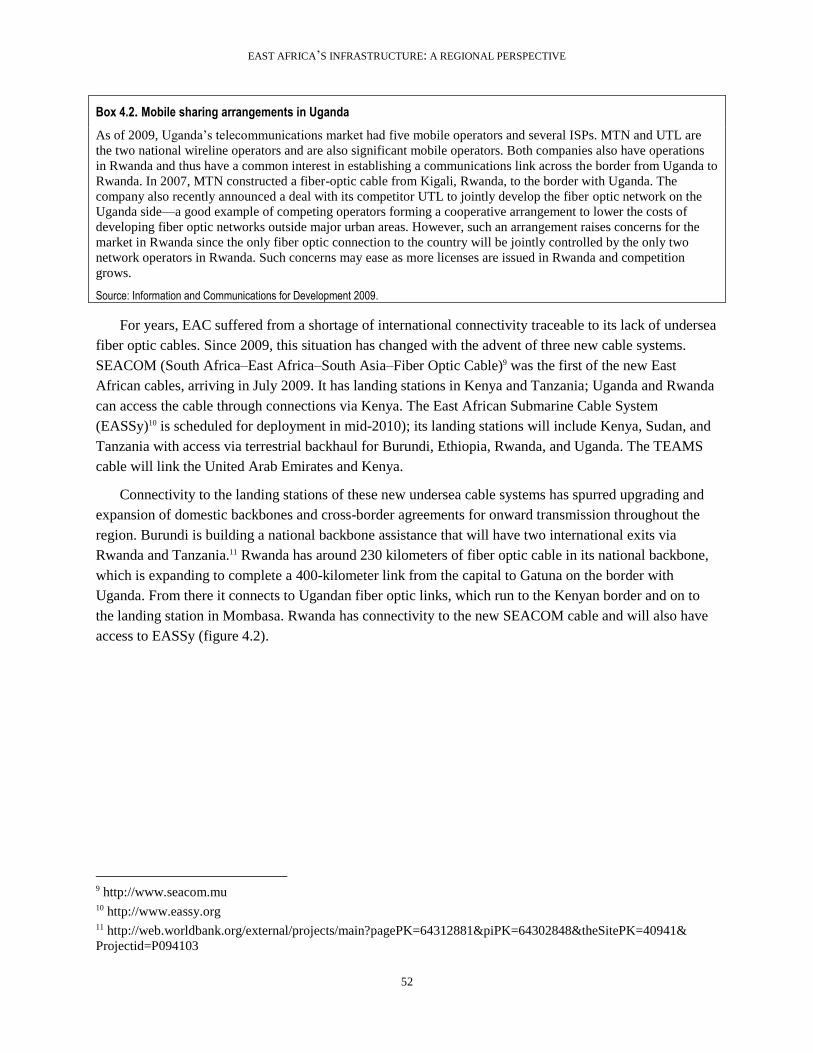
EAST AFRICA’S INFRASTRUCTURE: A REGIONAL PERSPECTIVE
52
Box 4.2. Mobile sharing arrangements in Uganda
As of 2009, Uganda’s telecommunications market had five mobile operators and several ISPs. MTN and UTL are
the two national wireline operators and are also significant mobile operators. Both companies also have operations
in Rwanda and thus have a common interest in establishing a communications link across the border from Uganda to
Rwanda. In 2007, MTN constructed a fiber-optic cable from Kigali, Rwanda, to the border with Uganda. The
company also recently announced a deal with its competitor UTL to jointly develop the fiber optic network on the
Uganda side—a good example of competing operators forming a cooperative arrangement to lower the costs of
developing fiber optic networks outside major urban areas. However, such an arrangement raises concerns for the
market in Rwanda since the only fiber optic connection to the country will be jointly controlled by the only two
network operators in Rwanda. Such concerns may ease as more licenses are issued in Rwanda and competition
grows.
Source: Information and Communications for Development 2009.
For years, EAC suffered from a shortage of international connectivity traceable to its lack of undersea
fiber optic cables. Since 2009, this situation has changed with the advent of three new cable systems.
SEACOM (South Africa–East Africa–South Asia–Fiber Optic Cable)9 was the first of the new East
African cables, arriving in July 2009. It has landing stations in Kenya and Tanzania; Uganda and Rwanda
can access the cable through connections via Kenya. The East African Submarine Cable System
(EASSy)10 is scheduled for deployment in mid-2010); its landing stations will include Kenya, Sudan, and
Tanzania with access via terrestrial backhaul for Burundi, Ethiopia, Rwanda, and Uganda. The TEAMS
cable will link the United Arab Emirates and Kenya.
Connectivity to the landing stations of these new undersea cable systems has spurred upgrading and
expansion of domestic backbones and cross-border agreements for onward transmission throughout the
region. Burundi is building a national backbone assistance that will have two international exits via
Rwanda and Tanzania.11 Rwanda has around 230 kilometers of fiber optic cable in its national backbone,
which is expanding to complete a 400-kilometer link from the capital to Gatuna on the border with
Uganda. From there it connects to Ugandan fiber optic links, which run to the Kenyan border and on to
the landing station in Mombasa. Rwanda has connectivity to the new SEACOM cable and will also have
access to EASSy (figure 4.2).
9 http://www.seacom.mu 10 http://www.eassy.org 11 http://web.worldbank.org/external/projects/main?pagePK=64312881&piPK=64302848&theSitePK=40941&
Projectid=P094103
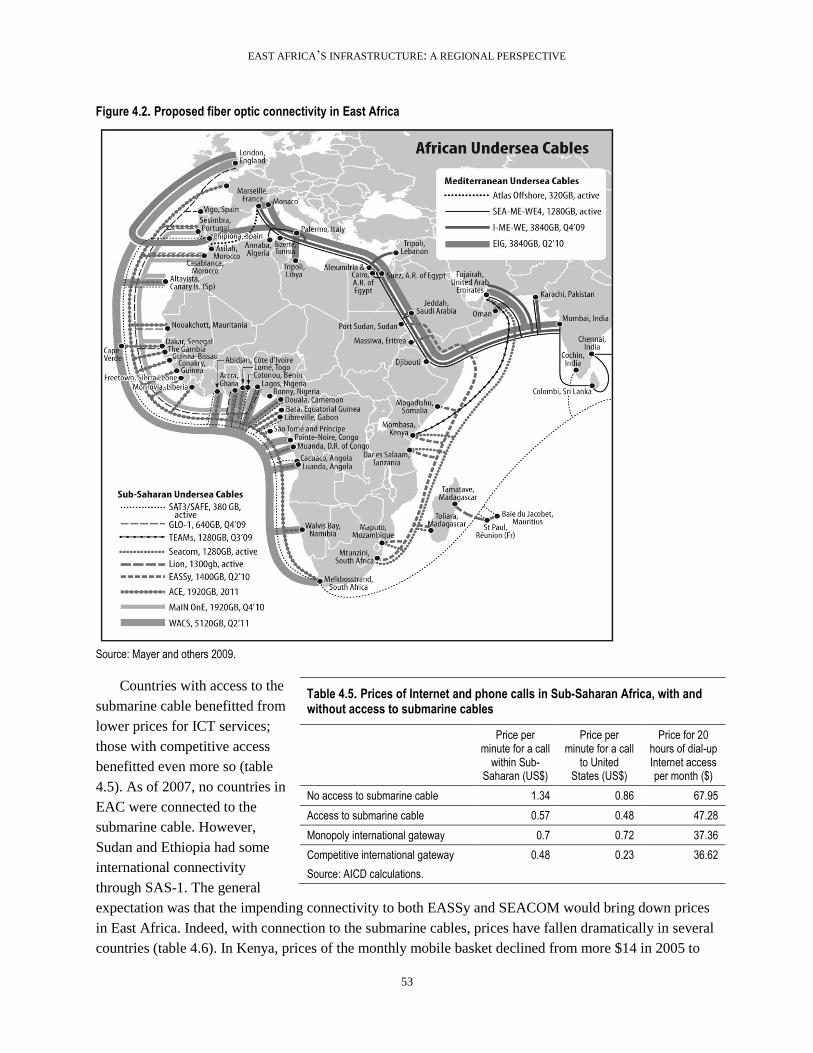
EAST AFRICA’S INFRASTRUCTURE: A REGIONAL PERSPECTIVE
53
Figure 4.2. Proposed fiber optic connectivity in East Africa
Source: Mayer and others 2009.
Countries with access to the
submarine cable benefitted from
lower prices for ICT services;
those with competitive access
benefitted even more so (table
4.5). As of 2007, no countries in
EAC were connected to the
submarine cable. However,
Sudan and Ethiopia had some
international connectivity
through SAS-1. The general
expectation was that the impending connectivity to both EASSy and SEACOM would bring down prices
in East Africa. Indeed, with connection to the submarine cables, prices have fallen dramatically in several
countries (table 4.6). In Kenya, prices of the monthly mobile basket declined from more $14 in 2005 to
Table 4.5. Prices of Internet and phone calls in Sub-Saharan Africa, with and without access to submarine cables
Price per minute for a call
within Sub-Saharan (US$)
Price per minute for a call
to United States (US$)
Price for 20 hours of dial-up Internet access per month ($)
No access to submarine cable 1.34 0.86 67.95
Access to submarine cable 0.57 0.48 47.28
Monopoly international gateway 0.7 0.72 37.36
Competitive international gateway 0.48 0.23 36.62
Source: AICD calculations.
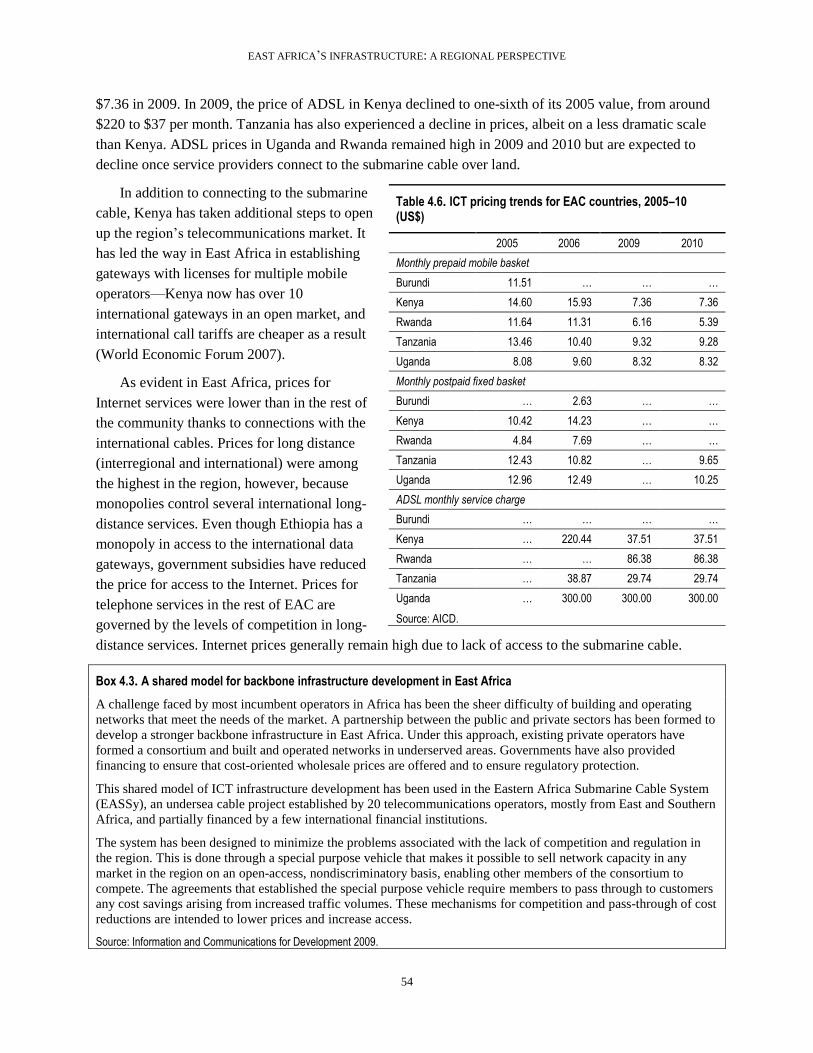
EAST AFRICA’S INFRASTRUCTURE: A REGIONAL PERSPECTIVE
54
$7.36 in 2009. In 2009, the price of ADSL in Kenya declined to one-sixth of its 2005 value, from around
$220 to $37 per month. Tanzania has also experienced a decline in prices, albeit on a less dramatic scale
than Kenya. ADSL prices in Uganda and Rwanda remained high in 2009 and 2010 but are expected to
decline once service providers connect to the submarine cable over land.
In addition to connecting to the submarine
cable, Kenya has taken additional steps to open
up the region’s telecommunications market. It
has led the way in East Africa in establishing
gateways with licenses for multiple mobile
operators—Kenya now has over 10
international gateways in an open market, and
international call tariffs are cheaper as a result
(World Economic Forum 2007).
As evident in East Africa, prices for
Internet services were lower than in the rest of
the community thanks to connections with the
international cables. Prices for long distance
(interregional and international) were among
the highest in the region, however, because
monopolies control several international long-
distance services. Even though Ethiopia has a
monopoly in access to the international data
gateways, government subsidies have reduced
the price for access to the Internet. Prices for
telephone services in the rest of EAC are
governed by the levels of competition in long-
distance services. Internet prices generally remain high due to lack of access to the submarine cable.
Box 4.3. A shared model for backbone infrastructure development in East Africa
A challenge faced by most incumbent operators in Africa has been the sheer difficulty of building and operating
networks that meet the needs of the market. A partnership between the public and private sectors has been formed to
develop a stronger backbone infrastructure in East Africa. Under this approach, existing private operators have
formed a consortium and built and operated networks in underserved areas. Governments have also provided
financing to ensure that cost-oriented wholesale prices are offered and to ensure regulatory protection.
This shared model of ICT infrastructure development has been used in the Eastern Africa Submarine Cable System
(EASSy), an undersea cable project established by 20 telecommunications operators, mostly from East and Southern
Africa, and partially financed by a few international financial institutions.
The system has been designed to minimize the problems associated with the lack of competition and regulation in
the region. This is done through a special purpose vehicle that makes it possible to sell network capacity in any
market in the region on an open-access, nondiscriminatory basis, enabling other members of the consortium to
compete. The agreements that established the special purpose vehicle require members to pass through to customers
any cost savings arising from increased traffic volumes. These mechanisms for competition and pass-through of cost
reductions are intended to lower prices and increase access.
Source: Information and Communications for Development 2009.
Table 4.6. ICT pricing trends for EAC countries, 2005–10 (US$)
2005 2006 2009 2010
Monthly prepaid mobile basket
Burundi 11.51 … … …
Kenya 14.60 15.93 7.36 7.36
Rwanda 11.64 11.31 6.16 5.39
Tanzania 13.46 10.40 9.32 9.28
Uganda 8.08 9.60 8.32 8.32
Monthly postpaid fixed basket
Burundi … 2.63 … …
Kenya 10.42 14.23 … …
Rwanda 4.84 7.69 … …
Tanzania 12.43 10.82 … 9.65
Uganda 12.96 12.49 … 10.25
ADSL monthly service charge
Burundi … … … …
Kenya … 220.44 37.51 37.51
Rwanda … … 86.38 86.38
Tanzania … 38.87 29.74 29.74
Uganda … 300.00 300.00 300.00
Source: AICD.
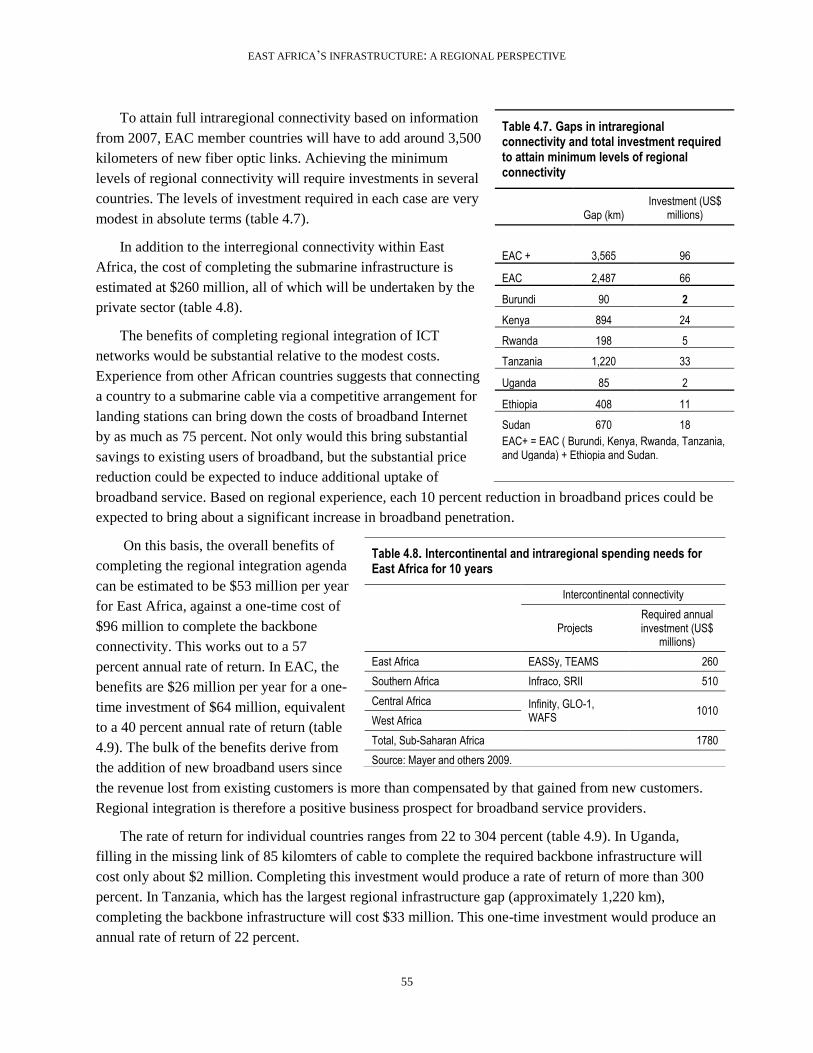
EAST AFRICA’S INFRASTRUCTURE: A REGIONAL PERSPECTIVE
55
To attain full intraregional connectivity based on information
from 2007, EAC member countries will have to add around 3,500
kilometers of new fiber optic links. Achieving the minimum
levels of regional connectivity will require investments in several
countries. The levels of investment required in each case are very
modest in absolute terms (table 4.7).
In addition to the interregional connectivity within East
Africa, the cost of completing the submarine infrastructure is
estimated at $260 million, all of which will be undertaken by the
private sector (table 4.8).
The benefits of completing regional integration of ICT
networks would be substantial relative to the modest costs.
Experience from other African countries suggests that connecting
a country to a submarine cable via a competitive arrangement for
landing stations can bring down the costs of broadband Internet
by as much as 75 percent. Not only would this bring substantial
savings to existing users of broadband, but the substantial price
reduction could be expected to induce additional uptake of
broadband service. Based on regional experience, each 10 percent reduction in broadband prices could be
expected to bring about a significant increase in broadband penetration.
On this basis, the overall benefits of
completing the regional integration agenda
can be estimated to be $53 million per year
for East Africa, against a one-time cost of
$96 million to complete the backbone
connectivity. This works out to a 57
percent annual rate of return. In EAC, the
benefits are $26 million per year for a one-
time investment of $64 million, equivalent
to a 40 percent annual rate of return (table
4.9). The bulk of the benefits derive from
the addition of new broadband users since
the revenue lost from existing customers is more than compensated by that gained from new customers.
Regional integration is therefore a positive business prospect for broadband service providers.
The rate of return for individual countries ranges from 22 to 304 percent (table 4.9). In Uganda,
filling in the missing link of 85 kilomters of cable to complete the required backbone infrastructure will
cost only about $2 million. Completing this investment would produce a rate of return of more than 300
percent. In Tanzania, which has the largest regional infrastructure gap (approximately 1,220 km),
completing the backbone infrastructure will cost $33 million. This one-time investment would produce an
annual rate of return of 22 percent.
Table 4.7. Gaps in intraregional connectivity and total investment required to attain minimum levels of regional connectivity
Gap (km) Investment (US$
millions)
EAC + 3,565 96
EAC 2,487 66
Burundi 90 2
Kenya 894 24
Rwanda 198 5
Tanzania 1,220 33
Uganda 85 2
Ethiopia 408 11
Sudan 670 18
EAC+ = EAC ( Burundi, Kenya, Rwanda, Tanzania, and Uganda) + Ethiopia and Sudan.
Table 4.8. Intercontinental and intraregional spending needs for East Africa for 10 years
Intercontinental connectivity
Projects Required annual investment (US$
millions)
East Africa EASSy, TEAMS 260
Southern Africa Infraco, SRII 510
Central Africa Infinity, GLO-1, WAFS
1010 West Africa
Total, Sub-Saharan Africa 1780
Source: Mayer and others 2009.
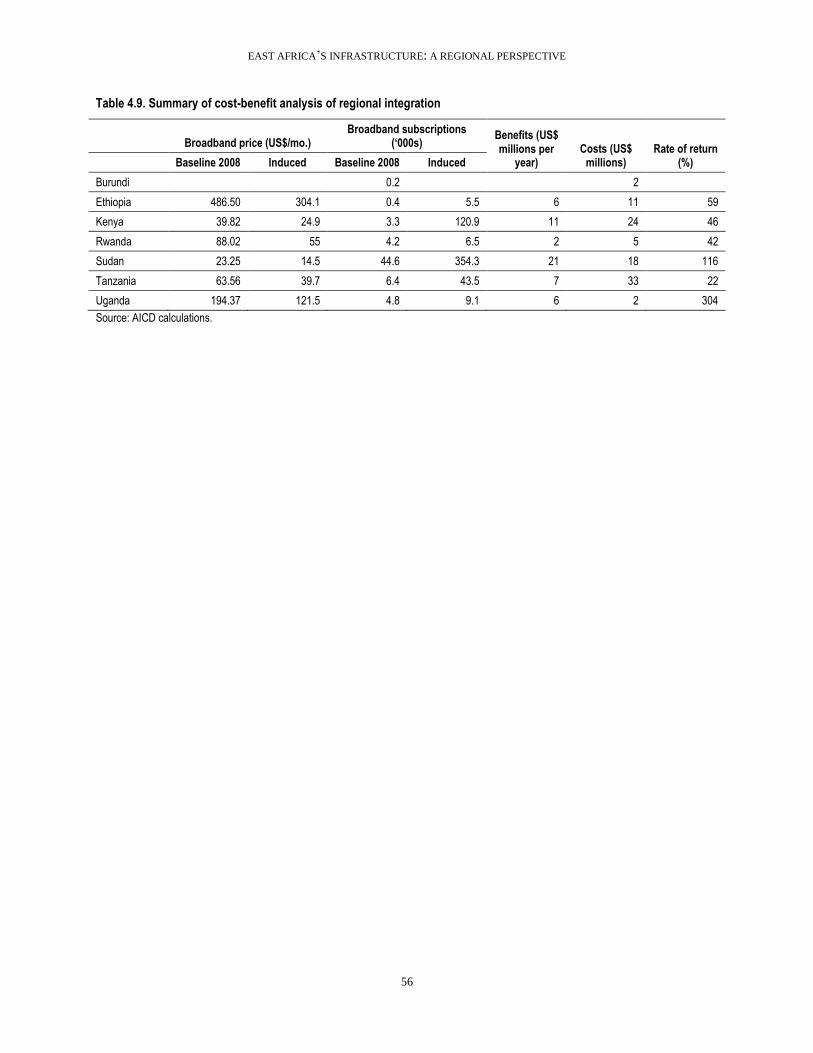
EAST AFRICA’S INFRASTRUCTURE: A REGIONAL PERSPECTIVE
56
Table 4.9. Summary of cost-benefit analysis of regional integration
Broadband price (US$/mo.) Broadband subscriptions
(‘000s) Benefits (US$ millions per
year) Costs (US$
millions) Rate of return
(%) Baseline 2008 Induced Baseline 2008 Induced
Burundi 0.2 2
Ethiopia 486.50 304.1 0.4 5.5 6 11 59
Kenya 39.82 24.9 3.3 120.9 11 24 46
Rwanda 88.02 55 4.2 6.5 2 5 42
Sudan 23.25 14.5 44.6 354.3 21 18 116
Tanzania 63.56 39.7 6.4 43.5 7 33 22
Uganda 194.37 121.5 4.8 9.1 6 2 304
Source: AICD calculations.
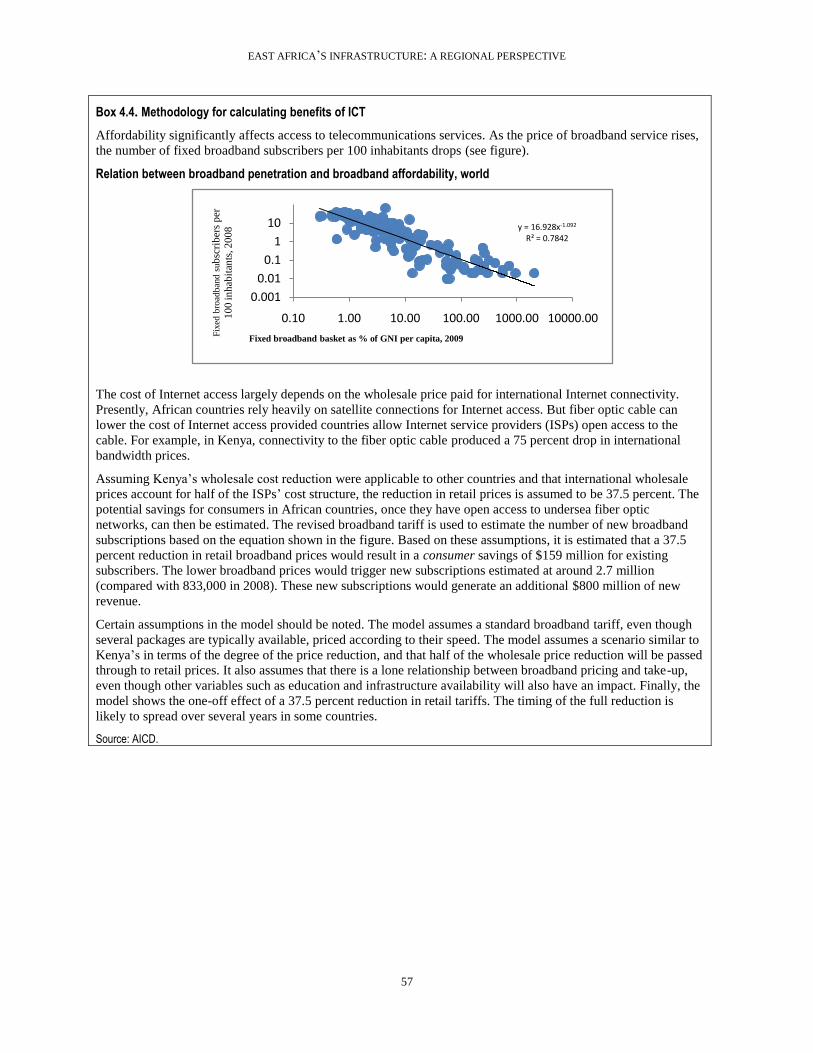
EAST AFRICA’S INFRASTRUCTURE: A REGIONAL PERSPECTIVE
57
Box 4.4. Methodology for calculating benefits of ICT
Affordability significantly affects access to telecommunications services. As the price of broadband service rises,
the number of fixed broadband subscribers per 100 inhabitants drops (see figure).
Relation between broadband penetration and broadband affordability, world
The cost of Internet access largely depends on the wholesale price paid for international Internet connectivity.
Presently, African countries rely heavily on satellite connections for Internet access. But fiber optic cable can
lower the cost of Internet access provided countries allow Internet service providers (ISPs) open access to the
cable. For example, in Kenya, connectivity to the fiber optic cable produced a 75 percent drop in international
bandwidth prices.
Assuming Kenya’s wholesale cost reduction were applicable to other countries and that international wholesale
prices account for half of the ISPs’ cost structure, the reduction in retail prices is assumed to be 37.5 percent. The
potential savings for consumers in African countries, once they have open access to undersea fiber optic
networks, can then be estimated. The revised broadband tariff is used to estimate the number of new broadband
subscriptions based on the equation shown in the figure. Based on these assumptions, it is estimated that a 37.5
percent reduction in retail broadband prices would result in a consumer savings of $159 million for existing
subscribers. The lower broadband prices would trigger new subscriptions estimated at around 2.7 million
(compared with 833,000 in 2008). These new subscriptions would generate an additional $800 million of new
revenue.
Certain assumptions in the model should be noted. The model assumes a standard broadband tariff, even though
several packages are typically available, priced according to their speed. The model assumes a scenario similar to
Kenya’s in terms of the degree of the price reduction, and that half of the wholesale price reduction will be passed
through to retail prices. It also assumes that there is a lone relationship between broadband pricing and take-up,
even though other variables such as education and infrastructure availability will also have an impact. Finally, the
model shows the one-off effect of a 37.5 percent reduction in retail tariffs. The timing of the full reduction is
likely to spread over several years in some countries.
Source: AICD.
y = 16.928x-1.092
R² = 0.7842
0.001
0.01
0.1
1
10
0.10 1.00 10.00 100.00 1000.00 10000.00
Fix
ed b
road
ban
d s
ub
scri
ber
s p
er
10
0 in
hab
itan
ts, 2
00
8
Fixed broadband basket as % of GNI per capita, 2009
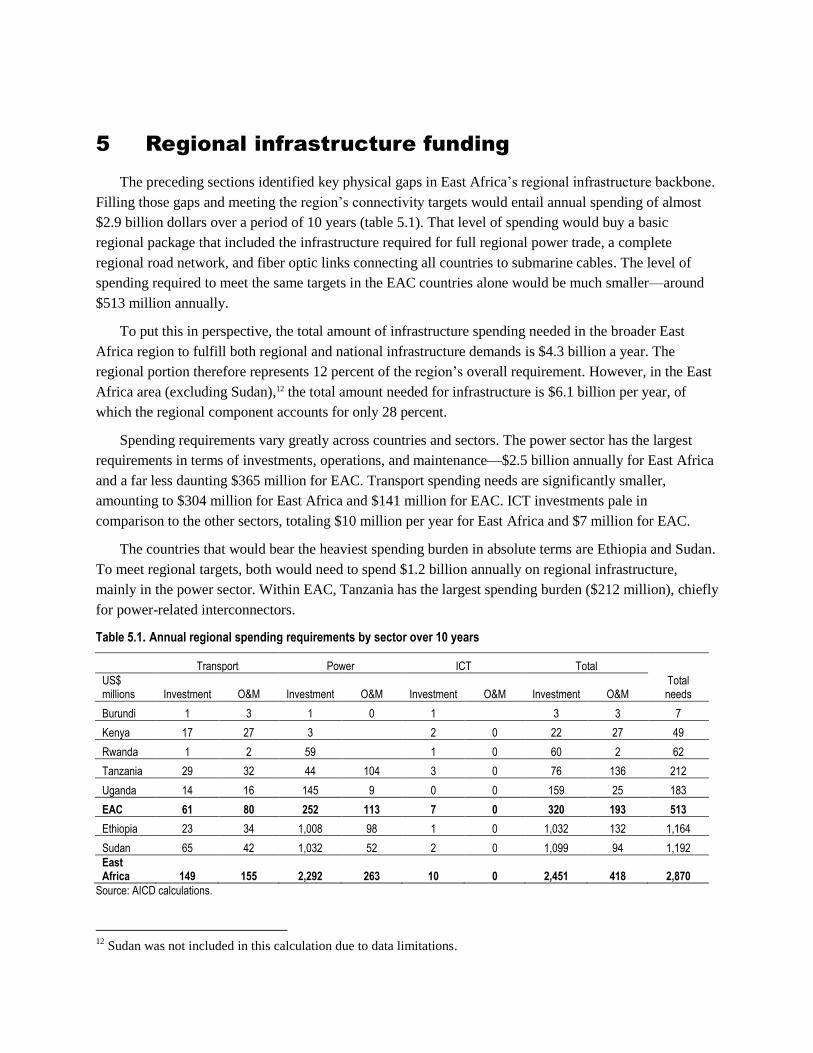
5 Regional infrastructure funding
The preceding sections identified key physical gaps in East Africa’s regional infrastructure backbone.
Filling those gaps and meeting the region’s connectivity targets would entail annual spending of almost
$2.9 billion dollars over a period of 10 years (table 5.1). That level of spending would buy a basic
regional package that included the infrastructure required for full regional power trade, a complete
regional road network, and fiber optic links connecting all countries to submarine cables. The level of
spending required to meet the same targets in the EAC countries alone would be much smaller—around
$513 million annually.
To put this in perspective, the total amount of infrastructure spending needed in the broader East
Africa region to fulfill both regional and national infrastructure demands is $4.3 billion a year. The
regional portion therefore represents 12 percent of the region’s overall requirement. However, in the East
Africa area (excluding Sudan),12 the total amount needed for infrastructure is $6.1 billion per year, of
which the regional component accounts for only 28 percent.
Spending requirements vary greatly across countries and sectors. The power sector has the largest
requirements in terms of investments, operations, and maintenance—$2.5 billion annually for East Africa
and a far less daunting $365 million for EAC. Transport spending needs are significantly smaller,
amounting to $304 million for East Africa and $141 million for EAC. ICT investments pale in
comparison to the other sectors, totaling $10 million per year for East Africa and $7 million for EAC.
The countries that would bear the heaviest spending burden in absolute terms are Ethiopia and Sudan.
To meet regional targets, both would need to spend $1.2 billion annually on regional infrastructure,
mainly in the power sector. Within EAC, Tanzania has the largest spending burden ($212 million), chiefly
for power-related interconnectors.
Table 5.1. Annual regional spending requirements by sector over 10 years
Transport Power ICT Total
Total needs
US$ millions Investment O&M Investment O&M Investment O&M Investment O&M
Burundi 1 3 1 0 1 3 3 7
Kenya 17 27 3 2 0 22 27 49
Rwanda 1 2 59 1 0 60 2 62
Tanzania 29 32 44 104 3 0 76 136 212
Uganda 14 16 145 9 0 0 159 25 183
EAC 61 80 252 113 7 0 320 193 513
Ethiopia 23 34 1,008 98 1 0 1,032 132 1,164
Sudan 65 42 1,032 52 2 0 1,099 94 1,192
East Africa 149 155 2,292 263 10 0 2,451 418 2,870
Source: AICD calculations.
12
Sudan was not included in this calculation due to data limitations.
EAST AFRICA’S INFRASTRUCTURE: A REGIONAL PERSPECTIVE
59
Maintaining East Africa’s regional backbones, once complete, would cost a significant $418 million a
year. The corresponding total for EAC is $193 million. Although the bulk of regional infrastructure
spending needs relate to new investment, there is also a significant ongoing need for maintenance. Most
of the associated maintenance costs are in the power sector—$263 million a year for East Africa and $113
million for EAC.
Completing the regional
backbone would cost around
3 percent of East Africa’s
collective gross domestic
product (GDP), but only
around 1 percent of EAC’s
GDP. Overall, then, the cost
of completing regional
infrastructure backbones
looks quite challenging for
East Africa as a whole but
much more manageable for
EAC alone.
However, the burden of
regional spending as a
percentage of GDP varies
enormously across countries
and is quite daunting in
some cases (figure 5.1). For
example, although
Ethiopia’s and Sudan’s
spending needs are roughly
the same—approximately
$1.2 billion a year—this
total represents only 4
percent of Sudan’s GDP
compared with 9 percent for
Ethiopia. Most of the other
EAC countries would need
to spend around 2 percent of
their GDP to achieve
regional spending targets, which is still quite challenging. Kenya is the only country in the region for
which regional infrastructure spending requirements appear modest in relation to the size of the national
economy.
Figure 5.1. Spending for regional infrastructure as a share of GDP
Source: AICD calculations.
Figure 5.2. Spending for regional infrastructure as a percentage of national infrastructure spending
Source: AICD calculations.
0%
2%
4%
6%
8%
10%
EAC
Plus
EA
C
Ethiopia
Sudan
Rw
anda
Uganda
Tanzania
Burundi
Kenya
Per
cent
age
of G
DP
0%
20%
40%
60%
80%
100%
Ethiopia
Rw
anda
Uganda
Tanzania
Kenya
Spe
pndi
ng N
eeds
as
a %
of a
nnua
l in
frast
ruct
ure
spen
ding
EAST AFRICA’S INFRASTRUCTURE: A REGIONAL PERSPECTIVE
60
Most countries would have to devote a significant share of their existing infrastructure budgets to
regional projects to meet the regional requirements. Figure 5.2 expresses each country’s regional
spending requirement as a percentage of existing infrastructure spending (information on existing
spending is available for only a subset of countries.) Kenya would need to spend 2.4 percent of its
existing infrastructure budget to meet regional targets. For the other countries, reaching regional targets
based on historical infrastructure spending patterns would be more challenging. Tanzania and Uganda
would need to spend between 17 and 24 percent of their existing infrastructure spending on regional
programs to address regional infrastructure issues. For Rwanda and Ethiopia, spending for regional
infrastructure would appear unachievable relative to historic infrastructure spending: these two countries
would have to spend between 40 to 60 percent of their existing infrastructure spending on regional
backbone infrastructure to meet the goals laid out in this report.

Bibliography
This country report draws upon a wide range of papers, databases, models, and maps that were
created as part of the Africa Infrastructure Country Diagnostic. All of these can be downloaded from the
project Web site: www.infrastructureafrica.org. For papers go to the document page
(http://www.infrastructureafrica.org/aicd/documents), for databases to the data page
(http://www.infrastructureafrica.org/aicd/tools/data), for models to the models page
(http://www.infrastructureafrica.org/aicd/tools/models), and for maps to the map page
(http://www.infrastructureafrica.org/aicd/tools/maps ). The references for the papers that were used to
compile this country report are provided in the table below.
General
Africa’s Infrastructure: A Time for Transformation (AICD Web site), http://www.infrastructureafrica.org
Foster, Vivien, and Cecilia Briceño-Garmendia, eds. 2009. Africa’s Infrastructure: A Time for
Transformation. Paris and Washington, DC: Agence Française de Développement and World
Bank.
Financing
Briceño-Garmendia, Cecilia, Karlis Smits, and Vivien Foster. 2009. ―Financing Public Infrastructure in
Sub-Saharan Africa: Patterns and Emerging Issues.‖ AICD Background Paper 15, Africa Region,
World Bank, Washington, DC.
Growth
Calderón, César. 2009. ―Infrastructure and Growth in Africa,‖ Policy Research Working Paper 4914,
World Bank, Washington, DC.
Escribano, Alvaro, J. Luis Guasch, and Jorge Pena. 2010. ―Assessing the Impact of Infrastructure Quality
on Firm Productivity in Africa.‖ Policy Research Working Paper 5191, World Bank, Washington,
DC.
Yepes, Tito, Justin Pierce, and Vivien Foster. 2009. ―Making Sense of Africa’s Infrastructure
Endowment: A Benchmarking Approach.‖ Policy Research Working Paper 4912, World Bank,
Washington, DC.
Information and communication technologies
Ampah, Mavis, Daniel Camos, Cecilia Briceño-Garmendia, Michael Minges, Maria Shkaratan, and Mark
Williams. 2009. ―Information and Communications Technology in Sub-Saharan Africa: A Sector
Review.‖ AICD Background Paper 10, Africa Region, World Bank, Washington, DC.
EAST AFRICA’S INFRASTRUCTURE: A REGIONAL PERSPECTIVE
62
Mayer, Rebecca, Ken Figueredo, Mike Jensen, Tim Kelly, Richard Green, and Alvaro Federico Barra.
2009. ―Connecting the Continent: Costing the Needs for Spending on ICT Infrastructure in
Africa.‖ AICD Background Paper 3, Africa Region, World Bank, Washington, DC.
Irrigation
Svendsen, Mark, Mandy Ewing, and Siwa Msangi. 2008. ―Watermarks: Indicators of Irrigation Sector
Performance in Africa.‖ AICD Background Paper 4, Africa Region, World Bank, Washington,
DC.
You, L., C. Ringler, G. Nelson, U. Wood-Sichra, R. Robertson, S. Wood, G. Zhe, T. Zhu, and Y. Sun.
2009. ―Torrents and Trickles: Irrigation Spending Needs in Africa.‖ AICD Background Paper 9,
Africa Region, World Bank, Washington, DC.
Power
Eberhard, Anton, Vivien Foster, Cecilia Briceño-Garmendia, Fatimata Ouedraogo, Daniel Camos, and
Maria Shkaratan. 2008. ―Underpowered: The State of the Power Sector in Sub-Saharan Africa.‖
AICD Background Paper 6, Africa Region, World Bank, Washington, DC.
Foster, Vivien, and Jevgenijs Steinbuks. 2009. ―Paying the Price for Unreliable Power Supplies: In-House
Generation of Electricity by Firms in Africa.‖ Policy Research Working Paper 4913, World Bank,
Washington, DC.
Rosnes, Orvika, and Haakon Vennemo. 2009. ―Powering Up: Costing Power Infrastructure Spending
Needs in Sub-Saharan Africa.‖ AICD Background Paper 5, Africa Region, World Bank,
Washington, DC.
Transport
Bullock, Richard. 2009. ―Off Track: Sub-Saharan African Railways.‖ AICD Background Paper 17, Africa
Region, World Bank, Washington, DC.
Carruthers, Robin, Ranga Rajan Krishnamani, and Siobhan Murray. 2009. ―Improving Connectivity:
Investing in Transport Infrastructure in Sub-Saharan Africa.‖ AICD Background Paper 7, Africa
Region, World Bank, Washington, DC.
Gwilliam, Ken, Vivien Foster, Rodrigo Archondo-Callao, Cecilia Briceño-Garmendia, Alberto Nogales,
and Kavita Sethi. 2008. ―The Burden of Maintenance: Roads in Sub-Saharan Africa.‖ AICD
Background Paper 14, Africa Region, World Bank, Washington, DC.
Heinrich C. Bofinger. 2009. ―An Unsteady Course: Growth and Challenges in Africa’s Air Transport
Industry.‖ AICD Background Paper 16, Africa Region, World Bank, Washington, DC.
Kumar, Ajay, and Fanny Barrett. 2008. ―Stuck in Traffic: Urban Transport in Africa.‖ AICD Background
Paper 1, Africa Region, World Bank, Washington, DC.
EAST AFRICA’S INFRASTRUCTURE: A REGIONAL PERSPECTIVE
63
Ocean Shipping Consultants, Inc. 2009. ―Beyond the Bottlenecks: Ports in Africa.‖ AICD Background
Paper 8, Africa Region, World Bank, Washington, DC.
Water supply and sanitation
Banerjee, Sudeshna, Vivien Foster, Yvonne Ying, Heather Skilling, and Quentin Wodon. ―Cost
Recovery, Equity, and Efficiency in Water Tariffs: Evidence from African Utilities.‖ AICD
Working Paper 7, World Bank, Washington, DC.
Banerjee, Sudeshna, Heather Skilling, Vivien Foster, Cecilia Briceño-Garmendia, Elvira Morella, and
Tarik Chfadi. 2008. ―Ebbing Water, Surging Deficits: Urban Water Supply in Sub-Saharan
Africa.‖ AICD Background Paper 12, Africa Region, World Bank, Washington, DC.
Gulyani, Sumila, Debabrata Talukdar, and Darby Jack. 2009. ―Poverty, Living Conditions, and
Infrastructure Access: A Comparison of Slums in Dakar, Johannesburg, and Nairobi.‖ AICD
Working Paper 10, World Bank, Washington, DC.
Keener, Sarah, Manuel Luengo, and Sudeshna Banerjee. 2009. ―Provision of Water to the Poor in Africa:
Experience with Water Standposts and the Informal Water Sector.‖ AICD Working Paper 13,
World Bank, Washington, DC.
Morella, Elvira, Vivien Foster, and Sudeshna Ghosh Banerjee. 2008. ―Climbing the Ladder: The State of
Sanitation in Sub-Saharan Africa.‖ AICD Background Paper 13, Africa Region, World Bank,
Washington, DC.
Other
Christ, Nannette, and Michael Ferrantino. 2009. ―The Effects of Cost, Time, and Uncertainty in Sub-
Saharan Africa. Draft Paper.‖ U.S. International Trade Commission, Washington DC.
Arvis, Jean-Francois, Gael Raballand, and Jean-Francois Marteau. 2009. ―The Cost of Being Landlocked:
Logistics Costs and Supply Chain Reliability.‖
Japan International Cooperation Agency. 2010. ―A Passage Across Borders: Toward Growth and
Development—Transcending Borders in Africa.‖ Tokyo.
Nathan Associates. 2010. ―Definition and Investment Strategy for a Core Strategic Transport Network for
Eastern and Southern Africa.‖ Preliminary draft report prepared for the World Bank. Washington,
DC.
Teravaninthorn, Supee, and Gael Raballand. 2009. Transport Prices and Costs in Africa: A Review of the
Main International Corridors. Washington, DC: World Bank.
United States Agency for International Development. 2009. ―Cross-Border Trade in East African
Countries: Shared Issues and Priorities for Reform.‖ Washington DC.
World Bank 2010a. Connecting to Compete 2010: Trade Logistics in the Global Economy. Washington
DC.

EAST AFRICA’S INFRASTRUCTURE: A REGIONAL PERSPECTIVE
64
World Bank 2010b. ―The Logistics Performance Index 2010.‖ In Connecting to Compete 2010: Trade
Logistics in the Global Economy, ed. World Bank. Washington, DC.
World Economic Forum. 2007. ―Competitiveness and Information and Communications Technologies in
Africa.‖ In Africa Competitiveness Report 2007, ed. World Economic Forum.
About AICD
This study is a product of the Africa Infrastructure Country Diagnostic (AICD), a project designed to
expand the world’s knowledge of physical infrastructure in Africa. AICD provides a baseline against
which future improvements in infrastructure services can be measured, making it possible to monitor the
results achieved from donor support. It also offers a solid empirical foundation for prioritizing
investments and designing policy reforms in Africa’s infrastructure sectors.
The AICD is based on an unprecedented effort to collect detailed economic and technical data on African
infrastructure. The project has produced a series of original reports on public expenditure, spending
needs, and sector performance in each of the main infrastructure sectors, including energy, information
and communication technologies, irrigation, transport, and water and sanitation. Africa’s Infrastructure—
A Time for Transformation, published by the World Bank and the Agence Française de Développement in
November 2009, synthesized the most significant findings of those reports.
Reports on Africa’s for major regional economic communities (RECs) provide a snapshot of the state of
integration of infrastructure networks at the regional level. The focus of these reports is on benchmarking
infrastructure performance within and between RECs, gauging the benefits of regional integration,
identifying missing links, and quantifying the main financing gaps and their distribution across countries.
These reports are particularly relevant to national and regional policy makers and development partners
working on regional integration programs.
The AICD was commissioned by the Infrastructure Consortium for Africa following the 2005 G8 (Group
of Eight) summit at Gleneagles, Scotland, which flagged the importance of scaling up donor finance for
infrastructure in support of Africa’s development.
The AICD’s first phase focused on 24 countries that together account for 85 percent of the gross domestic
product, population, and infrastructure aid flows of Sub-Saharan Africa. The countries are: Benin,
Burkina Faso, Cape Verde, Cameroon, Chad, Côte d’Ivoire, the Democratic Republic of Congo, Ethiopia,
Ghana, Kenya, Lesotho, Madagascar, Malawi, Mozambique, Namibia, Niger, Nigeria, Rwanda, Senegal,
South Africa, Sudan, Tanzania, Uganda, and Zambia. Under a second phase of the project, coverage was
expanded to include as many as possible of the remaining African countries.
Consistent with the genesis of the project, the main focus is on the 48 countries south of the Sahara that
face the most severe infrastructure challenges. Some components of the study also cover North African
countries so as to provide a broader point of reference. Unless otherwise stated, therefore, the term
―Africa‖ is used throughout this report as a shorthand for ―Sub-Saharan Africa.‖
The World Bank has implemented the AICD with the guidance of a steering committee that represents the
African Union, the New Partnership for Africa’s Development (NEPAD), Africa’s regional economic
communities, the African Development Bank, the Development Bank of Southern Africa, and major
infrastructure donors.
Financing for the AICD is provided by a multidonor trust fund to which the main contributors are the
United Kingdom’s Department for International Development, the Public Private Infrastructure Advisory
Facility, Agence Française de Développement, the European Commission, and Germany’s KfW
Entwicklungsbank. The Sub-Saharan Africa Transport Policy Program and the Water and Sanitation
Program provided technical support on data collection and analysis pertaining to their respective sectors.
A group of distinguished peer reviewers from policy-making and academic circles in Africa and beyond
reviewed all of the major outputs of the study to ensure the technical quality of the work.
The data underlying the AICD’s reports, as well as the reports themselves, are available to the public
through an interactive Web site, www.infrastructureafrica.org, that allows users to download customized
data reports and perform various simulations. Many AICD outputs will appear in the World Bank’s
Policy Research Working Papers series.
Inquiries concerning the availability of data sets should be directed to the volume editors at the World
Bank in Washington, DC.