Embed Size (px)
Citation preview

Crime Trends in the
City of East Palo Alto
November 2010 By Sarah Lawrence and Gregory Shapiro UC Berkeley School of Law

Crime Trends in the City of East Palo Alto
Berkeley Center for Criminal Justice 1
Acknowledgements
The Berkeley Center for Criminal Justice gratefully acknowledges Ronald Davis, Police Chief, East Palo Alto Police Department; Doris Cohen, Crime Analyst, East Palo Alto Police Department; Patty Del Castillo, Executive Assistant, East Palo Alto Police Department; other staff members of the East Palo Alto Police Department; Tom Mazzucco; and Rucha Tatke for their assistance. We would like to thank the Wachovia Foundation for their support of this project.
About the Berkeley Center for Criminal Justice
Based at the University of California, Berkeley School of Law, the Berkeley Center for Criminal Justice (BCCJ) works to enhance public safety and foster a fair and accountable justice system through research, analysis, and collaboration. BCCJ works to increase stakeholder access to timely and relevant information on criminal justice issues, enhance the understanding of those issues among policy-makers, practitioners, scholars, and students, and improve outcomes for individuals involved in the criminal and juvenile justice systems.
This report and an Executive Summary are available on the BCCJ website: www.bccj.berkeley.edu.
Crime Trends in the City of East Palo Alto
Berkeley Center for Criminal Justice 2
In This Report
Report Highlights…..………………………………………….………..…………………3
Introduction ………………………………………….………….……….……………….….5
Data Sources……………………………………………………………………….…….….. 5
Overview of East Palo Alto …………………………..……………………………...6Age 7 Ethnicity 8East Palo Alto Police Department 9
Total Crime …………………………………………………..………………………………10
Property Crime …………………………………………..………………………….……..13
Burglary 15Auto Theft 16Larceny-Theft 17
Violent Crime…………………………………………………………………………….... 18
Aggravated Assault 19Robbery 20Rape 21Homicide 22Shootings 24
Shootings by Time of Year 25Shootings by Day of the Week 27Shootings by Time of Day 28
Homicide Victims and Known Homicide Offenders 29Age 29Gender 30Race / Ethnicity 31Prior Arrests 32Extent of Prior Criminal Justice Involvement 33
Conclusion ……………………………………………………………………………………34
Appendix. Raw Data for Tables and Charts…………………………………..35
Crime Trends in the City of East Palo Alto
Berkeley Center for Criminal Justice 3
Report Highlights
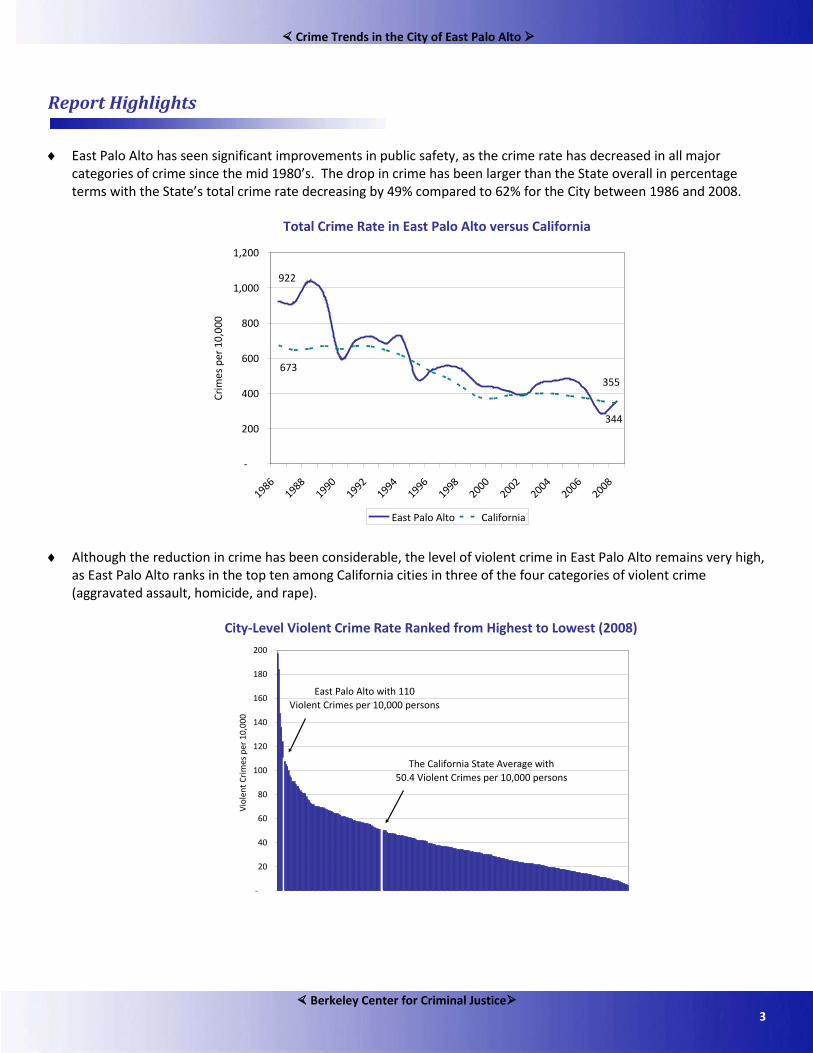
♦ East Palo Alto has seen significant improvements in public safety, as the crime rate has decreased in all major
categories of crime since the mid 1980’s. The drop in crime has been larger than the State overall in percentage terms with the State’s total crime rate decreasing by 49% compared to 62% for the City between 1986 and 2008.
Total Crime Rate in East Palo Alto versus California
♦ Although the reduction in crime has been considerable, the level of violent crime in East Palo Alto remains very high, as East Palo Alto ranks in the top ten among California cities in three of the four categories of violent crime (aggravated assault, homicide, and rape).
City-Level Violent Crime Rate Ranked from Highest to Lowest (2008)
922
355673
344
-
200
400
600
800
1,000
1,200
19861988
19901992
19941996
19982000
20022004
20062008
Crim
es p
er 1
0,00
0
East Palo Alto California
-
20
40
60
80
100
120
140
160
180
200
Viol
ent C
rim
es p
er 1
0,00
0
The California State Average with 50.4 Violent Crimes per 10,000 persons
East Palo Alto with 110Violent Crimes per 10,000 persons
Crime Trends in the City of East Palo Alto
Berkeley Center for Criminal Justice 4
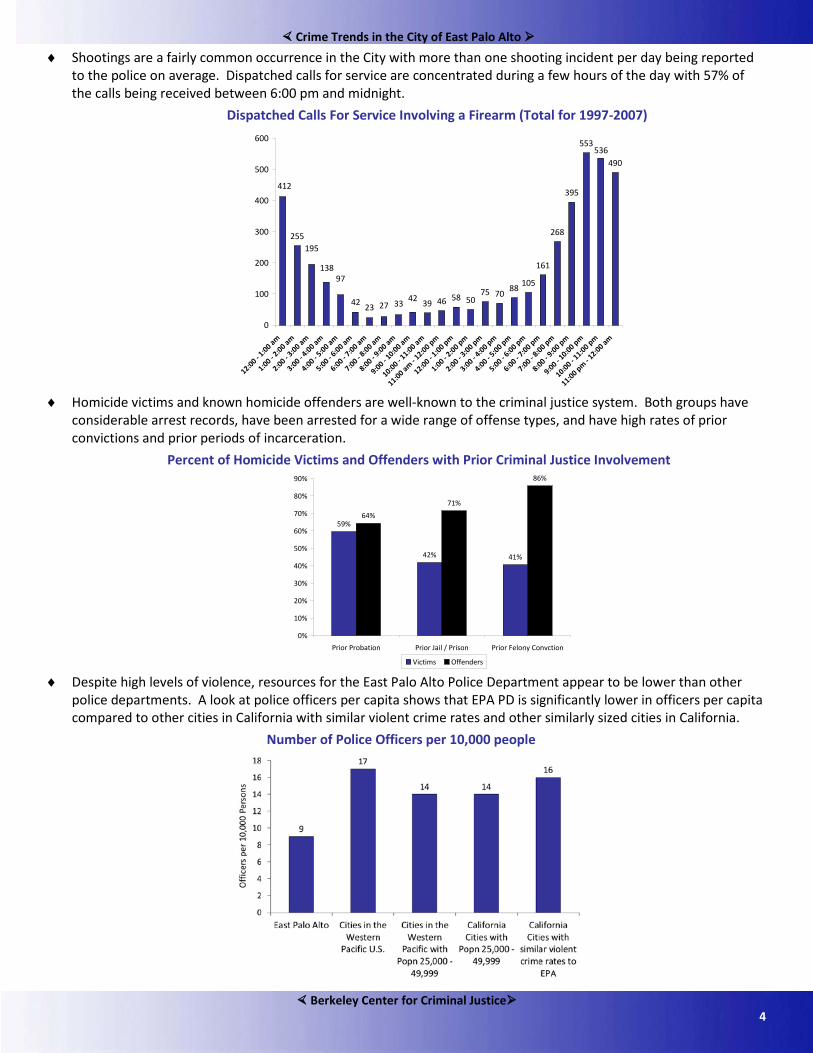
♦ Shootings are a fairly common occurrence in the City with more than one shooting incident per day being reported to the police on average. Dispatched calls for service are concentrated during a few hours of the day with 57% of the calls being received between 6:00 pm and midnight.
Dispatched Calls For Service Involving a Firearm (Total for 1997-2007)
♦ Homicide victims and known homicide offenders are well-known to the criminal justice system. Both groups have
considerable arrest records, have been arrested for a wide range of offense types, and have high rates of prior convictions and prior periods of incarceration.
Percent of Homicide Victims and Offenders with Prior Criminal Justice Involvement
♦ Despite high levels of violence, resources for the East Palo Alto Police Department appear to be lower than other
police departments. A look at police officers per capita shows that EPA PD is significantly lower in officers per capita compared to other cities in California with similar violent crime rates and other similarly sized cities in California.
Number of Police Officers per 10,000 people
255
39 46 58 5075 70
88105
161
268
395
553
490536
42332723
42
97138
195
412
0
100
200
300
400
500
600
12:00 - 1:00 am
1:00 - 2:00 am
2:00 - 3:00 am
3:00 - 4:00 am
4:00 - 5:00 am
5:00 - 6:00 am
6:00 - 7:00 am
7:00 - 8:00 am
8:00 - 9:00 am
9:00 - 10:00 am
10:00 - 11:00 am
11:00 am - 1
2:00 pm
12:00 - 1:00 pm
1:00 - 2:00 pm
2:00 - 3:00 pm
3:00 - 4:00 pm
4:00 - 5:00 pm
5:00 - 6:00 pm
6:00 - 7:00 pm
7:00 - 8:00 pm
8:00 - 9:00 pm
9:00 - 10:00 pm
10:00 - 11:00 pm
11:00 pm - 1
2:00 am
59%
42% 41%
64%
71%
86%
0%
10%
20%
30%
40%
50%
60%
70%
80%
90%
Prior Probation Prior Jail / Prison Prior Felony Convction
Victims Offenders

Crime Trends in the City of East Palo Alto
Berkeley Center for Criminal Justice 5
Introduction
This report presents a comprehensive analysis of crime in East Palo Alto (EPA) to increase knowledge about the scope and nature of crime in the City. The intent is to help City leaders, community groups, and the residents of East Palo Alto make more informed and empirically-based decisions about how to improve public safety.1
♦ What have been the overall crime trends in the City since the mid-1980s?
Included in this report are an examination of crime in the City over the last few decades and comparisons between East Palo Alto and California to understand what has happened in the City in the context of what has happened in the rest of the State. A few questions that are addressed in the report include:
♦ What types of crimes have increased during this period? What types of crimes have decreased during this period?
♦ How do the trends in the City compare to the rest of the State? ♦ What are the demographic profiles and criminal backgrounds of both homicide victims and known homicide
victims and how do they compare to one another? ♦ Has the level of shootings changed over time? ♦ When are shootings most likely to occur?
Data Sources
The analyses presented in this report are based on data from several different sources including the FBI’s Uniform Crime Reporting (UCR) Program, the California Law Enforcement Telecommunications System (CLETS), the ShotSpotter Gunshot Location System, the East Palo Alto Police Department, and the San Mateo Public Safety Communications Division.
♦ The federal Uniform Crime Reporting Program is the standard and centralized system for collecting crime data and is administered by the Federal Bureau of Investigation. There are seven “Index Crimes” that measure the prevalence of crime in the United States: murder and non-negligent manslaughter, forcible rape, robbery, aggravated assault, burglary, larceny-theft, and motor vehicle theft.2 Most of the data are presented as crime rates, which control for population to allow comparison across jurisdictions of different sizes. For the purposes of this report, crime rates are presented per 10,000 persons. The UCR Program also collects data on law enforcement personnel, including the number of sworn police officers. According to the FBI, sworn officer counts are the number of officers that were working in a police force at the time of data reporting and who ordinarily carry a firearm and a badge, have full arrest powers, and are paid from governmental funds set aside specifically to pay sworn law enforcement.3
UCR data for the period 1986 to 2008 are included in this report.
♦ The California Law Enforcement Telecommunications System is the system used by law enforcement officials in the State of California that contains records of all persons known to law enforcement and their criminal history information. For the purposes of this report it was used as the source of information on homicide victims and known homicide offenders in East Palo Alto in terms of their demographic characteristics and criminal histories. All data on homicide victims and known offenders presented in this report are anonymous and names or other identifying information are not included. Data on homicide victims from January 1998 to June 2010 and data on known homicide offenders from January 2006 to June 2010 are included in this report.
1 The City of East Palo Alto was incorporated in 1983 and consistent data collection began in 1986. 2 The combination of murder, rape, robbery, and aggravated assault is generally referred to as Violent Crimes and the combination of burglary, larceny-theft, and motor vehicle theft is generally referred to as Property Crimes. 3 Data Declaration, Uniform Crime Report, Crime in the United States. http://www.fbi.gov/ucr/cius2008/data/table_78_dd.html
Crime Trends in the City of East Palo Alto
Berkeley Center for Criminal Justice 6
♦ The ShotSpotter Gunshot Location System (ShotSpotter) was launched in East Palo Alto in 20% of the city in 2008
and citywide in 2009. ShotSpotter is a gunshot location detection system that employs sensors that use the physics of sound propagation and triangulation to determine the precise location of where a sound originated thereby locating the approximate location of a firearm being discharged. Data from ShotSpotter’s monthly activity reports from January 2009 through June 2010 are included in this report.
♦ The San Mateo County Public Safety Communications Division is the dispatch center for calls for service for the City
of East Palo Alto. The East Palo Alto Police Department obtained dispatched calls for service data from the Division from the period January 1998 through June 2010. Dispatched calls for service data were used to examine the levels of calls for service for firearms discharged (10-57s) and shootings into dwellings (246s).
The Appendix of this report includes a series of tables with the underlying data for the charts presented below.
Overview of East Palo Alto
This report begins with an overview of the City of East Palo Alto in terms of population size, age distribution of the residents, and ethnicity distribution of the residents. Population
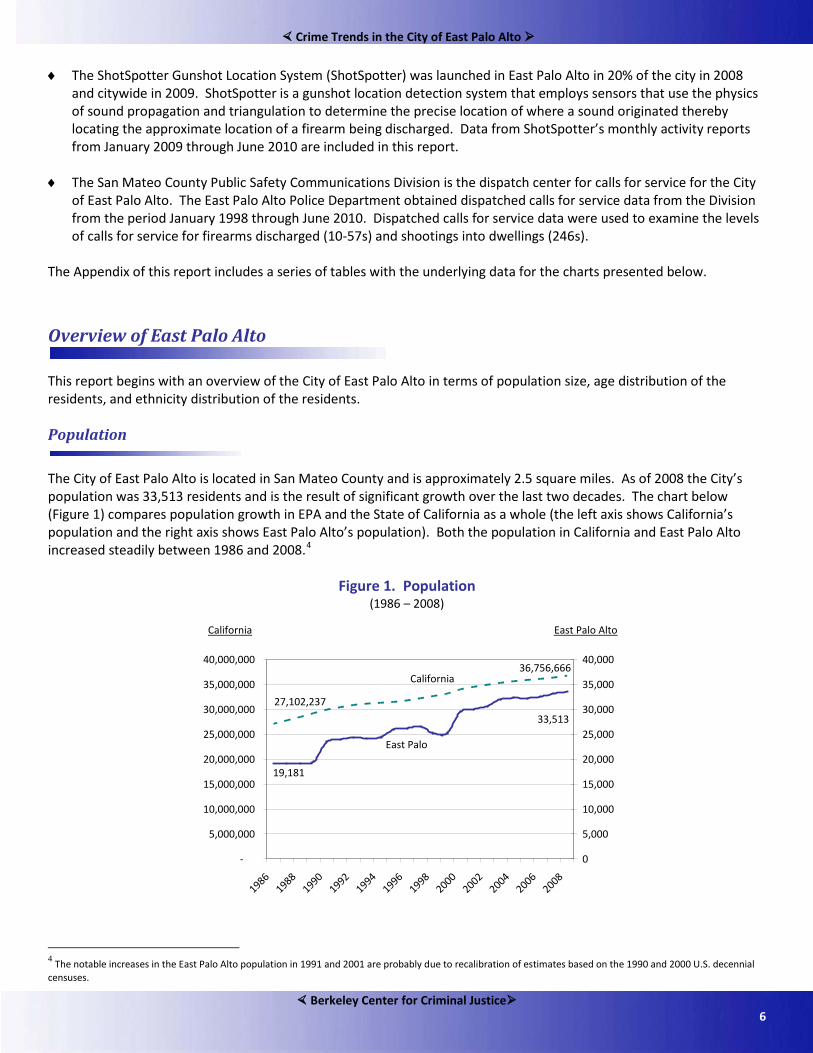
The City of East Palo Alto is located in San Mateo County and is approximately 2.5 square miles. As of 2008 the City’s population was 33,513 residents and is the result of significant growth over the last two decades. The chart below (Figure 1) compares population growth in EPA and the State of California as a whole (the left axis shows California’s population and the right axis shows East Palo Alto’s population). Both the population in California and East Palo Alto increased steadily between 1986 and 2008.4
Figure 1. Population (1986 – 2008)
4 The notable increases in the East Palo Alto population in 1991 and 2001 are probably due to recalibration of estimates based on the 1990 and 2000 U.S. decennial censuses.
36,756,666
27,102,237
33,513
19,181
-
5,000,000
10,000,000
15,000,000
20,000,000
25,000,000
30,000,000
35,000,000
40,000,000
19861988
19901992
19941996
19982000
20022004
20062008
0
5,000
10,000
15,000
20,000
25,000
30,000
35,000
40,000
California East Palo Alto
California
East Palo

Crime Trends in the City of East Palo Alto
Berkeley Center for Criminal Justice 7
To understand the magnitude and timing of the population growth, Figure 2 presents the percent change by decade for East Palo Alto and California. The first set of columns shows that from 1986 to 1990, East Palo Alto’s population increased by 22% while California’s population increased by 11%. The second and third sets of columns display the percent change for the periods 1990 to 2000 and 2000 to 2008. The final set of columns shows the total 22-year change in population. East Palo Alto’s population growth was more than double California’s growth, increasing by a remarkable 75% between 1986 and 2008 compared to 36% for the State overall. The higher growth was sustained during this entire time period, as EPA grew faster than the State in each decade.
Figure 2. Percent Change in Population by Decade in East Palo Alto and California
Age
The residents of EPA are generally younger than the State overall. A greater portion of East Palo Alto’s population is younger than 25 years old compared to the State (45% and 36%, respectively). Twenty-five percent of EPA’s population is 45 years and older compared to 35% for the State.
Age Distribution of East Palo Alto and California Residents (2006 – 2008)
Source: U.S. Census Bureau, 2006-2008 American Community Survey
22%
14%11%
14%
75%
26%
8%
36%
0%
10%
20%
30%
40%
50%
60%
70%
80%
1986 - 1990 1990 - 2000 2000 - 2008 1986 - 2008
East Palo Alto Population California Population
East Palo Alto California0 to 14 years 26% 21%15 to 19 years 11% 8%20 to 24 years 8% 7%25 to 34 years 15% 14%35 to 44 years 14% 15%45 to 54 years 10% 14%55 and older 15% 21%
Crime Trends in the City of East Palo Alto
Berkeley Center for Criminal Justice 8
Ethnicity
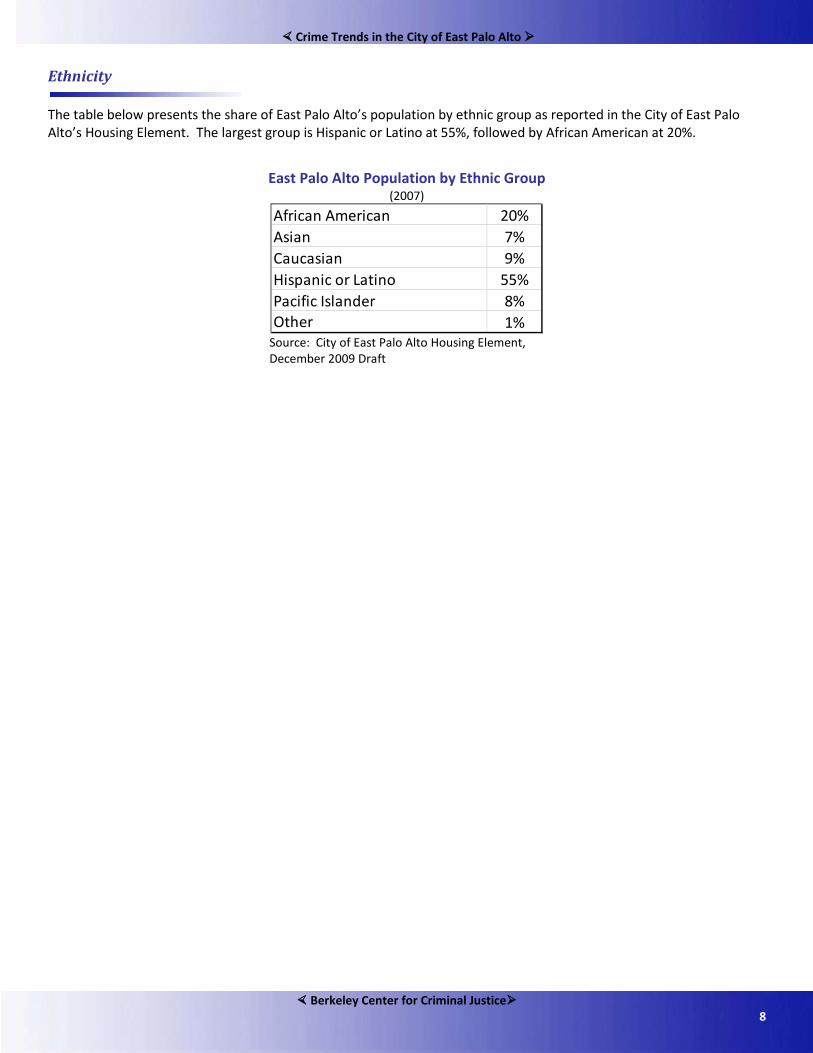
The table below presents the share of East Palo Alto’s population by ethnic group as reported in the City of East Palo Alto’s Housing Element. The largest group is Hispanic or Latino at 55%, followed by African American at 20%.
East Palo Alto Population by Ethnic Group (2007)
Source: City of East Palo Alto Housing Element, December 2009 Draft
African American 20%Asian 7%Caucasian 9%Hispanic or Latino 55%Pacific Islander 8%Other 1%

Crime Trends in the City of East Palo Alto
Berkeley Center for Criminal Justice 9
East Palo Alto Police Department
The average number of sworn police officers in East Palo Alto between 2002 and 2008 was 34 officers, ranging from 29 officers in 2008 to 37 officers in 2004 and 2005 (Figure 3). Figure 4 compares the number of police officers per 10,000 persons from a few sources. In 2008, East Palo Alto had nine police officers per 10,000 persons. Figure 4 shows that East Palo Alto’s rate is significantly lower compared to the average of all cities in the Western Pacific (17 officers per 10,000), the average of cities of similar size in the Western Pacific (14 officers per 10,000), the average of cities of similar size in California (14 officers per 10,000), and the average of cities with similar crime rates in California (16 officers per 10,000).5
Figure 3. Number of Police Officers in East Palo Alto
In short, whether the comparison is based on geographic location, population size, or violent crime rate, East Palo Alto had a lower number of police officers per capita.
(2002 – 2008)
Figure 4. Police Officer Rates (per 10,000 people)
(2008)
5 Sources: Cities in the Western Pacific were taken from the FBI Uniform Crime Report 2008, Table 71. The states included in the “Western Pacific” category are:
Alaska, California, Hawaii, Oregon, and Washington. Cities in California with populations of 25,000 – 49,000 were taken from the FBI Uniform Crime Report 2008, Table 78. Cities in California with similar violent crime rates to East Palo Alto were taken from the FBI Uniform Crime Report 2008, Table 8 and only included cities that had populations of 20,000 or more and reported their violent crime statistics as well as their officer employment statistics. The following cities were included: Richmond, San Pablo, San Bernardino, Sacramento, Vallejo, Eureka, Huntington Park, Oakland, and Stockton.

Crime Trends in the City of East Palo Alto
Berkeley Center for Criminal Justice 10
Total Crime
Figure 5 compares the number of crimes for the seven major crime types. In 2008 there were 333 reported auto thefts, the highest of the individual crime types in East Palo Alto. Figure 6 shows that over two-thirds of the crimes in East Palo Alto in 2008 were property crimes (69%). The four violent crime types (homicide, rape, robbery, and assault) accounted for 31% of the number of crimes in the City that year.
Figure 5. Number of Crimes by Type in East Palo Alto (2008)
Figure 6. Percent of All Crimes by Crime Type
(2008)
518
106
276
212
239
333
0
50
100
150
200
250
300
350
Num
ber
of O
ffen
ses
Homicide Burglary Larceny-Theft
AggravatedAssault
AutoTheft
Rape Robbery
Robbery9%
Rape2%
Homicide0.4%Larceny-Theft
18%Auto Theft28%
Burglary23% Aggravated Assault
20%
Property Crimes (69%)Violent Crimes (31%)
Crime Trends in the City of East Palo Alto
Berkeley Center for Criminal Justice 11
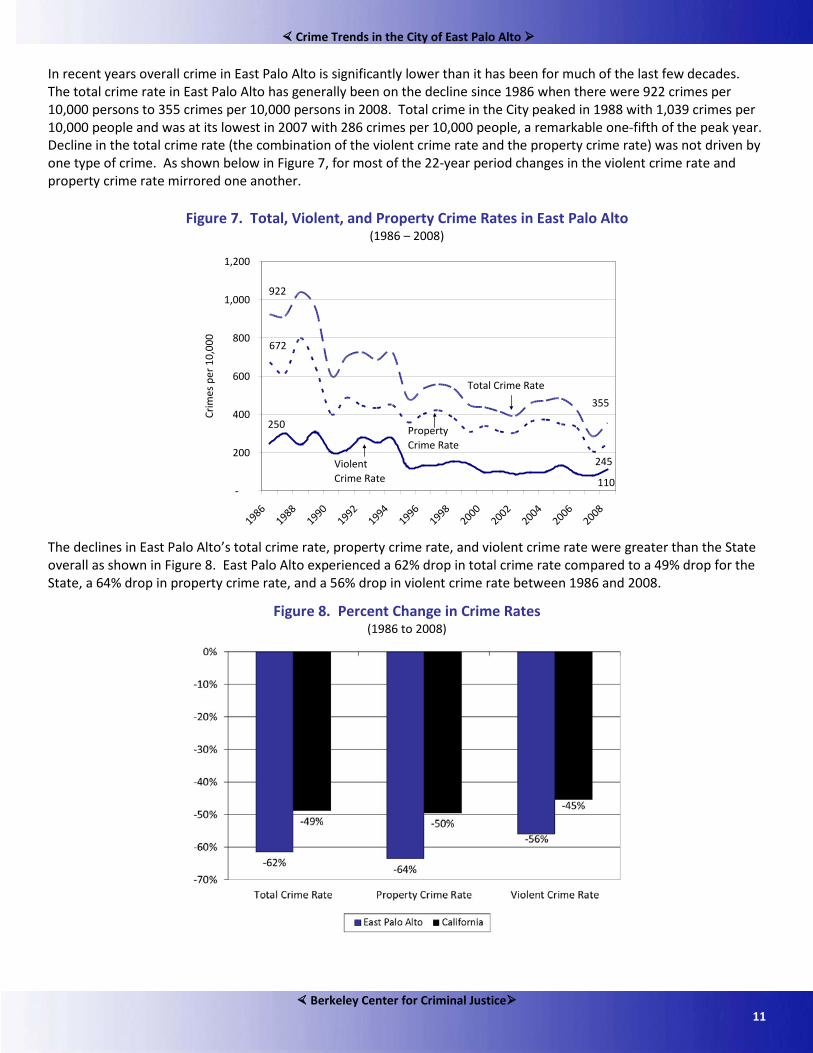
In recent years overall crime in East Palo Alto is significantly lower than it has been for much of the last few decades. The total crime rate in East Palo Alto has generally been on the decline since 1986 when there were 922 crimes per 10,000 persons to 355 crimes per 10,000 persons in 2008. Total crime in the City peaked in 1988 with 1,039 crimes per 10,000 people and was at its lowest in 2007 with 286 crimes per 10,000 people, a remarkable one-fifth of the peak year. Decline in the total crime rate (the combination of the violent crime rate and the property crime rate) was not driven by one type of crime. As shown below in Figure 7, for most of the 22-year period changes in the violent crime rate and property crime rate mirrored one another.
Figure 7. Total, Violent, and Property Crime Rates in East Palo Alto
(1986 – 2008)
The declines in East Palo Alto’s total crime rate, property crime rate, and violent crime rate were greater than the State overall as shown in Figure 8. East Palo Alto experienced a 62% drop in total crime rate compared to a 49% drop for the State, a 64% drop in property crime rate, and a 56% drop in violent crime rate between 1986 and 2008.
250
110
672
245
922
355
-
200
400
600
800
1,000
1,200
19861988
19901992
19941996
19982000
20022004
20062008
Crim
es p
er 1
0,00
0
Violent Crime Rate
Property Crime Rate
Total Crime Rate
Figure 8. Percent Change in Crime Rates (1986 to 2008)
Crime Trends in the City of East Palo Alto
Berkeley Center for Criminal Justice 12
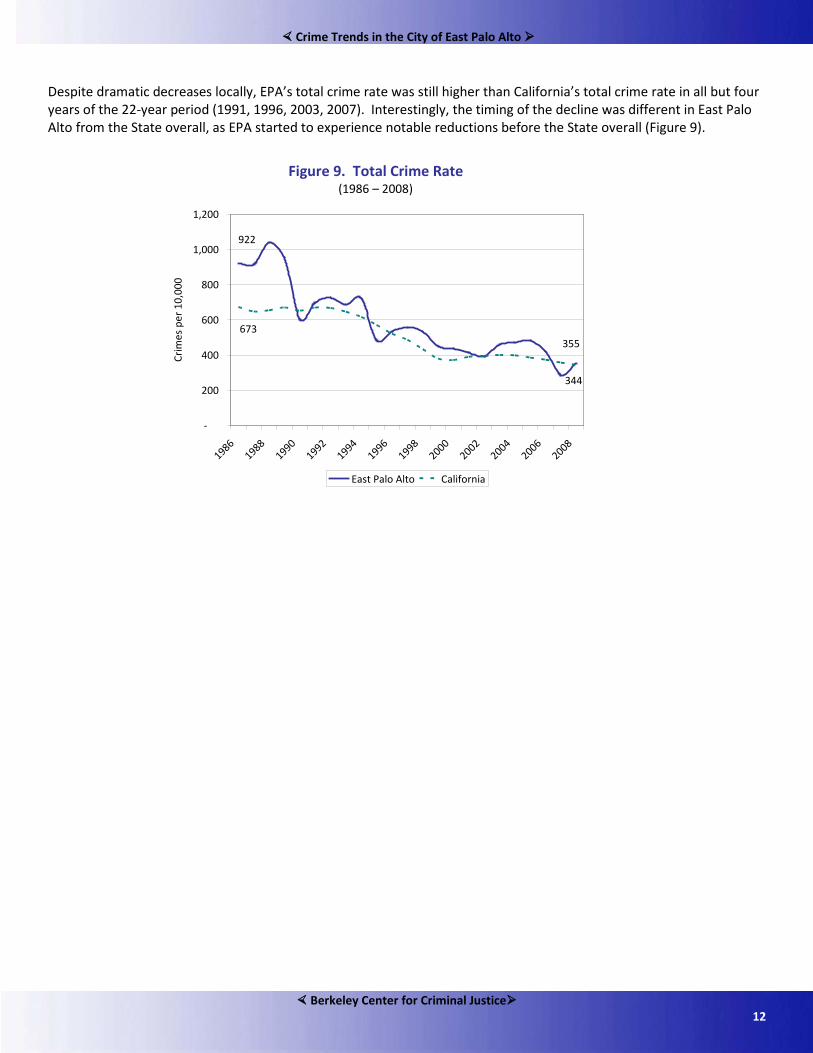
Despite dramatic decreases locally, EPA’s total crime rate was still higher than California’s total crime rate in all but four years of the 22-year period (1991, 1996, 2003, 2007). Interestingly, the timing of the decline was different in East Palo Alto from the State overall, as EPA started to experience notable reductions before the State overall (Figure 9).
Figure 9. Total Crime Rate (1986 – 2008)
922
355673
344
-
200
400
600
800
1,000
1,200
19861988
19901992
19941996
19982000
20022004
20062008
Crim
es p
er 1
0,00
0
East Palo Alto California

Crime Trends in the City of East Palo Alto
Berkeley Center for Criminal Justice 13
Property Crime
Since 1986, East Palo Alto has experienced a significant decrease in the property crime rate. In 1986 there were 672 property crimes per 10,000 people in East Palo Alto and that decreased to 245 property crimes per 10,000 people by 2008. The property crime rate was the lowest during this 22-year period in 2007 with 207 property crimes per 10,000 people. The property crime rate in California also decreased during this period from 582 per 10,000 to 294 per 10,000 between 1986 and 2008 (Figure 10). East Palo Alto’s property crime rate fluctuated when compared to the State average. In approximately half of the years included in Figure 10 EPA’s property crime rate was higher than the State and in half of the years it was lower.
Figure 10. Property Crime Rate (1986 - 2008)
245
672
294
582
-
100
200
300
400
500
600
700
800
900
19861988
19901992
19941996
19982000
20022004
20062008
Crim
es p
er 1
0,00
0
East Palo Alto California

Crime Trends in the City of East Palo Alto
Berkeley Center for Criminal Justice 14
Ranking individual cities based on their property crime rate shows that East Palo Alto ranked 173rd out of 291 California cities in 2008 and was lower than the State average.6
The left side of Figure 11 includes cities with higher property crime rates and the right side includes cities with lower property crime rates. The overall State average property crime rate in 2008 was 294 per 10,000 persons.
Figure 11. City-Level Property Crime Rate Ranked from Highest to Lowest (2008)
6 In 2008, there were 291 cities in California with a population greater than 20,000.
-
100
200
300
400
500
600
700
Prop
erty
Cri
mes
per
10,
000 The California State Average with 294
Property Crimes per 10,000persons
East Palo Alto with 245Property Crimes per 10,000
persons

Crime Trends in the City of East Palo Alto
Berkeley Center for Criminal Justice 15
Burglary
The rate of burglary has experienced a significant decline since 1986 with East Palo Alto dropping 69% compared to a 62% drop for the State overall. Since 1996, East Palo Alto’s burglary rate has remained consistently higher than the average of California (Figure 12). In 2008, East Palo Alto ranked 61st among 291 California cities in burglary rate (Figure 13).
Figure 12. Burglary Rate (1986 – 2008)
Figure 13. City-Level Burglary Rate Ranked from Highest to Lowest (2008)
262
82
169
65
-
50
100
150
200
250
300
19861988
19901992
19941996
19982000
20022004
20062008
Crim
es p
er 1
0,00
0
East Palo Alto California
-
25
50
75
100
125
150
175
200
225
250
Burg
lari
es p
er 1
0,00
0
The California State Average with 64.7 Burglaries per 10,000 persons
East Palo Alto with 82.4 Burglariesper 10,000 persons

Crime Trends in the City of East Palo Alto
Berkeley Center for Criminal Justice 16
Auto Theft
The rate of auto theft in East Palo Alto has increased and decreased several times over the last few decades. In 2008 there were 99 auto thefts per 10,000 people compared to 52 for the State (Figure 14). East Palo Alto was on the high end in terms of the rate of auto thefts ranking 21st out of 291 cities in 2008 (Figure 15).
Figure 14. Auto Theft Rate (1986 – 2008)
Figure 15. City-Level Auto Theft Rate Ranked from Highest to Lowest (2008)
11399
76
52
-
50
100
150
200
250
19861988
19901992
19941996
19982000
20022004
20062008
Crim
es p
er 1
0,00
0
East Palo Alto California
-
25
50
75
100
125
150
175
200
225
Aut
o Th
efts
per
10,
000
The California State Average with 52.4 Auto Thefts per 10,000 persons
East Palo Alto with 99.4 AutoThefts per 10,000 persons

Crime Trends in the City of East Palo Alto
Berkeley Center for Criminal Justice 17
Larceny-Theft
East Palo Alto has consistently had a lower larceny-theft rate than California overall. East Palo Alto’s larceny-theft rate was the lowest in 2007 with 61 per 10,000 people and highest in 1988 with 356 per 10,000, which is over five times higher than it is today (Figure 16). East Palo Alto’s larceny-theft rate is one of the lowest in the State. In 2008, East Palo Alto ranked 287th out of 291 in larceny-theft rate (Figure 17).
Figure 16. Larceny-Theft Rate (1986 – 2008)
Figure 17. City-Level Larceny-Theft Theft Rate Ranked from Highest to Lowest (2008)
298
63
337
177
-
50
100
150
200
250
300
350
400
19861988
19901992
19941996
19982000
20022004
20062008
Crim
es p
er 1
0,00
0
East Palo Alto California
-
100
200
300
400
500
Larc
eny-
Thef
ts p
er 1
0,00
0
The California State Average with 177.0 Larceny-Thefts per 10,000
persons
East Palo Alto with63.3 Larceny-Thefts per 10,000
persons

Crime Trends in the City of East Palo Alto
Berkeley Center for Criminal Justice 18
Violent Crime
Since 1986, East Palo Alto has experienced a significant decrease in the violent crime rate. In 1986, there were 250 violent crimes reported per 10,000 people in East Palo Alto (a total number of 480 violent crimes reported) and that decreased to 110 crimes reported per 10,000 people by 2008 (a total number of 368 violent crimes reported). Violent crime in East Palo Alto peaked in 1989 with 308 violent crimes per 10,000 persons. East Palo Alto’s year of lowest violent crime was 2007 with 79 violent crimes per 10,000 people (Figure 18). Like East Palo Alto, the violent crime rate in California trended downward from 92 per 10,000 to 50 per 10,000 between 1986 and 2008. Despite significant reductions in East Palo Alto’s violent crime rate, it has remained consistently higher than the State average during the entire 22-year period (Figure 18).
Figure 18. Violent Crime Rate (1986 – 2008)
In 2008, East Palo Alto ranked 6th in violent crime rate among the 291 cities in California with a population exceeding 20,000 persons (Figure 19). Said another way, only five cities in California had a higher violent crime rate than East Palo Alto in 2008. They are Barstow, Compton, Desert Hot Springs, Oakland, and Stockton.
Figure 19. City-Level Violent Crime Rate Ranked from Highest to Lowest (2008)
110
250
50
92
-
50
100
150
200
250
300
350
19861988
19901992
19941996
19982000
20022004
20062008
Crim
es p
er 1
0,00
0
East Palo Alto California
-
20
40
60
80
100
120
140
160
180
200
Viol
ent C
rim
es p
er 1
0,00
0
The California State Average with 50.4 Violent Crimes per 10,000 persons
East Palo Alto with 110Violent Crimes per 10,000 persons

Crime Trends in the City of East Palo Alto
Berkeley Center for Criminal Justice 19
Aggravated Assault
East Palo Alto’s aggravated assault rate decreased by 58% between 1986 and 2008 from 168 assaults per 10,000 to 71 per 10,000 (Figure 20). Aggravated assaults have experienced a series of increases and decreases over the 22-year period but have consistently been higher than the State average. In 2008, East Palo Alto ranked 6th in aggravated assault among 291 California cities (Figure 21). Only Barstow, Compton, Desert Hot Springs, Oakland, and Stockton had higher assault rates in 2008.
Figure 20. Aggravated Assault Rate (1986 – 2008)
Figure 21. City-Level Aggravated Assault Rate Ranked from Highest to Lowest (2008)
168
71
52 29
-
50
100
150
200
250
19861988
19901992
19941996
19982000
20022004
20062008
Crim
es p
er 1
0,00
0
East Palo Alto California
-
15
30
45
60
75
90
105
120
Agg
rava
ted
Ass
aults
per
10,
000
The California State Average with 28.5 AggravatedAssaults per 10,000 persons
East Palo Alto with 71.3 Aggravated Assaults per 10,000 persons
Crime Trends in the City of East Palo Alto
Berkeley Center for Criminal Justice 20
Robbery
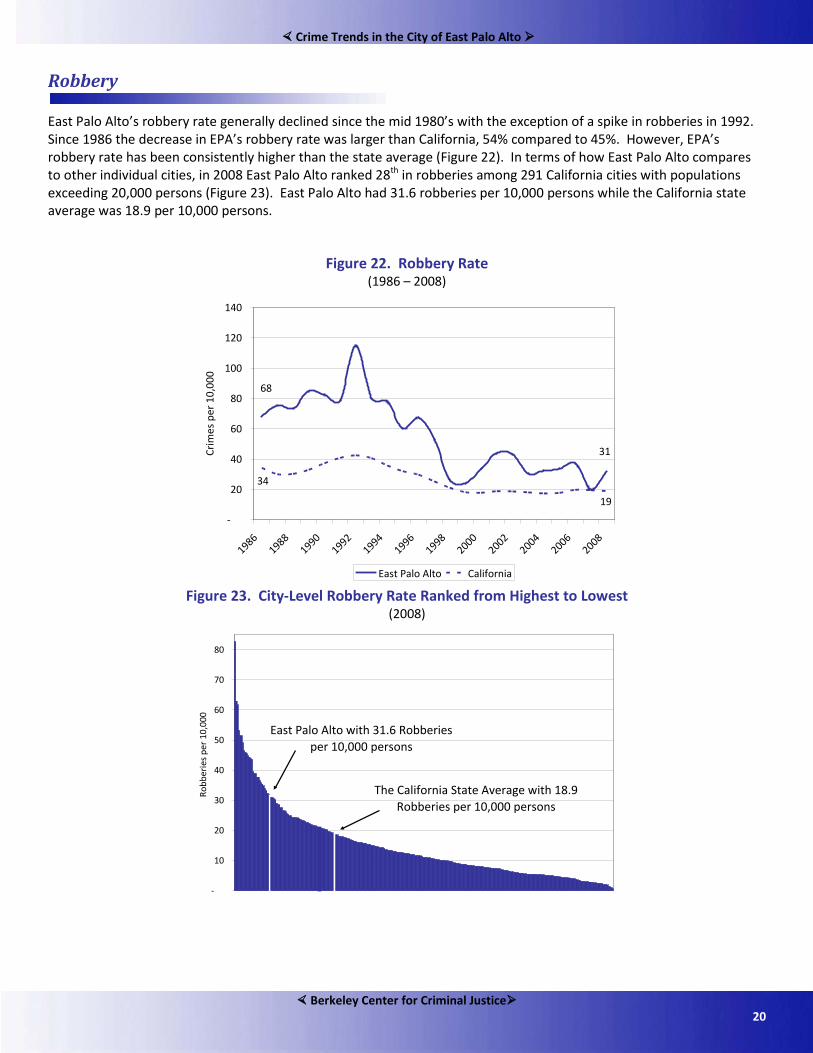
East Palo Alto’s robbery rate generally declined since the mid 1980’s with the exception of a spike in robberies in 1992. Since 1986 the decrease in EPA’s robbery rate was larger than California, 54% compared to 45%. However, EPA’s robbery rate has been consistently higher than the state average (Figure 22). In terms of how East Palo Alto compares to other individual cities, in 2008 East Palo Alto ranked 28th in robberies among 291 California cities with populations exceeding 20,000 persons (Figure 23). East Palo Alto had 31.6 robberies per 10,000 persons while the California state average was 18.9 per 10,000 persons.
Figure 22. Robbery Rate (1986 – 2008)
Figure 23. City-Level Robbery Rate Ranked from Highest to Lowest
(2008)
68
31
34
19
-
20
40
60
80
100
120
140
19861988
19901992
19941996
19982000
20022004
20062008
Crim
es p
er 1
0,00
0
East Palo Alto California
-
10
20
30
40
50
60
70
80
Robb
erie
s pe
r 10
,000
The California State Average with 18.9Robberies per 10,000 persons
East Palo Alto with 31.6 Robberiesper 10,000 persons

Crime Trends in the City of East Palo Alto
Berkeley Center for Criminal Justice 21
Rape
The number of rapes in East Palo Alto declined during the mid 2000’s from 23 in 2004 to 18 in 2008 (Figure 24).7
The number of rapes per 10,000 has been higher than the state average in 21 of the 22 years included in Figure 25. EPA ranks 8th out of 291 cities in terms of highest number of rapes per 10,000 (Figure 26).
Figure 24. Number of Rapes in East Palo Alto (1986 – 2008)
Figure 25. Rape Rate
(1986 - 2008)
7 The rate from one year to the next can change significantly because of the relatively small number of crimes and comparisons with state averages should be made with caution.
19
27
31
23
9 10
1411
14 13 12 13 14
40
25
1916
19
2321 22
2018
0
5
10
15
20
25
30
35
40
45
19861988
19901992
19941996
19982000
20022004
20062008
9.9
5.4
4.5
2.4-
2.0
4.0
6.0
8.0
10.0
12.0
14.0
16.0
18.0
19861988
19901992
19941996
19982000
20022004
20062008
Crim
es p
er 1
0,00
0
East Palo Alto California

Crime Trends in the City of East Palo Alto
Berkeley Center for Criminal Justice 22
Figure 26. City-Level Rape Rate Ranked from Highest to Lowest
(2008)
Homicide
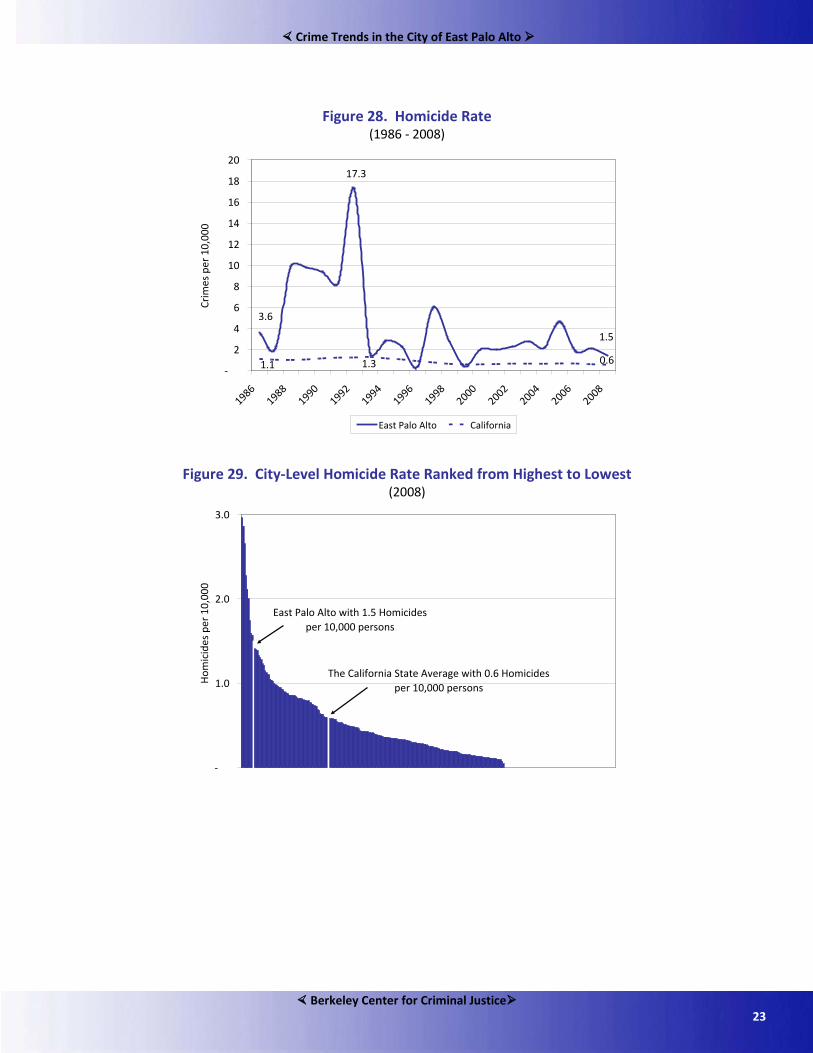
The number of homicides per year in East Palo Alto changed significantly over the period 1986 to 2008. Since the dramatic spike in 1992, the number of homicides has been less than 10 per year with the exception of 1997 (16) and 2005 (15) (Figure 27).8 However, EPA’s homicide rate has consistently been higher than the State since 2000 (Figure 28). Despite the City having the lowest number of homicides in years in 2008, East Palo Alto still ranked 10th among 291 California cities with a population exceeding 20,000 persons (Figure 29).9
The nine cities in California that had a higher homicide rate than East Palo Alto in 2008 were Barstow, Compton, Covina, Desert Hot Springs, Oakland, Richmond, Salinas, San Bernardino, and San Pablo.
Figure 27. Number of Homicides in East Palo Alto (1986 – 2008)
8 The homicide rate can change dramatically from year to year so comparisons with the State average should be made with caution. 9 Note that the right side of Figure 29 depicts the 87 cities with a population greater than 20,000 that had no homicides in 2008.
-
1
2
3
4
5
6
7
8
9
10
Rape
s pe
r 10
,000
The California State Average with 2.4 Rapes per 10,000 persons
East Palo Alto with5.4 Rapes per 10,000 persons
74
19 1922
20
42
47 6
1
16
7
1
6 6 79
7
15
6 75
0
5
10
15
20
25
30
35
40
45
19861988
19901992
19941996
19982000
20022004
20062008
Crime Trends in the City of East Palo Alto
Berkeley Center for Criminal Justice 23
Figure 28. Homicide Rate (1986 - 2008)
Figure 29. City-Level Homicide Rate Ranked from Highest to Lowest (2008)
3.6
17.3
1.5
1.1 1.3 0.6-
2
4
6
8
10
12
14
16
18
20
19861988
19901992
19941996
19982000
20022004
20062008
Crim
es p
er 1
0,00
0
East Palo Alto California
-
1.0
2.0
3.0
Hom
icid
es p
er 1
0,00
0
The California State Average with 0.6 Homicidesper 10,000 persons
East Palo Alto with 1.5 Homicidesper 10,000 persons
Crime Trends in the City of East Palo Alto
Berkeley Center for Criminal Justice 24
Shootings
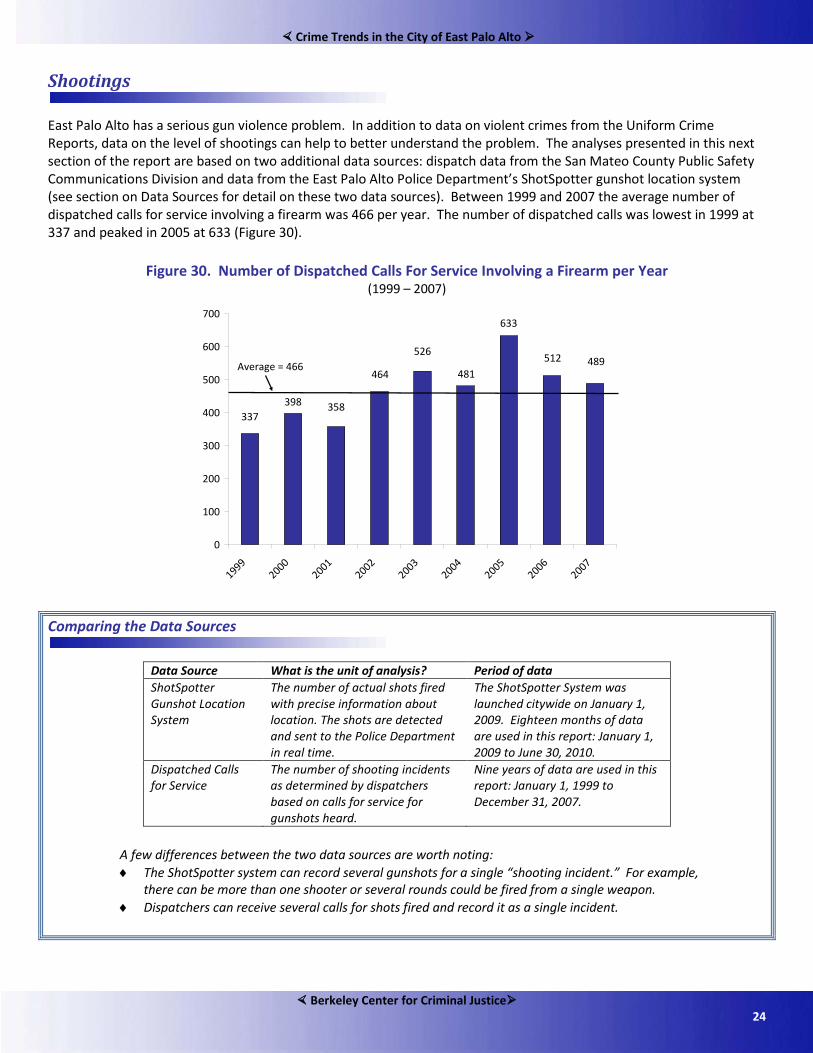
East Palo Alto has a serious gun violence problem. In addition to data on violent crimes from the Uniform Crime Reports, data on the level of shootings can help to better understand the problem. The analyses presented in this next section of the report are based on two additional data sources: dispatch data from the San Mateo County Public Safety Communications Division and data from the East Palo Alto Police Department’s ShotSpotter gunshot location system (see section on Data Sources for detail on these two data sources). Between 1999 and 2007 the average number of dispatched calls for service involving a firearm was 466 per year. The number of dispatched calls was lowest in 1999 at 337 and peaked in 2005 at 633 (Figure 30).
Figure 30. Number of Dispatched Calls For Service Involving a Firearm per Year (1999 – 2007)
Comparing the Data Sources
Data Source What is the unit of analysis? Period of data ShotSpotter Gunshot Location System
The number of actual shots fired with precise information about location. The shots are detected and sent to the Police Department in real time.
The ShotSpotter System was launched citywide on January 1, 2009. Eighteen months of data are used in this report: January 1, 2009 to June 30, 2010.
Dispatched Calls for Service
The number of shooting incidents as determined by dispatchers based on calls for service for gunshots heard.
Nine years of data are used in this report: January 1, 1999 to December 31, 2007.
A few differences between the two data sources are worth noting: ♦ The ShotSpotter system can record several gunshots for a single “shooting incident.” For example,
there can be more than one shooter or several rounds could be fired from a single weapon. ♦ Dispatchers can receive several calls for shots fired and record it as a single incident.
398337
358
464
526
481
633
512 489
0
100
200
300
400
500
600
700
19992000
20012002
20032004
20052006
2007
Average = 466
Crime Trends in the City of East Palo Alto
Berkeley Center for Criminal Justice 25
Shootings by Time of Year
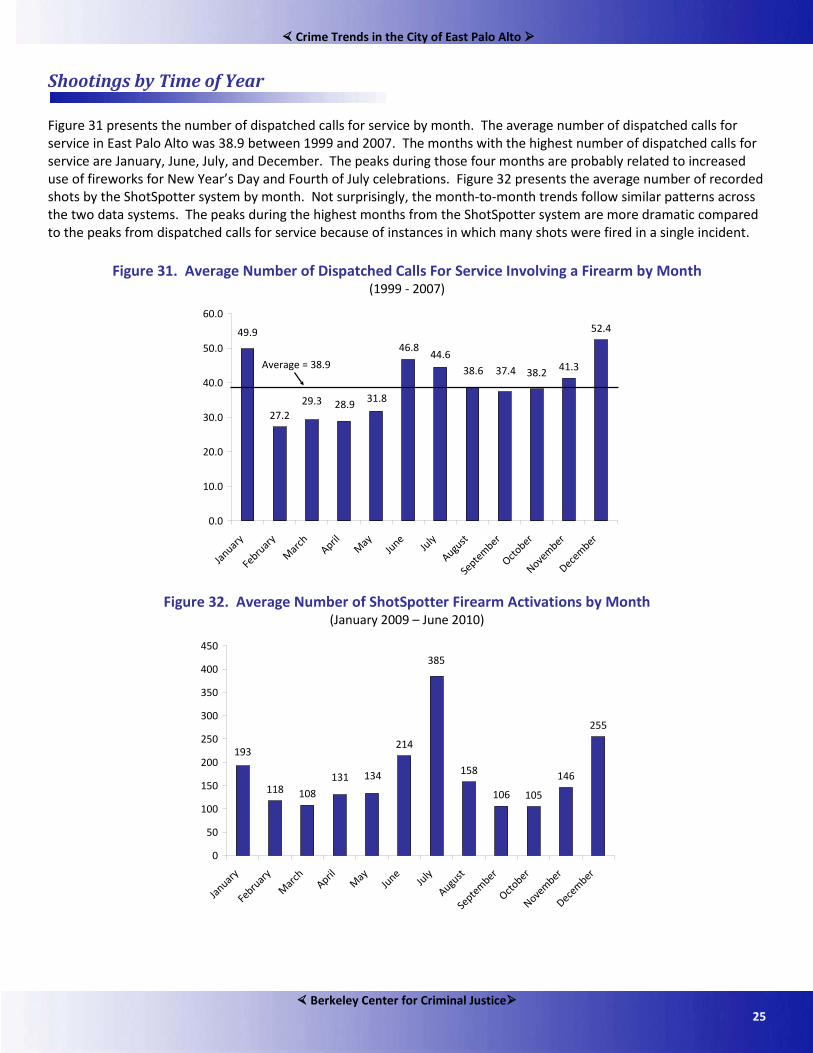
Figure 31 presents the number of dispatched calls for service by month. The average number of dispatched calls for service in East Palo Alto was 38.9 between 1999 and 2007. The months with the highest number of dispatched calls for service are January, June, July, and December. The peaks during those four months are probably related to increased use of fireworks for New Year’s Day and Fourth of July celebrations. Figure 32 presents the average number of recorded shots by the ShotSpotter system by month. Not surprisingly, the month-to-month trends follow similar patterns across the two data systems. The peaks during the highest months from the ShotSpotter system are more dramatic compared to the peaks from dispatched calls for service because of instances in which many shots were fired in a single incident.
Figure 31. Average Number of Dispatched Calls For Service Involving a Firearm by Month (1999 - 2007)
Figure 32. Average Number of ShotSpotter Firearm Activations by Month
(January 2009 – June 2010)
27.2
41.3
52.449.9
29.3 28.9 31.8
46.844.6
38.6 37.4 38.2
0.0
10.0
20.0
30.0
40.0
50.0
60.0
January
Febru
ary
March April
May
June
July
August
Septe
mber
October
November
December
Average = 38.9
118 108
214
158
106 105
146
255
134
193
385
131
0
50
100
150
200
250
300
350
400
450
January
Febru
ary
March April
May
June
July
August
Septe
mber
October
November
December
Crime Trends in the City of East Palo Alto
Berkeley Center for Criminal Justice 26
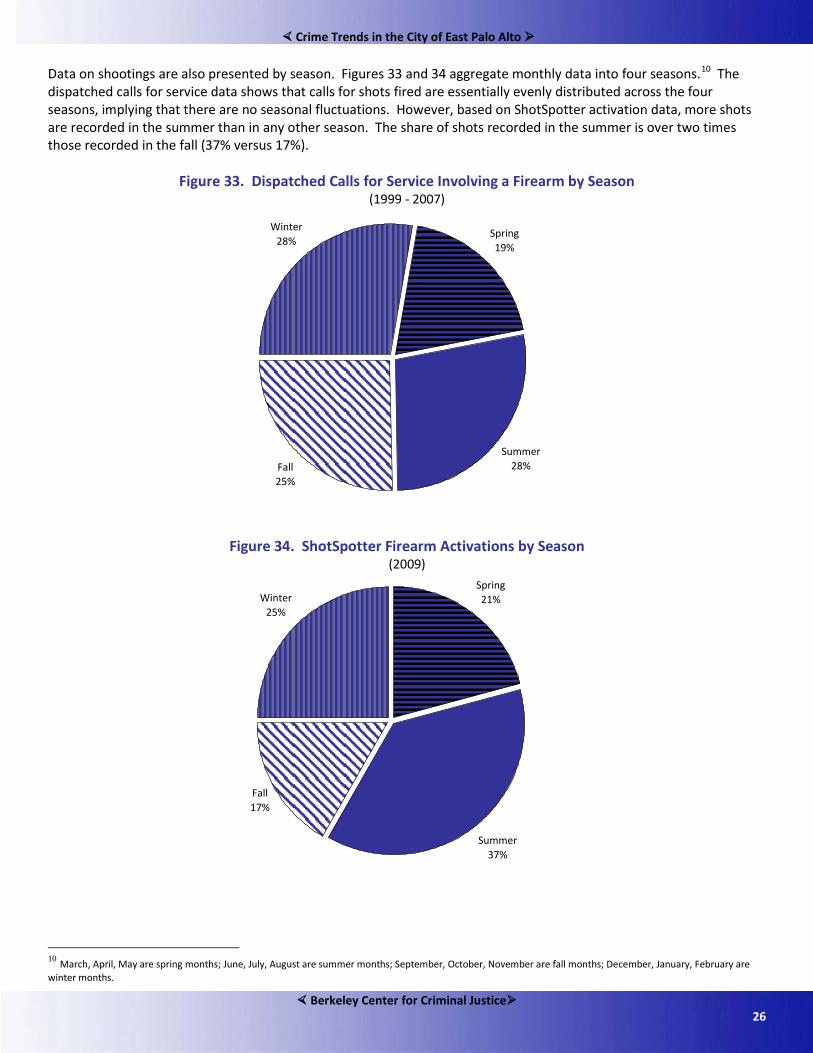
Data on shootings are also presented by season. Figures 33 and 34 aggregate monthly data into four seasons.10
The dispatched calls for service data shows that calls for shots fired are essentially evenly distributed across the four seasons, implying that there are no seasonal fluctuations. However, based on ShotSpotter activation data, more shots are recorded in the summer than in any other season. The share of shots recorded in the summer is over two times those recorded in the fall (37% versus 17%).
Figure 33. Dispatched Calls for Service Involving a Firearm by Season (1999 - 2007)
Figure 34. ShotSpotter Firearm Activations by Season (2009)
10 March, April, May are spring months; June, July, August are summer months; September, October, November are fall months; December, January, February are winter months.
Spring19%
Summer28%Fall
25%
Winter28%
Winter25%
Spring21%
Summer37%
Fall17%
Crime Trends in the City of East Palo Alto
Berkeley Center for Criminal Justice 27
Shootings by Day of the Week
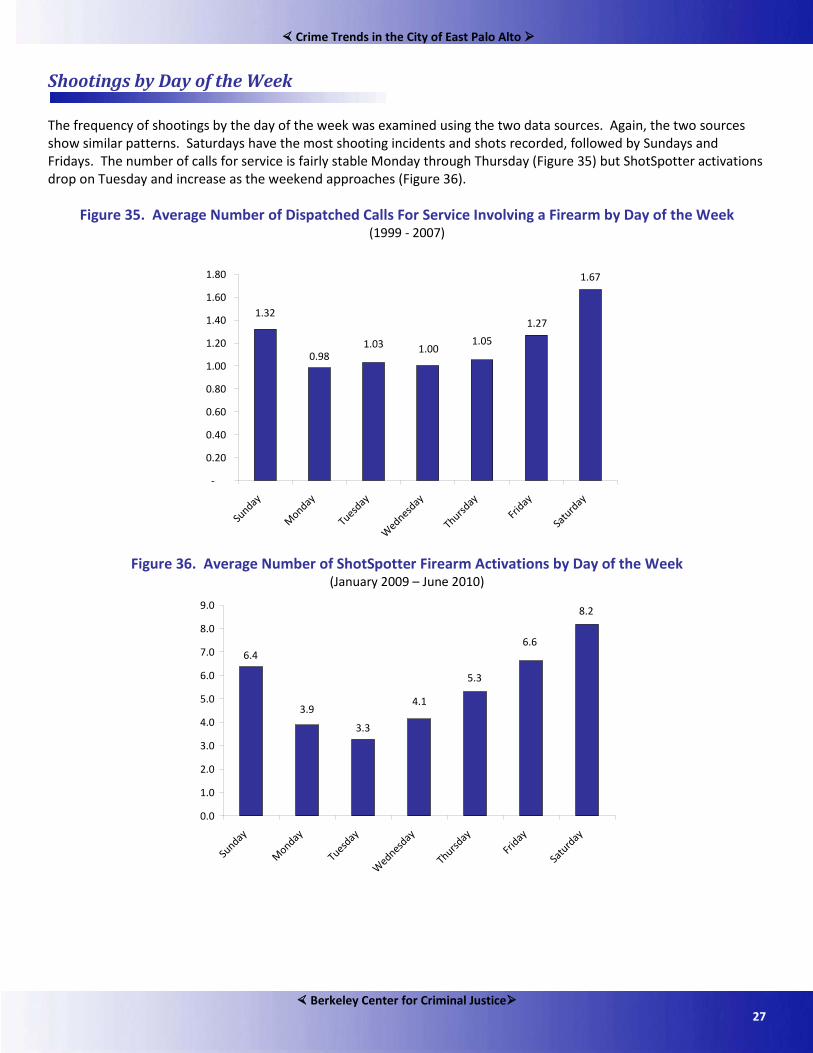
The frequency of shootings by the day of the week was examined using the two data sources. Again, the two sources show similar patterns. Saturdays have the most shooting incidents and shots recorded, followed by Sundays and Fridays. The number of calls for service is fairly stable Monday through Thursday (Figure 35) but ShotSpotter activations drop on Tuesday and increase as the weekend approaches (Figure 36).
Figure 35. Average Number of Dispatched Calls For Service Involving a Firearm by Day of the Week (1999 - 2007)
Figure 36. Average Number of ShotSpotter Firearm Activations by Day of the Week
(January 2009 – June 2010)
0.98
1.67
1.27
1.051.001.03
1.32
-
0.20
0.40
0.60
0.80
1.00
1.20
1.40
1.60
1.80
Sunday
Monday
Tuesday
Wednesd
ay
Thursday
Friday
Satu
rday
3.3
3.9
6.6
5.3
6.4
8.2
4.1
0.0
1.0
2.0
3.0
4.0
5.0
6.0
7.0
8.0
9.0
Sunday
Monday
Tuesday
Wednesd
ay
Thursday
Friday
Satu
rday

Crime Trends in the City of East Palo Alto
Berkeley Center for Criminal Justice 28
Shootings by Time of Day
The dispatched calls for service by time of day are presented below. As shown in Figure 37, the number of calls for service for gunshots is relatively low between 4:00 am and 7:00 pm and increase significantly after 7:00 pm. The two hour period with the highest number of calls for service for gunshots is between 9:00 pm and 11:00 pm. After 1:00 am the number of calls drops significantly. The pie chart (Figure 38) illustrates how dispatched calls for service for gunshots are concentrated during a few hours of the day. Fifty-seven percent of dispatched calls are received during the six-hour period of 6:00 pm and midnight, while only 16% of calls are received during the 12-hour period 6:00 am to 6:00 pm.
Figure 37. Number of Dispatched Calls For Service Involving a Firearm by Hour (1999 - 2007)
Figure 38. Dispatched Calls For Service Involving a Firearm by Time of Day (1999 - 2007)
255
39 46 58 5075 70
88105
161
268
395
553
490536
42332723
42
97138
195
412
0
100
200
300
400
500
600
12:00 - 1:00 am
1:00 - 2:00 am
2:00 - 3:00 am
3:00 - 4:00 am
4:00 - 5:00 am
5:00 - 6:00 am
6:00 - 7:00 am
7:00 - 8:00 am
8:00 - 9:00 am
9:00 - 10:00 am
10:00 - 11:00 am
11:00 am - 1
2:00 pm
12:00 - 1:00 pm
1:00 - 2:00 pm
2:00 - 3:00 pm
3:00 - 4:00 pm
4:00 - 5:00 pm
5:00 - 6:00 pm
6:00 - 7:00 pm
7:00 - 8:00 pm
8:00 - 9:00 pm
9:00 - 10:00 pm
10:00 - 11:00 pm
11:00 pm - 1
2:00 am
6:00 pm to Midnight
57%
Noon to 6:00 pm11%
6:00 am to Noon5%
Midnight to 6:00 am27%

Crime Trends in the City of East Palo Alto
Berkeley Center for Criminal Justice 29
Homicide Victims and Known Homicide Offenders
To better understand the nature and context of homicide in East Palo Alto an analysis of the demographics and criminal histories of homicide victims and known homicide offenders was conducted. The analysis is based on a review of case files from the East Palo Alto Police Department and files from the California Law Enforcement Telecommunication System (CLETS), more commonly referred to as rap sheets.11
Age
Homicide victims are older than offenders on average. The average age of a homicide victim was 30.3 years, ranging from a low of 13 years old to a high of 68 years old. For known homicide offenders, the average age was 20.6 years at the time of the homicide with the youngest known offender from this sample being 15 years old and the oldest being 27 years old. As shown in Figure 39, the age group with the highest number of homicide victims was 18 to 24 years old. Notably, more homicide victims were in their forties compared to their thirties (15 and 13, respectively).
Figure 39. Homicide Victims by Age Group (January 1998 – June 2010, N = 79)
11
Seventy-nine homicide victims are included from January of 1998 through June of 2010 as well as 14 known offenders from January 2006 to June 2010.
1315
5
16
26
4
0
5
10
15
20
25
30
17 andunder
18 - 24 25 - 29 30 - 39 40 - 49 50 and older
Age Group
Num
ber
of V
ictim
s in
Age
Gro
up
Crime Trends in the City of East Palo Alto
Berkeley Center for Criminal Justice 30
Gender
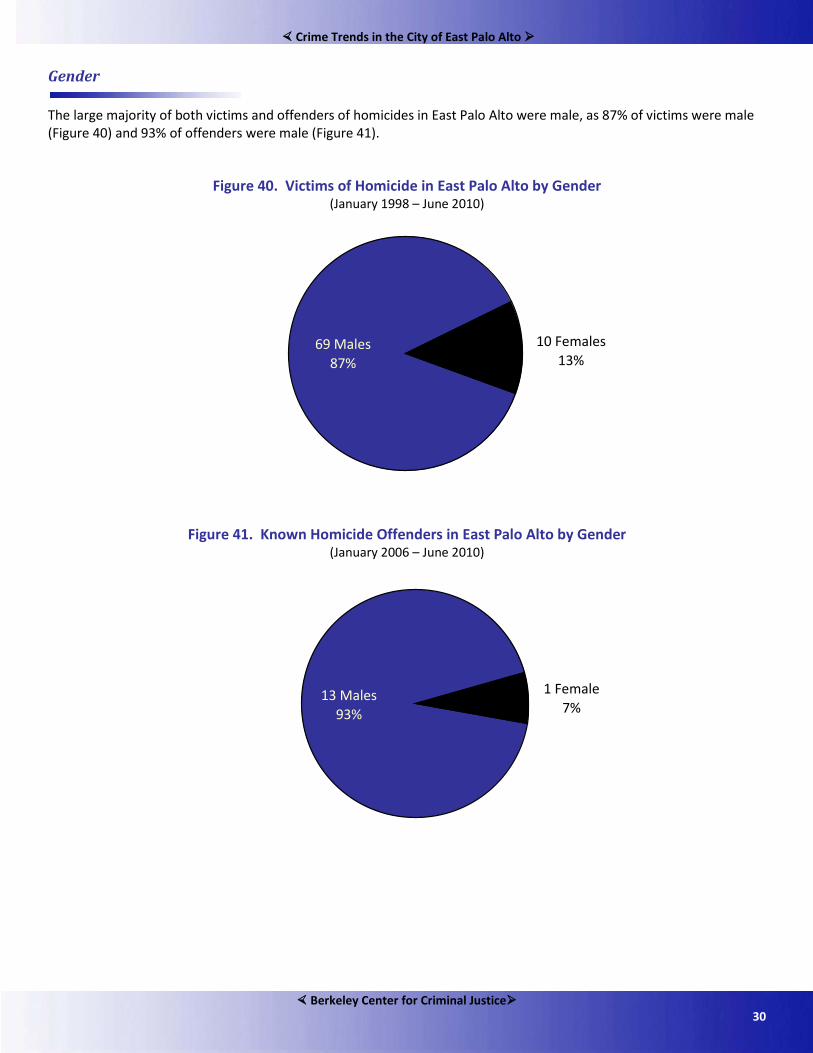
The large majority of both victims and offenders of homicides in East Palo Alto were male, as 87% of victims were male (Figure 40) and 93% of offenders were male (Figure 41).
Figure 40. Victims of Homicide in East Palo Alto by Gender (January 1998 – June 2010)
Figure 41. Known Homicide Offenders in East Palo Alto by Gender (January 2006 – June 2010)
69 Males87%
10 Females13%
1 Female7%
13 Males93%
Crime Trends in the City of East Palo Alto
Berkeley Center for Criminal Justice 31
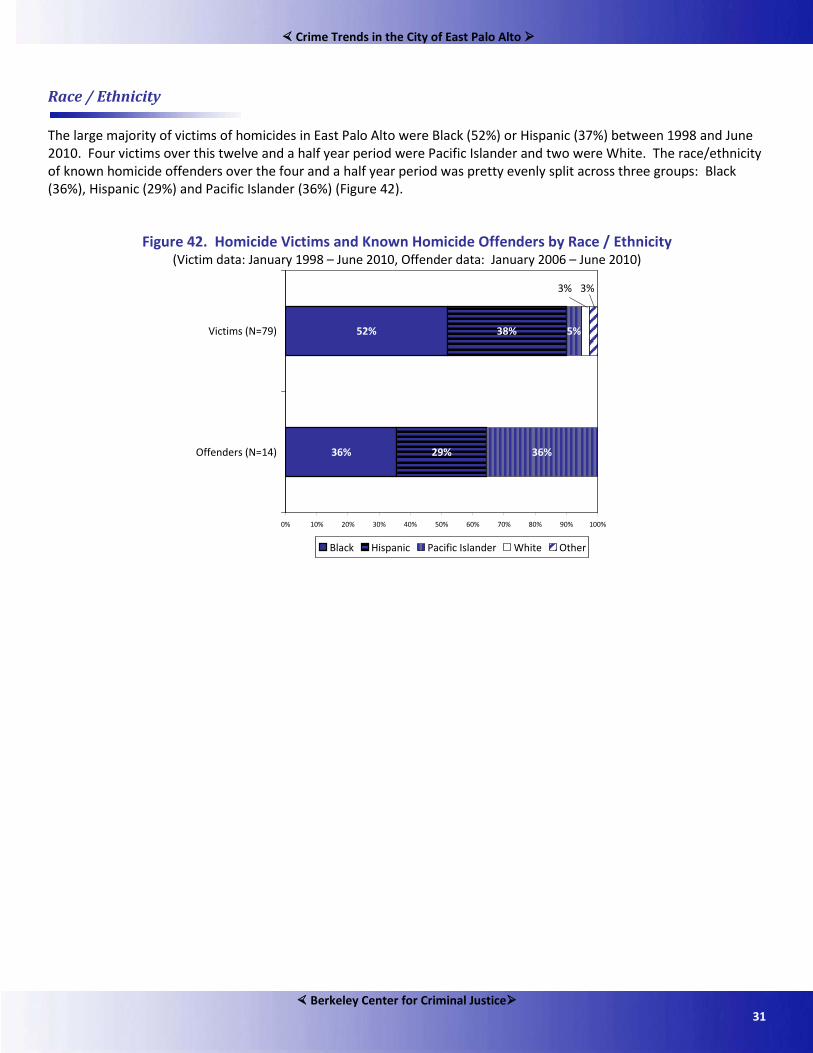
Race / Ethnicity
The large majority of victims of homicides in East Palo Alto were Black (52%) or Hispanic (37%) between 1998 and June 2010. Four victims over this twelve and a half year period were Pacific Islander and two were White. The race/ethnicity of known homicide offenders over the four and a half year period was pretty evenly split across three groups: Black (36%), Hispanic (29%) and Pacific Islander (36%) (Figure 42).
Figure 42. Homicide Victims and Known Homicide Offenders by Race / Ethnicity (Victim data: January 1998 – June 2010, Offender data: January 2006 – June 2010)
36%
52%
29%
38% 5%
36%
3% 3%
0% 10% 20% 30% 40% 50% 60% 70% 80% 90% 100%
Offenders (N=14)
Victims (N=79)
Black Hispanic Pacific Islander White Other

Crime Trends in the City of East Palo Alto
Berkeley Center for Criminal Justice 32
Prior Arrests
Eighty-one percent of homicide victims had at least one prior arrest and nineteen percent of homicide victims (15 of 79) had never been arrested. For those victims that had an arrest record, on average, they had a higher number of prior arrests than known homicide offenders. Victims with an arrest record on average had 8.5 arrests, and known offenders on average had 7.0 arrests (Figure 43).12
The highest number of arrests for a victim was 36 and the highest number of arrests for an offender was 17. Both homicide victims and known offenders have many types of arrests. In other words, they did not “specialize” in certain crime types. Seventy percent of victims had an arrest related to violence, 73% for drugs, 53% for property, and 53% for disorderly offenses (Figure 44).
Figure 43. Average Number of Arrests for Homicide Victims and Known Offenders (Victim data: January 1998 – June 2010, Offender data: January 2006 – June 2010)
Figure 44. Percent of Homicide Victims and Known Offenders by Type of Arrest
(Victim data: January 1998 – June 2010, Offender data: January 2006 – June 2010)
12 When the two victims with the highest number of arrests (35 and 36) are taken out, the average number of arrests drops to 7.6 making the victims and offender groups more comparable.
7.06.9
8.5
0.0
1.0
2.0
3.0
4.0
5.0
6.0
7.0
8.0
9.0
10.0
All Victims Only Victims with ArrestRecords
Known Offenders
Ave
rage
Num
ber
of A
rres
ts
28%
53%53%
73%70%
36%
50%
64%
43%
100%
0%
10%
20%
30%
40%
50%
60%
70%
80%
90%
100%
ViolentArrests
Drug Arrests PropertyArrests
DisorderlyArrests
Other Arrests
Victims Offenders

Crime Trends in the City of East Palo Alto
Berkeley Center for Criminal Justice 33
Criminal Histories of Homicide Victims and Known Offenders
(Victim data: January 1998 – June 2010, Offender data: January 2006 – June 2010)
Extent of Prior Criminal Justice Involvement
To understand the extent of prior criminal justice involvement of both victims and known offenders the rates of prior probation, prior incarceration, and prior felony conviction were examined.13
Known homicide offenders had extensive involvement with the criminal justice system, as did victims although to a lesser extent. The percent that had previously been on probation were comparable between homicide victims and known offenders: 59% and 64%. The disparities are larger for prior prison or jail terms (42% for victims and 71% for offenders) and prior felony convictions (41% for victims and 86% for offenders) (Figure 45).
Figure 45. Percent of Homicide Victims and Offenders with Prior Criminal Justice Involvement (Victim data: January 1998 – June 2010, Offender data: January 2006 – June 2010)
13
For the purpose of this report incarceration meant that they were sentenced to jail or prison for 90 days or more.
Victims Known Offenders
Average age = 30.3 years Average age = 20.6 years
81% of victims had at least one prior arrest 100% of known offenders had at least one prior arrest
Average number of arrests Known offenders average 7.0 prior arrests- 6.9 arrests for all victims- 8.5 arrests for victims with at least one prior arrest
Of 64 victims with at least one prior arrest Of 14 known offenders - 70% at least one violent arrest - 100% at least one violent arrest - 73% at least one drug arrest - 43% at least one drug arrest - 53% at least one property arrest - 64% at least one property arrest - 53% at least one disorderly arrest - 50% at least one disorderly arrest - 28% at least one "other" arrest - 36% at least one "other" arrest
59%
42% 41%
64%
71%
86%
0%
10%
20%
30%
40%
50%
60%
70%
80%
90%
Prior Probation Prior Jail / Prison Prior Felony Convction
Victims Offenders

Crime Trends in the City of East Palo Alto
Berkeley Center for Criminal Justice 34
Conclusion
East Palo Alto has seen significant population growth over the last few decades, more than the State overall in percentage terms. East Palo Alto has also seen significant improvements in public safety, as the crime rate has decreased in all major categories of crime since the mid 1980’s. Again, the change was larger than the State overall in percentage terms with the State’s total crime rate decreasing by 49% compared to 62% for the City between 1986 and 2008. Although the reduction in crime has been considerable, the level of violent crime in East Palo Alto remains very high, as East Palo Alto ranks in the top ten among California cities in three of the four categories of violent crime (aggravated assault, homicide, and rape). Shootings are a fairly common occurrence in the City with more than one shooting incident per day being reported to the police on average. A review of homicide cases since the late 1990’s reveals that the profiles of homicide victims and known homicide offenders are not dramatically different. Both groups have considerable arrest records; both groups have been arrested for a wide range of offense types; and both groups are well-known to the criminal justice system with high rates of prior convictions and prior periods of incarceration. One area in which there appears to be a notable difference is age, as homicide victims are approximately 10 years older than known homicide offenders on average. Despite high levels of violence, resources for the East Palo Alto Police Department appear to be lower than other police departments. A look at sworn police officers per capita shows that EPA PD is significantly lower in officers per capita compared to other cities in California with similar violent crime rates and other similarly sized cities in California. The data presented in this report were compiled to inform and educate City leaders, community groups, and the residents of East Palo Alto about crime in the City using a comprehensive approach. While much has been accomplished over the last few decades, serious problems and challenges remain. The hope is that the findings presented here will help the City of East Palo Alto make more-informed decisions, more effectively target resources, and become a safer and more secure community going forward.

Crime Trends in the City of East Palo Alto
Berkeley Center for Criminal Justice 35
Appendix: Raw Data for Tables and Charts
Population and Total Crime Rates
YearEPA
PopulationCA
Population
EPA Total Crime Rate
CA Total Crime Rate
1986 19,181 27,102,237 922.3 673.21987 19,101 27,777,158 914.6 647.81988 19,227 28,464,249 1039.2 654.91989 19,462 29,218,164 952.1 670.61990 23,451 29,950,111 603.8 652.91991 23,939 30,414,114 700.5 670.11992 24,322 30,875,920 724.9 667.51993 24,210 31,147,208 684.8 646.31994 24,380 31,317,179 722.7 617.11995 25,975 31,493,525 483.2 570.91996 26,212 31,780,829 534.5 521.51997 26,532 32,217,708 557.1 486.91998 25,158 32,682,794 533.8 433.81999 25,244 33,145,121 448.8 380.42000 29,506 33,998,767 436.9 371.92001 30,054 34,507,030 413.9 390.02002 30,590 34,916,495 392.3 396.02003 32,042 35,307,398 459.1 400.42004 32,283 35,629,666 472.4 398.72005 32,255 35,885,415 481.8 385.92006 32,532 36,121,296 420.8 373.82007 33,210 36,377,534 285.8 357.32008 33,513 36,756,666 354.8 344.4

Crime Trends in the City of East Palo Alto
Berkeley Center for Criminal Justice 36
Property Crime Rates
Year
EPA Property
Crime Total Rate
CA Property
Crime Total Rate
EPA Burglary
Total Rate
CA Burglary
Total Rate
EPA Auto Theft Rate
CA Auto Theft Rate
EPA Larceny-
Theft Total Rate
CA Larceny-Theft Total
Rate1986 672.0 581.5 261.7 168.9 112.6 75.9 297.7 336.81987 613.6 556.4 225.1 151.1 117.8 82.6 270.7 322.61988 798.4 563.1 211.2 142.8 230.9 93.3 356.3 327.11989 644.3 573.7 176.2 140.0 211.2 101.9 256.9 331.91990 401.7 549.6 102.8 132.9 136.0 100.4 162.9 316.31991 487.1 562.2 143.7 138.0 167.9 102.9 175.4 321.21992 446.1 555.6 119.6 138.4 166.9 103.6 159.5 313.51993 433.3 538.4 151.6 132.8 121.4 102.5 160.3 303.11994 448.7 515.7 113.6 122.1 53.3 98.1 281.8 295.61995 358.0 476.8 96.6 109.9 51.2 86.6 210.2 280.41996 401.3 435.1 104.9 98.1 90.0 76.2 206.4 260.81997 421.0 407.0 98.4 92.8 98.7 70.9 223.9 243.31998 379.6 363.5 139.1 82.3 97.0 59.8 143.5 221.41999 309.4 317.6 85.2 67.5 61.4 50.8 162.8 199.32000 339.6 310.0 121.7 65.4 72.9 53.0 145.1 191.72001 310.4 328.3 138.8 67.3 65.2 58.9 106.5 202.12002 304.7 336.4 77.1 68.1 66.4 63.6 161.2 204.72003 361.7 342.4 105.8 68.2 68.7 68.2 187.3 206.02004 372.3 343.3 90.8 68.7 110.0 70.7 171.6 203.92005 348.8 333.1 120.0 69.5 94.9 71.6 133.9 191.92006 330.8 320.0 105.1 68.2 102.7 67.2 123.0 184.62007 207.2 304.8 79.2 65.2 67.1 60.3 60.8 179.32008 245.0 294.0 82.4 64.7 99.4 52.4 63.3 177.0

Crime Trends in the City of East Palo Alto
Berkeley Center for Criminal Justice 37
Violent Crime Rates
Year
EPA Violent Crime Rate
CA Violent Crime Rate
EPA Homicide
Rate
CA Homicide
Rate
EPA Rape Rate
CA Rape Rate
EPA Robbery
Rate
CA Robbery
Rate
EPA Aggravated
Assaults Rate
CA Aggravated
Assaults Rate
1986 250.2 91.6 3.6 1.1 9.9 4.5 68.3 34.1 168.4 51.91987 301.0 91.4 2.1 1.1 14.1 4.4 75.4 30.0 209.4 56.01988 240.8 91.8 9.9 1.0 16.1 4.1 73.3 30.2 141.5 56.41989 307.8 96.9 9.8 1.1 11.8 4.1 84.8 32.9 201.4 58.91990 202.1 103.3 9.4 1.2 3.8 4.2 82.3 37.2 106.6 60.71991 213.5 107.9 8.4 1.3 4.2 4.2 78.5 40.7 122.4 61.81992 278.8 111.9 17.3 1.3 5.8 4.1 114.7 42.4 142.3 64.11993 251.5 107.9 1.7 1.3 4.5 3.8 80.1 40.6 165.2 62.31994 274.0 101.4 2.9 1.2 5.7 3.5 77.9 35.7 187.4 61.01995 125.1 94.1 2.3 1.1 5.0 3.2 60.1 31.9 57.7 57.91996 133.1 86.4 0.4 0.9 4.6 3.2 67.1 29.6 61.0 52.71997 136.1 79.9 6.0 0.8 4.9 3.2 53.1 25.3 72.0 50.71998 154.2 70.3 2.8 0.7 5.6 3.0 26.2 21.0 119.6 45.61999 139.4 62.7 0.4 0.6 15.8 2.8 24.2 18.1 99.0 41.22000 97.3 61.9 2.0 0.6 8.5 2.9 33.6 17.7 53.2 40.72001 103.5 61.7 2.0 0.6 6.3 2.9 43.9 18.7 51.2 39.42002 87.6 59.6 2.3 0.7 5.2 2.9 43.2 18.6 36.9 37.42003 97.4 57.9 2.8 0.7 5.9 2.8 30.3 18.0 58.4 36.42004 100.1 55.4 2.2 0.7 7.1 2.7 32.2 17.3 58.5 34.82005 133.0 52.8 4.7 0.7 6.5 2.6 33.5 17.7 88.4 31.92006 90.1 53.7 1.8 0.7 6.8 2.6 37.2 19.6 44.3 30.92007 78.6 52.5 2.1 0.6 6.0 2.5 19.9 19.4 50.6 30.02008 109.8 50.4 1.5 0.6 5.4 2.4 31.6 18.9 71.3 28.5


![[Palo Mayombe] El Libro de Palo](https://img.pdfslide.net/doc/110x75/55cf945d550346f57ba1843c/palo-mayombe-el-libro-de-palo.jpg)