Embed Size (px)
Citation preview

Eastcomtrans LLP
Annual report
for 2014 year

Content
1. Company overview • General information
• Vision, mission, and strategy
• Message from the CEO
• History of development
• Supervisory Board
• Key highlights 2014.
• Operational activity • Transport network of Kazakhstan
• Types of cars
• Railway freight industry and trends
• Structure of Kazakhstan rolling stock fleet
• Railway freight transportation demand in Kazakhstan
3. Financial activity • Financial and economic indicators
• Analysis of financial and economic activity
4. Risk factors
5. Social activity
6. Corporate Governance • Corporate governance
• Organizational structure
7. Financial statements
8. Additional information
2

General information
► Company was founded in 2002 as Limited Liability Partnership
► Structure of Ownership:
− Mr. Marat Sarsenov – 55,998%;
− Steinhardt Holding N.V. – 37,332%. (Netherlands)
− International Finance Corporation – 6,67% (USA)
► Company provides following types of services:
− Freight forwarding services;
− Leasing of private car fleet;
− Technical maintenance of the rolling stock;
− Tank wagon cleaning;
− Transshipment services at Aktau sea port;
− Multimodal forwarding;
− Leasing of wagons.
► As of 31, December 2014 own rail fleet made up to 12 035 wagons.
► Total capital investments for the 2002-2014 exceeded $720 ml.
► Total staff of 153 employees, including 50 administrative and managerial staff, and 103 – maintenance personnel.
► Head office is located in Almaty. Representative offices are located in Karaganda, Pavlodar, Atyrau, Shymkent, st. Zashita and Dostyk and branches in Astana and Aktau.
General information
3 3

Vision:
Eastcomtrans LLP is a leading private operator of railcars in Kazakhstan,
strong player on international cargo shipment market. Company provides full
range of high-quality transportation and logistics services due to its own
transport infrastructure, high professionalism of personnel and advanced
control management system. Final goal of management is to create largest,
regional, vertically integrated holding entity in Central Asia region.
Company overview
Mission:
Mission of Eastcomtrans LLP reflects its infrastructural purpose, which is to
provide clients with competitive, high-quality and modern transportation
services of industrial goods, thereby contributing to economic and
transportation development of the country.
Strategy:
To increase Company‟s added value by 2018 due to business diversification
and growth of economic efficiency.
Membership in associations:
Eastcomtrans LLP is a member of the Association of National Freight
Forwarders of Kazakhstan, Kazakhstan Association of Operators of carriers and
Railcars, and an individual member of the International Federation of Freight
Forwarders Associations (FIATA).
4

«Teamwork will empower us to achieve even more success!»
Message from CEO
5

We are pleased to welcome you on behalf of Eastcomtrans LLP, the biggest railcar operator on the transport market in the
Republic of Kazakhstan.
Our Company has been active in transport market for more than 12 years. Nowadays, Eastcomtrans is one of the most
acknowledged leaders on Kazakh transport market, providing full range of rail transportation services. The modern fleet
allows us to provide maximum effective services to our clients. Quality of our services has been recognized by large
Kazakh and global entities, since our Company‟s objective has been and always will be building solid reliable relationship
with our clients. Thanks to that, our Company regularly increases its shipment volumes and renews its car fleet.
We are certain that our teamwork will empower us to achieve even more success!
6
Message from CEO

History of development 2002- 2004
Establishment of the
Company
2005-2007
Growth of railcar fleet and
diversification of
operational activity
2009
Growth of railcar fleet Growth of railcar fleet.
Receipt of credit rating
2008
Diversification of financial
partners and business
processes‟ optimization
2011-2012
Switching to international
finance resources. Growth
of fleet. Improvement of
ratings.
• A group of private
investors founded
Eastcomtrans LLP.
• The Company signed a
loan agreement with
"BTA Bank“ for 10-
years credit facility.
• Signed the very first
contract on railcar lease
with Tengizchevroil.
• Signed first contract with
"Azovmash“ and
“Uralvagonzavod“.
Purchased first lot of
500 oil tanker cars.
• The period of an intense
operational portfolio
diversification. Signed
lease and forwarding
contracts with CNPC,
Turgay Petroleum,
Matin, Karakudukmunai,
KuatAmlon, etc.
• Within 3 years Company
increased its fleet size up
to 1700 cars.
• Financial statements
were transferred to IFRS.
• Financial audit was
provided by PWC.
• During the World
financial crisis period,
the Company makes
emphasis on the local
development institutes,
signing three lease
agreements with KDB-
Leasing.
• As of December 31,
2009 the Company's
railcar fleet amounted to
2822 units.
• For the very first time
signed a 3-year contract
with TCO.
• Total fleet size achieved
2 822 cars by the end of
2009.
• The Company becomes
an individual member of
FIATA (International
Federation of Freight
Forwarders
Associations).
• Signed a 7-year contract
with «Zhaykmunai" on
oil and gas tanker cars‟
lease in Chinarevskoe
oil field.
• Fitch Ratings assigned
the Company term
issuer default rating at
«B-» on international
scale. Outlook is
“Stable".
• 2010 was the year of the
largest car fleet growth
after 3,076 cars were
purchased. The total
fleet of cars reached
5901 units.
• In accordance with the
auditor rotation policy,
in 2010 the Company
switched to Deloitte in
audit of financial
indicators.
• The partnership with
Raiffeisen-Leasing
Kazakhstan was started.
• Successfully completed
ISO audit.
• Started an intense
diversification of the loan
portfolio.
• Signed a $25 ml. loan
agreement with «HSBC
Kazakhstan.“ to
refinance part of the debt
to BTA.
• Signed $100 ml.
Tranche-A syndicate
facility with BNP
Paribas. Loan was used
to fully refinance BTA
loan and to purchase
new cars.
• The company started to
diversify types of
transportation services,
focusing on the mining
sector.
• Fleet amount increased
to 9782 units.
• Fitch Ratings upgraded
the corporate rating from
«B-» to «B / Stable» - on
the international scale.
• Contracts with TCO
resigned for the new 4-
year term and transited
into U.S. dollars.
• Eastcomtrans had
become the largest
operator for TCO.
Увеличение парка
вагонов и улучшение
кредитного рейтинга
• IFC had become the new
shareholder for ECT
with 6.67% stake in
equity.
• The Company has
successfully completed a
debut 5-year $100ml.
Eurobonds emission on
the London Stock
Exchange at 7.75%
coupon yield.
• 1402 wagons were
purchased. The total
fleet size had achieved
11,184 units.
• The second rating from
Moody's Investor
Service at "B3“/Stable
was assigned.
• Signed the contract for
the financial statements
audit with KPMG.
Увеличение парка
вагонов и улучшение
кредитного рейтинга
• In 2014, Gazprombank
provided a 9-year loan
of $ 50 million, which
were used to purchase
853 cars.
• Moody's Investor
Services raised its
forecast for all of the
company's ratings from
"stable" to "positive."
Увеличение парка
вагонов и улучшение
кредитного рейтинга
Growth of fleet.
International projects
implementation. Status of
international corporate.
Growth of fleet and ratings
2010 2013 2014
7

Supervisory Board
8
Vadim Malakhov
Head of Supervisory Board
Head of Supervisory Board since June
2015. Mr. Malakhov graduated from
Kazakh Polytechnic Institute in 1982,
majoring in geochemistry.
From 1996 to 1998 he was a Head of the
company responsible for the quality –
“BEST” LLP. From 2002 till 2015 Mr.
Malakhov has been the General Director
of “Eastcomtrans“ LLP.
Ekaterina Benjamin
Independent Director
of Supervisory Board
was appointed as an Independent
member of the Supervisory Board in
December 2014. Mrs. E. Benjamin has
an extensive experience in financial
institutions such as Citibank
Kazakhstan, Bank Petrocommerce,
Kazinvestbank, HSBC Bank
Kazakhstan, Altyn Bank; From 2005 till
2011, Mrs. Benjamin has been an
Independent Director at Visor Capital,
"Kazakhmys“ Pension fund,
Altaypolimetal.
Yuri Lavrinenko
Independent Director
of Supervisory Board
was appointed as an Independent
member of the Supervisory Board in
2013. Mr. Lavrynenko holds a Ph.D. in
economics. Since 2010, Mr. Lavrynenko
served as Advisory to KTZ President.
Mr. Lavrinenko was the General
Director of
«KamkorRepairCorporation» from 2007
to 2008, Managing Director of the
branch of KTZ from 2006 to 2007, the
First Deputy Minister of Transport and
Communications of the Republic of
Kazakhstan from 2002 to 2006 and
Deputy Speaker of Majilis of
Kazakhstan from 1999 to 2002.
Mikhail Kuznetsov
Independent Director
of Supervisory Board
was appointed as an independent
member of the Supervisory Board in
May 2015. Mr. Kuznetsov (Ph.D.) and
holds a «Chartered Director" of the
British Institute of Directors cum
Executive MBA IE Business school
(Madrid). Mr. Kuznetsov held senior
positions in companies "Aviacor",
"LUKOIL-Volga", "Promsvyaz" and
"The International Finance Corporation»
(IFC). Currently, Mr. Kuznetsov is an
Independent director on the Board of
Directors of "Energosetproject“JSC, of
"Echo" (Roscosmos), "Credit Bank of
Moscow" JSC. He is also the CEO and
managing partner of Corporate
Development Center, and the executive
director of the Association of Corporate
Directors.

Key highlights in 2014
On February 11, 2014 the National Bank of Kazakhstan has devalued tenge by 18.9 percent. Tenge exchange rate increased from
155 to 185 per dollar.
Country Conditions:
Gross revenue in 2014 has grown to USD 174 923 ml.
EBITDA achieved USD 130 883 ml. in 2014
EBITDA margin comprised 75% in 2014
Financial highlights:
GazPromBank: Company disbursed a 9-year loan from GazPromBank JSC in the amount of $50 million with interest rate of
margin 6,5% + 1m LIBOR, tenor 7+2years.
Al Hilal provided 5-year loan in the amount of $34,5 million with interest rate 6,5 in USD and 8,25 in KZT. The received funds
were used to fully refinance of loan with HSBC Bank Kazakhstan.
EBRD: Company signed Term Sheet with EBRD in the amount of $140 million.
Borrowings:
Corporate rating: Fitch: June 03,2014 Fitch Ratings re-confirmed the corporate Eastcomtrans LLP long-term issuer rating at the level B on the
international scale. National scale rating was also increased from B + to BB, with a rating outlook "stable.“
Moody’s: July 10, 2014 Moody's Investors Service has changed to “Positive” from “Stable” the outlook on Eastcomtrans LLP's
B3 corporate family rating (CFR), B3-PD probability of default rating (PDR), B3.kz national scale rating (NSR) and the B3 senior
secured rating assigned to the company's $100 million five-year notes, with a loss given default (LGD) assessment of LGD3/49%.
Concurrently, Moody's has affirmed these ratings.
Acquisition of rolling stock : In 2014 the Company signed contracts for the purchase of 853 wagons, including:
200 Hoppers;
400 Covered wagons;
153 Open top;
100 Dump cars.
Supervisory Board 1. Mr. Vadim Malakhov – Head of Supervisory Board
2. Mrs. Ekaterina Benjamin – Independent Director of Supervisory Board
3. Mr Yuri Lavrinenko – Independent Director of Supervisory Board
4. Mr. Mikhail Kuznetsov – Independent Director of Supervisory Board
25.12.2014 Mrs. Ekaterina Benjamin was appointed as Independent member of the Supervisory Board, succeeding Mr. Adilzhan
Kozhabergenov.
19.05.2015 Mr. Mikhail Kuznetsov was appointed as Independent member of the Supervisory Board.
01.06.2015 Mr. Vadim Malakhov was appointed as Chairman of the Supervisory Board, succeeding Mr. Marat Sarsenov.
9

Operational activity
10

Transport network of Kazakhstan
Transport sector in Kazakhstan is of a significant importance. Vast territory of 2.7
million km², low density of population, long distances between industrial and
agricultural centers, as well as remoteness from world markets, makes developed
transportation system vital for Kazakhstan.
Railway is the main mode of long distance cargo shipment in Kazakhstan. Large
area, and high level of export, import and transit of goods makes railway transport
absolutely essential element of the whole Kazakh economics.
There are 16 boarder points (11 with Russia, 2 with Uzbekistan, 1 with Kyrgyzstan,
2 with China), which connect Kazakh railway network with neighboring countries.*
Management is carried out by Kazakhstan Temir Zholy National Company JSC
(KTZ). KTZ has railway network on its the balance sheet. Part of network is
managed by railway administration of Russian Federation and Kyrgyzstan.
Rail network of Kazakhstan
11
Kazakhstan has an extensive railway network with total length of approximately 15 thousand km, 6000 of which being double track, and about 5000 being electrified. Spread
out length of main ways comes up to 18.8 thousand km; station and specialized tracks - up to 6.7 thousand km. The value of rail transport in Kazakhstan is very large. More
than 68% of total turnover and more than 57% of the country's passenger traffic accounts for the railways. Railway industry employs more than 125,000 people, which comes
up to nearly 1% of whole population of Kazakhstan.
The share of transport in GDP amounts to 7.4%. The share of rail transport in total freight traffic of the country - 8.27%. At the same time, 48% of revenue of freight traffic
and 29% of passenger traffic accounts for railway enterprises from all the revenues of transport enterprises of the state.**
Source:Internet
* Source: https://ru.wikipedia.org
**Source: Agency of statistics of the RK

• Average lifetime – 40 years
• Average capacity – 40 tons
• Average tank volume – 76
m3
• Max speed – 120 kmp/h
• Used for transportation of
liquefied petroleum gases
(LPG) and light
hydrocarbons
Types of cars
• Average lifetime – 32 years
• Average capacity – 60 tons
• Average tanker volume –
73 m3
• Max speed – 120 kmp/h
• Used for transportation of
oil and refined products
(light refined products,
viscous refined products,
petrol)
Oil tanker car (RTW) Gas tanker car (RTW) Gondolas
• Average lifetime – 22
years
• Average capacity – 74
tons
• Max speed – 100 kmp/h
• Used for transportation of
bulk cargo (ore, coal, etc.)
Technical specifications: Technical specifications: Technical specifications:
Hoppers Platforms Dumpcars
• Average lifetime – 22
years
• Average capacity – 72,5
tons
• Max speed – 120 kmp/h
• Used for transportation of
cement
Technical specifications:
• Average lifetime – 32
years
• Average capacity – 72
tons
• Max speed – 120 kmp/h
• Used for transportation of
containers
Technical specifications:
• Average lifetime – 22
years
• Average capacity – 64
tons
• Max speed – 120 kmp/h
• Used for transportation of
bulk cargo (ore, coal, etc.)
Technical specifications:
12

Freight shipment market of Kazakhstan
13
Railway freight industry and trends
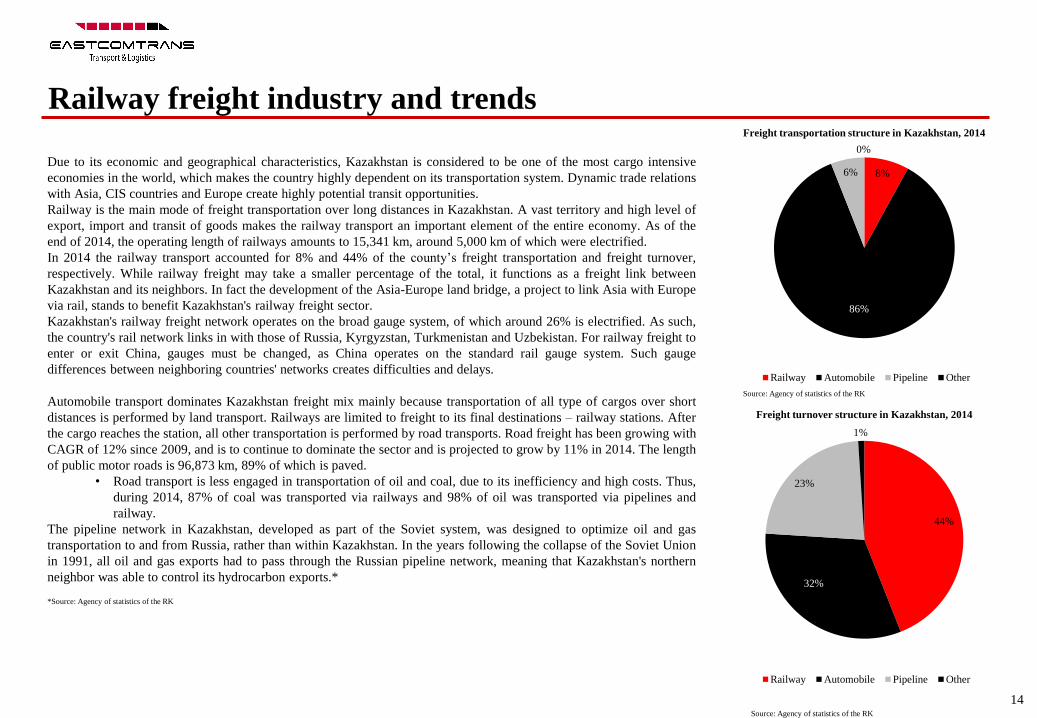
Due to its economic and geographical characteristics, Kazakhstan is considered to be one of the most cargo intensive
economies in the world, which makes the country highly dependent on its transportation system. Dynamic trade relations
with Asia, CIS countries and Europe create highly potential transit opportunities.
Railway is the main mode of freight transportation over long distances in Kazakhstan. A vast territory and high level of
export, import and transit of goods makes the railway transport an important element of the entire economy. As of the
end of 2014, the operating length of railways amounts to 15,341 km, around 5,000 km of which were electrified.
In 2014 the railway transport accounted for 8% and 44% of the county‟s freight transportation and freight turnover,
respectively. While railway freight may take a smaller percentage of the total, it functions as a freight link between
Kazakhstan and its neighbors. In fact the development of the Asia-Europe land bridge, a project to link Asia with Europe
via rail, stands to benefit Kazakhstan's railway freight sector.
Kazakhstan's railway freight network operates on the broad gauge system, of which around 26% is electrified. As such,
the country's rail network links in with those of Russia, Kyrgyzstan, Turkmenistan and Uzbekistan. For railway freight to
enter or exit China, gauges must be changed, as China operates on the standard rail gauge system. Such gauge
differences between neighboring countries' networks creates difficulties and delays.
Automobile transport dominates Kazakhstan freight mix mainly because transportation of all type of cargos over short
distances is performed by land transport. Railways are limited to freight to its final destinations – railway stations. After
the cargo reaches the station, all other transportation is performed by road transports. Road freight has been growing with
CAGR of 12% since 2009, and is to continue to dominate the sector and is projected to grow by 11% in 2014. The length
of public motor roads is 96,873 km, 89% of which is paved.
• Road transport is less engaged in transportation of oil and coal, due to its inefficiency and high costs. Thus,
during 2014, 87% of coal was transported via railways and 98% of oil was transported via pipelines and
railway.
The pipeline network in Kazakhstan, developed as part of the Soviet system, was designed to optimize oil and gas
transportation to and from Russia, rather than within Kazakhstan. In the years following the collapse of the Soviet Union
in 1991, all oil and gas exports had to pass through the Russian pipeline network, meaning that Kazakhstan's northern
neighbor was able to control its hydrocarbon exports.*
Freight transportation structure in Kazakhstan, 2014
Freight turnover structure in Kazakhstan, 2014
Source: Agency of statistics of the RK
*Source: Agency of statistics of the RK
8%
86%
6%
0%
Railway Automobile Pipeline Other
44%
32%
23%
1%
Railway Automobile Pipeline Other
14 Source: Agency of statistics of the RK

Railway freight industry and trends • With the trans-Caspian tanker and rail exports and the development of an oil pipe route to China,
Kazakhstan has slowly reduced its reliance on Russia. Nevertheless, the vast majority of exports
continue to transit via Russian territory. Gas is currently only exported to Russia, although exports to
China are being targeted for the future. Since 2009, pipeline transportation in Kazakhstan has been
growing with CAGR of 7%.
• Growing oil and gas production is driving new capacity expansion projects. Existing infrastructure is
either being rehabilitated or expanded, while new pipeline projects are underway to enable increased
exports and domestic distribution.
Sea freight is concentrated at the Caspian region and mainly associated with development of oil and gas
industry in Kazakhstan.
• The two main ports in Kazakhstan are Aktau on the Caspian Sea and Semey on the Irtish river in the
northeast of the country. As part of the Kazakhstan Caspian Transportation System (further “KCTS”)
project (discussed further in Railway freight transportation demand), Kazakhstan could expand its port
facilities, boosting capacity at Aktau and building a new port at Kuryk. Under the KCTS concept, these
two ports would also be linked by pipeline to key oil fields in western Kazakhstan. Smaller facilities at
Atyrau and Bautino are used to support offshore operations in the Caspian Sea.
Air freight transport comprises less than 1% of total freight turnover in Kazakhstan.
Transportation volumes in Kazakhstan
Freight turnover in Kazakhstan, bln ton-km
Source: Agency of statistics of the RK
Source: Agency of statistics of the RK
248 268
280 295 294 273
1688
1972
2476
2718
2983 3134
163 194 214 213 226 221
0
500
1000
1500
2000
2500
3000
3500
2009 2010 2011 2012 2013 2014
mln
to
nn
es
Railway Automobile Pipeline
198 213
224 236 231
214
66 80
121 132
145 158
72
89 101
107 116 116
0
50
100
150
200
250
2009 2010 2011 2012 2013 2014
mln
to
nn
es
Railway Automobile Pipeline
15

Structure of Kazakhstan rolling stock fleet Since the collapse of USSR, subsidiary of KTZ, Kaztemitrans JSC (further “Kaztemirtrans”), has dominated the rails freight market after inheriting more than 100,000
railcars. Due to poor economic situation in Kazakhstan in 1990‟s, under-investment into renewal of wagon fleet led to their aging and gradual write-off. The graph below
provides the comparison number of private and Kaztemirtans‟ freight cars.
Kaztemirtans‟ underinvestment is aggravated by regulation of tariffs by Antimonopoly Agency due to its dominating position in the market, and limits its ability to earn higher
profit margins compared to private sector.
After economic revival in the beginning of 2000‟s and reforms undertaken by the government in the rail sector, the number of railcars operated by private companies boosted
significantly.
The Restructuring Program of Railway Transport of the RK (the reform launched in early 2000s) was aimed to commercialize freight railways sector and allow private
companies to enter the market and bring additional investment into the industry.
Nevertheless, starting from 2005, Kaztemirtrans started renewing its wagon fleet backed up by borrowings from third parties and its parent company KTZ.
Boosting economy and deregulation of the railway sector created opportunities for the private operators due to deficit of the freight railcars. As a result major part of private
operators was established showing CAGR of 17.6% from 2002 to 2014. In 2014 the share of private operator reached almost 54% (71,351 out of 132,291 units) compared to
10% (11,300 out of 109,600 units) in 1995.*
Structure of Kazakhstan rolling stock fleet
98,3 98,3 93,1
89,9 88,1
78,5 77,6 77 70,4
60,8 56,8 56,9
61,5 59,8 60,6
53,1 55,9
66,5 65,8 60,9
11,3 11,3 12,2 10,1 12,6 11,3 8,5 10,7
18,4
26,7 30,1
33,6 34,7 35,2 39,6 43,3
51,9
62,2 63,5
71,3
0
20
40
60
80
100
120
1995 1996 1997 1998 1999 2000 2001 2002 2003 2004 2005 2006 2007 2008 2009 2010 2011 2012 2013 2014
Kaztemirtrans (inventory) freight cars Private companies' freight cars
16
Source: Agency of statistics of the RK
*Source: Agency of statistics of the RK

Railway freight transportation demand in Kazakhstan
For the period 2009-2014 on average 59% of freight transported by railway is represented by coal, metals and metal ores,
and 12% was represented by construction cargo. Gondolas are the key means of transportation for coal, ores and construction
materials. The share of oil and oil products in railway transportation is around 12%.
Coal
Coal transportation comprises 43% of total volume of railway freight. The largest coal-basins are Karaganda and Ekibastuz
coal fields which account for more than 30% of coal production.
•From Karaganda coal basin, the coal is transported via railway to Russia and within Kazakhstan through the Astana-Almaty
and Zharyk-Dzhezkazgan railway routes;
•From Ekibastuz, the coal is transported via routes that connect stations of Ekibastuz coal fields (route Astana-Pavlodar) and
with internal consumers such as energy generating companies and power plants.
The main importer of Kazakhstani coal is Russia accounting for about 90% of total coal exported from Kazakhstan.
43%
28%
9%
3%
16%
Cargo turnover by railways in Kazakhstan, 2014
Gandolas Tanks Boxcars Platfoms Other
Source: Agency of statistics of the RK
Source: Agency of statistics of the RK
41%
18%
12%
10%
26%
The structure of railway freight transportation by main
cargoes in Kazakhstan, 2014
Coal Ore species Construction freight
Oil and oil products Other
98 104 107 108 102
44 44 46 47 43
33 26 26 45
23
17 28 29
36
35 26
27 25
34
24
0
50
100
150
200
250
300
350
2010 2011 2012 2013 2014
Freight transportation by type of products
Coal Ore species Other Construction cargo Oil and oil products Iron Wheat Chemicals and fertilizers
17
Source: Agency of statistics of the RK

Ferrous and non-ferrous metal ores
Transportation of ore and ferrous metals comprises about 19% and 3% respectively. Iron ore is mainly exported
to Russia and China. Main consumers of iron ore are metallurgical complexes. Non-ferrous metal ore is mainly
transported via domestic routes and consists of bauxite, copper ore, copper concentrate and polymetallic ore.
For metallurgic industry, railway provides the most effective mean of transportation compared to oil and gas
sector, where pipeline transportation is more practical. Therefore, the metallurgic sector is occupied by large
industrial groups having their own transportation facilities. As a result, the sector offers limited opportunities for
third party market players providing rolling stock leasing services.
Construction cargo
Construction materials transportation, which comprises around 16% of railway freight, is mainly linked to
construction projects carried out in Kazakhstan, and is subject to seasonality, with slowdown in December-
February period
Oil and gas
Oil, oil products, LPG and sulphur are the key products transported in Western Kazakhstan as the largest oil and
gas fields are located in this area. These fields include Tengiz, Karachaganak, Kisimbai, Zhetybai, Tenge and
other.
• Around 80% of all transportation is made via pipelines and a relatively small portion of produced oil
and oil products (15%) is transported by railway.
Coal Ore and metals Oil and gas
Bogatyr Komir Kazzinc Tengizchevroil (TCO)
Kazakhmys Kazakhmys CNPC-AktobeMunaiGas
(Zhanazhol, Kenkiyak )
ENRC ENRC MangystauMunaiGas (Asar,
Zhetybai, Bekturly, other)
ArcelorMittal
Temirtau
ArcelorMittal
Temirtau
KazGerMunai (Akshabulak,
Nuraly and Aksai)
KSP Steel KazMunayGas Exploration and
Production (Uzen)
Frontier Mining Karachaganak Petroleum
Operating (Karachaganak)
Sunkar
Resources Zhaikmunai
Key goods transported by railway by companies
Railway freight transportation demand in Kazakhstan
Source: Agency of statistics of the RK
13 14 14 12 13
64 66 67
66 67
0 0 0
1 2
0
10
20
30
40
50
60
70
80
90
2010 2011 2012 2013
mlm
to
nn
es
Transportation of oil
Railway Pipelines Other
18

Gauge differences between Kazakhstan and Chinese rail network created difficulties and delays in transportation
of oil. This problem was tackled by the Dostyk JV (PetroKazakhstan), which constructed an oil terminal worth
USD 22.5 million with an annual capacity of 1.2 mln tons at Druzhba station (border with China). Test cargoes
began in mid-2000s and China began importing Kazakh crude from CNPC's AktobeMunaiGas fields and
PetroKazakhstan's Kumkol operations in 2003. The commissioning of the Kazakhstan-China oil pipeline in 2006
removed the need for rail exports to China.
Despite the inevitable restrictions of Kazakhstan's single gauge network, estimates suggest that the country has
the capacity to export 15-17 mln tons of oil by rail. However, actual volumes are believed to be much lower
(around 12-13 mln, please see adjacent graph). TCO, being the largest user of the rail network, has facilities to
load 11.3 mln tons of oil directly onto railcars at Tengiz for export via Russian and Ukrainian Black Sea ports.
Railway freight transportation demand in Kazakhstan
Kashagan 6
(Reserves –12,580 mln. barrels
in oil equivalent)
Karachaganak 4
(Reserves –6,252 mln. barrels
in oil equivalent)
Tengiz 2
(Reserves –8,060 mln. barrels
in oil equivalent)Uzen3
(Reserves –3,779 mln. barrels
in oil equivalent) Kalamkas and Zhetibay5
(Reserves –1,043 mln. barrels
in oil equivalent)
Chinarevskoye 7
(Reserves –459 mln. barrels
in oil equivalent)
Zhanazhol and Kenkiyak 8
(Reserves –1,534 mln. barrels
in oil equivalent)
Review of the key oil & gas fields in Kazakhstan by reserves 1
Notes to graphic
1.2P: Proven and probable reseves
2.Chevron, ExxonMobil, NC KMG, LUKOil
3.NC KMG
4.BG, Chevron, LUKOil, Eni, NC KMG
5.NC KMG, CNPC
6.Eni, ExxonMobil, NC KMG, Shell, Total, CNPC, INPEX
7.Zhaikmunai
8.CNPC AktobeMunaiGaz Source: Ministry of Oil and Gas of the RK, MEMR
48 49 47 46 44 42 40 38
34 35 33 36 38 41 43 43
12 12 11 11 10 9 8 9
7 13 15 15 15 15 16
0
20
40
60
80
100
120
2015F 2016F 2017F 2018F 2019F 2020F 2021F 2022F
mln
to
nn
es
Forecasted liquid production, 2015-2020
Other Tengiz Karachaganak Kashagan
19
Source: Internet

Financial Activity
20

Financial Statements: Balance Sheet (audited)
(KZT '000) 2008 2009 2010 2011 2012 2013 2014
Assets
Non-current assets
Property, plant and equipment 18 808 800 17 819 052 49 515 217 75 659 512 94 005 283 99 312 832 105 242 701
Long-term financial investments 3 722 581 4 206 585 19 281 22 464 314 109 115 163 23 997
Other non-current assets 678 469 642 088 1 636 995 4 096 312 51 527 48 263 44 798
Total non-current assets 23 209 850 22 667 725 51 171 493 79 778 288 94 370 919 99 476 258 105 311 496
Current assets
Inventories 10 082 8 012 40 866 62 278 68 478 79 185 93 774
Loans receivable 353 098 1 241 216 10 427 19 290 18 422 12 274 175 257
Trade and other receivables 2 442 109 1 388 964 2 031 584 2 166 373 3 722 031 5 138 954 6 900 135
Advance payments 137 158
- 505 347 689 647 680 621 2 989 141 1 837 775
Cash and cash equivalents 275 024 1 008 018 3 171 423 2 052 467 1 050 814 3 553 671 5 437 405
Total current assets 3 217 471 3 646 210 5 759 647 4 990 055 5 540 366 11 773 225 14 444 346
Total Assets 26 427 321 26 313 935 56 931 140 84 768 343 99 911 285 111 249 483 119 755 842
Equity and liabilities
Equity
Charter capital 840 000 840 000 840 000 840 000 840 000 3 845 400 3 845 400
Revaluation reserve on Property, plant and equipment 5 409 445 4 415 488 15 801 863 14 955 611 14 166 827 13 465 803 12 614 011
Retained earnings 3 677 771 5 018 040 8 761 111 13 584 322 19 451 800 26 809 948 28 370 829
Unpaid capital -207 460
- -
- - - -
Total Equity 9 719 756 10 273 528 25 402 974 29 379 933 34 458 627 44 121 151 44 830 240
Liabilities
Borrowings 14 191 741 13 739 679 24 365 305 47 127 311 55 459 394 56 132 752 63 576 739
Deferred income tax liabilty 1 761 886 1 747 578 5 972 022 6 751 301 7 830 051 9 445 321 9 766 550
Trade and other payables 753 938 553 150 1 190 839 1 509 798 2 163 213 1 550 259 1 582 313
Total Liabilities 16 707 565 16 040 407 31 528 166 55 388 410 65 452 658 67 128 332 74 925 602
TOTAL EQUITY AND LIABILITIES 26 427 321 26 313 935 56 931 140 84 768 343 99 911 285 111 249 483 119 755 842
21

Financial Statements: Income Statement (audited)
(KZT '000) 2008 2009 2010 2011 2012 2013 2014
Revenue 5 256 195 9 150 677 9 806 941 17 050 667 22 476 151 25 512 955 31 897 186
Cost of sales −3 017 971 −3 812 676 −2 037 302 −5 703 716 −8 766 962 −7 709 536 −10 930 694
Gross profit 2 238 224 5 338 001 7 769 639 11 346 951 13 709 189 17 803 419 20 966 492
Gross margin (%) 43% 58% 79% 67% 61% 70% 66%
General and administrative expenses −231 199 −459 984 −831 736 −979 913 −1 127 215 −1 685 002 −2 794 203
EBITDA 3 204 373 6 352 491 7 779 047 13 021 404 17 403 541 21 601 802 23 866 547
EBITDA margin (%) 61% 69% 79% 76% 77% 85% 75%
Depreciation accounting (total) −1 197 348 −1 474 474 −841 144 −2 654 366 −4 821 567 −5 483 385 −5 694 258
EBIT 2 007 025 4 878 017 6 937 903 10 367 038 12 581 974 16 118 417 18 172 289
EBIT Margin 38% 53% 71% 61% 56% 63% 57%
Finance income 504 374 474 302 879 583 101 468 611 116 57 077 35 278
Finance costs −1 518 437 −4 115 842 −2 003 072 −4 648 570 −5 380 377 −6 115 362 −14 571 996
Other Operating Expenses 681 585 70 010 −47 449 −13 674 −262 032 188 064 −91 662
Profit before income Tax 1 674 547 1 306 487 5 766 965 5 806 262 7 550 681 10 248 196 3 543 909
Income Tax 12 327 −388 978 −1 377 527 −1 178 736 −1 546 482 −2 090 022 −795 277
Net Income 1 686 874 917 509 4 389 438 4 627 526 6 004 199 8 158 174 2 748 632
Net Income margin (%) 32% 10% 45% 27% 27% 32% 9%
22

Financial Statements: Cash Flow Statement (audited)
(KZT '000) 2008 2009 2010 2011 2012 2013 2014
Cash generated from operations −687 033 5 717 844 9 182 676 13 513 891 11 625 837 14 074 136 15 534 705
Cash flows from investing activities −6 746 168 −205 847 −13 155 750 −31 058 765 −18 751 655 −14 678 684 −11 398 871
Cash flows from financing activities 6 777 660 −4 779 003 5 900 479 16 015 062 6 716 598 830 560 −3 504 753
Net change in cash and cash equivalents −655 541 732 994 1 927 405 −1 529 812 −409 220 226 012 631 082
Cash and cash equivalents at the beginning of the year 930 565 275 024 1 008 018 2 935 423 1 424 635 1 050 814 1 257 028
Cash and cash equivalents at the end of the year 275 024 1 008 018 2 935 423 1 424 635 1 050 814 1 257 028 2 155 105
23

24
Total revenue in 2014 reached 31 897 mln tenge ($174.9 mln at the exchange rate of the National Bank of Kazakhstan at the end of the year), which is higher than in 2013 by
25% in tenge and 6% in dollar terms.
Analysis of financial-economic activity
9 151 9 807 17 051 22 476 25 513 31 897
61,7 66,5
114,9
149,1 165,6
174,9
2009 2010 2011 2012 2013 2014
Revenue, mln tenge Revenue, $ mln
The dynamics of total revenue for 2009-2014.
Comparative structure of total revenues, the 2013-2014.
79% 73%
16% 23%
5% 4%
2013 2014
Rent Operating Forwarding
Summary measure of total revenues in 2014 included proceeds in the following areas:
Revenue from rent of cars amounted to 23 227 million tenge (+ 16% year-to-g, 73% of total revenue).
Revenue from operating was 7 293 million tenge (an increase of 83% from the 2013, 23% of total revenue).
Revenue from freight forwarding and transshipment of cargo amounted to 1 295 million tenge (-1% year-to-g, 4% of total revenue).

Analysis of financial-economic activity
25
Revenue from other services in 2014 amounted to 83 million tenge ($ 0.5 million, -41% year-to-r) and its share in total revenues is negligible (-0.3% in 2014 against -0.5%
in 2013).
Cost of sales in 2014 were 10 931 million tenge ($ 59.9 million), higher than the previous year by 42% in tenge and 20% in dollar.
3 813 2 037 5 704 8 767 7 710 10 931
25,7
13,8
38,4
57,0
50,0
59,9
2009 2010 2011 2012 2013 2014
COGS, mln KZT COGS, $ mln
Dynamics of production costs (COGS), 2009–2014 гг. Comparative structure of production costs, 2013–2014
70% 52%
17%
24%
4% 8%
4% 4%
5%
2013 2014Depreciation Repair
Use of railway infrastructure Payroll expenses
Wagons lease Other
Cost items Revenue (mln KZT),
2014
Revenue (mln KZT),
2013 growth rate, y-to-y Share, 2014 Share, 2013
Difference,
y-to-y
Depreciation 5 631 5 415 4% 52% 70% −18 п.п.
Repair of wagons 2 671 1 299 2,1х 24% 17% +7 п.п.
Use of railway infrastructure 906 344 2,6х 8% 4% +4 п.п.
Wagons lease 514 13 39х 5% 0,2% +~5 п.п.
Payroll expenses 415 288 1,4х 4% 4% –
Insurance of wagons 109 109 – 1% 1% –
Other 685 242 2,8х 6% 4% +2 п.п.
Total 10 931 7 710 42% 100% 100%
In 2014, the total production cost structure has undergone several changes - decreased the proportion of depreciation, increased the cost of repair of rolling stock and the cost
of renting:

Analysis of financial-economic activity
26
Total financial expenses were 14 572 million tenge ($ 79.9 million), an increase of 2.4 times in tenge and 2 times in dollar
Cost items Revenue (mln KZT),
2014
Revenue (mln KZT),
2013 growth rate, y-to-y Share, 2014 Share, 2013 Difference
Expenses on compensation 5 820 5 112 14% 40% 84% −44 п.п.
Negative exchange rate. 8 752 1 003 8,7х 60% 16% +44 п.п.
Total 14 572 6 115 2,4х 100% 100%
Made payments to reimburse interest remuneration to financial institutions (BNP Paribas, HSBC Bank Kazakhstan "ATF Bank», IFC, Eurobonds, "Gazprombank», Al Hilal
Bank) and leasing companies ("Raiffeisen Leasing", "DBK-Leasing") for the received loans and credits.
Financial income in 2014 amounted to 35 million tenge against 57 million tenge a year earlier ($ 0.19 million and $ 0.37 million respectively), the rate of decline in tenge
made up 38%.
100; 29%
75; 21%
50; 14%
32; 9%
29; 8%
27; 8%
17; 5%
16; 5% 3; 1%
Eurobonds
BNP Paribas
Gazprombank
Al Hilal Bank
EBRD
IFC
KDB Leasing
ATF Bank
Raiffaisen Leasing
The structure of the loan portfolio, the end of 2014 ($ million and the share in the total portfolio)
Long-term and current financial debt of the Company at the end of
December 2014 amounted to $ 349 million (versus $ 364 million at the
beginning of the year, -4.3% year-to-r). The loan portfolio of the company
includes the following obligations to the financial institutions:
To the short-term portion of the debt accounted for about 15% of the total
loan portfolio, the long-term - 85%. The proportion of national currency
loans was 18%, the remaining 82% are denominated in US dollars. The
weighted average rate on the loan portfolio at the end of December 2014
amounted to 7.31% per annum.
General and administrative expenses in 2014 amounted to 2 794 million tenge ($ 15.3 million), + 66% y-to-y in tenge and 40% in US dollars
The main reasons for the growth of this group of expenditures in 2014 are large payments on insurance risks and unresolved offset VAT.
Cost items Revenue (mln KZT),
2014
Revenue (mln KZT),
2013 growth rate, y-to-y Share, 2014 Share, 2013 Difference
Payroll expenses 915 920 −1% 33% 55% −22 п.п.
Insurance of risks 946 0 − 34% − +~34 п.п.
Taxes other than CIT 325 47 7х 12% 3% +9 п.п.
Office rent 123 112 9% 4% 7% −3 п.п.
Other 485 606 −20% 17% 35% −18 п.п.
Total 2 794 1 685 66% 100% 100%

Analysis of financial-economic activity
27
Net profit at the end of 2014 was 2 749 million tenge (-66% year-to-r), which is explained almost ninefold increase in foreign exchange losses (8 752 million tenge in 2014
to 1 003 million tenge a year earlier) due to the 19% depreciation of the tenge against the US dollar in February 2014. In dollar terms, net income was $ 15.1 million (-72%
year-to-year).
The Company's EBITDA in 2014 increased by 10% in tenge and amounted to 23 867 million tenge, in US dollars, this indicator decreased by 7% to $ 140.2 million in 2013
to $ 130.9 million in 2014. The EBITDA margin was 75% (-10 pp. y to-y).
Formation of EBITDA, 2014. ($ Mln)
130,9
59,9
15,3 31,2
Total revenue COGS SGA DDA EBITDA
174,9
Cash at the end of 2014 amounted to 2 155 million tenge ($ 11.8 million, + 71% y-to-y), the amount of funds on deposit grew by 43% and reached 3 282 million tenge ($
18.0 million). Thus, the total amount of Company‟s Cash for the year amounted to ~ $ 29.8 million.
Capital expenses in 2014 were 10 184 million tenge ($ 57 million, -18%), which mainly focused on the purchase of new rolling stock (see. Section "Park of cars").
Key financial covenants:
Covenant Required Level Indicator in 2014 Compliance with
the requirements
Current Ratio Min 0,75 1,3
Net Debt / EBITDA Max 3,75 2,4
Debt Service Coverage
Ratio Min 1,2 2,3
Tangible Net Worth Min $90 mln
(16 412 mln KZT)
$176 mln
(32 086 mln KZT)
Risk factors
28
Demand
In Kazakhstan over 60% of goods transported by rail are raw materials in mining manufacturing (coal, ore, petroleum, nonferrous and ferrous metals). In this regard, the
demand for different types of cars is largely determined by trends in the development of relevant industries. Cargo owners prefer leasing cars, not wishing to have their
property in order to reduce the risk of downtime and protect themselves in the event of short-term contracts.
The need for tank wagons for the transportation of oil and LPG is directly dependent on the global demand for oil and gas production from oil and gas pipelines and power
available in the Republic of Kazakhstan.
Kazakhstan's oil reserves are estimated at about 30 billion barrels, 77% of which are located in three major fields - Kashagan, Tengiz and Karachaganak. (Other key fields
include: Uzen Zhetybai, Janajol, Kalamkas, Kenkiyak Karanzhanbas, Kumkol North Buzachi, Alibekmola Central and Eastern Prorva Kenbai, Royal).
It is expected that from 2015, oil exports from Kazakhstan will grow by more than 8% per year due to increased production volumes in key fields.
It is projected that by 2020 Kazakhstan's oil production will reach 145.7 million tons a year, while export is more than 80%. Domestically, oil will be transported to
refineries and petrochemical plants for the subsequent production of petroleum products.
Competitors
The company faces strong competition in the transportation of oil and petroleum products as a result of the development of a network of pipelines in Kazakhstan and the
countries bordering with Kazakhstan, as the transportation of crude oil by pipeline is more cost-effective and cost-effective than rail.
Kazakhstan and Russia use the same railway gauge. In Russia there is an excess of rolling stock, whereas in Kazakhstan - deficit. In addition, the last 5 years in Kazakhstan
rent rates were higher than in Russia. These factors pose a threat to the emergence of Russian operators in the rolling stock of Kazakhstan, which may lead to increased
competition and lower rental rates.
Risk factors
29

Social activity
30

Social activity
Dental care program "Give a smile“.
In 2014, we continued implementing «Give a smile» program.
The program aims to provide social assistance to children from disadvantaged
groups in the form of assistance in their health care (dental services unwarranted
public services (orthodontics).
Target Audience: orphanages, boarding schools for children from poor families of
Almaty and Almaty region. Beneficiaries are LEU «SOS Children's Village
Almaty" Boarding School № 10 for low-income children, children's home number
2, number 1 Orphanage, NC "family-type children's home" Perzent "Regional and
orphanage.
Timeline for program implementation: 2013-2015.
Project is carried out with the participation of volunteer students from faculty of
Dentistry of Kazakh state University named after Asfendiyarov through practical
workshops on dental hygiene.
31
The "Professional orientation of children”
On 31 March, 2014 was a start date of “Professional world“ project. As part
of that, Viktor Tskhay, Head of repair department of "Eastcomtrans“ met up
with the youngsters to tell them all about working in railway field from A to Z.
Adilzhan Kozhabergenov, CFO of Eastcomtrans spoke about “Financial
management”, having young students deeply interested and involved in an
active dialogue and discussion of an example of equity investments and its
growth.
Introduction to the legal profession was carried out by Maxim Martynovsky,
Chief of legal department of Eastcomtrans in an orphanage №2, Almaty.
Children were very keen on learning more about types, statuses of the
profession, its positive and negative sides. They happily came to conclusion
that to love what you do is essential since people contribute great deal of their
time to work.

Corporate governance
32

Corporate governance
33
General Meeting of Participants
Supervisory Board
Director General
Entry of international strategic investor (IFC) into the Company, its leading positions on the market, emission of Eurobonds at KASE and LSE, geographical expansion of business,
projects for IPO - all these factors contribute to Company's transition to a new level of development. It also applies to importance of more complex and serious issues of corporate
governance, which not only involves adopting a formal approach, but more importantly - implementing principles of corporate governance into practice, including corporate
governance. The Company adheres to the principles of a national code of corporate governance, following the recommendations of international best practices in corporate governance.
The supreme body consisting of Participants or their representatives
The Supervisory Board
is a body of strategic
management and
control of the
Company.
The number of members
of the Supervisory Board
is determined by the
general meeting of
members, but cannot
excess five.
In 2014, the Supervisory Board of the Company consisted of 3 and from 19/05/2015 – of 4 members:
Structure of the Supervisory Board of the Company:
1.Marat Sarsenov - Chairman of the Supervisory Board. Born on June 6, 1967. Has been the Chairman of the Supervisory Board for the
last three years (scope of business – railway transport), until 01/06/2015; the shareholder of the Partnership with 55.998% stake in charter
capital of the Company;
By the decision of the General Meeting of participants dated on 01.06.2015, Mr. Vadim Malakhov, who previously held the position of
General Director of the Company, was elected as the Chairman of the Supervisory Board.
2.Ekaterina Benjamin - Independent Member of the Supervisory Board. Born on January 9, 1974. Mrs. Benjamin has extensive
experience working in financial institutions, such as Citibank Kazakhstan, Bank Petrocommerce, Kazinvestbank, HSBC Bank Kazakhstan,
Altyn Bank. Mrs Benjaminis is not a member of the Company and/or its subsidiaries and affiliates, was elected as Independent member of
the Supervisory board by the decision of the General Meeting of participants from 25.12.2014 instead of Mr. Kozhabergenov Adilzhan
Akhmetzhanovich;
3.Yuri Lavrinenko - Independent Member of the Supervisory Board. Born November 24, 1945. Advisor to the President of “Kazahstan
Temir Zholy" (KTZ) since November 2010; not a member of Company and/or its subsidiaries and affiliates.
By the decision of the General Meeting of participants dated 19.05.2015 the Supervisory board was extended to 4 members and Mr.
Mikhail Kuznetsov was elected as Independent Member of the Supervisory Board. Mr. Kuznetsov held senior positions in such
companies as "Aviacor", "LUKOIL-Volga", "Promsvyaz" and "The International Finance Corporation» (IFC). Currently, Mr. Kuznetsov
is an Independent director on the Board of Directors of "Energosetproject“JSC, of "Echo" (Roscosmos), "Credit Bank of Moscow" JSC.
He is also the CEO and managing partner of Corporate Development Center, and the executive director of the Association of Corporate
Directors.
Mr. Vadim Malakhov had been working as Director General in 2014. Mr. Malakhov was born on August 28, 1960, he held the position of
Director General of the Company from 2002 till 01.06.2015; He is not a member of the Company and/or its subsidiaries and affiliates. By
the decision of the General Meeting of participants dated on 01.06.2015, Mr. Yevgeniy Plakhotin, who previously held the post of the
First Deputy General Director of the Company, was appointed as the Director General of the Company;
The sole executive body
The company continues to introduce some elements of evaluation and monitoring of the internal control and risk management, in particular:
• The Company developed and approved the Rules of internal control on management and use of insider information.
• The Company takes steps to implement the system of IT-incident management control to formalize processing applications received by Information Technology Division
• The Company adopted the Regulations on the insurance policy for creation of insurance to protect property interests of the Company.
• In 2014 the Company adopted and implemented a plan for the development of the corporate governance system, provides for an adjustment of internal documents and
policies, the introduction of the Corporate Secretary, improving the quality of internal control and risk management, information disclosure, the quality of planning and
reporting practices of the remuneration of management and key personnel .

Organizational structure
Director General
Deputy to Director
General for commercial &
manufacturing
Commercial
Department
Representative office in
Astana
Aktau Branch
Finance Department
Administrative
Department
Technical Department
Legal Department
HR Department
IT Department
Logistic Department
34

Financial Statement
35

To the Management of Eastcomtrans LLP
We have audited the accompanying financial statements of Eastcomtrans LLP
(the “Company”), which comprise the statement of financial position as at 31
December 2014, and the statements of profit or loss and other comprehensive income,
changes in equity and cash flows for the year then ended, and notes, comprising a
summary of significant accounting policies and other explanatory information.
Management’s Responsibility for the Financial Statements
Management is responsible for the preparation and fair presentation of these financial
statements in accordance with International Financial Reporting Standards, and for
such internal control as management determines is necessary to enable the
preparation of financial statements that are free from material misstatement, whether
due to fraud or error.
Auditors’ Responsibility
Our responsibility is to express an opinion on these financial statements based on our
audit. We conducted our audit in accordance with International Standards on
Auditing. Those standards require that we comply with ethical requirements and plan
and perform the audit to obtain reasonable assurance about whether the financial
statements are free from material misstatement.
An audit involves performing procedures to obtain audit evidence about the amounts
and disclosures in the financial statements. The procedures selected depend on the
auditor‟s judgment, including the assessment of the risks of material misstatement of
the financial statements, whether due to fraud or error. In making those risk
assessments, the auditor considers internal control relevant to the entity‟s preparation
and fair presentation of the financial statements in order to design audit procedures
that are appropriate in the circumstances, but not for the purpose of expressing an
opinion on the effectiveness of the entity‟s internal control. An audit also includes
evaluating the appropriateness of accounting policies used and the reasonableness of
accounting estimates made by management, as well as evaluating the overall
presentation of the financial statements.
We believe that the audit evidence we have obtained is sufficient and appropriate to
provide a basis for our audit opinion.
Independent Auditors’ Report
Opinion
In our opinion, the financial statements present fairly, in all material respects, the
financial position of the Company as at 31 December 2014, and its financial
performance and its cash flows for the year, then ended in accordance with
International Financial Reporting Standards.
Kim Y.V.
Certified Auditor
of the Republic of Kazakhstan,
Auditor‟s Qualification Certificate
No.МФ-0000042 of 8 August 2011
Alla Nigay
General Director of KPMG Audit LLC
acting on the basis of the Charter
36

Statement of financial position
37
In thousands of tenge Note
As at 31
December 2014
As at 31
December 2013
ASSETS
Non-current assets
Property, plant and equipment 6 105.242.701 99.312.832
Intangible assets 44.798 48.263
Loans due from employees 23.997 10.603
Non-current due from DAMU 13 - 104.560
Total non-current assets 105.311.496 99.476.258
Current assets
Inventories 93.774 79.185
Trade and other receivables 7 6.776.374 4.921.892
Other current assets 8 1.827.519 2.981.338
Current due from DAMU 13 123.761 217.062
Current income tax prepayment 10.256 7.803
Loans due from employees 175.257 12.274
Short-term bank deposits 9 3.282.300 2.296.643
Cash and cash equivalents 10 2.155.105 1.257.028
Total current assets 14.444.346 11.773.225
TOTAL ASSETS 119.755.842 111.249.483
EQUITY AND LIABILITIES
Equity 11
Charter capital 3.845.400 3.845.400
Revaluation fund 12.614.011 13.465.803
Retained earnings 28.370.829 26.809.948
TOTAL EQUITY 44.830.240 44.121.151
Non-current liabilities
Loans and borrowings 13 33.786.241 27.848.936
Bonds 14 17.862.890 14.990.000
Financial lease liabilities 15 2.427.289 3.614.491
Deferred tax liability 23 9.766.550 9.445.321
Total non-current liabilities 63.842.970 55.898.748
Current liabilities
Loans and borrowings 13 8.039.541 8.273.028
Bonds 14 266.940 225.526
Financial lease liabilities 15 1.193.838 1.180.771
Trade payables 16 731.923 790.800
Advances received 252.750 106.409
Other current liabilities 17 597.640 653.050
Total current liabilities 11.082.632 11.229.584
TOTAL LIABILITIES 74.925.602 67.128.332
TOTAL EQUITY AND LIABILITIES 119.755.842 111.249.483

Statement of profit or loss
38
In thousands of tenge Note 2014 2013
Revenue 18 31.897.186 25.512.955
Cost of sales 19 (10.930.694) (7.709.536)
Gross profit 20.966.492 17.803.419
Administrative expenses 20 (2.794.203) (1.685.002)
Other income 151.306 411.209
Other expenses (141.732) (149.873)
Net loss from disposal of property, plant and equipment (101.236) (73.272)
Operating profit 18.080.627 16.306.481
Finance income 22 35.278 57.077
Finance costs 22 (5.820.223) (5.112.401)
Foreign exchange loss, net (8.751.773) (1.002.961)
Profit before income tax 3.543.909 10.248.196
Income tax expense 23 (795.277) (2.090.022)
Profit and other comprehensive income for the year 2.748.632 8.158.174

Statement of cash flows
39
In thousands of tenge 2014 2013
Cash flows from operating activities
Profit before income tax 3.543.909 10.248.196
Adjustments:
Amortisation 5.694.258 5.483.385
Finance income (35.278) (57.077)
Finance costs 5.820.223 5.112.401
Net loss from disposal of property, plant and equipment 101.236 73.272
Provision for doubtful debts 4.074 912
Unrealized foreign exchange losses 8.156.114 967.504
Working capital adjustments
Increase of operating assets:
Inventories (14.589) (10.707)
Trade and other receivables (1.481.607) (1.339.975)
Other current assets (398.875) (763.880)
Increase of operating liabilities
Trade payables (58.877) (171.232)
Advances received 146.341 (251.875)
Other current liabilities (55.410) (18.787)
Cash flows from operating activities 21.421.519 19.272.137
Income tax paid (476.501) (467.276)
Interest paid on finance lease liability (433.904) (602.149)
Interest paid on loans and borrowings and bonds (4.976.408) (4.128.576)
Net cash flows from operating activity 15.534.706 14.074.136
Cash flows from investing activities
Purchase of property, plant and equipment (10.184.017) (12.470.272)
Purchase of intangible assets - (2.268)
Proceeds from sale of property, plant and equipment 14.814 58.925
Interest received from deposits 17.320 12.918
Deposits placed (14.875.026) (34.209.308)
Proceeds from repayment of deposits 13.804.369 31.912.666
Repayment of loans due from employees 19.439 20.255
Loans provided to employees (195.770) (1.600)
Net cash flows used in investing activities (11.398.871) (14.678.684)

Statement of cash flows
40
In thousands of tenge Note 2014 2013
Cash flows from financing activities
Proceeds from borrowings 21.448.198 4.839.543
Proceeds from bonds issuance - 14.782.727
Proceeds from contribution to the share capital - 3.005.400
Repayment of borrowings, including loan origination fees (21.745.067) (17.987.021)
Repayment of finance lease liabilities (1.168.341) (2.137.959)
Dividends paid (2.039.543) (1.672.130)
Net cash flows from financing activity (3.504.753) 830.560
Net increase in cash and cash equivalents 631.082 226.012
Effect of exchange rate fluctuations on cash and cash equivalents 266.995 (19.798)
Cash and cash equivalents as at 1 January 10 1.257.028 1.050.814
Cash and cash equivalents as at 31 December 10 2.155.105 1.257.028

Statement of changes in Equity
41
In thousands of tenge
Charter
capital
Revaluation
fund
Retained
earnings Total
Balance at 1 January 2013 840.000 14.166.827 19.451.800 34.458.627
Profit for the year – – 8.158.174 8.158.174
Other comprehensive income for the year
Amortization of revaluation reserve – (701.024) 701.024 –
Total comprehensive income for the year – (701.024) 8.859.198 8.158.174
Transactions with owners of the Company
Contribution to charter capital (Note 11) 3.005.400 – – 3.005.400
Dividends (Note 11) – – (1.501.050) (1.501.050)
Total transactions with owners of the Company 3.005.400 – (1.501.050) 1.504.350
Balance at 31 December 2013 3.845.400 13.465.803 26.809.948 44.121.151
Profit for the year - - 2.748.633 2.748.633
Other comprehensive income for the year
Amortization of revaluation reserve - (851.792) 851.792 -
Total comprehensive income for the year - (851.792) 3.600.424 2.748.632
Transactions with owners of the Company
Dividends (Note 11) - - (2.039.543) (2.039.543)
Total transactions with owners of the Company - - (2.039.543) (2.039.543)
Balance at 31 December 2014 3.845.400 12.614.011 28.370.829 44.830.240

Notes to the financial statement
1 REPORTING ENTITY
(a) Organization and operations
Eastcomtrans LLP (the “Company”) is a limited liability partnership established
under the laws of the Republic of Kazakhstan on 4 October 2002.
The principal activity of the Company is rendering of the services in the sphere of oil
and gas freight operations by railway over the territory of the Republic of
Kazakhstan.
The registered office of the Company is located at: office 11a, 77/7 Al-Farabi
Avenue, Almaty, 050040, Republic of Kazakhstan.
The Company is owned by Mr. M. Zh. Sarsenov (55,998%), a citizen of Republic of
Kazakhstan, and Steinhardt Holding N.V (37,332%), a company established under
the laws of the Netherlands, and International Finance Corporation (6.67%). The
ultimate controlling party is Mr. M.Zh. Sarsenov.
On 10 July 2014, Moody's Rating Agency confirmed B3 corporate credit rating under
the international and national scales to Eastcomtrans LLP. A credit rating outlook is
“Positive”.
On 3 June 2014, Fitch Ratings confirmed the Company‟s long-term credit ratings at B
level according to the international scale, and at BB(kaz) according to the local scale.
The credit rating outlook is “Stable”.
(b) Kazakhstan business environment
The Company‟s operations are primarily located in Kazakhstan. Consequently, the
Company is exposed to the economic and financial markets of the Republic of
Kazakhstan which display characteristics of an emerging market. The legal, tax and
regulatory frameworks continue its development, but are subject to varying
interpretations and frequent changes which together with other legal and fiscal
impediments contribute to the challenges faced by entities operating in the Republic
of Kazakhstan. The financial statements reflect management‟s assessment of the
impact of the Republic of Kazakhstan business environment on the operations and the
financial position of the Company. Actual business environment may differ from the
management‟s assessment.
2 BASIS OF ACCOUNTING
(a) Statement of compliance
These financial statements have been prepared in accordance with International
Financial Reporting Standards (“IFRSs”).
(b) Basis of measurement
These financial statements are prepared based on historic (primary) cost, except for
machinery and equipment and embedded financial instruments, accounted at the
revalued amount.
3 FUNCTIONAL AND REPRESENTATION CURRENCY
The national currency of the Republic of Kazakhstan is the Kazakh tenge (“KZT”),
which is the Company‟s functional currency and the currency in which these
financial statements are presented. All financial information presented in KZT,
unless otherwise specified, has been rounded to the nearest thousand.
4 USE OF ESTIMATES AND JUDGMENTS
The preparation of financial statements in conformity with IFRSs requires
management to make judgments, estimates and assumptions that affect the
application of accounting policies and the reported amounts of assets, liabilities,
income and expenses. Actual results may differ from those estimates.
Estimates and underlying assumptions are reviewed on an ongoing basis. Revisions
to accounting estimates are recognised in the period in which the estimates are
revised and in any future periods affected.
Information about critical judgments in applying accounting policies that have the
most significant effect on the amounts recognised in the financial statements is
included in the Note 6 - Property, plant and equipment.
Information about assumptions and estimation uncertainties that have a significant
risk of resulting in a material adjustment within the next financial year is included
in the following notes:
Note 6 - Property, plant and equipment;
Note 14 – Bonds.
Measurement of fair values
A number of the Company‟s accounting policies and disclosures require the
determination of fair value, for both financial and non-financial assets and
liabilities.
42
A number of the Company‟s accounting policies and disclosures require the
determination of fair value, for both financial and non-financial assets and liabilities.
The Company has an established control framework with respect to the measurement
of fair values. As a part of the control framework the Company‟s Financial Director
has overall responsibility for overseeing all significant fair value measurements,
including Level 3 fair values, and reports directly to the management of the
Company.
The Finance Department specialists regularly review significant unobservable inputs
and valuation adjustments. If third party information, such as broker quotes or pricing
services, is used to measure fair values, then the Finance Department specialist
assesses the evidence obtained from the third parties to support the conclusion that
such valuations meet the requirements of IFRS, including the level in the fair value
hierarchy in which such valuations should be classified.
When measuring the fair value of an asset or a liability, the Company uses market
observable data as far as possible. Fair values are categorised into different levels in a
fair value hierarchy based on the inputs used in the valuation techniques as follows.
Level 1: quoted prices (unadjusted) in active markets for identical assets or liabilities.
Level 2: inputs other than quoted prices included in Level 1 that are observable for
the asset or liability, either directly (i.e. as prices) or indirectly (i.e. derived from
prices).
Level 3: inputs for the asset or liability that are not based on observable market data
(unobservable inputs).
If the inputs used to measure the fair value of an asset or a liability might be
categorised in different levels of the fair value hierarchy, then the fair value
measurement is categorised in its entirety in the same level of the fair value hierarchy
as the lowest level input that is significant to the entire measurement.
The Company recognises transfers between levels of the fair value hierarchy at the
end of the reporting period during which the change has occurred.
Further information about the assumptions made in measuring fair values is included
in the following notes:
Note 6 - Property, plant and equipment;
Note 14 - Bonds;
Note 24 – Fair value and risks management.
5 OPERATING SEGMENTS
The management of the Company considers the Company as one segment, which
uses out the wagons and renders the services of routine maintenance and freight
forwarding. The Company‟s assets are registered in Kazakhstan. All revenues of
the Company are generated in Kazakhstan. The Company‟s management analyses
the segment performance based on statement of profit or loss and other
comprehensive income prepared in accordance with IFRS.
The major client of the Company in 2014 and 2013 is Tengizchevroil LLP.
Information on sales is disclosed in Note 18.
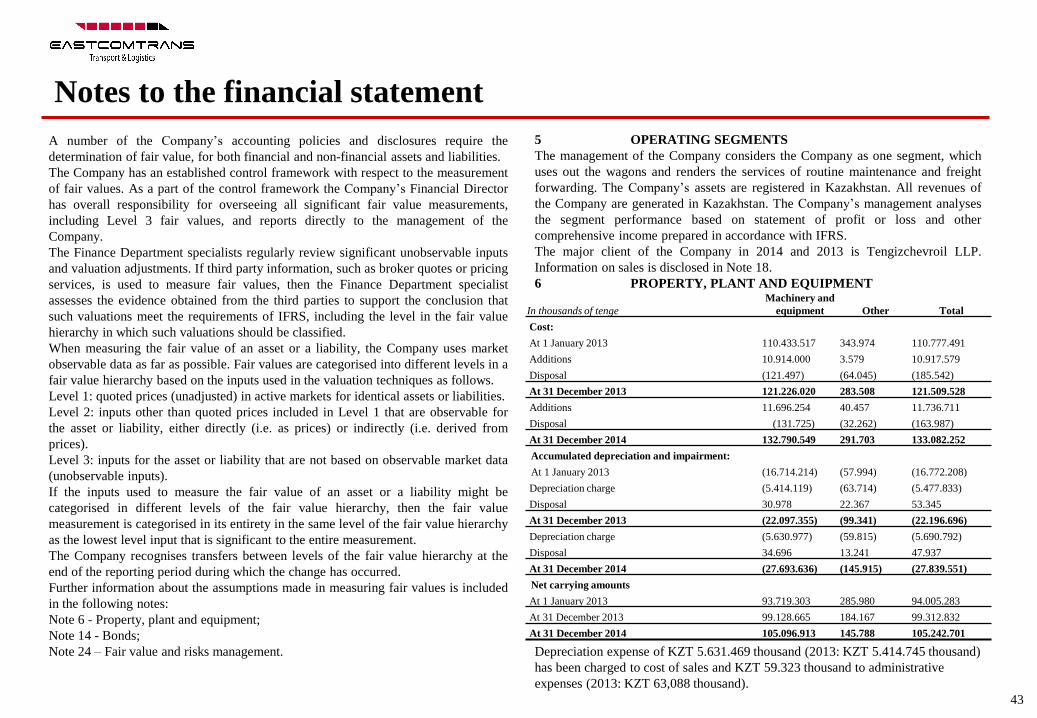
6 PROPERTY, PLANT AND EQUIPMENT
43
Depreciation expense of KZT 5.631.469 thousand (2013: KZT 5.414.745 thousand)
has been charged to cost of sales and KZT 59.323 thousand to administrative
expenses (2013: KZT 63,088 thousand).
Notes to the financial statement
In thousands of tenge
Machinery and
equipment Other Total
Cost:
At 1 January 2013 110.433.517 343.974 110.777.491
Additions 10.914.000 3.579 10.917.579
Disposal (121.497) (64.045) (185.542)
At 31 December 2013 121.226.020 283.508 121.509.528
Additions 11.696.254 40.457 11.736.711
Disposal (131.725) (32.262) (163.987)
At 31 December 2014 132.790.549 291.703 133.082.252
Accumulated depreciation and impairment:
At 1 January 2013 (16.714.214) (57.994) (16.772.208)
Depreciation charge (5.414.119) (63.714) (5.477.833)
Disposal 30.978 22.367 53.345
At 31 December 2013 (22.097.355) (99.341) (22.196.696)
Depreciation charge (5.630.977) (59.815) (5.690.792)
Disposal 34.696 13.241 47.937
At 31 December 2014 (27.693.636) (145.915) (27.839.551)
Net carrying amounts
At 1 January 2013 93.719.303 285.980 94.005.283
At 31 December 2013 99.128.665 184.167 99.312.832
At 31 December 2014 105.096.913 145.788 105.242.701

(a) Revaluation of machinery and equipment
Machinery and equipment are mainly represented by the railway wagons and gondola
wagons. The latest revaluation of the Company‟s machinery and equipment was
performed as at 31 December 2010 by an independent appraiser, American Appraiser
LLP. The fair value was determined based on the analysis of the CIS secondary
market, which was classified as an active secondary market by the appraiser.
As at 31 December 2014 the Company analysed the market value of the machinery
and equipment (or property, plant and equipment represented mostly by the different
types of wagons). As there was no active secondary market for relatively large lots of
wagons which was due to high uncertainty in the Russian market at the end of 2014,
the Company decided to abandon the comparative approach to value the wagons and
used the cost method. The Company requested prices on the wagons similar to those
used by the Company from two major suppliers, Scientific and Production
Corporation UralVagonZavod OJSC and Altaiwagon OJSC, and adjusted these prices
for physical depreciation to present the current condition of the wagon rolling stock.
Based on results of the analysis the Company made decision not to revalue the wagon
rolling stock, as its carrying amount did not materially differ from fair value as at the
valuation
As at 31 December 2014 the carrying amount of machinery and equipment would
have been KZT 92,482,901 thousand (2013: KZT 82,774,988 thousand), if machinery
and equipment had been recognized at cost less the accumulated depreciation and
impairment.
(b) Security
As at 31 December 2014 the machinery and equipment with net carrying amount of
KZT 63.411.094 thousand (2013: KZT 54,999,950 thousand) are subject to a
registered debenture to secure bank loans and borrowings (see Note 13); machinery
and equipment with net carrying amount of KZT 18.959.645 thousand (2013: KZT
20,116,951 thousand) are subject to a registered debenture to secure the Company‟s
bonds (see Note 14). Moreover, as at 31 December 2014 the machinery and
equipment with net carrying amount of KZT 6.467.714 thousand (2013: KZT
6,868,722 thousand) are subject to a registered debenture to secure the loans and
borrowings received by Center of Wagon Service – Yeskene LLP, an enterprise
under common control of the ultimate controlling party of the Company.
Leased property, plant and equipment
Machinery and equipment are mainly represented by the railway wagons and
gondola wagons. Machinery and equipment include wagon acquired under the
finance lease contracts signed with banks, with net carrying amount of KZT
9.551.123 thousand (2013: KZT 10,033,943 thousand). The wagons are pledged as
security of the respective finance lease contracts (see Note 15).
7 TRADE AND OTHER RECEIVABLES
44
As at 31 December 2014 the trade receivables of the Company‟s major customer -
Tengizchevroil LLP – accounted for 32% of the total trade receivables (2013:
36%).
The movement in the provision for doubtful debt during the years ended 31
December was as follows:
As at 31 December 2014 the trade receivables not overdue and not impaired
amounted to KZT 6.776.374 thousand (2013: KZT 4,921,892 thousand).
As at 31 December the Company‟s trade receivables were denominated in the
following currencies:
Notes to the financial statement
In thousands of tenge 2014 2013
Trade receivables 6.518.694 4.664.032
Other receivables from a related party (Note 26) 262.000 262.024
Less provision for doubtful debts (4.320) (4.164)
6.776.374 4.921.892
In thousands of tenge 2014 2013
Provision for doubtful debt at the beginning of the year (4.164) (37.042)
Provision for the year (4.074) (335)
Writes-off 3.918 33.213
Provision for doubtful debt at the end of the year (4.320) (4.164)
In thousands of tenge 2014 2013
USD 2.600.371 2.047.230
KZT 4.102.407 2.686.276
RUR 73.596 188.386
6.776.374 4.921.892

The Company‟s exposure to credit risk related to trade receivables is disclosed in
Note 24.
As at 31 December 2013 other current assets included advances paid to TD
Azovobschemash CJSC and WagontradePlus LLC for procurement of wagons, which
were provided to the Company in 2014. As at 31 December 2014 there were no
advances paid for wagons.
As at 31 December the advances paid were as follows:
On 30 and 31 December 2014 the Company opened a deposit in USD in SB
Sberbank JSC in the total amount of KZT 3.282.300 thousand with the interest rate
6% per annum. The term of deposit matures on 1 April 2015.
During 2013 the Company opened deposits in USD and in KZT in ATF Bank JSC
for the total amount of KZT 1,292,942 thousand with the interest rates from 0.2-
3.66% per annum. The terms of the deposits vary from 3 to 12 months.
On 28 November 2013 the Company opened a deposit in USD in SB HSBC Bank
Kazakhstan JSC for the amount of KZT 1,003,701 thousand at the interest rate of
0.15%. The deposit matured on 20 February 2014. A bank deposit in SB HSBC
Bank Kazakhstan JSC as at 31 December 2013 is subject to a registered debenture to
secure the bonds obligations if the rolling stock appears to be insufficient as security
(see Note 14). However, the bank deposit is not restricted.
The Company's exposure to credit risk and interest rate risks and sensitivity analysis
for financial assets and liabilities are disclosed in Note 24.
10 CASH AND CASH EQUIVALENTS
45
The movements in the impairment allowance for the years ended 31 December were
as follows: Altyn Bank JSC has a right to set a limitations with respect to cash placed in the
banks, if the Company fails to observe the payments schedule of the principal or
interest on the loans of the International Finance Corporation. As at 31 December
2014 the total of such cash placed in Altyn Bank JSC (SB Halyk Bank of
Kazakhstan JSC) was KZT 260.211 thousand (2013: on accounts of BNP
PARIBAS (SUISSE) SA and ATF Bank JSC: 578.572 thousand) (see Note 13).
Bank accounts in SB Sberbank JSC in the amount KZT 65.563 thousand as at 31
December 2014 are subject to secure completion of obligations on a loan from
BNP PARIBAS (SUISSE) SA. However, cash on these accounts is not restricted.
In December 2014 the Company opened a deposit in KZT in Altyn Bank JSC for
the total amount of KZT 85.000 thousand with the interest rate 10% per annum.
The term of the deposit matured on 15 January 2015.
The Company‟s exposure to credit risk and interest rate risk and a sensitivity
analysis for financial assets and liabilities are disclosed in Note 24.
Notes to the financial statement
In thousands of tenge 2014 2013
Advances paid 1.258.313 2.776.688
Prepayment of the interest on guarantees received from ultimate
controlling party (Note 26) 246.150 194.675
Other 323.056 9.975
1.827.519 2.981.338
In thousands of tenge 2014 2013
Advances paid for goods and services 1.264.057 1.230.080
Advances paid for wagons - 1.552.694
Less the impairment reserve (5.744) (6.086)
1.258.313 2.776.688
In thousands of tenge 2014 2013
Impairment allowance at the beginning of the year (6.086) (5.509)
Write-offs 342 -
Charge for the year - (577)
Impairment allowance at the end of the year (5.744) (6.086)
9 SHORT-TERM BANK DEPOSITS
In thousands of tenge 2014 2013
Short-term bank deposits 3.282.300 2.296.643
In thousands of tenge 2014 2013
Cash in bank - USD 1.720.984 918.702
Cash in bank - KZT 432.674 322.249
Cash in bank - RUR 885 1
Cash in hand - KZT 562 16.076
2.155.105 1.257.028

11 CHARTER CAPITAL AND RESERVES
(a) Charter capital
12 CAPITAL MANAGEMENT
The Company has no formal policy for capital management but management seeks to
maintain a sufficient capital base for meeting the Company‟s operational needs, and to
maintain confidence of market participants and investors, creditors and to ensure future
business development. This is achieved with efficient cash management, constant monitoring
of Company‟s revenues and profit, and long-term investment plans mainly financed by the
Company‟s operating cash flows. With these measures the Company aims for steady profits
growth.
The management of the Company monitors the return on capital, which the Company
defines as net operating income divided by total shareholders‟ equity.
The management seeks to maintain a balance between the higher returns that might be
possible with higher levels of borrowings and the advantages and security afforded by a
sound capital position.
There were no changes in the Company‟s approach to capital management during the year.
The Company is not subject to externally imposed capital requirements.
13 LOANS AND BORROWINGS
This note provides information about the contractual terms of the Company‟s loans and
borrowings. For more information about the Company‟s exposure to interest rate and foreign
currency risk, see Note 24.
46
Notes to the financial statement
In thousands of tenge 2014 2013
Value % Value %
Mr. M. Zh. Sarsenov 504.000 55,998% 504.000 55,998%
Steinhardt Holding N.V. 336.000 37,332% 336.000 37,332%
International Finance Corporation 3.005.400 6,67% 3.005.400 6,67%
3.845.400 100% 3.845.400 100%
During the year ended 31 December 2013 the Company admitted the International
Finance Corporation (“IFC”) as a participant of the Company; IFC made a capital
contribution of KZT 3.005.400 thousand and acquired an ownership interest of
6.67% in the Company.
(b) Dividends
The founders are entitled to receive dividends as declared from time to time and are
entitled to vote at meetings of the Company prorated to their ownership interests in
the charter capital.
In accordance with the legislation of the Republic of Kazakhstan the Company‟s
distributable reserves are limited to the balance of retained earnings as recorded in
the Company‟s statutory financial statements prepared in accordance with IFRS. As
at 31 December 2014 the Company had retained earnings, including the loss for the
current year, of KZT 28.370.829 thousand (2013: KZT 26.809.948 thousand).
During the year 2014 the Company declared dividends to the partners in the amount
of KZT 2.039.544 thousand, prorated to their ownership interests in the Company‟s
capital (2013: KZT 1.501.505 thousand).
(c) Security
As at 31 December 2014 the partners provided 37.332 % of the Company‟s shares as
a security for loans and borrowings of the Company (2013: 37.332%) (see Note 13).
(d) Value increment from revaluation of property, plant and
equipment
Revaluation fund is meant to reflect the results of property, plant and equipment
revaluation less deferred tax.
In thousands of tenge
Creditor Currency
Effective
interest rate
Repayme
nt period 2014 2013
BNP PARIBAS (SUISSE) SA USD 6,67% 2017 8.578.787 12.993.914
BNP PARIBAS (SUISSE) SA USD 6,17% 2016 5.166.164 8.673.027
International Finance Corporation
(Note 26) USD 6,06% 2022 4.929.716 4.563.924
ATF Bank JSC USD 7,75-7,73% 2017 387.442 1.326.584
ATF Bank JSC USD 7,75-7,73% 2016 2.573.122 2.914.326
SB HSBC Bank Kazakhstan JSC USD 7,3-6,86% 2016 - 5.650.189
Islamic Bank Al Hilal JSC KZT 8,25% 2019 г. 3.316.849 -
Islamic Bank Al Hilal JSC USD 6,5% 2019 г. 2.482.941 -
Gazprombank OJSC USD 6,66% 2021 г. 9.028.045 -
European Bank for reconstruction
and
development KZT 11,52% 2022 5.362.716 -
41.825.782 36,121,964
Less the amounts payable within 12 months (8.039.541) (8.273.028)
Amounts payable after more than 12 months 33.786.241 27.848.936

On 25 February 2014 the Company signed a loan agreement with Gazprombank
OJSC in the amount of USD 50 million with a maturity period of 7 years with an
opportunity of prolongation to 24 months and interest rate 1 month LIBOR+6.5% per
annum. In March-July 2014 the Company received the loan proceeds that were
allocated to purchase a new wagon park.
On 3 July 2014 the Company signed loan agreements, under which Islamic Bank Al
Hilal JSC provided a loan in the amount of KZT 2.700.000 thousand with a maturity
period in July 2019 and a loan in the amount of USD 19.7 million with a maturity
period in July 2019. Expected profit Murabaha on these loans is 8.25% and 6.5% per
annum, respectively. Under these loan agreements, wagons and guarantees of
Mr. M. Zh. Sarsenov in the amount of USD 34.5 million are provided as collateral. In
July 2014 the Company received loan proceeds that were allocated to refinance the
indebtedness to Altyn Bank JSC in the total amount of KZT 5.790.735 thousand.
On 9 December 2014 the Company signed a loan agreement with European Bank for
Reconstruction and Development in the amount of KZT 5.451.000 thousand with a
maturity period of 8 years and interest rate of LIBOR+5.8% per annum including all
costs for refinancing. In December the Company received loan proceeds and partially
in advance redeemed amount of loans to BNP PARIBAS (SUISSE) SA.
13 LOANS AND BORROWINGS, CONTINUED
On 30 December 2014 the Company signed a loan agreement with European Bank
for Reconstruction and Development in the amount of USD 25 million with a
maturity period of 8 years and interest rate 5.8% per annum+3-month LIBOR and
USD 10 million with a maturity period of 5 years with an opportunity of prolongation
to 24 months and interest rate 5.5% per annum+3-month LIBOR.
As at 31 December the Company did not receive any proceeds from the European
Bank for Reconstruction and Development in accordance with the abovementioned
agreement that the Company plans allocate to purchase of new wagon park and
refinancing of loans.
On 14 August 2012 the Company, ATF Bank JSC and DAMU (Entrepreneurship
Development Fund) signed a tripartite subsidy agreement. According to the
agreement, DAMU will reimburse to the Company 7% interest out of total interest
payable by the Company under the loan agreement between the Company and ATF
Bank JSC at the rate of 8.94% per annum for the period from August 2012 to
November 2012, at the rate of 7.85% per annum for the period from November
2012 to December 2012 and at the rate of 3-month LIBOR+7.5% per
annum -further. Future interest payments on the loan at a rate of 7% per annum,
paid by DAMU, discounted at the market rate of interest of 7.85% per annum, were
recognised by the Company as the receivables from DAMU and accordingly the
income on government subsidies. In the following periods the Company recognized
the unwinding of discount on due from DAMU in finance income as income from
subsidies (see Note 22).
(а) Security
As at 31 December 2014 the Company‟s property, plant and equipment of the
amount of KZT 63.411.094 (2013: KZT 54,999,950 thousand) thousand are subject
to a registered debenture to secure the loans and borrowings (see Note 6).
As at 31 December 2014 the founders provided 37,332% of Company‟s shares as a
security of the Company‟s loans and borrowings (2013: 37,332%) (see Note 11).
Altyn Bank JSC has a right to set a limitations with respect to cash placed in the
banks, if the Company fails to observe the payments schedule of the principal or
interest on the loans of International Finance Corporation. As at 31 December 2014
the total cash placed in Altyn Bank JSC was KZT 260.211 thousand (2013:
578.572 thousand) (see Note 10).
14 BONDS
On 22 April 2013 the Company placed bonds for the total amount of KZT
14.782.727 thousand with nominal value of USD 100,000 thousand, with the
coupon of 7,75% per annum payable once every six months and maturity of 5 year,
which expire in October 2018.
The bonds are rated at B3 Positive by Moody‟s and B Stable by Fitch. Bond
obligations are secured by a pledge of rolling stock with net carrying amount of
KZT 18.959.645 thousand as at 31 December 2014 (31 December 2013:
20.116.951 thousand) as well as cash and deposit with Altyn Bank JSC (SB Halyk
Bank of Kazakhstan JSC), if the rolling stock appears to be insufficient as a
security (see Notes 9, 10).
(а) Embedded financial instrument - option of early redemption
of the remaining debt
In accordance with terms of the Prospectus for bond issue the Company may at any
time, at its own discretion, having sent the notification of the bondholders, to
47
Notes to the financial statement

48
redeem the bonds in full scope at the price, which represents the principal and
compensation of loss of benefit due to bond calling. Compensation for the loss of
benefit is estimated as the greater of (a) 1% of the nominal value of all outstanding
bonds, or (b) future coupon payments till maturity from the calling date discounted
at the rate stipulated in the Prospectus for bond issue. As at 31 December 2014 and on the date of bond placement, the fair value of the option
measured using the binomial model was equal to zero. Fair value measurement is categorized
to the Level 3 in the hierarchy of fair value.
14 BONDS, CONTINUED
(а) Embedded financial instrument - option of early redemption
of the remaining debt, continued
Management used the following assumptions to measure the embedded derivative
instrument:
Risk-free rates were assessed using the yield curves for the respective currencies
and varied from 0,12% to 1,89% for US Dollar (as at 31 December 2013: from
0,08% to 2,13%);
Volatility of rates in the model was determined on the basis of historic observations
of fluctuations in the actual rates during the year;
Transaction costs were not included in the model.
If spread decrease between the risk-free rates for KZT and USD narrow by 0.5%,
the fair value of the derivative would increase by KZT 141.136 thousand (as at 31
December 2013: KZT 5.682 thousand). Increase in volatility by 50% will result in
the increase of the fair value of the derivative by KZT 66.024 thousand (as at 31
December 2013: KZT 323 thousand).
The Company‟s exposure to liquidity risk related to trade receivables is disclosed
in Note 24.
15 FINANCE LEASE LIABILITIES
The Company entered into agreements to purchase property, plant and equipment,
primarily railway wagons and semi-wagons under deferred payment schedule.
These agreements transfer the ownership over the leased assets to the Company at
the end of the lease term.
Finance lease liabilities comprised the following as at 31 December:
Below are the amounts of future minimum lease payments and their discounted
value:
Notes to the financial statement
In thousands of tenge
Creditor Currency Interest rate Maturity 2014 2013
BRK-Leasing JSC KZT 8,1% - 12% 2016-2018 3.091.484 4.058.918
Raiffeisen Leasing
Kazakhstan LLP
KZT
3 months
EURIBOR
+7,75% 2017 529.643 736.344
3.621.127 4.795.262
Less: the amounts
payable within 12
months (1.193.838) (1.180.771)
Amounts due for
settlements after 12
months 2.427.289 3.614.491
2014 2013
In thousands of tenge
Minimum
lease
payments
Discounted
value of
minimum lease
payments
Minimum
lease
payments
Discounted
value of
minimum lease
payments
Within one year 1.456.212 1.193.839 1.549.179 1.180.771
From one to five years 2.683.667 2.427.288 4.141.977 3.614.491
Less the amounts,
representing the finance costs (518.752) - (895.894) -
Discounted value of
minimum lease payments 3.621.127 3.621.127 4.795.262 4.795.262
Less the amounts payable
within 12 months (1.193.838) (1.180.771)
Amounts due for
settlements after 12 months 2.427.289 3.614.491

On 24 June 2013 the interest rate on the financial leasing contracts with Raiffeisen
Leasing Kazakhstan LLC decreased by 1% to 7.75%+3M Euribor.
For all financial leasing contracts signed with BRK-Leasing JSC effective from 1
September 2013 the interest rate decreased by 2% per annum.
15 FINANCE LEASE LIABILITIES, CONTINUED
As at 31 December 2014 and 31 December 2013, Mr. M.Zh. Sarsenov provided the
guarantees on the Company‟s finance lease liabilities in the amount of KZT
529.643 thousand and KZT 736.344 thousand, respectively (see Note 26).
The Company‟s exposure to liquidity risk related to finance lease liabilities is
disclosed in Note 24.
16 TRADE PAYABLES
17 OTHER CURRENT LIABILITIES
49
Notes to the financial statement
In thousands of tenge 2014 2013
Payables for services 593.193 704.346
Payables for repair of rolling stock 117.971 26.452
Payables for inventories 10.662 47.404
Payables for rolling stock lease 10.097 12.598
731.923 790.800
At 31 December the Company‟s trade payables were denominated in the following
currencies:
In thousands of tenge 2014 2013
USD 125.069 399.501
KZT 305.290 273.155
RUR 299.668 118.136
ЕURO 1.322 8
GBP 553 -
CHF 21 -
731.923 790.800
The Company‟s exposure to liquidity risk related to trade payables is disclosed in
Note 24.
In thousands of tenge 2014 2013
Other taxes payable 567.398 617.805
Vacation reserve 30.242 35.091
Other - 154
597.640 653.050
At 31 December other taxes payable included the following:
In thousands of tenge 2014 2013
Value added tax 523.084 577.493
Withholding tax 28.532 25.928
Other 15,782 14.384
567.398 617.805
18 REVENUE In thousands of tenge 2014 2013
Rental income from use of rolling stock 23.226.522 20.084.803
Operating services 7.292.758 3.984.822
Freight forwarding services 765.151 525.528
Consignor and consignee services 529.766 778.224
Other 82.989 139.578
31.897.186 25.512.955
During 2014 approximately 57% of the total revenue was derived from the services
rendered to one customer - Tengizchevroil LLP (2013: 62%). The use contracts on
rolling stock expire in 2016 but all of them are not non-cancellable.
19 COST OF SALES In thousands of tenge 2014 2013
Amortisation 5.631.469 5.414.745
Repair and technical maintenance of wagons 2.670.756 1.298.994
Use of railway infrastructure 906.133 343.968
Wagons lease 513.745 13.229
Maintenance of wagons 419.094 74.880
Payroll and related expenses 414.626 287.746
Insurance of wagons 108.888 108.798
Spare parts and other materials 54.192 13.646
Other 211.791 153.530
10.930.694 7.709.536

20 ADMINISTRATIVE EXPENSES
23 INCOME TAX EXPENSE
50
The Company signed two agreements with Insurance Company Amanat Insurance
JSC on compensation for harm caused to life, health or property of third parties as
well as environmental damaged caused by a sudden and unintentional accidental
release, combustion (fire), discharge (effluent), spraying, release or leakage of any
pollutants occurred during professional activities.
21 PERSONNEL COSTS
Notes to the financial statement
In thousands of tenge 2014 2013
Insurance of risks 946.388 -
Payroll and related expenses 915.176 920.216
Taxes other than income tax 325.253 46.849
Office rent 122.642 112.456
Transportation 106.134 69.062
Consulting and other professional services 81.803 63.157
Amortization 62.789 68.640
Business trips 49.006 44.984
Bank fees 33.390 77.526
Materials 22.333 18.003
Utilities 21.913 21.077
Telecommunication services 17.332 19.644
Provision for doubtful debt (Notes 7, 8) 4.074 912
Repair and technical maintenance 1.343 24.019
Sponsorship (Note 26) 747 65.280
Other 83.880 133.177
2.794.203 1.685.002
In thousands of tenge 2014 2013
Payroll and related expenses 1.329.802 1.207.962
Personnel costs in the amount of KZT 414.626 thousand (2013: KZT 287.746
thousand) are charged to the cost of sales and in the amount of KZT 915.176
thousand (2013: KZT 920.216 thousand) - to administrative expenses.
22 FINANCE INCOME/(EXPENSE)
In thousands of tenge 2014 2013
Finance income
Income from subsidies (Note 13) 16.933 30.436
Discount amortization on long-term loans, issued to the
employees 2.290 2.879
Interest income on loans 2.088 -
Interest income on bank deposits 13.967 23.762
35.278 57.077
Finance costs
Interest expenses on bank loans (3.333.598) (3.362.339)
Interest expenses on bonds (1.425.272) (845.654)
Interest expenses on finance lease contracts (430.825) (592.176)
Interest expenses on guarantees (Note 26) (626.196) (311.377)
Discounting of long-term loans, issued to employees (4.332) (855)
(5.820.223) (5.112.401)
In thousands of tenge 2014 2013
Current income tax expense 474.048 474.752
Deferred tax expense 321.229 1.615.270
795.277 2.090.022
For the years ended 31 December the reconciliation of income tax expense related
to profit before income tax estimated using the official tax rate of 20% (2013: 20%)
with the current income tax expense was as follows:
In thousands of tenge 2014 2013
Profit before income tax 3.543.909
10.248.19
6
Official tax rate 20% 20%
Income tax at official tax rate 708.782 2.049.639
Expenses, that do not decrease tax base 86.495 40.383
795.277 2.090.022

As at 31 December the components of the deferred tax assets and liabilities include
the following:
business processes of its structural units, thus creating the risk management culture,
in which the Company‟s structural units and personnel are involved at the
Company‟s level.
(ii) Credit risk
Credit risk is the risk of financial loss to the Company if a customer or counterparty
to a financial instrument fails to meet its contractual obligations. The Company
trades only with recognised creditworthy parties. It is the Company's policy that all
customers who wish to trade on credit terms are subject to credit verification
procedures. In addition, receivable balances are monitored on an ongoing basis
with the result that the Company's exposure to bad debts is not significant.
The carrying amount of financial assets represents the maximum credit exposure.
The maximum exposure to credit risk at the reporting date was:
24 FAIR VALUE AND RISK MANAGEMENT
(a) Classification in the financial statements and fair values
Management of the Company believes that the fair value of its financial assets and
liabilities approximates their carrying amounts.
(b) Financial risk management
The Company has exposure to the following risks from its use of financial
instruments:
• credit risk;
• liquidity risk;
• market risk.
(i) Risk management framework
The Management of the Company has overall responsibility for the establishment
and oversight of the Company‟s risk management framework. Management is
responsible for developing and monitoring the Company‟s risk management policies.
The draft of the Company‟s risk management policy has been submitted for
approval; based on the specifics of its operations the Company is building a risk
management system by integrating the principles of risk management with the
51
Notes to the financial statement
Statement of financial
position
Statement of profit or loss
and other comprehensive
income
In thousands of tenge 2014 2013 2014 2013
Deferred tax assets
Trade and other receivables 864 2.050 (1.186) (6.460)
Loans and borrowings 69.844 47.433 22.411 47.433
Other current liabilities 6.096 7.154 (1.058) (977)
76.804 56.637 20.167 39.996
Deferred tax liabilities
Property, plant and equipment (9.818.602) (9.437.634) (380.968) (1.696.220)
Due from DAMU (24.752) (64.324) 39.572 40.954
(9.843.354) (9.501.958) (341.396) (1.655.266)
Net deferred tax liability (9.766.550) (9.445.321) - -
Deferred tax expense - - (321.229) (1.615.270)
In thousands of tenge 2014 2013
Loans due from employees 199.254 22.877
Due from DAMU (Note 13) 123.761 321.622
Trade receivables (Note 7) 6.776.374 4.921.892
Short-term bank deposits (Note 9) 3.282.300 2.296.643
Cash and cash equivalents, without considering cash in hand
(Note 10) 2.154.543 1.240.952
12.536.232 8.803.986
(iii) Liquidity risk
Liquidity risk is the risk that the Company will encounter difficulty in raising funds
to meet commitments associated with financial instruments. Liquidity requirements
are monitored on a regular basis and management ensures that sufficient funds are
available to meet any commitments as they arise. The Company aims to maintain
the minimum level of cash and cash equivalents and other high liquid instruments
of an amount in excess of expected cash outflows on financial liabilities over the
next 30 days. As at 31 December 2014 the current assets of the Company exceeded
the current liabilities by KZT 3.361.714 thousand (2013: current assets
of the Company exceeded the current liabilities by KZT 543.641 thousand).

Management is addressing the Company‟s liquidity needs by implementing the
following measures:
Making long-term arrangements with customers to ensure sufficient cash flows from
operating activities.
Making arrangements with financial institutions.
The tables below show the general information on contract payments on financial
payments of the Company as at 31 December by the maturity period of these
liabilities:
For the year ended 31 December 2014
are carried out within the guidelines set by the Supervisory Board. The Company
does not apply hedge accounting in order to manage volatility in profit or loss. Currency risk
The Company is exposed to currency risk on sales, purchases and borrowings that
are denominated in a currency other than KZT. The currency in which these
transactions primarily are denominated is US Dollars (USD). Generally,
borrowings are denominated in currencies that match the cash flows generated by
the underlying operations of the Company, primarily USD. In addition, interest on
borrowings is denominated in the currency of the borrowing. This provides an
economic hedge without a need to enter into derivatives contracts.
In respect of other monetary assets and liabilities denominated in foreign
currencies, the Company‟s policy is to ensure that its net exposure is kept to an
acceptable level by buying or selling foreign currencies at spot rates when
necessary to address short-term imbalances.
The table below shows the sensitivity of the Company‟s profit before taxes to
change of USD exchange rate, which can be reasonably forecasted, with all other
variables remain unchanged. These factors do not affect the Company‟s equity.
52
Notes to the financial statement
In thousands of
tenge
Carrying
amounts
Less than 3
months
From 3 to
12 months
From 1 to 5
years
More than
5 years
Total cash
outflow
Loans and
borrowings 41.825.782 2.792.619 8.298.054 35.320.034 5.576.222 51.986.929
Bonds 18.129.830 - 1.680.153 21.501.091 - 23.181.244
Financial lease
liabilities 3.621.127 372.650 1.083.562 2.683.667 - 4.139.879
Trade payables 731.923 731.923 - - - 731.923
64.308.662 3.897.192 11.061.769 59.504.792 5.576.222 80.039.975
For the year ended 31 December 2013
In thousands of tenge
Carrying
amounts
Less than 3
months
From 3 to
12 months
From 1 to 5
years
More than
5 years
Total cash
outflow
Loans and borrowings 36,121,964 2.701.430 8.184.006 30.648.963 1.507.853 43.042.252
Bonds 15,215,526 - 1.346.527 19.140.457 - 20.486.984
Financial lease
liabilities 4,795,262 408.964 1.140.215 4.141.977 - 5.691.156
Trade payables 790,800 790.800 - - - 790.800
56.923.552 3.901.194 10.670.748 53.931.397 1.507.853 70.011.192
(iv) Market risk
Market risk is the risk that changes in market prices, such as foreign exchange rates
and interest rates will affect the Company‟s income or the value of its holdings of
financial instruments. The objective of market risk management is to manage and
control market risk exposures within acceptable parameters, while optimising the
return.
The Company incurs financial liabilities to manage market risk. All such transactions
The effect on profit before taxes
Increase/decrease
of USD exchange
rate
Increase
In thousands of
tenge
Decrease
In thousands of
tenge
2014 +20% - (7.532.762)
-20% 7.532.762 -
2013 +20% - (9.295.036)
-20% 9.295.036 -
(v) Interest rate risk
Changes in interest rates impact primarily loans and borrowings by changing either
their fair value (fixed rate debt) or their future cash flows (variable rate debt). The
management of the Company, when managing interest risks investigates the
changes of the rates on financial instruments, which may significantly affect the
positions with respect to this risk. For that the Company performs the analysis of
the scenarios, including potential effects of the changes in the interactions between
the types of interest risks and the general level of the exposure to interest risk, in
particular, the ratio of allocation of the interest risks of the Company between the

loans with the fixed and variable interest rates. However, at the time of raising new
loans or borrowings management uses its judgment to decide whether it believes that
a fixed or variable rate would be more favourable to the Company over the expected
period until maturity.
Exposure to interest rate risk
At the reporting date the interest rate profile of the Company‟s interest-bearing
financial instruments was as follows:
(c) Master netting or similar agreements
The Company may enter into sales and purchase agreements with
the same counterparty in the normal course of business. The related amount
receivable and payable do not always meet the criteria for offsetting in the statement
of financial position. This is because the Company may not have legally enforceable
rights to offset recognised amounts, because the rights to offset may be enforceable
only on the occurrence of future events. In particular, in accordance with the
Kazakhstan civil law an obligation can be settled by offsetting against a similar claim
if it is due, has no maturity or is payable on demand, however such offsetting is not
possible in case of the insolvency of one of the parties to the contracts.
The settlement operation have not been significant as at reporting and
comparative periods except for deposit balances in the amount of KZT 85.000
thousand (2013: 1.003.701 thousand) and balances on current accounts in the amount
of KZT 325.774 thousand (2013: 868.816 thousand) placed in Altyn Bank JSC.
53
Notes to the financial statement
Carrying amounts
In thousands of tenge 2014 2013
Fixed rate instruments
Financial assets 3.367.300 2.296.643
Financial liabilities (27.021.104) (19.274.444)
(23.653.804) (16,977.801)
Variable rate instruments
Financial liabilities (36.555.635) (36.858.308)
Fair value sensitivity analysis for fixed rate instruments
The Company does not account for any fixed-rate financial instruments as fair value
through profit or loss or as available-for-sale. Therefore a change in interest rates at
the reporting date would not have an effect in profit or loss or in equity. Therefore a
change in interest rates at the reporting date would not affect profit or loss or equity.
Cash flow sensitivity analysis for variable rate instruments
A reasonably possible change of 100 basis points in interest rates at the reporting
date would have increased (decreased) equity and profit or loss net of taxes by the
amounts shown below. This analysis assumes that all other variables, in particular
foreign currency rates, remain constant. Profit or loss
In thousands of tenge
100 bp
increase
100 bp
decrease
2014
Variable rate instruments (365.556) 365.556
Cash flow sensitivity (net value) (365.556) 365.556
2013
Variable rate instruments (368.583) 368.583
Cash flow sensitivity (net value) (368.583) 368.583

24 FAIR VALUE AND RISK MANAGEMENT, CONTINUED
(c) Master netting or similar agreements, continued
The table below shows financial assets and financial liabilities subject to enforceable master netting arrangements and similar arrangements as at 31 December 2014:
54
’000 KZT
Types of financial
assets/financial liabilities
Gross amounts of
recognised financial
asset/liability
Gross amount of recognised
financial liability/asset offset
in the statement of financial
position
Net amount of financial
assets/liabilities presented
in the statement of
financial position
Related amounts not offset in the
consolidated statement of financial
position
Financial
instruments Cash collateral Net amount
Short-term bank deposit 85.000 - 85.000 - 85.000 85.000
Cash and cash equivalents 325.774 - 325.774 - 325.774 325.774
Total financial assets 410.774 - 410.774 - 410.774 410.774
Loans and borrowings (18.674.677) - (18.674.677) - 293.501 (18,381,166)
Bonds (17.862.890) - (17.862.890) - 117.273 (17.745.617)
Total financial liabilities (36.537.557) - (36.537.557) - 410.774 (36,126,783)
The table below shows financial assets and financial liabilities subject to enforceable master netting arrangements and similar arrangements as at 31 December 2013:
’000 KZT
Types of financial
assets/financial liabilities
Gross amounts of
recognised financial
asset/liability
Gross amount of
recognised financial
liability/asset offset in the
statement of financial
position
Net amount of financial
assets/liabilities
presented in the
statement of financial
position
Related amounts not offset in the
consolidated statement of financial
position
Financial
instruments Cash collateral Net amount
Short-term bank deposit 1.003.701 - 1.003.701 - 1.003.701 1.003.701
Cash and cash equivalents
868.816 - 868.816 - 868.816 868.816
Total financial assets
1.872.517 - 1.872.517 - 1.872.517 1.872.517
Loans and borrowings
(31.558.040) (31.558.040) - 578.572 (30.979.468)
Bonds (14.990.000) - (14.990.000) - 1.293.945 (13.696.055)
Total financial liabilities (46.548.040) - (46.548.040) - 1.872.517 (44.675.523)
Notes to the financial statement

25 CONTINGENCIES
(a) Insurance
The insurance industry in the Republic of Kazakhstan is in a developing state and
many forms of insurance protection common in other parts of the world are not yet
generally available. The Company does not have full coverage for its property, plant
and equipment and business interruption. Until the Company obtains adequate
insurance coverage, there is a risk that the loss or destruction of certain assets could
have a material adverse effect on the Company‟s operations and financial position.
(b) Taxation contingencies in Kazakhstan
The taxation system in Kazakhstan is relatively new and is characterised by frequent
changes in legislation, official pronouncements and court decisions, which are often
unclear, contradictory and subject to varying interpretation by different tax
authorities. Taxes are subject to review and investigation by various levels of
authorities, which have the authority to impose severe fines and penalties. A tax year
generally remains open for review by the tax authorities for ten subsequent calendar
years under newly amended tax law but under certain circumstances a tax year may
remain open longer.
Management believes that it has provided adequately for tax liabilities based on its
interpretations of applicable tax legislation, official pronouncements and court
decisions.
(c) Operating lease liabilities – the Company as a lessee
In 2012 the Company signed an office lease agreement. The term of the agreement is
5 years. The agreement contains the clause on lease term extension. The agreement
does not provide for any limitations with respect to the Company.
The future minimum lease payments under non-cancellable leases were payable as
follows.
(d) Loan covenants
In accordance with the terms of loan agreements signed between the Company and
its creditors, the Company shall observe certain financial and non-financial
covenants. Penalties may be charged for breach of such covenants, or the banks
may demand early repayment of financial liabilities. In order to mitigate such risks,
the Company performs monitoring of such financial and non-financial covenants.
As at 31 December 2014 and 2013 the Company was in compliance with all
financial and non-financial covenants.
(e) Litigations
The management are not aware of any significant existed or open litigations as well
as any potential claims against the Company.
26 RELATED PARTIES
(а) Ultimate controlling party
Mr. M. Zh. Sarsenov is the main stakeholder and ultimate
controlling party of the Company.
(b) Transactions with key management personnel
Key management remuneration
During 2014 the key management remuneration included salaries and short-term
payments in the amount of KZT 230.001 thousand (2013: KZT 99.783 thousand),
which are included in personnel costs (see Note 21).
(c) Other related party transactions
Below is the information on the Company with other related party transactions.
Related party transactions were made on terms agreed to between the parties that
may not necessarily be at market rates. Outstanding balances at the year-end are
unsecured, short-term and settlement occurs in cash.
For 2014 and 2013, the Company has not recorded any impairment of trade
accounts receivables relating to amounts owned by related parties. This assessment
is undertaken each financial year through examining the financial position of the
related party and the market in which the related party operates.
Sales and purchases with related parties and the balances with related parties
during 2014 and 2013 were as follows:
55
In thousands of tenge 2014 2013
During one year 154.363 112.608
From one to five years 154.363 337.824
308.726 450.432
Notes to the financial statement

Sales and purchases with related parties and the balances with related parties during
2013 and 2012 were as follows: (c) Other related party transactions, continued
On 17 July 2012 the Company provided 440 items of property, plant and
equipment with total carrying value of KZT 3.107.736 thousand to Eurasian
Development Bank as a security under a loan agreement concluded between
Eurasian Development Bank and Center for Wagon Service – Eskene LLP, an
entity under common control of the Company‟s ultimate controlling party (see
Note 6). In addition, under a tripartite project support agreement concluded
between the Company, Center for Wagon Service – Eskene LLP and Eurasian
Development Bank on 16 July 2012, the Company committed to provide technical
and personnel support to the project carried out by Center for Wagon Service –
Eskene LLP related to construction of wagon service center in Atyrau Oblast (see
Note 6).
In December 2013 the Company additionally provided to the Eurasian
Development Bank 500 items of machinery and equipment as a security for the
loan agreement. As at 31 December 2014 machinery and equipment with total
carrying amount of KZT 6.467.714 thousand (2013: KZT 6.868.722 thousand) in
the number of 940 items were provided to secure the loans received by the Center
of Wagon Service – Eskene LLP.
On 15 November 2013 the Company and Center of Wagon Service – Eskene LLP
signed the pledge agreement. According to the terms of the agreement the Center
of Wagon Service – Eskene LLP shall pay a one-off fee in the amount KZT
262.000 thousand to the Company for providing the security, and interest
calculated as 5% per annum during the period from 1 January 2014 and ending the
date of the release of the collateral.
On 22 January 2014 the Company and Center for Wagon Service – Eskene LLP
signed an additional agreement on abolishment of repayment from settlement of
5% per annum from 1 January 2014 ending to the date of encumbrance relief from
the collateral.
In 2013 the Company provided sponsorship to Charity Fund Zhakiya (see Note 20).
27 SUBSEQUENT EVENTS
On 11 March 2015 the Supervisory Board of the Company approved to repurchase
own securities of KZT 12.500.000 thousand.
56
Notes to the financial statement
In thousands of tenge 2014 2013
Statement of profit or loss and other comprehensive income
Ultimate controlling party - Mr. M. Zh. Sarsenov
Interest income on loans 2.088 -
Interest expenses on guarantees (Note 22) 626.196 311.377
Administrative expenses 163.163 236.256
Owner - Steinhardt Holding N.V.
Administrative expenses - 134.983
Owner - International Financial Corporation
Interest expense on loans 319.774 135.771
The Company under common control of the ultimate
controlling party - the Center for Wagon Service - Eskene
LLP
Other income - fee for collateral providing - 233.974
Cost - storage 3.529
Cost - expenses on the transportation of wheel pairs 804 750
PF Charity fund Zhakiya
Other income - rental income
Administrative expenses
107
747
80
65.000
Budan
Income - Operating services 120 -
Statement of financial position
Ultimate controlling party - Mr. M. Zh. Sarsenov
Loans and borrowings 146.000 -
Consideration receivable 2.339 -
Prepaid interest on the guarantees received 246.150 194.675
Owner - International Finance Corporation
Loans and borrowings 4.929.716 4.563.924
Company is under common control of the ultimate controlling
party - the Center for Wagon Service - Eskene LLP
Other receivables 262.000 262.024
Other current assets 172.281 93.500
Trade payables - 750

28 SIGNIFICANT ACCOUNTING POLICIES
The accounting policies set out below have been applied consistently to all periods
presented in these financial statements.
(а) Foreign currency translation
The financial statements are presented in tenge, which is the Company‟s functional
and presentation currency.
Transactions in foreign currencies are initially recorded at their respective functional
currency spot rates at the date the transaction first qualifies for recognition.
Monetary assets and liabilities denominated in foreign currencies are retranslated at
the functional currency rate of exchange ruling at the reporting date. Any exchange
gains and losses arising from assets and liabilities denominated in foreign currencies
subsequent to the date of the underlying transaction are credited or charged to the
statement of profit or loss and other comprehensive income.
Non-monetary items that are measured in terms of historical cost in a foreign
currency are translated using the exchange rates as at the dates of the initial
transactions.
Weighted average currency exchange rates established by the Kazakhstan Stock
Exchange (“KASE”) are used as official currency exchange rates in the Republic of
Kazakhstan.
The currency exchange rate of KASE as at 31 December 2014 was 182.35 tenge to 1
US Dollar, 3.17 tenge to 1 Russian Ruble and 221.97 tenge to 1 Euro. These rates
were used to translate monetary assets and liabilities denominated in US Dollars,
Russian Rubles and Euro as at 31 December 2014 (2013: 154.06 tenge to 1 US
Dollar, 4.68 tenge to 1 Russian Ruble and 212.02 tenge to 1 Euro, respectively).
(b) Property, plant and equipment
Property, plant and equipment are initially recorded at cost, net of accumulated
depreciation and accumulated impairment losses, if any. Such cost includes the cost
of replacing part of the property, plant and equipment and borrowing costs for long-
term construction projects if the recognition criteria are met. When significant parts
of property, plant and equipment are required to be replaced at intervals, the
Company recognizes such parts as individual assets with specific useful lives and
depreciates them accordingly. Likewise, when a major inspection is performed, its
cost is recognised in the carrying amount of the plant and equipment as a replacement
if the recognition criteria are satisfied. All other repair and maintenance costs are
recognised in profit or loss as incurred.
Subsequent to initial recognition, machinery and equipment are measured at
revalued amounts, being their fair value at the date of revaluation less any
subsequent accumulated depreciation and impairment losses. Valuations are
performed with sufficient frequency to ensure that the fair value of a revalued asset
does not differ materially from its carrying amount.
A revaluation surplus is recorded in other comprehensive income and credited to
the asset revaluation reserve in equity. However, to the extent that it reverses a
revaluation deficit of the same asset previously recognised in profit or loss, the
increase is recognised in profit and loss. A revaluation deficit is recognised in the
statement of profit or loss and other comprehensive income, except to the extent
that it offsets an existing surplus on the same asset recognised in the asset
revaluation reserve.
An annual transfer from the asset revaluation reserve to retained earnings is made
for the difference between depreciation based on the revalued carrying amount of
the asset and depreciation based on the asset‟s original cost. As at the revaluation
date the accumulated depreciation is restated proportionately with the change in the
gross carrying amount of the asset so that the carrying amount of the asset after
revaluation equals its revalued amount. Upon disposal, any revaluation reserve
relating to the particular asset being sold is transferred to retained earnings.
Depreciation is calculated on a straight-line basis over the estimated useful lives of
the assets as follows:
57
Notes to the financial statement
Years
Machinery and equipment 15-40
Other 3-15
An item of property, plant and equipment and any significant part initially
recognised is derecognised upon disposal or when no future economic benefits are
expected from its use or disposal. Any gain or loss arising on derecognition of the
asset (calculated as the difference between the net disposal proceeds and the
carrying amount of the asset) is included in the statement of profit or loss and other
comprehensive income when the asset is derecognised.
The residual values, useful lives and methods of depreciation of property, plant and
equipment are reviewed at each financial year end and adjusted prospectively, if
appropriate.
(c) Impairment of non-financial assets
The Company assesses, at each reporting date, whether there is an indication that an
asset may be impaired. If any indication exists, or when annual impairment testing for
an asset is required, the Company estimates the asset‟s recoverable amount. An
asset‟s recoverable amount is the higher of an asset or cash-generating unit (CGU)
fair value less costs to sell and its value in use. Recoverable amount is determined for
an individual asset, unless the asset does not generate cash inflows that are largely
independent of those from other assets or groups of assets. When the carrying amount
of an asset or CGU exceeds its recoverable amount, the asset is considered impaired
and is written down to its recoverable amount.
In assessing value in use, the estimated future cash flows are discounted to their
present value using a pre-tax discount rate that reflects current market assessments of
the time value of money and the risks specific to the asset. In determining fair value
less costs to sell, recent market transactions are taken into account. If no such
transactions can be identified, an appropriate valuation model is used. These
calculations are corroborated by valuation multiples, quoted share prices for publicly
traded companies or other available fair value indicators.
The Company bases its impairment calculation on detailed budgets and forecast
calculations, which are prepared separately for each of the Company‟s CGUs to
which the individual assets are allocated. These budgets and forecast calculations
generally cover a period of five years. For longer periods, a long-term growth rate is
calculated and applied to project future cash flows after the fifth year.
Impairment losses of continuing operations, including impairment on inventories, are
recognised in the statement of comprehensive income in expense categories
consistent with the function of the impaired asset, except for a property previously
revalued when the revaluation was taken to other comprehensive income. In this case,
the impairment loss is also recognised in other comprehensive income up to the
amount of any previous revaluation.
For assets an assessment is made at each reporting date to determine whether there is
an indication that previously recognised impairment losses no longer exist or have
decreased. If such indication exists, the Company estimates the asset‟s or CGU‟s
recoverable amount. A previously recognised impairment loss is reversed only if
there has been a change in the assumptions used to determine the asset‟s recoverable
amount since the last impairment loss was recognised. The reversal is limited so that
the carrying amount of the asset does not exceed its recoverable amount, nor
exceed the carrying amount that would have been determined, net of depreciation,
had no impairment loss been recognised for the asset in prior years. Such reversal
is recognised in the statement of profit or loss and other comprehensive income
unless the asset is carried at a revalued amount, in which case, the reversal is
treated as a revaluation increase.
(d) Financial assets
Initial recognition and measurement
Financial assets within the scope of IAS 39 are classified as loans and receivables
or held-to-maturity investments, as appropriate. The Company determines the
classification of its financial assets at initial recognition.
All financial assets are recognised initially at fair value plus transaction costs,
except in the case financial assets recorded at fair value through profit or loss.
The Company‟s financial assets include cash and short-term deposits, trade and
other receivables and loans receivable.
Subsequent measurement
The subsequent measurement of financial assets depends on their classification as
described below:
Loans and receivables
Loans and receivables are non-derivative financial assets with fixed or
determinable payments that are not quoted in an active market. After initial
measurement, such financial assets are subsequently measured at amortised cost
using the effective interest rate method (EIR). Amortised cost is calculated by
taking into account any discount or premium on acquisition and fees or costs that
are an integral part of the EIR. The EIR amortisation is included in finance income
in the statement of profit and loss and other comprehensive income. The losses
arising from impairment are recognised in the statement of profit and loss and other
comprehensive income in finance costs for loans and in cost of sales or other
operating expenses for receivables.
Cash and cash equivalents
Cash and cash equivalents in the statement of financial position comprise cash at
banks and on hand. For the purpose of the statement of cash flows, cash and cash
equivalents consist of cash and short-term deposits with maturities of three months
as defined above, net of outstanding bank overdrafts.
58
Notes to the financial statement

(e) Impairment of financial assets
The Company assesses at each reporting date whether there is any objective evidence
that a financial asset or a group of financial assets is impaired. A financial asset or a
group of financial assets is deemed to be impaired if there is objective evidence of
impairment as a result of one or more events that has occurred since the initial
recognition of the asset (an incurred „loss event‟) and that loss event has an impact on
the estimated future cash flows of the financial asset or the group of financial assets
that can be reliably estimated. Evidence of impairment may include indications that
the debtors or a group of debtors is experiencing significant financial difficulty,
default or delinquency in interest or principal payments, the probability that they will
enter bankruptcy or other financial reorganisation and observable data indicating that
there is a measurable decrease in the estimated future cash flows, such as changes in
arrears or economic conditions that correlate with defaults.
Financial assets carried at amortised cost
For financial assets carried at amortised cost, the Company first assesses whether
objective evidence of impairment exists individually for financial assets that are
individually significant, or collectively for financial assets that are not individually
significant. If the Company determines that no objective evidence of impairment
exists for an individually assessed financial asset, whether significant or not, it
includes the asset in a group of financial assets with similar credit risk characteristics
and collectively assesses them for impairment. Assets that are individually assessed
for impairment and for which an impairment loss is, or continues to be, recognised
are not included in a collective assessment of impairment.
If there is objective evidence that an impairment loss has incurred, the amount of the
loss is measured as the difference between the asset‟s carrying amount and the
present value of estimated future cash flows (excluding future expected credit losses
that have not yet been incurred). The present value of the estimated future cash flows
is discounted at the financial assets original effective interest rate. If a loan has a
variable interest rate, the discount rate for measuring any impairment loss is the
current EIR.
The carrying amount of the asset is reduced through the use of an allowance account
and the loss is recognised in the statement of comprehensive income. Interest income
continues to be accrued on the reduced carrying amount and is accrued using the rate
of interest used to discount the future cash flows for the purpose of measuring the
impairment loss. The interest income is recorded as finance income in the
statement of profit or loss and other comprehensive income. Loans together with
the associated allowance are written off when there is no realistic prospect of future
recovery and all collateral has been realised or has been transferred to the
Company. If, in a subsequent year, the amount of the estimated impairment loss
increases or decreases because of an event occurring after the impairment was
recognised, the previously recognised impairment loss is increased or reduced by
adjusting the allowance account. If a future write-off is later recovered, the
recovery is credited to finance costs in the statement of profit or loss and other
comprehensive income.
(f) Financial liabilities
Initial recognition and measurement
Financial liabilities within the scope of IAS 39 are classified as financial liabilities
at fair value through profit or loss, and other financial liabilities, as appropriate.
The Company determines the classification of its financial liabilities at initial
recognition.
All financial liabilities are recognised initially at fair value and, in the case of loans
and borrowings, net of directly attributable transaction costs.
The Company‟s financial liabilities include trade and other payables, finance lease
liabilities and borrowings.
Subsequent measurement
The measurement of financial liabilities depends on their classification as described
below:
Loans and borrowings
After initial recognition, interest bearing loans and borrowings are subsequently
measured at amortised cost using the EIR method. Gains and losses are recognised
in the statement of profit and loss and other comprehensive income when the
liabilities are derecognised as well as through the EIR amortisation process.
Amortised cost is calculated by taking into account any discount or premium on
acquisition and fees or costs that are an integral part of the EIR. The EIR
amortisation is included in finance costs in the statement of profit or loss and other
comprehensive income.
59
Notes to the financial statement

Trade and other payables
Liabilities for trade and other amounts payable are recognized at cost which is the fair
value of the consideration to be paid in the future for goods and services received,
whether or not billed to the Company.
(g) Embedded derivative financial instruments
Embedded derivatives are separated from the host contract and accounted for
separately if the economic characteristics and risks of the host contract and the
embedded derivative are not closely related, a separate instrument with the same
terms as the embedded derivative would meet the definition of a derivative, and the
combined instrument is not measured at fair value through profit or loss.
Derivatives are recognised initially at fair value at the transaction date and subsequent
to initial recognition, derivatives are measured at fair value. All derivatives in a net
receivable position (positive fair value) are reported as assets. All derivatives in a net
payable position (negative fair value) are reported as liabilities.
Changes in the fair value of embedded derivatives are recognised immediately in
profit or loss.
Although the Company trades in derivative instruments for risk hedging purposes,
these instruments do not qualify for hedge accounting.
(h) Derecognition of financial assets and liabilities
Financial assets
A financial asset (or, where applicable a part of a financial asset or part of a group of
similar financial assets) is derecognised when:
the rights to receive cash flows from the asset have expired;
the Company has transferred its rights to receive cash flows from the asset or has
assumed an obligation to pay the received cash flows in full without material delay to
a third party under a “pass-through” arrangement; and either (a) the Company has
transferred substantially all the risks and rewards of the asset, or (b) the Company has
neither transferred nor retained substantially all the risks and rewards of the asset, but
has transferred control of the asset.
When the Company has transferred its rights to receive cash flows from an asset or
has entered into a pass-through arrangement, it evaluates if and to what extent it has
retained the risks and rewards of ownership. When it has neither transferred nor
retained substantially all of the risks and rewards of the asset, nor transferred control
of the asset, the asset is recognised to the extent of the Company‟s continuing
involvement in the asset. In that case, the Company also recognises an associated
liability. The transferred asset and the associated liability are measured on a basis
that reflects the rights and obligations that the Company has retained.
Continuing involvement that takes the form of a guarantee over the transferred
asset is measured at the lower of the original carrying amount of the asset and the
maximum amount of consideration that the Company could be required to repay.
Financial liabilities
A financial liability is derecognised when the obligation under the liability is
discharged or cancelled or expires.
When an existing financial liability is replaced by another from the same lender on
substantially different terms, or the terms of an existing liability are substantially
modified, such an exchange or modification is treated as the derecognition of the
original liability and the recognition of a new liability. The difference in the
respective carrying amounts is recognised in the statement of profit or loss and
other comprehensive income.
(i) Offsetting of financial instruments
Financial assets and financial liabilities are offset and the net amount is reported in
the statement of financial position if there is a currently enforceable legal right to
offset the recognised amounts and there is an intention to settle on a net basis, to
realise the asset and settle the liability simultaneously.
(j) Fair value of financial instruments
The fair value of financial instruments that are traded in active markets at each
reporting date is determined by reference to quoted market prices or dealer price
quotations (bid price for long positions and ask price for short positions), without
any deduction for transaction costs.
For financial instruments not traded in an active market, the fair value is
determined using appropriate valuation techniques. Such techniques may include
Using recent arm‟s length market transactions;
Reference to the current fair value of another instrument that is substantially the
same
A discounted cash flow analysis or other valuation models.
Analysis of fair value of financial instruments and additional information of the
methods of its measurement are disclosed in Note 24.
60
Notes to the financial statement

(k) Inventories
Inventories are valued at the lower of cost or net realisable value. Costs include
charges incurred in bringing inventory to its present location and condition. Net
realisable value is the estimated selling price in the ordinary course of business, less
the estimated costs of completion and estimated costs necessary to make the sale. The
same cost formula is used for all inventories having a similar nature and use. All
inventories are valued on the FIFO basis.
(l) Leases
The determination of whether an arrangement is, or contains, a lease is based on the
substance of the arrangement at inception date. The arrangement is assessed for
whether the fulfilment of the arrangement is dependent on the use of a specific asset
or assets or the arrangement conveys a right to use the asset, even if that right is not
explicitly specified in an arrangement.
Company as a lessee – finance lease
Finance leases that transfer substantially all the risks and benefits incidental to
ownership of the leased item to the Company, are capitalised at the commencement
of the lease at the fair value of the leased property or, if lower, at the present value of
the minimum lease payments. Lease payments are apportioned between finance
charges and reduction of the lease liability so as to achieve a constant rate of interest
on the remaining balance of the liability. Finance charges are recognised in finance
costs in the statement of profit or loss and other comprehensive income.
A leased asset is depreciated over the useful life of the asset. However, if there is no
reasonable certainty that the Company will obtain ownership by the end of the lease
term, the asset is depreciated over the shorter of the estimated useful life of the asset
and the lease term.
Company as a lessee – operating lease
Operating lease payments are recognised as an operating expense in the statement of
profit or loss and other comprehensive income on a straight-line basis over the lease
term.
Company as a lessor – operating lease
Leases in which the Company does not transfer substantially all the risks and benefits
of ownership of an asset are classified as operating leases. Initial direct costs incurred
in negotiating an operating lease are added to the carrying amount of the leased asset
and recognised over the lease term on the same basis as rental income. Contingent
rents are recognised as revenue in the period in which they are earned.
(m) Provisions
General
Provisions are recognised when the Company has a present obligation (legal or
constructive) as a result of a past event, it is probable that an outflow of resources
embodying economic benefits will be required to settle the obligation and a reliable
estimate can be made of the amount of the obligation. Where the Company expects
some or all of a provision to be reimbursed, for example under an insurance
contract, the reimbursement is recognised as a separate asset but only when the
reimbursement is virtually certain. The expense relating to any provision is
presented in the statement of profit or loss and other comprehensive income net of
any reimbursement.
If the effect of the time value of money is material, provisions are discounted using
a current pre-tax rate that reflects, where appropriate, the risks specific to the
liability. Where discounting is used, the increase in the provision due to the passage
of time is recognised as a finance cost.
(n) Employee benefits
The Company does not have any pension arrangements separate from the state
pension system of the Republic of Kazakhstan, which requires current
contributions by the employer calculated as a percentage of current gross salary
payments; such expense is charged in the period the related salaries are earned. The
Company has no post-retirement benefits or other compensated benefits requiring
accrual. The Company pays social tax according to the current statutory
requirements of the Republic of Kazakhstan. Social tax is expensed as incurred.
(o) Dividends
Dividends are recognised as a liability and deducted from equity at the reporting
date only if they are approved before or on the reporting date. Dividends are
disclosed when they are proposed before the reporting date or proposed or declared
after the reporting date but before the financial statements are authorised for issue.
(p) Revenue recognition
Revenue is recognised to the extent that it is probable that the economic benefits
will flow to the Company and the revenue can be reliably measured, regardless of
when the payment is being made. Revenue is measured at the fair value of the
consideration received or receivable, taking into account contractually defined
terms of payment and excluding taxes or duty. The Company assesses its revenue
arrangements against specific criteria in order to determine if it is acting as
61
Notes to the financial statement

principal or agent. The Company has concluded that it is acting as a principal in all of
its revenue arrangements. The following specific recognition criteria must also be met
before revenue is recognised:
Rental income
Rental income arising from operating leases of rolling stock is accounted for on a
straight line basis over the lease term and is included in revenue line in the statement
of profit or loss and other comprehensive income.
Rendering of services
In respect of services revenue is recognized by reference to the stage of completion at
the reporting date provided that the stage of completion and the amount of revenue
can be measured reliably.
(q) Expense recognition
Expenses are accounted for at the time the actual flow of the related goods or services
occur, regardless of when cash or its equivalent is paid, and are reported in the
financial statements in the period to which they relate.
(r) Finance income and costs
The Company‟s finance income and finance costs include:
interest income;
income from subsidies;
discount of loans issued to employees;
interest expense;
Interest income and expense shall be recognized by the interest effective rate method.
(s) Government grants
Government grants provided to compensate the Company for the finance expenses
incurred are recognised initially as deferred income at fair value when there is
reasonable assurance that they will be received and that the Company will comply
with the conditions associated with the grant. Respective grant receivables are then
amortised and discount is recognised in finance income during the term of the
subsidised loan.
(t) Borrowing costs
Borrowing costs directly attributable to the acquisition, construction or production of
an asset that necessarily takes a substantial period of time to get ready for its intended
use or sale are capitalised as part of the cost of the respective assets. All other
borrowing costs are expensed in the period they occur. Borrowing costs consist of
interest and other costs that an entity incurs in connection with the borrowing of
funds.
(u) Income tax expense
Current income tax
Current income tax assets and liabilities for the current period are measured at the
amount expected to be recovered from or paid to the taxation authorities. The tax
rates and tax laws used to compute the amount are those that are enacted or
substantively enacted, at the reporting date in the countries where the Company
operates and generates taxable income. Current income tax relating to items
recognised directly in equity is recognised in equity and not in the statement of
profit or loss and other comprehensive income.
Management periodically evaluates positions taken in the tax returns with respect
to situations in which applicable tax regulations are subject to interpretation and
establishes provisions where appropriate.
Deferred income tax
Deferred tax is provided using the liability method on temporary differences
between the tax bases of assets and liabilities and their carrying amounts for
financial reporting purposes at the reporting date.
Deferred income tax liabilities are recognised for all taxable temporary differences,
except:
•When the deferred income tax liability arises from the initial recognition of
goodwill or of an asset or liability in a transaction that is not a business
combination and, at the time of the transaction, affects neither the accounting profit
nor taxable profit or loss; and
•In respect of taxable temporary differences associated with investments in
subsidiaries, associates and interests in joint ventures, where the timing of the
reversal of the temporary differences can be controlled and it is probable that the
temporary differences will not reverse in the foreseeable future.
Deferred tax assets are recognised for all deductible temporary differences, the
carry forward of unused tax credits and any unused tax losses. Deferred tax assets
are recognised to the extent that it is probable that taxable profit will be available
against which the deductible temporary differences, and the carry forward of
unused tax credits and unused tax losses can be utilised, except:
62
Notes to the financial statement

• When the deferred income tax asset relating to the deductible temporary
difference arises from the initial recognition of an asset or liability in a transaction
that is not a business combination and, at the time of the transaction, affects
neither the accounting profit nor taxable profit or loss;
• In respect of deductible temporary differences associated with investments in
subsidiaries, associates and interests in joint ventures, deferred income tax assets
are recognised only to the extent that it is probable that the temporary differences
will reverse in the foreseeable future and taxable profit will be available against
which the temporary differences can be utilised.
The carrying amount of deferred income tax assets is reviewed at each balance sheet
date and reduced to the extent that it is no longer probable that sufficient taxable
profit will be available to allow all or part of the deferred income tax asset to be
utilised. Unrecognised deferred income tax assets are reassessed at each balance
sheet date and are recognised to the extent that it has become probable that future
taxable profit will allow the deferred tax asset to be recovered.
Deferred income tax assets and liabilities are measured at the tax rates that are
expected to apply to the year when the asset is realised or the liability is settled,
based on tax rates (and tax laws) that have been enacted or substantively enacted
at the reporting date.
Deferred tax relating to items recognised outside profit or loss is recognised outside
profit or loss. Deferred tax items are recognised in correlation to the underlying
transaction either in profit or loss and other other comprehensive income or
directly in equity.
Deferred income tax assets and deferred income tax liabilities are offset if a legally
enforceable right exists to set off current tax assets against current income tax
liabilities and the deferred taxes relate to the same taxable entity and the same
taxation authority.
Tax benefits acquired as part of a business combination, but not satisfying the criteria
for separate recognition at that date, are recognised subsequently if new
information about facts and circumstances changed. The adjustment is either be
treated as a reduction to goodwill (as long as it does not exceed goodwill) if it
incurred during the measurement period or recognised in profit or loss.
29 NEW STANDARDS AND INTERPRETATIONS NOT YET
ADOPTED
A number of new Standards, amendments to Standards and Interpretations are not
yet effective as at 31 December 2014, and have not been applied in preparing these
consolidated financial statements. Of these pronouncements, potentially the
following will have an impact on the Company‟s operations. The Company plans
to adopt these pronouncements when they become effective.
IFRS 9, published in July 2014, replaces the existing guidance in IAS 39 Financial
Instruments: Recognition and Measurement. IFRS 9 includes revised guidance on
the classification and measurement of financial instruments, including a new
expected credit loss model for calculating impairment on financial assets, and the
new general hedge accounting requirements. It also carries forward the guidance
on recognition and derecognition of financial instruments from IAS 39. IFRS 9 is
effective for annual reporting periods beginning on or after 1 January 2018, with
early adoption permitted.
IFRS 15 establishes a comprehensive framework for determining whether, how
much and when revenue is recognised. It replaces existing revenue recognition
guidance, including IAS 18 Revenue, IAS 11 Construction Contracts and IFRIC 13
Customer Loyalty Programs. The core principle of the new standard is that an
entity recognises revenue to depict the transfer of promised goods or services to
customers in an amount that reflects the consideration to which the entity expects
to be entitled in exchange for those goods or services. The new standard results in
enhanced disclosures about revenue, provides guidance for transactions that were
not previously addressed comprehensively and improves guidance for multiple-
element arrangements. IFRS 15 is effective for annual reporting periods beginning
on or after 1 January 2017, with early adoption permitted.
63
Notes to the financial statement

Additional information
64

KTZ – «Kazakhstan Temir Zholy» JSC
TSO – «Tengizchevroil» LLP
IFC – International Finance Corporation
LSE – London Stock Exchange
KASE - Kazakhstan Stock Exhange
USD, $ - National currency of the United States of America.
blrd. – billion
mln. – million
th. – thousand
un. – unit
b.w. – Beats. weight.
Km. – Kilometers
Km/h – Kilometers in hour
Ebitda - Earnings before Interest, Taxes, Depreciation and Amortization
Ebit - Earnings before Interest, Taxes
IPO - Initial Public Offering
DSCR – Debt Service Cover Ratio
LPG – Liquefied carbon dioxide
RTW – Railway Transport wagon
F – Forecast
Y-to-y – year to year
Glossary
65

«EASTCOMTRANS» LLP:
Legal address:
050040, Republic of Kazakhstan, Almaty,
Al-Farabi 77/7 BC "Esentai Tower" n.p. 11a
Mailing address:
LLP "Eastcomtrans"
Registered address:
050040, Republic of Kazakhstan, Almaty,
Al-Farabi 77/7, BC "Esentai Tower" n.p. 11a
Tel.: +7 (727) 3-555-111
Fax: +7 (727) 3-555-222
E-mail: [email protected]
www.ect.kz
CREATE THE FURTURE TOGETHER
REGISTRAR:
JSC “The Integrated Securities Registrar"
Address: 050000, Republic of Kazakhstan,
Almaty, Abylai Khan, d 141
Tel.: +7 (727) 2-724-760
Fax: +7 (727) 2-724-766
www.tisr.kz
AUDITOR
«KPMG Audit» LLP
Address: 050051, Republic of Kazakhstan,
Almaty, Dostyk ave 180, BC "Koktem"
Tel.: +7 (727) 2-980-898
Fax: +7 (727) 2-980-708
www.kpmg.com/kz
Contact Information
66