Embed Size (px)
Citation preview
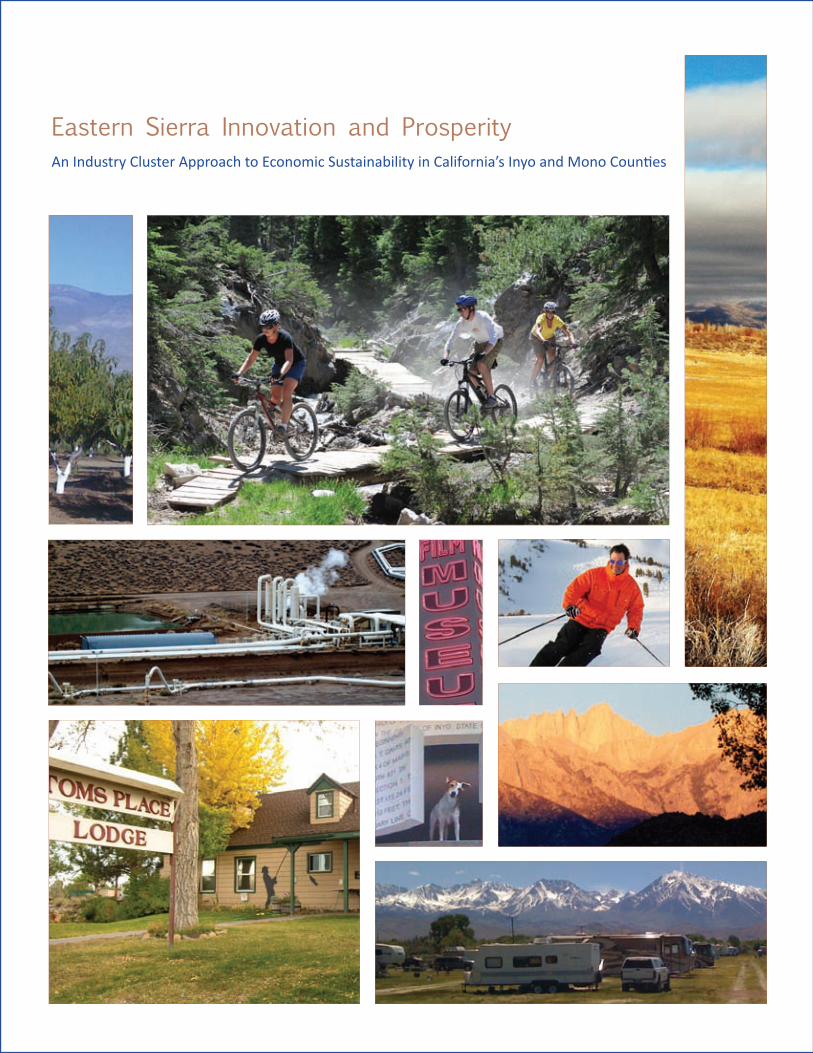
Eastern Sierra Innovation and Prosperity
An Industry Cluster Approach to Economic Sustainability in California’s
Inyo and Mono Counties
September 2012

Eastern Sierra Innovation and ProsperityAn Industry Cluster Approach to Economic Sustainability in California’s Inyo and Mono Counties
4
Acknowledgements
This project was funded through the generous donations of Sierra Business Council members, private funders, and the Donald Slager Foundation of Bishop, California.
Joe Marlow of the Sonoran Institute mined considerable economic data and completed the economic analysis.
Los Angeles Department of Water and Power along with Inyo County Superin-tendent of Schools generously donated conference facilities.
Great Basin Bakery fueled the meetings with coffee and excellent baked goods.
Simply Delish Catering kicked off the initial meeting with a hearty lunch.
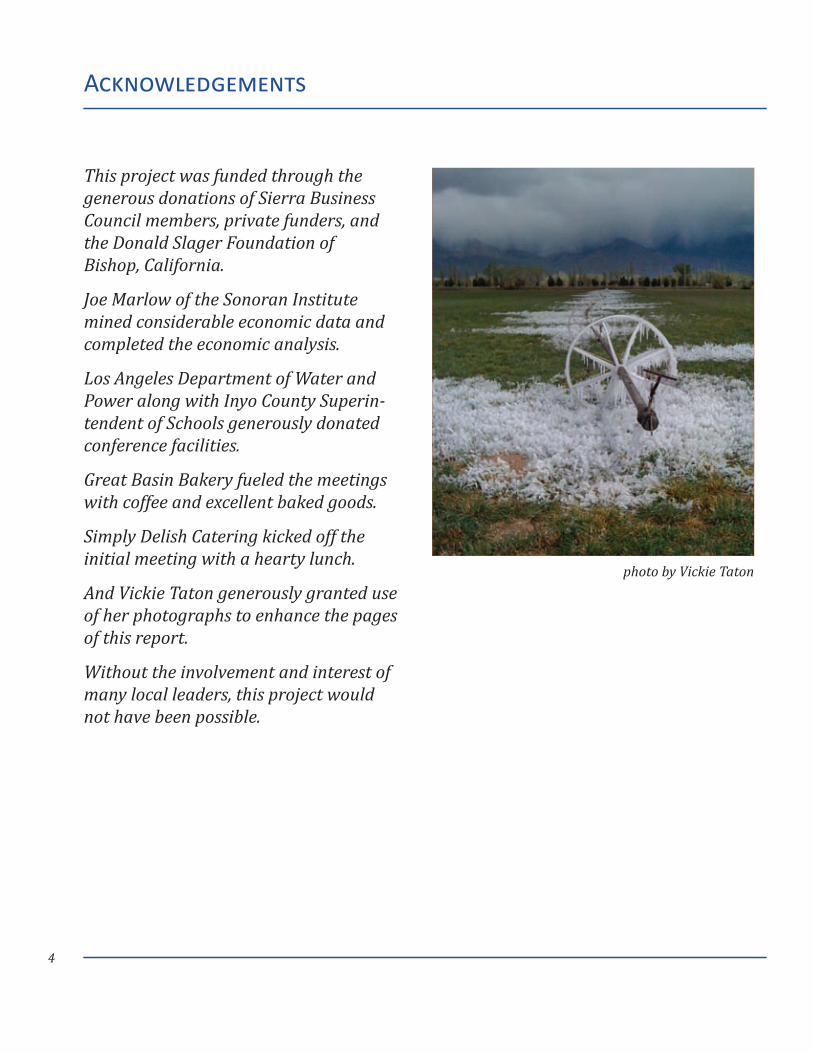
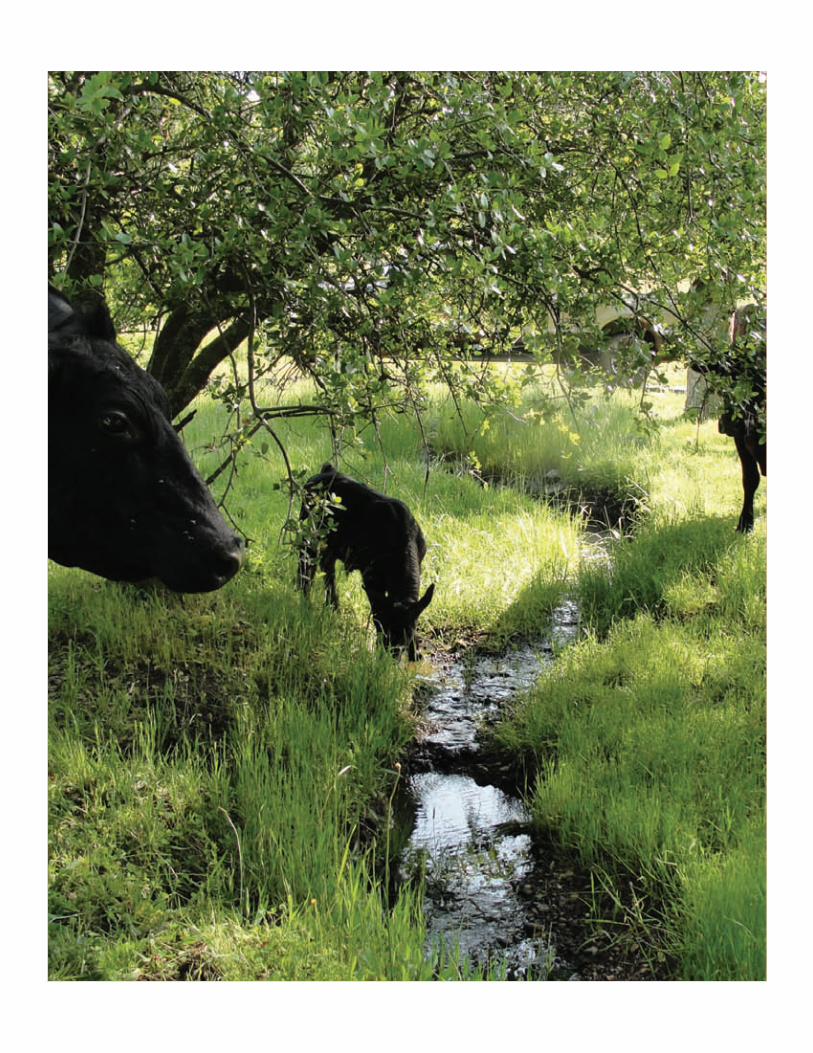
And Vickie Taton generously granted use of her photographs to enhance the pages of this report.
Without the involvement and interest of many local leaders, this project would not have been possible.
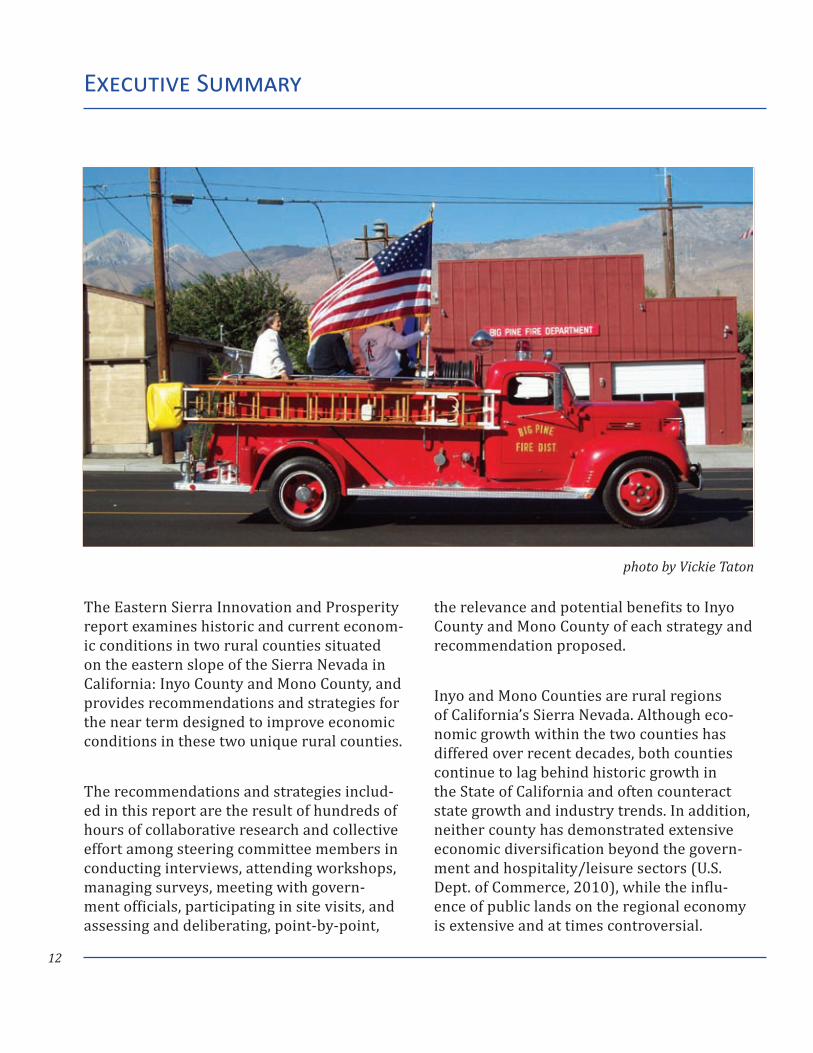
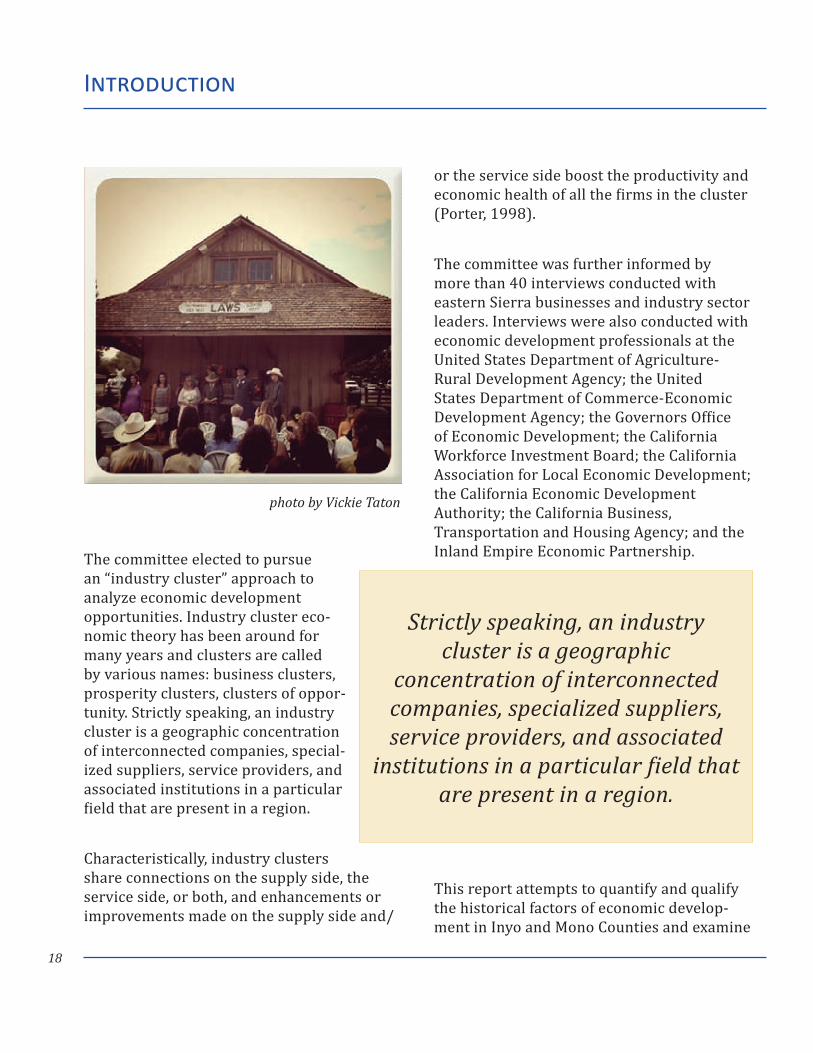
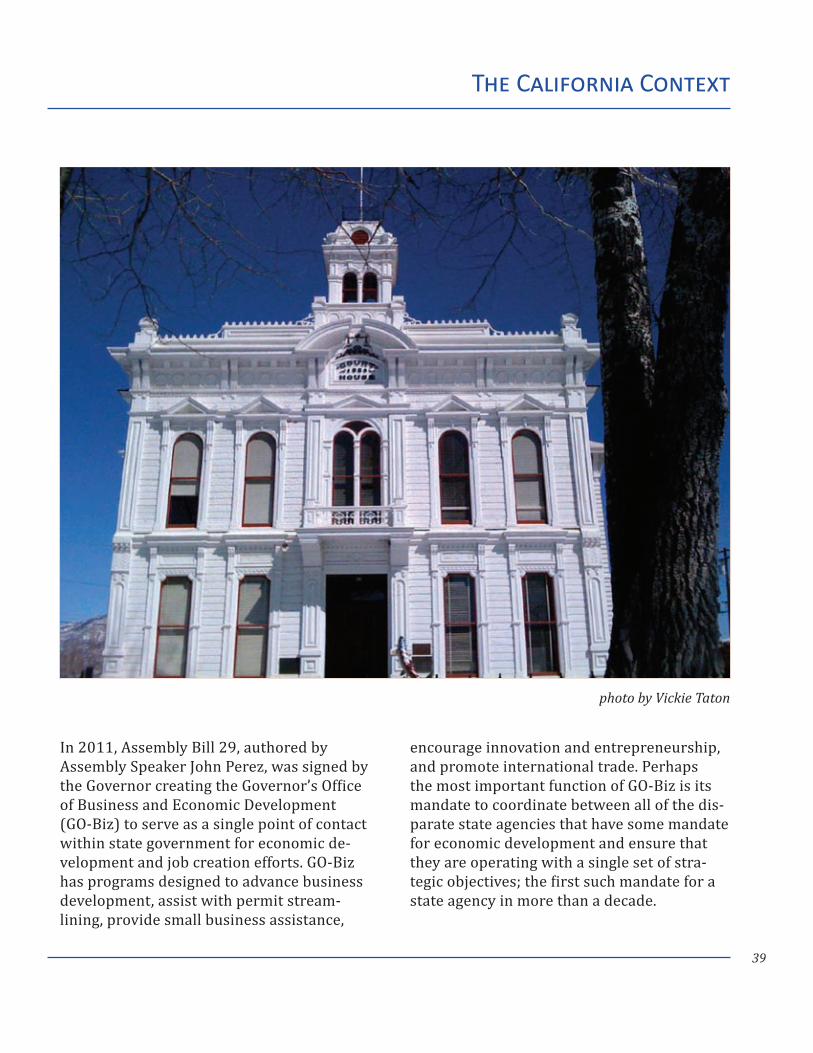
photo by Vickie Taton
5
Dick Arruda TerraGen Power Co.
Cheri Bromberger June Lake Motel
Keith Caldwell City of Bishop
Kevin Carrunchio Inyo County
Stacy Corless Friends of the Inyo
Nicole DeJonghe Sierra Business Council
Chris Ellis Coso Operating Company
Susan Estrada Consultant: Eastern Sierra Connect Steve Frisch Sierra Business Council
Gary Giacomini Rancher
Elizabeth Glazner Inyo Contractors & Vendors Associa-tion
Jeff Griffiths City of Bishop
Tim Hansen Mono County District 4
Lisa Isaacs ESCIA
Daniel Johnson TerraGen Power Co.
Jon Klusmire Inyo Co. Museums
Bernadette Lovato Bureau of Land Management
Dan Lyster Mono County Economic Development
Joe Marlow Sonoran Institute
Terry McAteer Inyo County Superintendent of Schools
Sally Miller Mono County Planning Commission George Milovich Inyo-Mono Agriculture Commission
Dave Moose Bishop Paiute Tribe
Gaye Mueller Mono County Arts Council
Bob Peters Bridgeport Inn
Allan Pietrasanta J. Rousek Toy Company
Chris Plakos LADWP
Rodger Prominski TerraGen Power Co.
Jon Ruggelbrugge Inyo National Forest
Brandon Shults Inyo County
Jim Southworth City of Bishop
Dan Stewart Inyo County Planning
David Stottlemyre City of Bishop
Danna Stroud Consultant
Vickie Taton Sierra Business Council
Tony Taylor Eastern Sierra Land Trust
John Urdi Mammoth Lakes Tourism
Alicia Vennos Mono County Tourism
John Wentworth MLTPA
Steering Committee ParticipantsEastern SierraNovember 2010 – May 2011
Acknowledgements
photo by Vickie Taton

Table of Contents
8
Table of Contents
Acknowledgements 4
Executive Summary 11
Introduction 15
Industry Cluster Concept Overview 29
Applying Clusters to Rural Economies 33
The California Context 37An Economic Growth and Competitiveness Agenda for California Guiding Principles 42 Key Strategies 43A Blueprint to Renew California: Key Strategies 44Thriving Regions Lead to a Thriving State: Key Strategies 46
Prosperity Clusters 49Criteria for Selecting Industry Clusters to target for development 50Leveraging Internet Technology and Broadband Access 51 Committee Recommendations 54 Strategies to Enhance Access to Broadband 58 Case Study: Clear Capital 62Meeting California’s Renewable Energy Standard 63 Committee Recommendations 68 Distributed Generation Strategies 70 Distributed Generation Strategies and General Plan Policy 72 Long Range Planning and Energy Policy 73 Case Study: Fowler, Colorado 76Finding Niches in Tourism, Hospitality and the Arts 77 Committee Recommendations 80 Metrics and Measuring Success 83 Case Study: Sierra Nevada Geotourism Project 85Diversifying Recreation 87 Committee Recommendations 91 Metrics and Measuring Success 94 Case Study: Tahoe Mountain Sports 98Encouraging Wellness through Value-Added Agriculture 100 Committee Recommendations 101 Case Study: Oregon House Farms and High Sierra Beef 103
9
Table of Contents
Commentary: Prosperity Clusters and Mining 105
Summary Economic Profile of Inyo and Mono Counties 109Economic Context 110Economic Summary of Inyo and Mono Counties 121Economic Benefits of Public Lands in Inyo and Mono Counties 136Social Indicators 145
Monitoring Progress and Evaluating Results 149
Funding Opportunities 153
Supporting Documentation 161
List of Tables, Figures and Images 169

photo by Vickie Taton
Executive Summary
12
Executive Summary
The Eastern Sierra Innovation and Prosperity report examines historic and current econom-ic conditions in two rural counties situated on the eastern slope of the Sierra Nevada in California: Inyo County and Mono County, and provides recommendations and strategies for the near term designed to improve economic conditions in these two unique rural counties.
The recommendations and strategies includ-ed in this report are the result of hundreds of hours of collaborative research and collective effort among steering committee members in conducting interviews, attending workshops, managing surveys, meeting with govern-ment officials, participating in site visits, and assessing and deliberating, point-by-point,
the relevance and potential benefits to Inyo County and Mono County of each strategy and recommendation proposed.
Inyo and Mono Counties are rural regions of California’s Sierra Nevada. Although eco-nomic growth within the two counties has differed over recent decades, both counties continue to lag behind historic growth in the State of California and often counteract state growth and industry trends. In addition, neither county has demonstrated extensive economic diversification beyond the govern-ment and hospitality/leisure sectors (U.S. Dept. of Commerce, 2010), while the influ-ence of public lands on the regional economy is extensive and at times controversial.
photo by Vickie Taton
13
Executive Summary
This report attempts to quantify and qualify historic factors of economic development in Inyo and Mono Counties and to examine current economic conditions to suggest areas of potential, sustainable growth throughout the region. In addition, this report attempts to describe the statewide economic develop-ment climate, current thinking in California about strategies for economic growth, and opportunities for Inyo and Mono Counties to leverage that thinking to improve conditions.
While opinions may vary on how to stimu-late economic activity within any particular region and sector — as this report’s com-mittee discovered — consensus was easily reached among all those who contributed to completion of this report: Substantial op-portunity for economic diversification and growth exists in both Inyo County and Mono County and efforts should focus on areas where the vast majority of stakeholders agree on strategies.
This report begins with a discussion of eco-nomic cluster theory including its prevalence in developing successful localized economic strategies, followed by a discussion of this theory’s application in rural regions where population densities are low and geographic distances are vast. The report then identi-fies in Inyo and Mono Counties five strategic economic clusters with potential to endure and grow, with strategies and recommenda-tions for nurturing endurance and growth within these clusters. Criteria for selection of these five clusters is also detailed. These five clusters identified as economic drivers with potential to endure and strengthen in Inyo
and Mono Counties are: Internet Technology and Broadband Access; Renewable Energy and Energy Efficiency; Tourism, Hospitality and the Arts; Recreation; and Agriculture. These clusters are interrelated in that growth in any one encourages growth in the others, with particular emphasis on Internet technol-ogy and broadband access opportunities in growing all five clusters.
The Digital 395 Middle Mile Project will create a potential increase in broadband access to 26,000 households and 2,500 busi-nesses throughout the Eastern Sierra and will enable Inyo and Mono County residents, busi-ness owners and visitors to participate in new business, healthcare and recreational activi-ties that without broadband have not been possible. The growth of e-commerce may well be the singlemost important opportunity to expand sales, profits and employment in rural small business in decades.
Inyo County and Mono County are also well positioned to prosper from investment in meeting California’s strict renewable energy and energy efficiency standards. Solar, geo-thermal and wind technologies are potential sources of economic growth for Inyo County and Mono County and have elsewhere con-tributed to local economic diversification and stability.
The recreation cluster is an area where resi-dents and business owners on the ground have already done a great deal of work. National trends in recent decades have shown visitation to public lands increasing.
14
Executive Summary
This trend, coupled with the extensive use of private recreational assets and improvements on public lands, such as ski areas, indicates that tremendous additional economic value can be derived in Inyo and Mono Counties from these lands. New opportunities could exist based on increasing competitiveness with other recreation counties or due to the unique diversity of the eastern Sierra landscape.
Additionally, Inyo County and Mono County businesses currently serve several niche markets including agriculture, tourism, hos-pitality, and the arts. By applying cluster-based economic development theory, with case studies provided, this report suggests Inyo County and Mono County could suc-cessfully encourage growth in these niche markets, or cluster industries, to support economic growth throughout the region and to strengthen the region’s current business climate. Included at the end of each strategy proposed for the economic clusters discussed are metrics for monitoring progress and mea-suring results of implementing this report’s suggested strategies and recommendations.
This report attempts to describe California’s statewide economic development climate, current thinking about strategies for eco-nomic growth, and opportunities for Inyo and Mono Counties to leverage that thinking to improve conditions. This report recognizes there is increasing opportunity to leverage new investments to create a place-based and regionally specific economic development strategy. Such a strategy could be critical to enabling Inyo and Mono County residents,
businesses, and local governments to enjoy and prosper from promising growth sectors.
A comprehensive Economic Profile Summary of Inyo County and Mono County follows this discussion of economic clusters in Inyo and Mono Counties but, while this information follows, the data prepared in this portion of the document informed much of the discus-sion and deliberation that resulted in the proposed strategies and recommendations. An extensive list of federal and state funding sources to leverage private investment in the Inyo County and Mono County economies follows the content of the document. The document concludes with references to sup-porting documentation and recommended reading, as well as a list of tables and images.
The Eastern Sierra Innovation and Prosperity report is the result of countless hours con-tributed by a diverse group of people interest-ed in securing prosperity for Inyo County and Mono County. It is the hope of all those who contributed to completion of this report that it may serve to provide stakeholders, decision makers and planners the information nec-essary to adequately address the economic needs, today and tomorrow, of both Inyo and Mono Counties.

Introduction
16
A Vision for Eastern Sierra Innovation and Prosperity
This report is the result of extensive collab-orative research and collective effort among members of a blue ribbon steering committee committed to securing the economic future of Inyo County and Mono County, two rural counties located in the Eastern Sierra of California.
Our impressions of the rural Sierra Nevada are usually dominated by visions of mountain landscapes, grazed pastures, mines, working forests, formidable rivers and canyons, and quaint small towns. However, for much of the
last century, rural regions have struggled with high unemployment, high poverty rates, a low level of financial resources to provide criti-cal services and in many cases shrinking or stagnant populations. Concurrently, demand for natural resources — often a driver of rural economies — has diminished due to a chang-ing global economy, technological innovation and increased awareness of other social and environmental values (Shumway, et al., 2001).
Despite these challenges, many rural com-munities are experiencing high rates of population growth, increasing incomes and increasing employment. Most of the rural communities that have done well nationally
Introduction
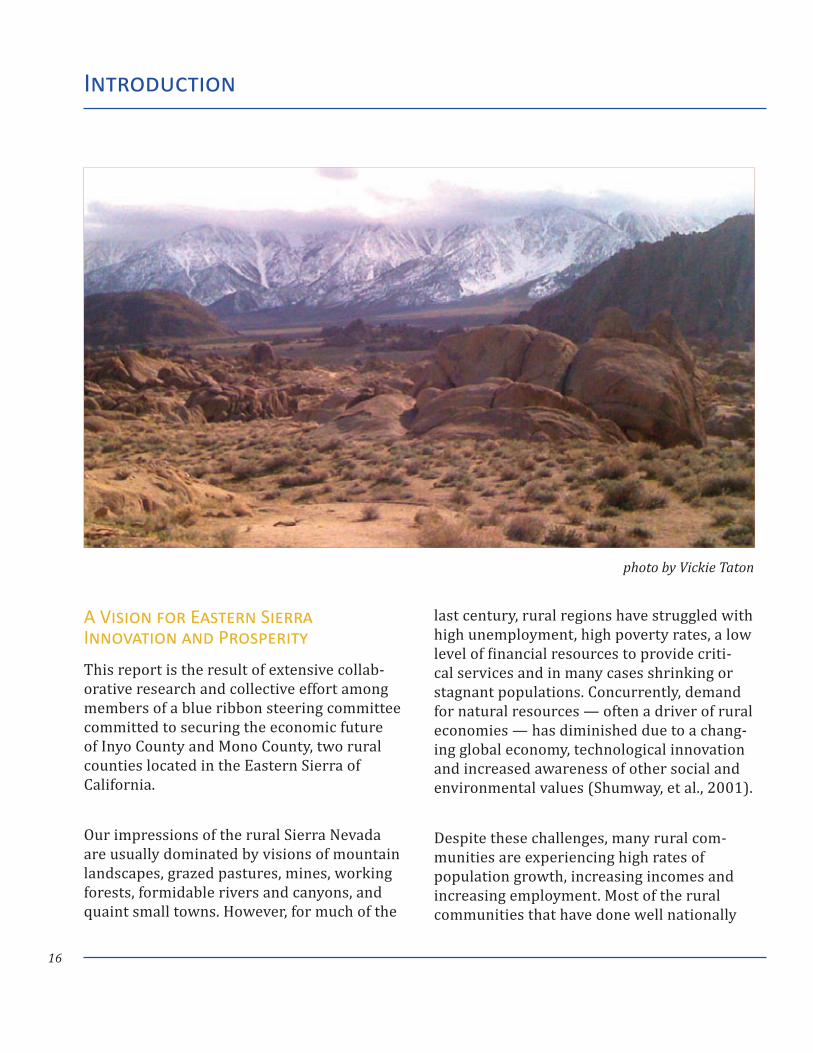
photo by Vickie Taton
17
have been endowed with tremendous natural and cultural amenities, including parks and public lands, access to recreation, scenic vistas, historic and cultural assets, a strong sense of community, and all of the other in-tangibles that contribute to creating attractive places (McGranahan, 1999).
These communities have discovered how to maintain as many of their working ranches, farms, forests and lands as possible in the face of shrinking demand, and simultane-ously have embarked on a new strategy to build a local economy based on quality of life, emergent small businesses and stewardship of natural resources (Johnson, et al., 1995; McGranahan, 1999).
Inyo and Mono Counties have fared better than many rural regions, but only marginally. In recent decades, due partly to the shift in the national economy away from a manufac-turing base, the economies of both counties have shifted from a natural resource extrac-tion economy toward a more general- and professional-services-oriented economy. Coinciding with the decline of the grazing, mining and other natural resource based industries, Inyo and Mono Counties have experienced a marked increase in personal income derived from non-labor sources, such as retirement investment and social security payments (U.S. Census Bureau).
Simultaneously, an increasing number of visitors and residents in Inyo and Mono Counties report they are seeking to main-tain or improve quality of life standards, as
evidenced by the results of the Inyo 2020 community visioning process. Although eco-nomic growth within the two counties has dif-fered over recent decades, with growth dem-onstrated to varying degrees in both counties in the areas of government, recreation, and hospitality/leisure, neither county has dem-onstrated extensive increased economic diversification beyond these sectors.
Lack of economic diversification has been an underlying economic issue in Inyo and Mono Counties for many decades. One bad winter, one closed road, or one failed indus-try can have a disproportionate impact on a rural community. Both counties continue to lag behind historic growth in the State of California and often behave counter to state growth and industry trends. The decline of natural resource industries has also left these two counties vulnerable to economic shock from a decline in any single sector.
To address issues of economic diversifica-tion and to help identify clusters of opportu-nity for expanded economic activity, Sierra Business Council assembled a blue ribbon committee of more than 40 eastern Sierra Nevada residents. These residents met for more than 12 months and were informed by background research conducted by the Tucson, Arizona based Sonoran Institute on the state of the regional economy, existing economic development planning and rural economic development trends and strate-gies adopted in other inter-mountain west communities.
Introduction
18
The committee elected to pursue an “industry cluster” approach to analyze economic development opportunities. Industry cluster eco-nomic theory has been around for many years and clusters are called by various names: business clusters, prosperity clusters, clusters of oppor-tunity. Strictly speaking, an industry cluster is a geographic concentration of interconnected companies, special-ized suppliers, service providers, and associated institutions in a particular field that are present in a region.
Characteristically, industry clusters share connections on the supply side, the service side, or both, and enhancements or improvements made on the supply side and/
or the service side boost the productivity and economic health of all the firms in the cluster (Porter, 1998).
The committee was further informed by more than 40 interviews conducted with eastern Sierra businesses and industry sector leaders. Interviews were also conducted with economic development professionals at the United States Department of Agriculture-Rural Development Agency; the United States Department of Commerce-Economic Development Agency; the Governors Office of Economic Development; the California Workforce Investment Board; the California Association for Local Economic Development; the California Economic Development Authority; the California Business, Transportation and Housing Agency; and the Inland Empire Economic Partnership.
This report attempts to quantify and qualify the historical factors of economic develop-ment in Inyo and Mono Counties and examine
Introduction
photo by Vickie Taton
Strictly speaking, an industry cluster is a geographic
concentration of interconnected companies, specialized suppliers, service providers, and associated
institutions in a particular field that are present in a region.
19
Introduction
current economic conditions to suggest areas of potential, sustainable growth throughout the region. In addition, this report attempts to describe the statewide economic develop-ment climate, current thinking about strate-gies for economic growth, and opportunities for Inyo and Mono Counties to leverage that thinking to improve economic sustainability.
During the drafting of this report three new statewide economic development strategies were being developed and published: the Think Long Committee for California as-sembled by the Nicolas Berggruen Institute published A Blueprint to Renew California in 2011; Lieutenant Governor Gavin Newsom published An Economic Growth and Competitiveness Agenda for California with assistance from the Brookings Institution and McKinsey and Associates; and the California Stewardship Network published Thriving Regions Lead to a Thriving State with assis-tance from Collaborative Economics, a Palo Alto, California-based think tank. Ideas and approaches that may align with these efforts as they are deployed across the state have been incorporated.
The eastern Sierra blue ribbon commit-tee found that substantial opportunity for
economic diversification and growth exist in both Inyo and Mono Counties. The committee further found that the greatest opportunity for economic diversification exists within five specific industry clusters, and that these clusters are interrelated in that growth in any one encourages growth in the others. These five clusters are:
Information Technology and E-Commerce
Due to increased access to broadband technologies;
Renewable Energy
To meet the state and national renewable energy goals and mandates;
Tourism, Hospitality and the Arts
Due to the size and scope of the existing cluster
Recreation
With an emphasis on niche and specialized opportunities, and
Value-Added Agriculture
With an emphasis on maintaining access to working lands and expanding products from those lands.
...the greatest opportunity for economic diversification exists
within five specific industry clusters.
20
Introduction
This report should not be construed to imply that substantial opportunity for growth in other sectors, such as professional services, health care, manufacturing, transportation services and mining do not exist. All of these, and other sectors, were explored.
The committee further found that the gradual recovery of the national, state and local economies creates an increasing opportunity to leverage new economic investments. New investments will enable Inyo County and Mono County to overcome the challenge of economic decline due to lack of diversifica-tion by creating a place-based and regionally specific economic development strategy. Such a strategy could be critical to enabling Inyo and Mono County residents, businesses and local governments to enjoy and prosper from promising growth sectors.
Information Technology And E-Commerce
This opportunity study begins with the Digital 395 Middle Mile Project, a project of tremen-dous import to both Inyo and Mono Counties, where broadband Internet access has been sparsely available. In fact, survey results compiled by Desert Mountain Resource Conservation and Development Council dem-onstrate that only 4 percent of respondents in the Inyo-Mono region report broadband service at speeds meeting FCC broadband standards.
High-speed Internet access has become
ubiquitous in today’s business climate, yet Inyo and Mono Counties have been left behind. The potential increase in broadband access to 26,000 households and 2,500 busi-nesses throughout the eastern Sierra will enable Inyo and Mono County residents, business owners and visitors to participate in new business, healthcare and recreational activities that have not been possible without broadband access.
The technological revolution, its tools, oppor-tunities and pitfalls — defined by dramatical-ly increased access to and use of the Internet — has also transformed the way many com-panies do business. This is particularly im-portant on the east side of the Sierra Nevada where business income and particularly sole proprietorship income has been dropping for decades. Twenty years ago owning a small business on the east side usually meant one was squarely in the middle-class, earning above median income, and creating a source of local investment capital for business ex-pansion. Now, after the retail market has consolidated in the last two decades with the growth of big box retailers, sole proprietor-ship means less than a middle class income. Digital 395 means eastside businesses will have an opportunity to enter the world of online retailing/e-commerce and potentially reverse the multi-decade trend of shrinking incomes.
Businesses employing use of broadband technologies are finding they are no longer constrained by geographic location. Through e-commerce they are afforded access to a full range of market opportunities – from
21
Introduction
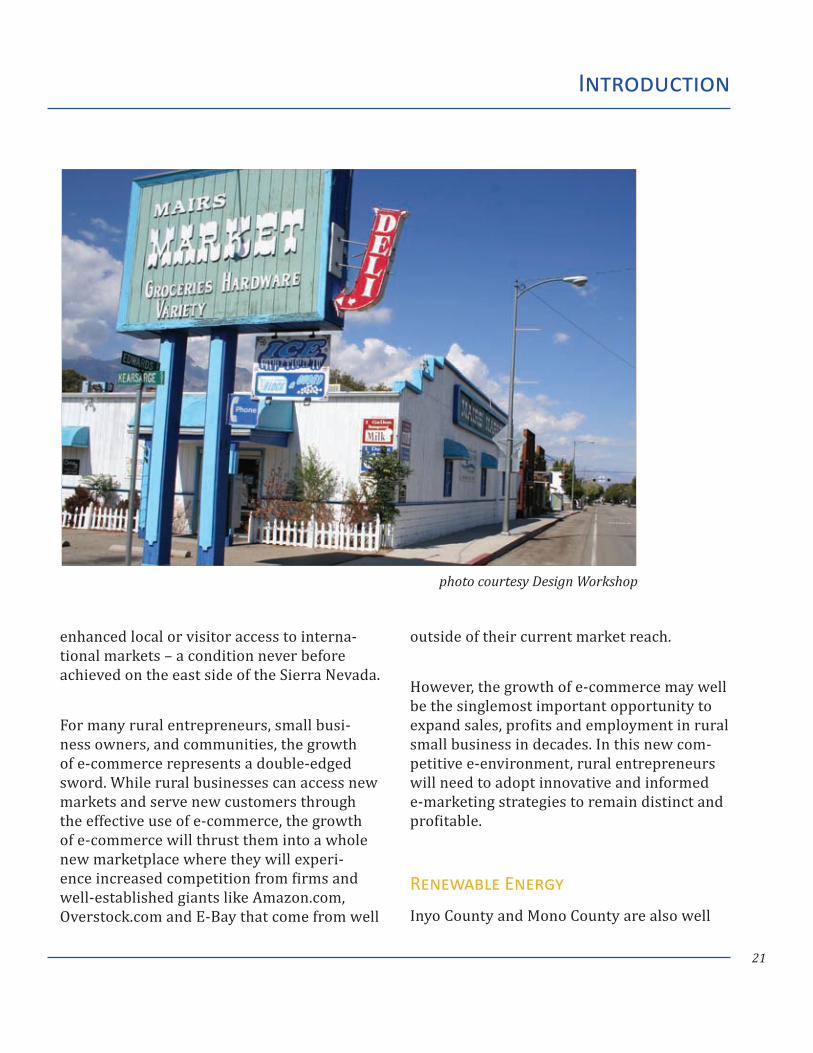
enhanced local or visitor access to interna-tional markets – a condition never before achieved on the east side of the Sierra Nevada.
For many rural entrepreneurs, small busi-ness owners, and communities, the growth of e-commerce represents a double-edged sword. While rural businesses can access new markets and serve new customers through the effective use of e-commerce, the growth of e-commerce will thrust them into a whole new marketplace where they will experi-ence increased competition from firms and well-established giants like Amazon.com, Overstock.com and E-Bay that come from well
outside of their current market reach.
However, the growth of e-commerce may well be the singlemost important opportunity to expand sales, profits and employment in rural small business in decades. In this new com-petitive e-environment, rural entrepreneurs will need to adopt innovative and informed e-marketing strategies to remain distinct and profitable.
Renewable Energy
Inyo County and Mono County are also well
photo courtesy Design Workshop
22
positioned to prosper from investment in meeting voluntary federal goals for increas-ing access to renewable energy, as well as California’s Renewable Energy Portfolio Standard, which mandates that 33 percent of California’s electricity must come from re-newable sources by 2030. One critical strat-egy for meeting state mandates is investing in energy efficiency and distributed energy networks. Along the eastern slope of the Sierra and into Nevada, investment in renew-able energy is escalating and paying off. But renewable energy development faces special challenges and creates specific community impacts; specialized and localized strategies are necessary to ensure successful projects. Three specific areas of renewable energy development are addressed here: solar, geo-thermal and wind technologies; as well as increased investment in energy efficiency.
Tourism, Hospitality & the Arts
Recreation, tourism, hospitality and the arts are strongly related industry clusters, and together represent the largest sectors of the local economies, but for the purposes of this report they are addressed separately.
Most spending in the tourism, hospitality and arts industry cluster comes in six primary areas; restaurant food, accommodations, transportation/fuel, retail sales, lift ticket sales, and food stores. Due to the seasonality of revenue in this area the committee elected to focus on two primary strategies: expanding the seasons of visitation and expanding the diversity of activities that drive the cluster.
Although there is more direct employment from tourism and hospitality in Mono County, the importance of the local tax generation in Inyo County, specifically related to fuel and lodging taxes, and the point that Inyo County has seen slower growth in this cluster, repre-sent a real opportunity. It is also important to note that these industry clusters largely drive the retail trade sector in both counties, thus improvements in these clusters will have a tendency to have a local multiplier effect.
The role of the arts in rural economic devel-opment has been of growing significance. Arts-based economic development can both attract outside dollars to a community by creating products for export, and increase the consumption base by creating products used locally, all while increasing the amenity value of the community by creating a community-based experience. A vibrant arts community has been shown to increase residents’ con-nection to community, improve innovation and entrepreneurial skills, and alter local consumption patterns toward local products outside the arts sector (James Irvine, 2006).
Recreation
In a study conducted by the USDA Economic Research Service in 2005, both Mono and Inyo Counties met the federal definition of a “Recreation County,” characterized by the share of wealth and salary concentration derived from recreational assets. Only 311 of the 3,130 counties in the United States met the standardized definition. Common charac-teristics of a “Recreation County,” which are
Introduction
23
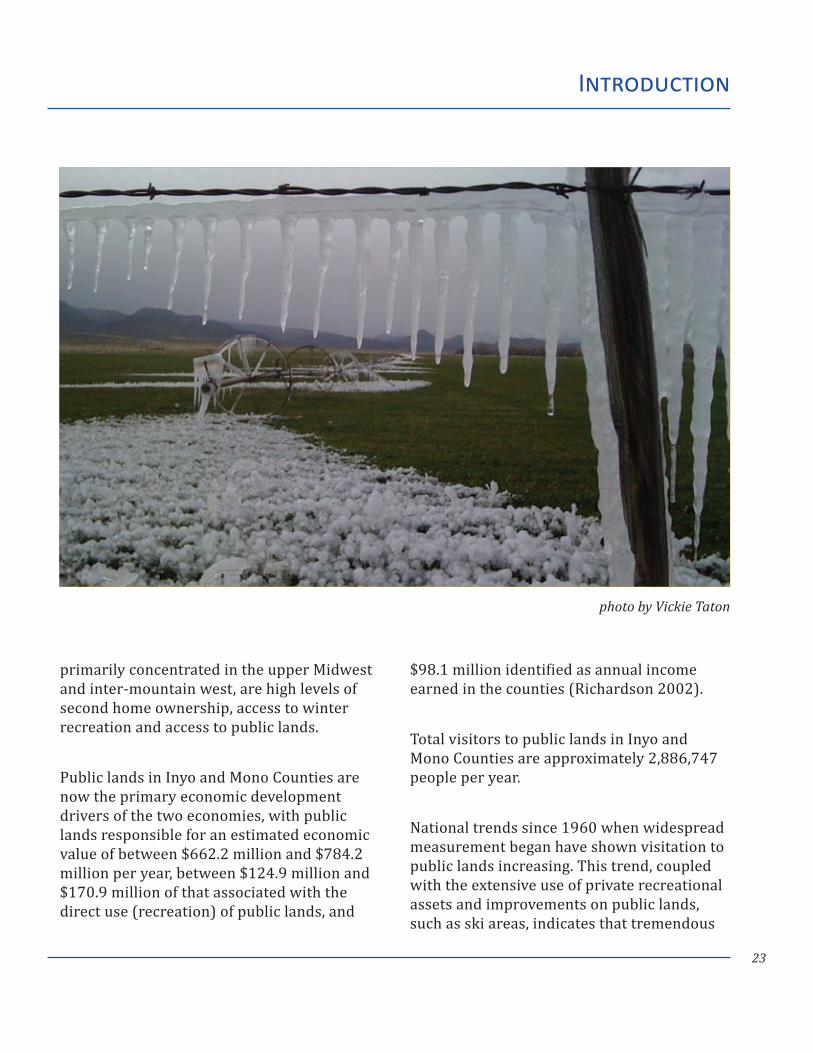
primarily concentrated in the upper Midwest and inter-mountain west, are high levels of second home ownership, access to winter recreation and access to public lands.
Public lands in Inyo and Mono Counties are now the primary economic development drivers of the two economies, with public lands responsible for an estimated economic value of between $662.2 million and $784.2 million per year, between $124.9 million and $170.9 million of that associated with the direct use (recreation) of public lands, and
$98.1 million identified as annual income earned in the counties (Richardson 2002).
Total visitors to public lands in Inyo and Mono Counties are approximately 2,886,747 people per year.
National trends since 1960 when widespread measurement began have shown visitation to public lands increasing. This trend, coupled with the extensive use of private recreational assets and improvements on public lands, such as ski areas, indicates that tremendous
Introduction
photo by Vickie Taton
24
additional economic value can be derived in Inyo and Mono Counties from these lands.
The Inyo County and Mono County recreation cluster is an area where residents and busi-ness owners on the ground have already done a great deal of work. Consequently the steer-ing committee focused on areas where new opportunities could exist based on increasing competitiveness with other recreation coun-ties and capitalizing on the unique diversity of the eastern Sierra landscape.
Value Added Agriculture
Agricultural products’ share of the national Gross Domestic Product has fallen from 21 percent of the nation’s economy in 1910 to less than 5 percent of the economy in 1990. Most agricultural products, both nationally and in the eastern Sierra, are commodity products, or products which have little quali-tative difference across markets (U.S. Dept. of Agriculture).
Value added agriculture means adding to and capturing the value in commodities grown and processed locally in a longer value-chain: retaining processing and use in the local com-munity, which can have a significant positive impact on farm households and rural busi-nesses, may create new and higher-wage employment, and may also expand markets for agricultural commodities, leading to more vibrant and resilient rural and regional econ-omies (Rilla, et al., 2011).
The 2002 and 2008 U.S. Farm Bills rapidly expanded federal investment in value added agriculture, and the 2012 Farm Bill, currently in draft form, is anticipated to expand invest-ment even more. Value added agriculture is among the most rapidly expanding rural eco-nomic development strategies in the country. Renewed interest in improved human health, development of locally grown products, expansion of access to farmers markets, and experiencing local products while visiting a region are factors driving this movement, making value added products more desirable.
By applying cluster-based economic devel-opment theory, with case studies provided, this report suggests Inyo County and Mono County could successfully encourage growth in these niche markets, or cluster industries, to support economic growth throughout the region and to strengthen the region’s current business climate.
Inyo and Mono County residents, business owners and visitors will need assistance, however, to fully realize the benefits of the economic opportunities of the region. The following report is the result of extensive col-laboration, research and field study regarding recent trends and the current status of the economies of Inyo County and Mono County, with discussions regarding the importance of tourism and public lands in generating revenue in the region.
In addition, this report intends to provide stakeholders, decision makers and planners the information necessary to adequately
Introduction
25
address the economic needs, today and in the near future, in both Inyo County and Mono County. Of particular import is connecting Inyo and Mono Counties to the emergent state-level economic development planning.
While the first portion of this report is a discussion of the concept of industry clusters and rural economies, and proposed project areas in which decision makers and plan-ners may choose to focus their efforts in planning for the future of these two unique California counties, what follows is the data that drove the countless hours of discussion and deliberation to produce Part One. The report concludes with a comprehensive list of funding sources available to agencies seeking to advance economic development strategies, references, suggested reading and a list of tables and figures.
Inyo County and Mono County: An Introduction
Geologic History
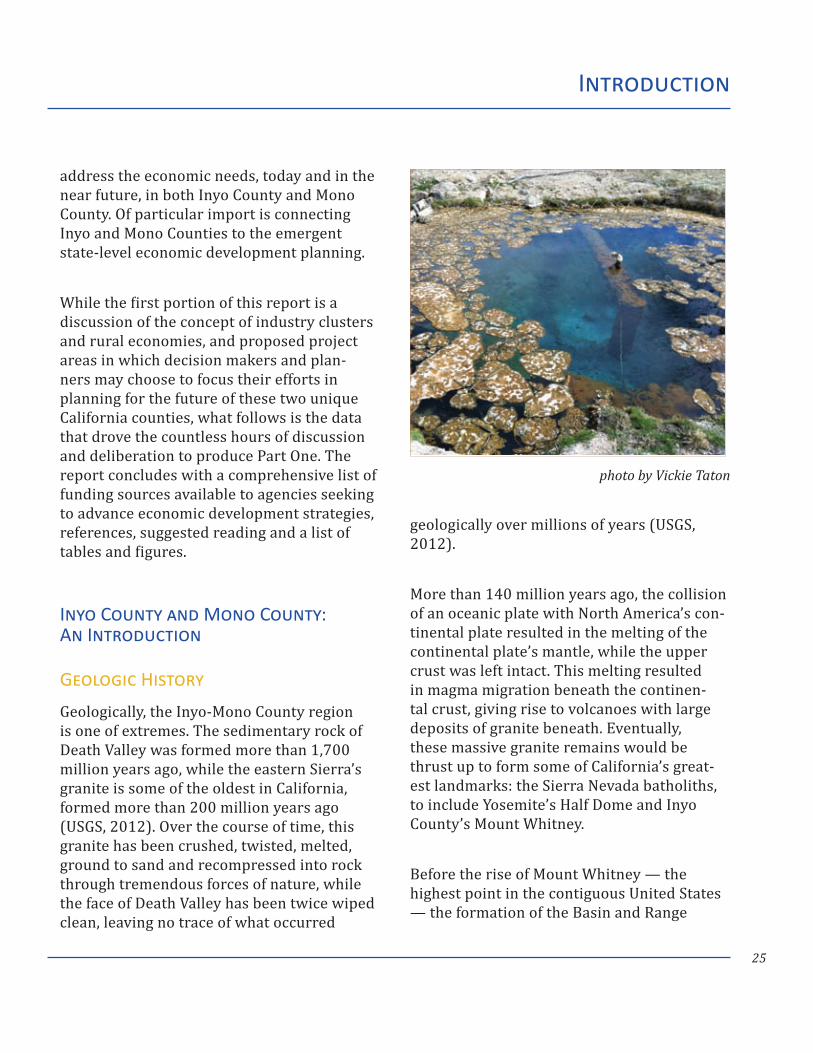
Geologically, the Inyo-Mono County region is one of extremes. The sedimentary rock of Death Valley was formed more than 1,700 million years ago, while the eastern Sierra’s granite is some of the oldest in California, formed more than 200 million years ago (USGS, 2012). Over the course of time, this granite has been crushed, twisted, melted, ground to sand and recompressed into rock through tremendous forces of nature, while the face of Death Valley has been twice wiped clean, leaving no trace of what occurred
geologically over millions of years (USGS, 2012).
More than 140 million years ago, the collision of an oceanic plate with North America’s con-tinental plate resulted in the melting of the continental plate’s mantle, while the upper crust was left intact. This melting resulted in magma migration beneath the continen-tal crust, giving rise to volcanoes with large deposits of granite beneath. Eventually, these massive granite remains would be thrust up to form some of California’s great-est landmarks: the Sierra Nevada batholiths, to include Yosemite’s Half Dome and Inyo County’s Mount Whitney.
Before the rise of Mount Whitney — the highest point in the contiguous United States — the formation of the Basin and Range
Introduction
photo by Vickie Taton
26
Province produced a thickening and thinning of the earth’s crust (Salyards and Shoemaker, 1987), something which has led to conflicting theories as to why the future Sierra Nevada would suddenly rise from a mere few thou-sand feet to its heights exceeding 14,000 feet today (e.g., Unruh, 1991; Wakabayashi and Sawyer, 2001). What is known is that the tremendous rise of the Sierra’s peaks is likely not the result of plate movement alone, but also the result of fluid (including magma and water) releasing heat which rises vertically from beneath the earth’s mantle, evident in the geothermal activity of Inyo County and Mono County today (Small and Anderson, 1995; Wernicke et al., 1996). This thicken-ing and thinning of the earth’s crust is also partly responsible for the sinking elevation of Badwater Basin in Inyo County’s Death Valley, the lowest point on North America (Mulch et al., 2006).
About 20 million years ago, tremendous volcanic activity occurred, depositing magma throughout the growing region. Four million years ago a huge mass of earth’s crust began to tilt westward, thrusting the eastern edge upward (Mulch et al., 2006; Cassel et al, 2009). This uplift of the eastern Sierra con-tinues today and causes earthquakes like the Lone Pine earthquake of 1872. Huge rivers formed on each side of the newly formed Sierra Nevada, carving deep canyons on either side. And then 2.5 million years ago, ice age glacial activity carved U-shaped canyons throughout the Sierra Nevada, finally expos-ing the granite batholiths that had so long been buried beneath less enduring rock, po-sitioning the highest point in the contiguous
United States within 84 miles of the lowest point in North America and both in today’s Inyo County (USGS, 2012).
As a result of this intense geologic activity, fourteen of California’s fifteen peaks that rise above 14,000 feet are within Inyo and Mono Counties and the largest escarpment in the United States lies in Inyo County, separating the floor of Death Valley from Telescope Peak in the Panamint Range. Continents drifting, volcanoes erupting, glaciers advancing and receding together led to the formation of some of North America’s greatest tourism, recreation and geothermal assets located in today’s Inyo-Mono region.
Geographic Context
Inyo County and Mono County are rural areas situated among the rugged terrain of the eastern Sierra Nevada in California.
The official Inyo County website states that Inyo County comprises 10,140 square miles and boasts Mount Whitney as its highest peak at 14,492 feet in elevation and Badwater Basin as its lowest point at 282 feet below sea level. The county seat is in Independence, while the county’s largest city is Bishop. While Inyo County is California’s second-larg-est county and the tenth largest in the nation (excluding Alaska), only 1.7 percent of the county’s land area is privately owned, with 98.3 percent owned by federal and state agen-cies and the City of Los Angeles.
Introduction
27
Introduction
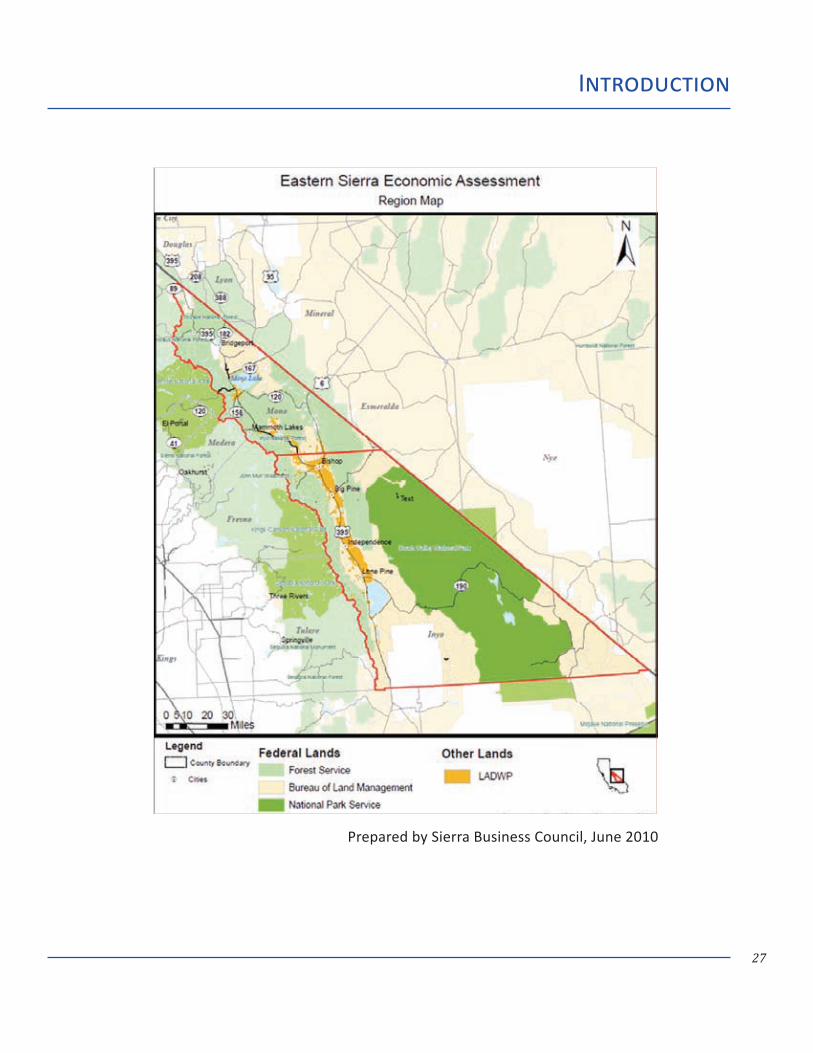
Prepared by Sierra Business Council, June 2010
28
The county’s other major cities and towns include Big Pine, Cartago, Darwin, Deep Springs, Dixon Lane-Meadow Creek, Furnace Creek, Homewood Canyon, Keeler, Lone Pine, Mesa, Olancha, Pearsonville, Round Valley, Shoshone, Tecopa, Valley Wells, West Bishop and Wilkerson.
Inyo County lies south of Mono County and borders the remaining counties: Tulare, Fresno and Kern to the west; San Bernardino to the south; and Nevada’s Esmeralda, Nye and Clark Counties to the east. According to 2010 U.S. Census data, Inyo County has a population density of 1.8 persons per square mile.
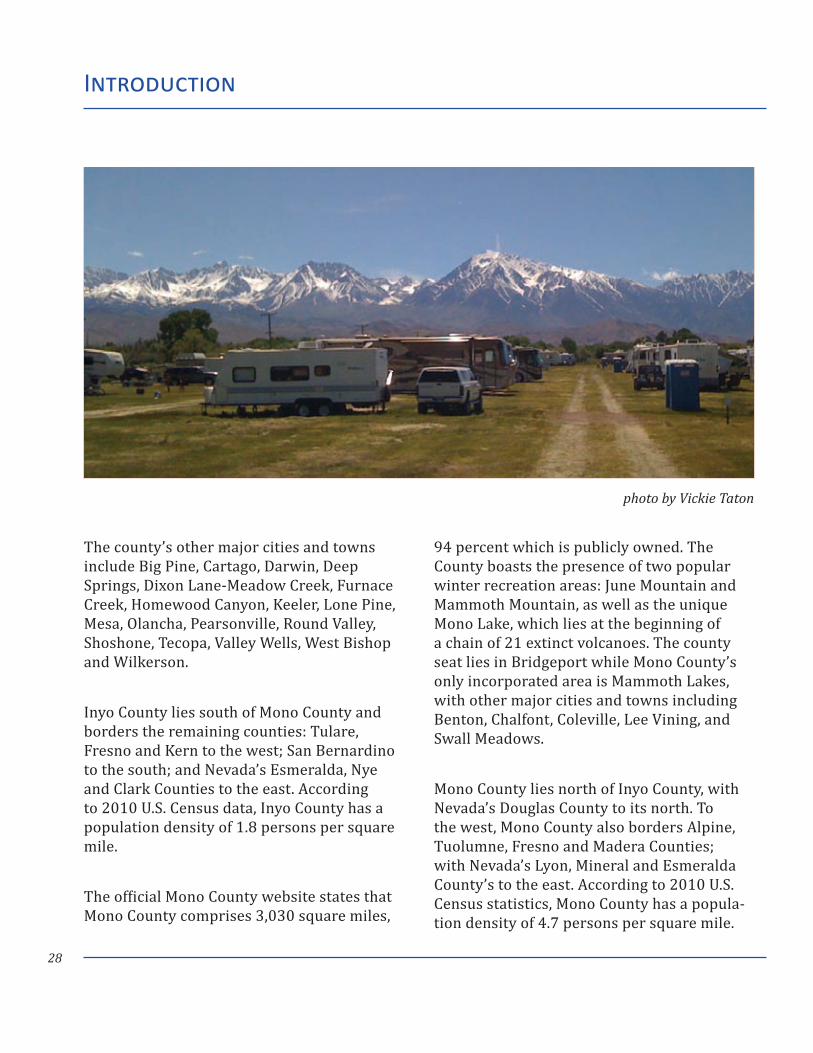
The official Mono County website states that Mono County comprises 3,030 square miles,
94 percent which is publicly owned. The County boasts the presence of two popular winter recreation areas: June Mountain and Mammoth Mountain, as well as the unique Mono Lake, which lies at the beginning of a chain of 21 extinct volcanoes. The county seat lies in Bridgeport while Mono County’s only incorporated area is Mammoth Lakes, with other major cities and towns including Benton, Chalfont, Coleville, Lee Vining, and Swall Meadows.
Mono County lies north of Inyo County, with Nevada’s Douglas County to its north. To the west, Mono County also borders Alpine, Tuolumne, Fresno and Madera Counties; with Nevada’s Lyon, Mineral and Esmeralda County’s to the east. According to 2010 U.S. Census statistics, Mono County has a popula-tion density of 4.7 persons per square mile.
Introduction
photo by Vickie Taton

Industry Cluster Concept Overview
30
Industry Clusters: an Overview
The Eastern Sierra Innovation and Prosperity project has focused on the concept, identifica-tion and utilization of industry clusters — a well-accepted approach to strategic economic development. This section of the commit-tee report focuses on the classic definition of industry clusters and how the concepts have evolved over time. It seeks to increase under-standing of how clusters are used in economic development currently and how to foster industry clusters in a global economy.
Industry clusters have been studied for many years and are called by many names: business clusters, prosperity clusters, clusters of op-portunity. Strictly speaking, a business cluster is a geographic concentration of interconnect-ed companies, specialized suppliers, service providers, and associated institutions in a particular field that are present in a region. Characteristically, industry clusters share connections on the supply side, the service side, or both, and enhancements or improve-ments made on the supply side and/or the service side boost the productivity and eco-nomic health of all the firms in the cluster.
The term business cluster was introduced by Michael Porter in The Competitive Advantage of Nations (1990), but the underlying concept of the importance of geographic economics dates back to the Principles of Economics (1890) and the work of Alfred Marshall, a British economist. A generally accepted definition is that business clusters exist when there is a geographic location that supports enough resources and competencies to reach
a critical threshold, giving the cluster a sus-tainable competitive advantage over other places (and clusters).
Clusters are in effect regional production systems that include all of the companies and institutions that explain the economic behav-ior of a place (Regional Technology Strategies, Inc., 2009). All cluster analysis relies on eval-uation of local and regional employment pat-terns based on industrial categorizations such as the North American Industry Classification System (NAICS), but especially in rural com-munities cluster analysis must incorporate local knowledge, history and culture. Industry clusters work well when they are created out of businesses already present in a region but haven’t fared as well when economic develop-ment efforts attempt to create new clusters that may or may not resonate with the skills and knowledge of a local work force.
Who gains and who loses in the economy, whether individual or business, depends to a large extent on connections, relationships, and trust. These factors affect the exchange of knowledge — about innovations, markets, and job opportunities — and they affect col-laboration. The real strength of clusters lies in the tacit knowledge that resides within the employees of companies in the cluster and its dispersion across companies and institutions.
This is how rural regions develop real exper-tise and innovation in textiles, design, wine-making, manufacturing, and more. Once a region has agreed to focus economic develop-ment efforts on industry clusters, the current
Industry ClustersConcept Overview

31
and historical trends of the local economy can be examined to identify the existing clusters and evaluate them in terms of health, growth, strength, value and future opportunities. Using NAICS and local knowledge, this evalua-tion will identify within the region:
Sectors of the economy identified by growth •in one or more areas: value, jobs or wages
Export-oriented, geographically concentrat- •ed and interdependent industry sectors
Sectors characterized by competing firms •and buyer-supplier relationships
Shared labor pools •
Shared specialized infrastructure •
Once identified, work can then begin on iden-tifying opportunities within the clusters and designing strategies to realize the opportuni-ties, whether it be providing workforce train-ing in energy efficiency, encouraging start-up businesses that compliment or support exist-ing businesses, or building a test kitchen for value-added agriculture. Clusters are consid-ered to increase the productivity with which companies can compete, nationally and glob-ally (Porter, 2000).
“Geographic, cultural, and institutional prox-imity provides companies with special access, closer relationships, better information, pow-erful incentives, and other advantages that
photo by Vickie Taton
Industry ClustersConcept Overview
32
are difficult to tap from a distance. The more complex, knowledge-based, and dynamic the world economy becomes, the more this is true. Competitive advantage lies increasingly in local things — knowledge, relationships, and motivation — that distant rivals cannot replicate” (Porter, 1998).
In 1998, Phil Cooke and Kevin Morgan devel-oped a framework for associative behavior, finding that “economic activity is increasingly based on notions of collective learning and that competition increasingly involves part-nership and interactive innovation” (Cooke, et al., 1998).
Most clusters have been boosted by some variation on one of two types of strategies. The first, “specialization,” influences the use of public or private sector resources or ser-vices in ways that make them more directly relevant to a particular kind of industry. The second, “association,” tries to influence rela-tionships and increase interactions among firms.
Michael Porter asserts that clusters have the potential to affect competition in three ways:
By increasing the productivity of the compa- •nies in the cluster
By driving innovations in the field •
By stimulating new businesses in the field •
Clusters, in recent years, have become virtu-ally synonymous with membership organiza-tions designated to represent them, whether called councils, associations, partnerships, or
networks. These organizations have become powerful voices for their members, mecha-nisms for engaging industry and aggregating needs and demands, pipelines for information to members and to government, platforms for networking and learning, and, in some cases, pathways of public monies into the cluster.
Four stages of Industry Cluster Strategies
Stage 1: Mobilization
Build interest and participation locally.
Stage 2: Diagnosis
Assess the industry clusters that comprise the current economy and the infrastructure that supports the clusters.
Stage 3: Collaborative Strategy
Convene stakeholders in working groups to identify and prioritize opportunities, chal-lenges and strategies.
Stage 4: Implementation
Build commitment within working group par-ticipants and regional stakeholders to actions and to building an organization to sustain implementation (Porter, 1998).
Industry ClustersConcept Overview
Applying Clusters to Rural Economies
34
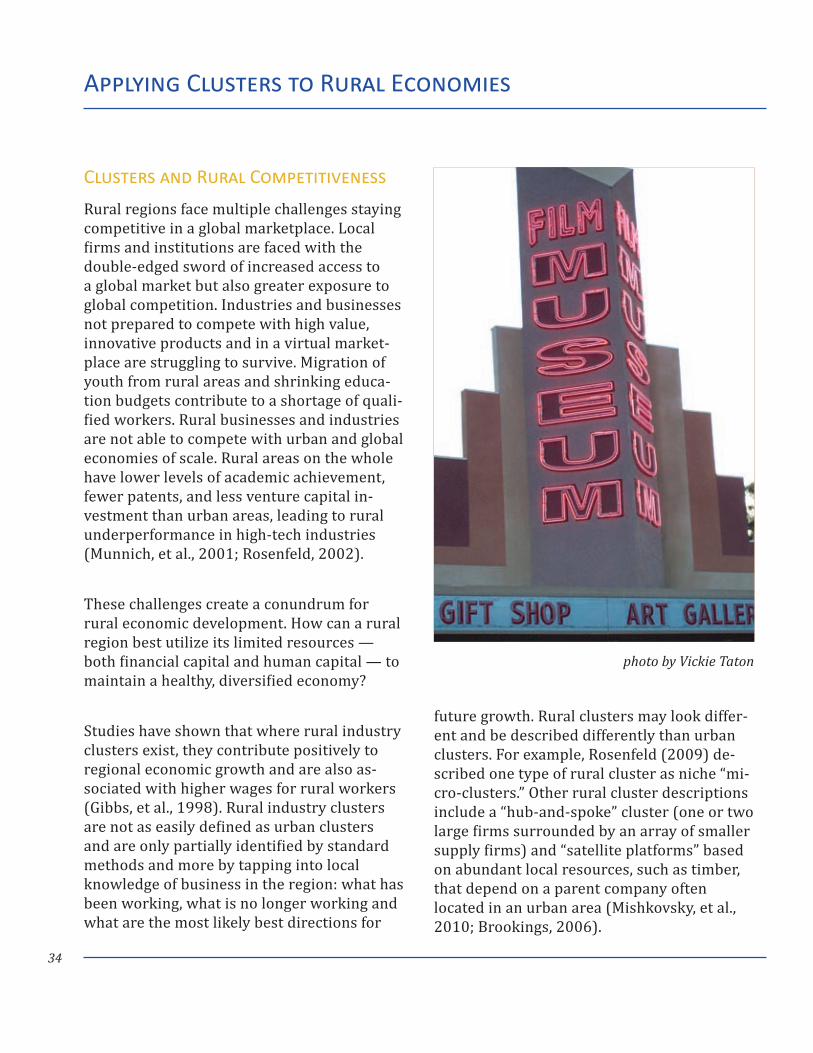
Clusters and Rural Competitiveness
Rural regions face multiple challenges staying competitive in a global marketplace. Local firms and institutions are faced with the double-edged sword of increased access to a global market but also greater exposure to global competition. Industries and businesses not prepared to compete with high value, innovative products and in a virtual market-place are struggling to survive. Migration of youth from rural areas and shrinking educa-tion budgets contribute to a shortage of quali-fied workers. Rural businesses and industries are not able to compete with urban and global economies of scale. Rural areas on the whole have lower levels of academic achievement, fewer patents, and less venture capital in-vestment than urban areas, leading to rural underperformance in high-tech industries (Munnich, et al., 2001; Rosenfeld, 2002).
These challenges create a conundrum for rural economic development. How can a rural region best utilize its limited resources — both financial capital and human capital — to maintain a healthy, diversified economy?
Studies have shown that where rural industry clusters exist, they contribute positively to regional economic growth and are also as-sociated with higher wages for rural workers (Gibbs, et al., 1998). Rural industry clusters are not as easily defined as urban clusters and are only partially identified by standard methods and more by tapping into local knowledge of business in the region: what has been working, what is no longer working and what are the most likely best directions for
future growth. Rural clusters may look differ-ent and be described differently than urban clusters. For example, Rosenfeld (2009) de-scribed one type of rural cluster as niche “mi-cro-clusters.” Other rural cluster descriptions include a “hub-and-spoke” cluster (one or two large firms surrounded by an array of smaller supply firms) and “satellite platforms” based on abundant local resources, such as timber, that depend on a parent company often located in an urban area (Mishkovsky, et al., 2010; Brookings, 2006).
photo by Vickie Taton
Applying Clusters to Rural Economies
35
Researchers have struggled with the seeming paradox that the cluster concept presents for rural development. If industry clusters are “geographic concentrations of interconnected companies and institutions in a particular field (Porter, 1998)”, with “concentration” implying elements of both scale and critical mass, one is hard pressed to find many exam-ples in rural areas. After all, “rural” is sparsely populated by definition and therefore likely to lack either scale or critical mass in most every industry aside from those that are heavily agricultural or natural resource-based.
The economic fortunes of communities, whether urban or rural, are often driven by industries anchored elsewhere. The most im-portant economic clusters for any given rural place can be local, regional, national, or even global in geographic scope. Rural policymak-ers would do well to avoid focusing solely on building locally-anchored clusters. Leveraging external linkages — whether with an urban-based cluster nearby or a national or global cluster faraway — is also a “cluster” strategy (Feser, et al., 2007).
Rosenfeld states Feldman and others have shown that most clusters are formed by en-trepreneurs based on a natural resource, par-ticular local assets, or serendipitous events, and they continue to develop along paths shaped by past economic activity and exper-tise. Depending on how the cluster applies its knowledge and skills, this path dependency can become an opportunity to morph into new growth prospects (Rosenfeld, 2009).
The Economic Development Administration lists five key concepts to developing Rural Industry Clusters:
Evaluate the Local Economic Base •
What you make, including existing and pro-spective clusters
Evaluate Talent: What you do •
Workforce skills and human capital base
Evaluate Entrepreneurship: •
Your capacity to create companies wholly new or from existing firms
Evaluate Innovation and Ideas: •
Your ability to innovate and generate new ideas
Evaluate Location: •
Infrastructure, Amenities, Factor Costs, Natural Resources
Developing active feedback loops between industry and local educators is an important mechanism for promoting economic com-petitiveness. Strategies to engage local firms should focus on the emerging work force (through school-to-work and apprenticeship programs), and the incumbent work force (through customized job trainings, continuing education, and training partnerships).
A rural knowledge cluster approach must recognize the need to develop a regional
Applying Clusters to Rural Economies
36
vision to guide local activities. All levels of government have a role in promoting regional visions. Although local initiatives may play an important role in promoting rural knowledge clusters, it is the regional interdependencies inherent in successful rural knowledge clus-ters that make the region the most appropri-ate scale undertaking action (Munnich, 2002).
Traditionally clusters are identified by exam-ining NAICS codes and historic local economic trends. An alternative, or supplemental, method to the algorithmic approach for iden-tifying clusters is the heuristic approach. This is not a “seat of the pants” methodology; it relies on observation, case studies, and local experience to discover clusters that are small, bridge political boundaries, or are based on unrecognized businesses or unrecorded inter-dependencies. It also allows groups of compa-nies with common interests that have devel-oped a collective identity to demonstrate they have the attributes of a “cluster.” Gathering this information requires going into commu-nities and talking to people, the work of what New Zealand’s Ifor Ffowcs Williams calls “cluster musters.”
Examples of rural industry clusters in the United States include the fishing gear indus-try clusters in Woodland, Washington; the sporting goods and apparel industry in Hood River, Oregon; and the creative clusters in Montana. Walla Walla’s wineries, Seagrove’s potters, Branson’s music, Dalton’s carpets, and Udine’s chairs dominate their local econ-omies as well and are internationally recog-nized in the marketplace (Rosenfeld, 2009).
In the 21st Century, clusters operate in a dif-ferent economic environment. Globalization has taken on a different meaning for clusters and local economies. The market opportuni-ties are still there, but the threats to employ-ment can no longer be met with new technol-ogy and higher productivity (Porter, 2000).
The values and preferences of both consum-ers and employees — especially more edu-cated young people — appear to be shifting away from just function to meaning. Larger segments of the population are willing to pay more for products that are more au-thentic, that reflect values or specific places, or that provide a locally rooted experience. Experience-based products often are connect-ed to a specific place, and particularly young, educated people are choosing their work environment carefully, trading off salary for places that provide the kind of cultural and recreational amenities they seek (Rosenfeld, 2009). The value of place is increasing.
Applying Clusters to Rural Economies
The California Context
38
Economic Efforts Statewide
California’s current economic climate pro-vides opportunities for Inyo County and Mono County as business, philanthropic and other leaders across the state have united in a state-wide effort to drive reform.
For more than 10 years the state of California has not had a specific strategic economic development plan. During the first decade of the 21st Century, economic development planning became fragmented between nu-merous state agencies such as the California Department of Business, Transportation and Housing; the California Labor and Workforce Development Agency; the California Public Utilities Commission; the California Trade and Commerce Agency; and the California Employment Development Department.
Under pressure from structural budget deficits and influenced by the heady days of steady economic growth, California disman-tled much of its traditional economic devel-opment infrastructure. Many agencies were incorporated into others, had substantive portions of their services privatized, or disap-peared altogether in an effort to save money.
Then the state, national and global economies entered a prolonged recessionary period beginning in 2007 and Californians reaped the consequences of their lack of long-term economic planning. California suffered the second-highest state unemployment rate in the nation, losing more than 2 million jobs; experienced the third-highest home
foreclosure rate; saw significant reductions in state and local tax revenues, and millions of Californians became more vulnerable to economic dislocation.
In light of these events there was renewed in-terest in developing a statewide economic de-velopment plan. There was also widespread recognition the problem with California’s economy was not solely lack of a strategic economic development plan. A bipartisan ma-jority of state elected officials and key leaders in the private sector agreed the system of governance that has evolved in the state since the passage of Proposition 13 and the historic shift of power from local governments to state government that occurred in the 1990s left California’s governance and fiscal structure poorly prepared for the challenges of a 21st Century economy.
There was widespread recognition that em-powering regional economic planning to address implementation issues rather than encouraging centralized planning could sub-stantively improve California’s long term eco-nomic conditions and create more resilience to address future shocks.
Advocates of creating such a plan recognized that the California governor’s office needed to be a major player in promoting economic de-velopment but there was no longer a central point of contact in the executive branch. Legislative efforts to address this issue began in 2009.
The California Context
39
The California Context
In 2011, Assembly Bill 29, authored by Assembly Speaker John Perez, was signed by the Governor creating the Governor’s Office of Business and Economic Development (GO-Biz) to serve as a single point of contact within state government for economic de-velopment and job creation efforts. GO-Biz has programs designed to advance business development, assist with permit stream-lining, provide small business assistance,
encourage innovation and entrepreneurship, and promote international trade. Perhaps the most important function of GO-Biz is its mandate to coordinate between all of the dis-parate state agencies that have some mandate for economic development and ensure that they are operating with a single set of stra-tegic objectives; the first such mandate for a state agency in more than a decade.
photo by Vickie Taton
40
Concurrent with the effort to create GO-Biz, several private sector-led economic develop-ment efforts started across the state. Each of these efforts had several common themes: they were led by collections of private sector industry leaders, assisted by economic devel-opment professionals, informed by extensive public outreach efforts, and utilized the most current economic development data and strategies culled from best practices identi-fied across the state and the nation.
In recent months the three private sector efforts — as detailed below — have begun to coordinate their activities and strategies with the Governor’s GO-Biz office, and are engag-ing in joint planning to implement a statewide economic development strategy.
This combined effort could have significant impacts on regional and localized economic development efforts by creating opportuni-ties for coordination and access to technical assistance available through the larger effort, increasing access to state and federal eco-nomic development funding that could flow to the efforts, and increasing access to private capital attracted to a more coordinated strategy.
The first of the three efforts summarized here was convened by Lieutenant Governor Gavin Newsom, which culminated in a report issued by the Brookings Institution and McKinsey and Associates titled An Economic Growth and Competitiveness Agenda for California. Key partners in the effort included the California Business Roundtable, California Chamber
of Commerce, California Labor Federation, California Manufacturers and Technology Association and Silicon Valley Leadership Group.
The second effort summarized here resulted when the Nicolas Berggruen Institute, an independent, non-partisan, private sector think tank, convened a blue ribbon committee called the Think Long Committee to study the long-term economic development and gover-nance needs of the state.
The Think Long Committee included a bipar-tisan blend of retired political and judicial leaders such as former Assembly speakers Willie Brown and Bob Hertzberg, and former California Supreme Court Chief Justice Ronald George; business and economic leaders like Google CEO Eric Schmidt, Eli Broad, Yahoo CEO Terry Semel; and former federal level economic leaders like former chair of the President’s Council of Economic Advisors Dr. Laura D’Andrea Tyson, former Secretary of State George Schultz and former National Security Advisor Condoleeza Rice. The com-mittee process culminated in the release of two documents: A Blueprint to Renew California and the Think Long Committee for California Jobs, Infrastructure and Workforce Report.
The third effort summarized here is that of the California Stewardship Network, which is a collaborative of more than 13 regional eco-nomic and community development organiza-tions seeking to create innovative solutions to the state’s economic, environmental and
The California Context
41
The California Context
community challenges.
The California Stewardship Network was convened three years ago with support from private philanthropy with a mission to promote stewardship, or the careful and responsible management of the assets en-trusted to communities. The California Stewardship Network promotes place-based strategies with attention to simultaneously stewarding economic, environmental and social dimensions of the regions.
Partners in the effort include the Fresno Business Council, Los Angeles Economic Development Corporation, Joint Venture Silicon Valley, Redwood Coast Rural Action, Valley Vision, Sonoma County Economic Development Board, and the Sierra Business Council, among others. The California Stewardship Network process led to the 2010 publication of a report on key shared values, vision, agenda and principles for kick-starting the state’s economy, titled Thriving Regions Lead To a Thriving State.
Several common themes are independently identified by these three efforts, all of which are relevant to the identification of clusters and specific strategies in the eastern Sierra. The clear common themes are that efforts should be regional in scale; state efforts should be focused on investments in work-force development, infrastructure and ad-vancing innovation; and state and regional efforts must focus on aligning regulatory policy to meet common goals.
As a result of the growing coordination between these three economic development efforts, and with cooperation of the GO-Biz office, a process has been established to develop and propose a statewide economic development strategy to the Governor’s office. The effort is being informed by a series of regional economic development forums, branded as the “Can-Do California” effort. Regional forums were held between March and April of 2012. The purpose of the regional forums is to identify the regional clusters that lead to economic opportunities for job creation and competitiveness, what the priority requirements are to capitalize on these opportunities, and develop a set of state policy actions to support the effort. Input from the regional forums was aggregated at the California Economic Summit held on May 11, 2012, to identify the specific actions the state of California can take (either through the GO-Biz office or individual agencies) to prepare to implement an economic develop-ment strategy. One of the outcomes from the California Economic Summit was a specific bipartisan administratively supported legis-lative agenda to support the state economic strategy. Results from the Summit can be viewed at www.caeconomy.org.
The following section summarizes some of the guiding principles and key strategies of the three independently developed eco-nomic reports that together will influence the outcome of the California Economic Summit: An Economic Growth and Competitiveness Agenda for California; A Blueprint to Renew California; and Thriving Regions Lead to a Thriving State.
42
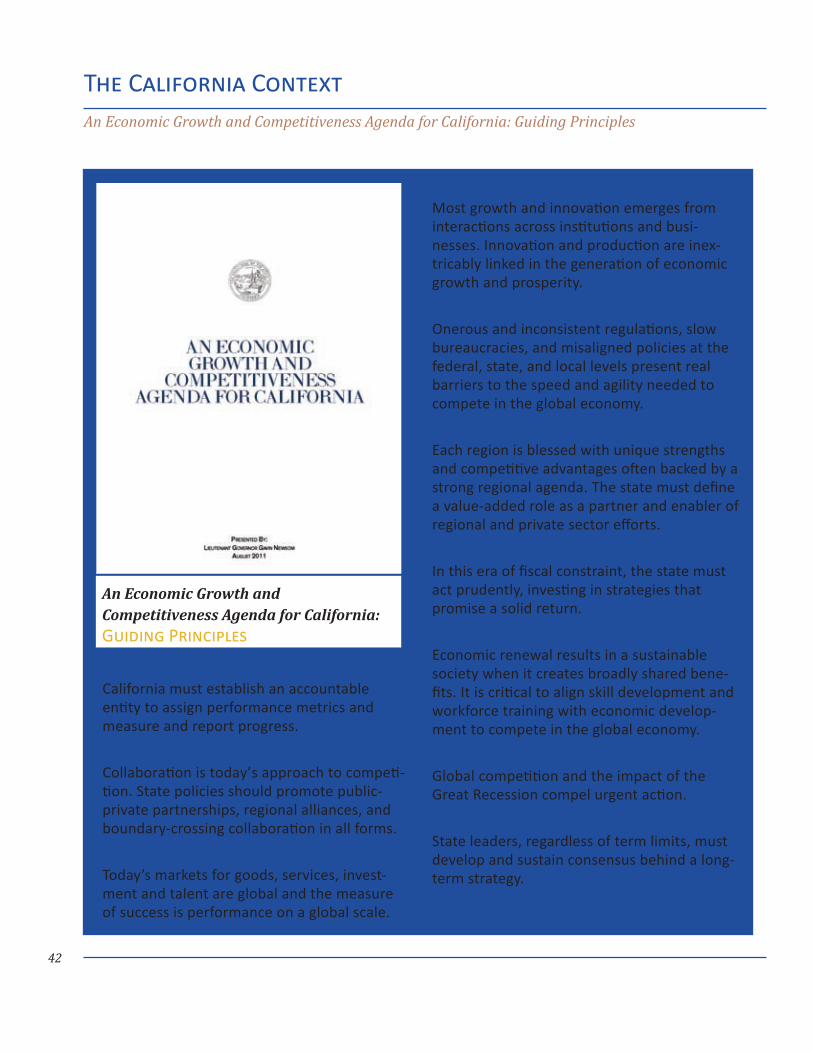
The California ContextAn Economic Growth and Competitiveness Agenda for California: Guiding Principles
Govern for Growth and Accountability California must establish an accountable entity to assign performance metrics and measure and report progress.
Practice Partnership Collaboration is today’s approach to competi-tion. State policies should promote public-private partnerships, regional alliances, and boundary-crossing collaboration in all forms.
Manage Globally Today’s markets for goods, services, invest-ment and talent are global and the measure of success is performance on a global scale.
Build on Industry Strengths Most growth and innovation emerges from interactions across institutions and busi-nesses. Innovation and production are inex-tricably linked in the generation of economic growth and prosperity.
Remove Barriers Onerous and inconsistent regulations, slow bureaucracies, and misaligned policies at the federal, state, and local levels present real barriers to the speed and agility needed to compete in the global economy.
Act Regionally Each region is blessed with unique strengths and competitive advantages often backed by a strong regional agenda. The state must define a value-added role as a partner and enabler of regional and private sector efforts.
Invest in Performance In this era of fiscal constraint, the state must act prudently, investing in strategies that promise a solid return.
Skill Up for Opportunity Economic renewal results in a sustainable society when it creates broadly shared bene-fits. It is critical to align skill development and workforce training with economic develop-ment to compete in the global economy.
Act with Urgency Global competition and the impact of the Great Recession compel urgent action.
Sustain Commitment State leaders, regardless of term limits, must develop and sustain consensus behind a long-term strategy.
An Economic Growth and Competitiveness Agenda for California: Guiding Principles
43
The California ContextAn Economic Growth and Competitiveness Agenda for California: Key Strategies
Gear Up Exports
Create a statewide export strategy•
Re-establish a presence in international • markets
Address critical supports such as freight and • infrastructure capacity
Focus on trade in both goods and services, • including non-traditional exports like tourism and education.
Reinvigorate manufacturing•
Establish regional manufacturing centers of • excellence focused on supply chain and value chain development
Leverage supply chain opportunities by • improving access to capital and information exchange
Streamline or eliminate duplicate or unnec-• essary regulation
Align land use planning efforts with antici-• pated needs for manufacturing and create statewide incentives to encourage investment in manufacturing.
Drive Innovation
Nurture collaborative regional and cluster • based economic development strategies
Develop more extensive business and • academic research and development partnerships
Make research and development resources • available to traditionally underserved groups
Foster co-location and networking between • members of industry clusters and across clusters
Review and reform local and state regula-• tions and requirements, tax credits and incen-tives to focus on the most likely and desirable industry clusters.
Build Infrastructure
Create the infrastructure backbone necessary to have a global reach, including roads, goods movement and high speed communications by: aligning infrastructure decisions with local and regional economic development strate-gies; pursuing new strategies to finance infra-structure such as public-private partnerships; supporting the development of clean tech-nology complementary infrastructure such as renewable energy and distributed generation
Accelerate the “Clean Economy”
Focus efforts on renewable energy and new • technologies in manufacturing and export-intensive industries
Apply the purchasing power of the public • sector to speed the expansion of clean economy sectors
Advocate for federal policies that safeguard • California’s leadership in emergent clean economy industries
Increase access to capital by forming public-• private capital pools for local or regional investment and capture operating efficien-cies in the public sector while supporting the growth and development of new industries.
An Economic Growth and Competitiveness Agenda for California: Key Strategies
(continued page 44)
44
Empower Local Governments and Regions
Since California is actually made up of several regional economies, and local and regional governance needs to be aligned to regional clusters of opportunity, consider-able power to govern should be returned to local government through realignment of state and local functions, and considerable new flexibility for the use of state funds should be encouraged, including advancing statutory changes necessary to provide local governments with program flexibility. An update of the tax system to ensure stable flow of funds to localities to cover the costs
The California ContextA Blueprint to Renew California: Key Strategies
Skill Up for Opportunity
Leverage the community college system • to educate and train the workforce and better align workforce development with economic growth
Treat education and workforce develop-• ment as an integral aspect of economic development
Partner with educational institutions to • pursue the national push to build skills for middleskill jobs and community college retention and graduation
Increase secondary school investment in • career technical education.
Align with Regional Strengths
Coordinate activities at the regional level, • recognizing that California is actually not one economy, but is made up of several distinct, specialized and unique regional economies
Adopt a “do no harm” approach to state-• wide efforts by focusing on value added policies
Root state policy in regional cluster • analysis and align state policy with regional clusters
Target specific investments in specific clus-• ters that have statewide significance
Adjust state and regional governance • structures to foster collaboration
Allow the private sector to lead and guide.•
An Economic Growth and Competitiveness Agenda for California: Key Strategies (continued from page 43)
A Blueprint to Renew California: Key Strategies
45
The California ContextA Blueprint to Renew California: Key Strategies
associated with new responsibilities should accompany increased power and authority for local government.
Stimulate Jobs, Higher Education And Economic Growth
The committee found that restoring economic vitality and job growth to California requires both streamlining regulations on business and facilitating public investment in workforce development.
Streamline Regulatory Processes
Regulatory streamlining should include both real and perceived regulatory barriers, coordi-nating overlapping regulatory frameworks at the local, state and federal levels, establishing a single point of contact at the state level to review conflicting frameworks, and acceler-ating the California Environmental Quality Act (CEQA) permitting process through “smart” CEQA reform. Smart CEQA reform is defined as reform that accelerates the process but keeps the environmental checks and balances process in place through limiting standing time to decide cases, allowing CEQA cases expedited access to the appeals process, and expanding CEQA training for justices.
Encourage Workforce Development
Workforce development reforms envisioned include promoting career technical training at the secondary and community college level through partnerships with local busi-nesses, coordinating Workforce Investment Board investments with emergent regional labor markets, increasing investment in STEM
(Science, Technology, Engineering and Math) mentorship and internship programs, and aligning workforce development with local and regional needs based on identified clus-ters of opportunity.
Invest In Infrastructure
The committee found that California faces • a $765 billion infrastructure investment deficit, not including investments needed for local governments and schools, leading to a systematic drain on productivity and economic growth in the state. To address the gap, new efforts to coordinate and prioritize investments between local, state, federal and private entities will be necessary. To increase the efficiency of these investments the committee recommends:
Employ new technologies to manage and * reduce demand for infrastructure including promoting energy and water efficiency
Maintain and update the state Strategic * Growth Plan (Capital Improvement Plan) with more direct input from and coordina-tion with regional and local entities
Encourage the growth of state, * regional and local investment pools, including tapping into public and private pension funds, to finance infrastructure development
Increase the use of the Infrastructure * and Development Bank managed by the California Department of Finance to direct low cost loans to local governments and public-private partnerships
(continued page 46)
46
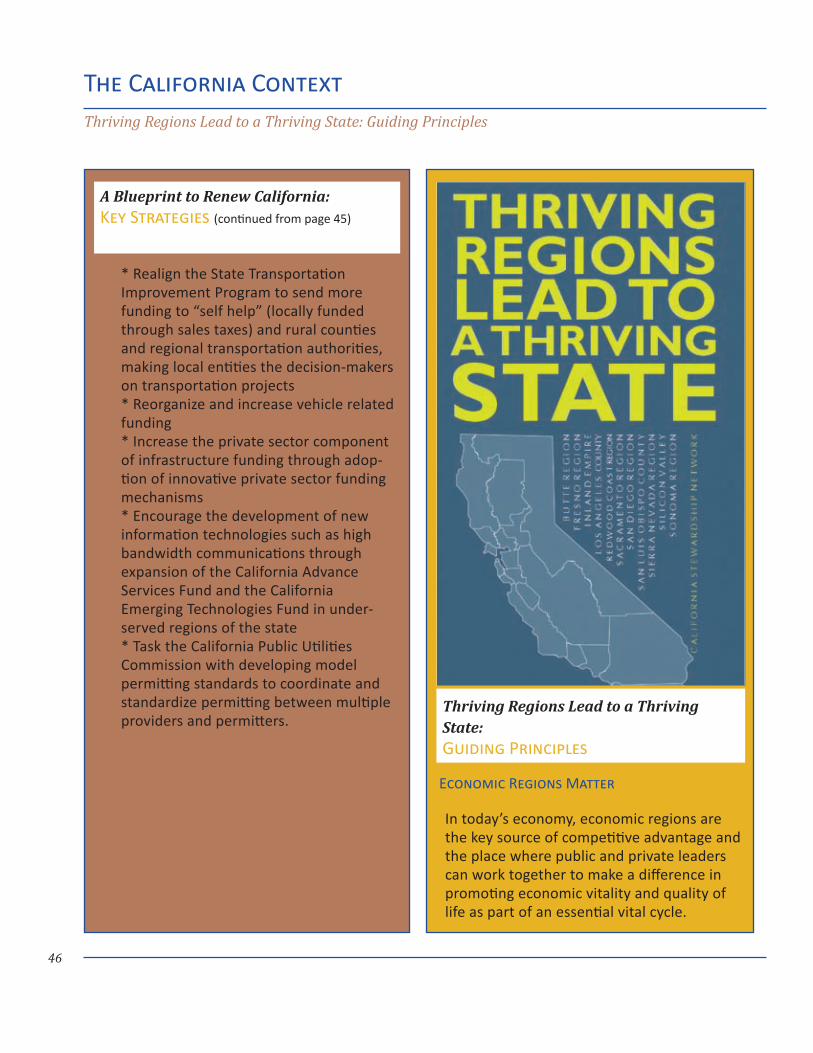
Economic Regions Matter
In today’s economy, economic regions are the key source of competitive advantage and the place where public and private leaders can work together to make a difference in promoting economic vitality and quality of life as part of an essential vital cycle.
The California ContextThriving Regions Lead to a Thriving State: Guiding Principles
Realign the State Transportation * Improvement Program to send more funding to “self help” (locally funded through sales taxes) and rural counties and regional transportation authorities, making local entities the decision-makers on transportation projects
Reorganize and increase vehicle related * funding
Increase the private sector component * of infrastructure funding through adop-tion of innovative private sector funding mechanisms
Encourage the development of new * information technologies such as high bandwidth communications through expansion of the California Advance Services Fund and the California Emerging Technologies Fund in under-served regions of the state
Task the California Public Utilities * Commission with developing model permitting standards to coordinate and standardize permitting between multiple providers and permitters.
Thriving Regions Lead to a Thriving State: Guiding Principles
A Blueprint to Renew California: Key Strategies (continued from page 45)
47
Driving Clusters are Critical to Success
Clusters drive regional economies, creating jobs and revenue. Every region has its own clusters of opportunity that it can build on for economic recovery. Good data and economic information help regions identify their own clusters. In turn, regions should work to link clusters in their region with like efforts in other regions so that maximum synergy can be attained for those industries.
Economy, Education and Physical Infrastructure Require More Investment
Talent and technology as well as physical infrastructure and a positive regulatory environment are critical for strong industry clusters. This means that education and training are important elements of economic recovery. It also means promoting innova-tion and commercializing technologies to grow future industries. Investment in physical infrastructure should include not only smart transportation but efficient water, advanced communications and energy systems. A 21st century business climate includes investments in economic infrastructure as well as creating a regulatory environment that contains costs.
Integrated Approaches are Required
Regional economic strategies should integrate economic, human and infrastructure develop-ment into a comprehensive approach focused on the needs of the regional community. Opportunities should be sought to aggregate common regional issues so that they can be addressed at the highest level possible.
Private-public Partnerships are Needed as Platforms for Change
To attract the talent necessary for vital clus-ters, private and public leaders need to work together to invest in the economic infrastruc-ture required for strong industry clusters and a high quality of life.
Civic Entrepreneurs Must Lead Collaborative Strategies
To build thriving regions, regional economic strategies require collaborative efforts among public and private leaders to direct invest-ment in critical infrastructure supporting the driving industry clusters in their regions.
Sustained State and Regional Support for Recovery Strategies is Necessary
The state’s role is to invest in critical economic infrastructure and work with regions to support regional economic strategies through ongoing partnerships. The state should focus on the basics: Invest in education, trans-portation and water systems; create a pro-investment tax and regulatory environment; allow regions to develop and implement their own regional economic strategies designed to meet their unique needs. This will require an innovative state-regional partnership based on the principles of distributed governance.
The California ContextThriving Regions Lead to a Thriving State: Guiding Principles

Prosperity Clusters
50
Investing in Existing Clusters
As described in the previous chapters, one successful strategy for economic develop-ment planning is to identify existing inter-connections, dependencies and competition among businesses within a region to identify the region’s existing industry clusters and to promote strategies to strengthen those clus-ters. For this study, the research team and the committee developed a set of cluster defini-tions and prioritization factors that could be applied to analyzing a limited set of specific clusters in the region.
Although data analysis identified multiple po-tential clusters, there was general agreement
that focusing on only what was realistically doable, with an emphasis on areas where some capacity already existed, and where significant opportunity for growth exists, was the appropriate strategy.
Criteria for selecting clusters and industry sectors within them to target for develop-ment included a combination of the follow-ing factors:
Average payroll wages equal to or higher • than national industry averages
Relative immunity to recession•
High total earnings•
Prosperity ClustersSelection Criteria
Average payroll wages equal to or higher • than national industry averages
Relative immunity to recession•
High total earnings•
Potential to generate sales tax revenues•
Export products (including tourism)•
Potential to displace services or products • from outside the region
Potential to add value within the region•
Potential to act as a multiplier across • multiple sectors
A cluster that is experiencing both national • and regional employment growth
Positive local employment growth or • high potential for positive growth based on planned improvements
Part of an industry targeted by the state or • federal government for investment or capable of attracting state attention
Potential for rural-urban partnerships•
Achievability, or the ability to affect change • on the ground relatively quickly
Scalability, or the ability to apply the strate-• gies across a broad landscape
Committee Criteria:
Industry Clusters to Target for Development
51
Potential to generate sales tax revenues•
Export products (including tourism)•
Potential to displace services or products • from outside the region
Potential to add value within the region•
Potential to act as a multiplier across • multiple sectors
A cluster that is experiencing both national • and regional employment growth
Positive local employment growth or • high potential for positive growth based on planned improvements
Part of an industry targeted by the state • or federal government for investment or capable of attracting state attention
Potential for rural-urban partnerships•
Achievability, or the ability to affect change • on the ground relatively quickly
Scalability, or the ability to apply the strat-• egies across a broad landscape
This list was not intended to be the sole factor in setting priorities, but rather act as a guide-line to be augmented by local knowledge from the committee. The committee also looked for areas where industry clusters could be connected together, in order to create a mul-tiplier effect, or for the potential for synergy between clusters, so that improvements made in one could affect others.
It was also recognized by the committee that any cluster selected needs to be able to do four critical things; mobilize support from the local community, be easily identified by stakeholders, have a critical mass of stake-holders working on advancing collaborative strategies, and have specific implementation measures and capacity to implement.
The team identified five industry clusters for further analysis: information technology and broadband access; renewable energy; tourism, hospitality and the arts; recreation; and agriculture.
Leveraging Internet Technology and Broadband Access
A significant portion of the region between northern Mono County and southern Inyo County has limited, or insufficient broadband access. Much of the current telecommunica-tions system and infrastructure is antiquated. Large areas of the eastern Sierra have little to no cell phone coverage. Over the years out of the region companies who control the telecommunications infrastructure have been unable to make the financial case for updating their systems.
Consequently, what higher speed service does exist is spotty and inconsistent, suffer-ing numerous outages or isolation events. As a result, broadband adoption rates are very low on the east side compared to the rest of the state of California, only about 14 percent overall, compared to more than 50 percent
Prosperity ClustersLeveraging Internet Technology and Broadband Access
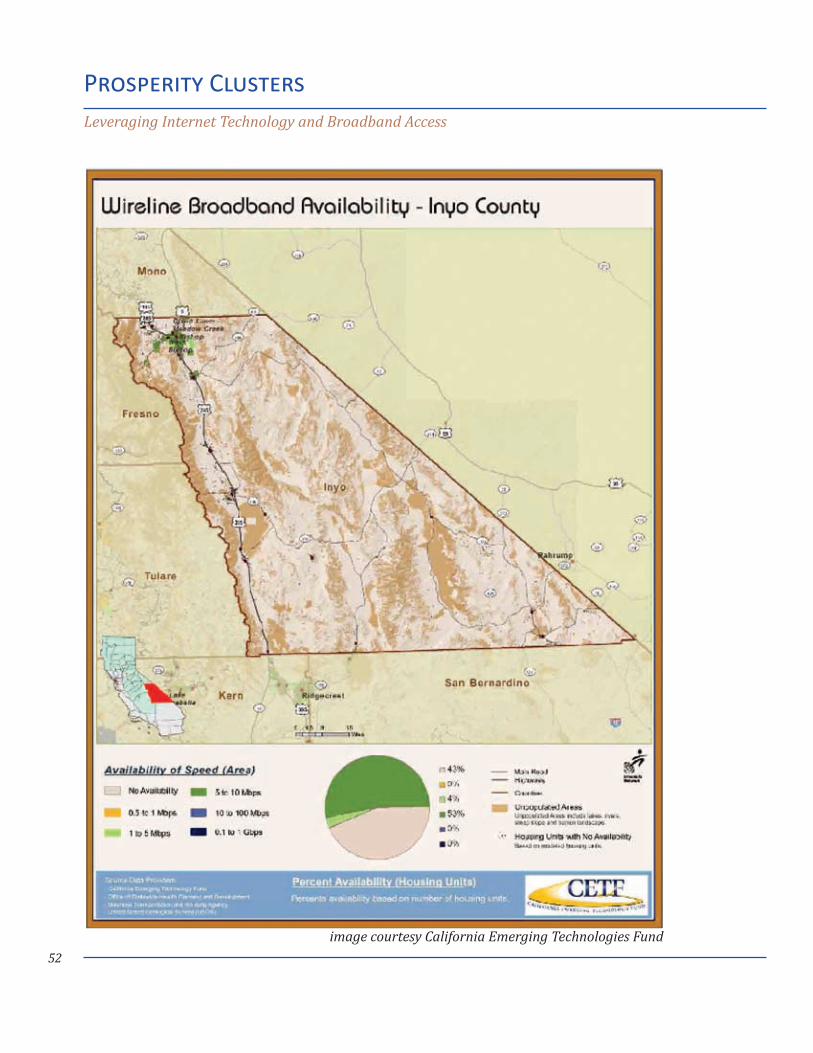
52
Prosperity ClustersLeveraging Internet Technology and Broadband Access
image courtesy California Emerging Technologies Fund
53
Prosperity ClustersLeveraging Internet Technology and Broadband Access
statewide. In addition, because broadband adoption rates are higher for higher income individuals and businesses, the ‘digital divide’ often leaves those in lower socioeconomic categories behind as the digital economy de-velops (RUPRI, 2008).
This condition leaves east side businesses and community assets isolated from access to national and global markets, and travelers isolated from real time digital information about the region. Connectivity has become so much a part of modern life that many families or business people will not even consider traveling to a region that does not offer access to high-speed communications (Advance, 2005).
Fortunately the eastern Sierra is in the process of correcting this condition. The Digital 395 Middle Mile Project proposes to build a new 583-mile fiber network follow-ing the Highway 395 corridor from Barstow, California to Carson City, Nevada. The project represents more than a $100 million invest-ment in broadband infrastructure in the region.
The project is slated to directly connect more than 230 community anchor institutions including hospitals, businesses, local gov-ernments, Indian reservations and military bases, in more than 36 communities along Highway 395. The Digital 395 Project will serve an area with almost 26,000 households and more than 2,500 businesses.
Services provided by the project will include dark fiber (or leasable fiber optic cables), IP Ethernet services, public internet access ser-vices for local governments and educational facilities, SONET services (for voice, video and data) and co-location availability for those wishing to lease space in the trench. The project will not provide direct to-consumer services.
The committee identified the Digital 395 Project as perhaps the most significant eco-nomic development opportunity in the region in generations. Interviews with Digital 395 project implementers indicated the following economic development opportunities:
500 JobsImmediate creation of as many as 500 jobs related to installation of infrastructure
Customer ChoiceExpansion of existing broadband direct service to customers (Cable television and Internet Service Providers)
Safety Plus...Expansion of existing telecommunications systems (Wi-Fi, fixed wireless, cellular, satellite and public safety)
InnovationExpansion of entrepreneurial platforms for new entrants
Improved Vital ServicesExpansion of existing medical, educational, commercial and military applications
54
Prosperity ClustersLeveraging Internet Technology and Broadband Access: Committee Recommendations
Committee recommendations
Interviews with committee members and community leaders identified and priori-tized the following economic development opportunities in the region related to the expansion of broadband service:
Expansion of Internet Technology support • services (web design, computer software, information systems, computer hardware, programming, database services)
Expansion of computer and telecommuni-• cations repair services
Expansion of networking services • (personal and home networks, local area networks, storage networks, campus and institutional networks, server farms and public safety networks)
Expansion of professional services (home • based professionals and firms)
Online sales and marketing (retail, recre-• ation and value added agriculture)
Specific strategies identified by the com-mittee to leverage the technology infra-structure installation side included:
Conduct an inventory of existing infra-• structure and services utilizing data already available from the Digital 395 Project, the California Emerging Technologies Fund, and service providers
Prepare the market by conducting surveys • of infrastructure and services desired by residential and business customers
Include installation of conduit as part of all • local government and institutional capital improvement programs
Install “off ramps” or access points in all • eastern Sierra communities and rural centers
Require new commercial development • to install Fiber-to-The-Premises (FTTP) backbone
Work with residential centers to aggregate • demand for FTTP
Interviews with committee members, com-munity leaders and economic development professionals also indicated that the singlem-ost important action a rural region can un-dertake as it gains access to new broadband technologies is invest in creating business to consumer (B2C) networks to increase e-com-merce and improve customer service.
The primary recommendation of the commit-tee was to immediately embark on a regional e-commerce development and deployment strategy with the goal of boosting market access and increasing the revenue for small
...the committee identified the Digital 395 Project as perhaps the most significant economic development opportunity in the region in generations...
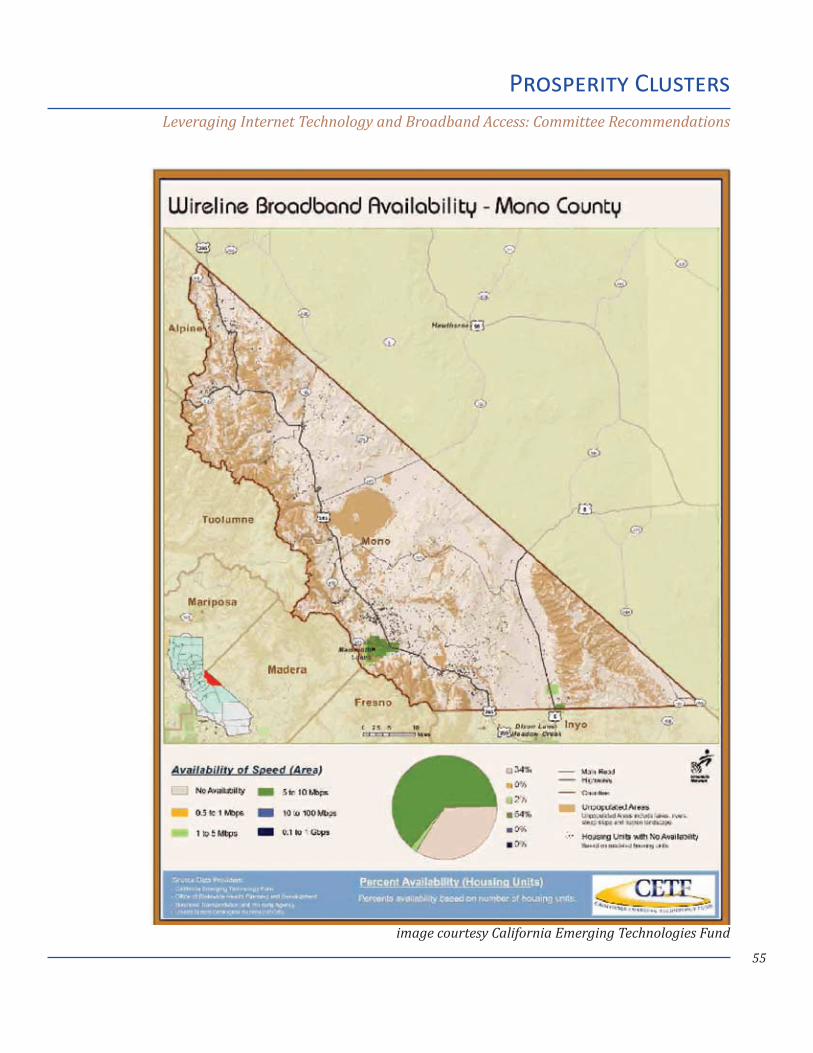
55
image courtesy California Emerging Technologies Fund
Prosperity ClustersLeveraging Internet Technology and Broadband Access: Committee Recommendations
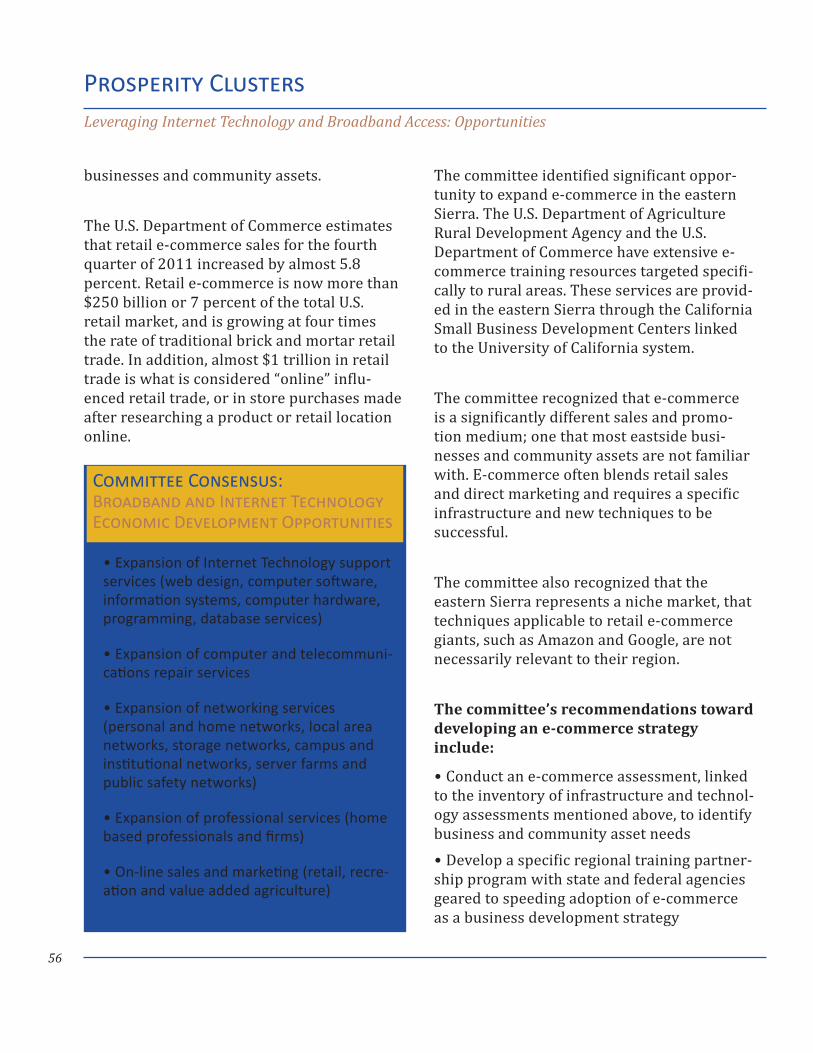
56
Prosperity ClustersLeveraging Internet Technology and Broadband Access: Opportunities
businesses and community assets.
The U.S. Department of Commerce estimates that retail e-commerce sales for the fourth quarter of 2011 increased by almost 5.8 percent. Retail e-commerce is now more than $250 billion or 7 percent of the total U.S. retail market, and is growing at four times the rate of traditional brick and mortar retail trade. In addition, almost $1 trillion in retail trade is what is considered “online” influ-enced retail trade, or in store purchases made after researching a product or retail location online.
The committee identified significant oppor-tunity to expand e-commerce in the eastern Sierra. The U.S. Department of Agriculture Rural Development Agency and the U.S. Department of Commerce have extensive e-commerce training resources targeted specifi-cally to rural areas. These services are provid-ed in the eastern Sierra through the California Small Business Development Centers linked to the University of California system.
The committee recognized that e-commerce is a significantly different sales and promo-tion medium; one that most eastside busi-nesses and community assets are not familiar with. E-commerce often blends retail sales and direct marketing and requires a specific infrastructure and new techniques to be successful.
The committee also recognized that the eastern Sierra represents a niche market, that techniques applicable to retail e-commerce giants, such as Amazon and Google, are not necessarily relevant to their region.
The committee’s recommendations toward developing an e-commerce strategy include:
Conduct an e-commerce assessment, linked •to the inventory of infrastructure and technol-ogy assessments mentioned above, to identify business and community asset needs
Develop a specific regional training partner- •ship program with state and federal agencies geared to speeding adoption of e-commerce as a business development strategy
Expansion of Internet Technology support • services (web design, computer software, information systems, computer hardware, programming, database services)
Expansion of computer and telecommuni-• cations repair services
Expansion of networking services • (personal and home networks, local area networks, storage networks, campus and institutional networks, server farms and public safety networks)
Expansion of professional services (home • based professionals and firms)
On-line sales and marketing (retail, recre-• ation and value added agriculture)
Committee Consensus: Broadband and Internet Technology Economic Development Opportunities
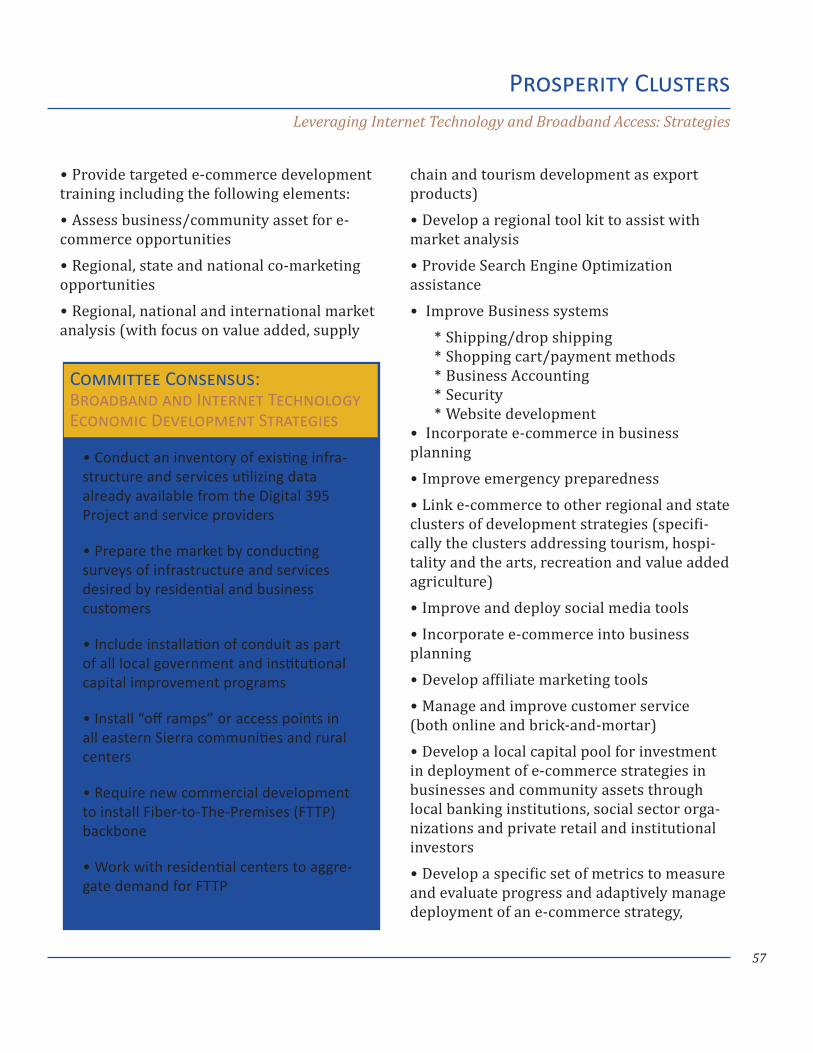
57
Prosperity ClustersLeveraging Internet Technology and Broadband Access: Strategies
Provide targeted e-commerce development •training including the following elements:
Assess business/community asset for e- •commerce opportunities
Regional, state and national co-marketing •opportunities
Regional, national and international market •analysis (with focus on value added, supply
chain and tourism development as export products)
Develop a regional tool kit to assist with •market analysis
Provide Search Engine Optimization •assistance
Improve Business systems •
Shipping/drop shipping* Shopping cart/payment methods* Business Accounting* Security* Website development*
Incorporate e-commerce in business •planning
Improve emergency preparedness •
Link e-commerce to other regional and state •clusters of development strategies (specifi-cally the clusters addressing tourism, hospi-tality and the arts, recreation and value added agriculture)
Improve and deploy social media tools •
Incorporate e-commerce into business •planning
Develop affiliate marketing tools •
Manage and improve customer service •(both online and brick-and-mortar)
Develop a local capital pool for investment •in deployment of e-commerce strategies in businesses and community assets through local banking institutions, social sector orga-nizations and private retail and institutional investors
Develop a specific set of metrics to measure •and evaluate progress and adaptively manage deployment of an e-commerce strategy,
Conduct an inventory of existing infra-• structure and services utilizing data already available from the Digital 395 Project and service providers
Prepare the market by conducting • surveys of infrastructure and services desired by residential and business customers
Include installation of conduit as part • of all local government and institutional capital improvement programs
Install “off ramps” or access points in • all eastern Sierra communities and rural centers
Require new commercial development • to install Fiber-to-The-Premises (FTTP) backbone
Work with residential centers to aggre-• gate demand for FTTP
Committee Consensus: Broadband and Internet Technology Economic Development Strategies
58
potentially including the following:
Broadband adoption percentage of busi-* nesses and residential units
Number of businesses surveyed* Number of businesses visited (tracking *
mechanism)Number of orders or contacts processed* Percentage of total revenue* Number of jobs created* Average salary of jobs created* Number of retained businesses* Average median income of sole *
proprietorshipsReturn on investment for investors*
The committee also identified the expansion of broadband access as a key economic development tool to enhance business retention and expansion.
The average community derives 76 percent of new jobs and capital investment from existing businesses, and only 24 percent from busi-ness attraction and entrepreneurship. In rural communities the contribution of existing businesses is often higher because attraction and entrepreneurial activities contribute less (Iowa Dept. Econ. Dev., 2007).
Specific strategies identified by the com-mittee to enhance broadband access include:
Use online surveys to understand how busi- •nesses currently use technology
Provide regular technology training pro- •grams for business staff and owners
Make a wide range of business training and •networking programs available online
Create online Business to Business (B2B) •and Business to Consumer (B2C) networks
Leverage B2B networks to reduce costs •by electronically integrating supply chains, expand markets, enhance collaboration and reduce leakage
Adapt existing business assistance pro- •grams (such as those available through the Small Business Development Centers) to support technology investments and technol-ogy adaptive companies
Provide specific online training to improve •customer service Funding the deployment of a regional e-commerce strategy will likely be a significant challenge. To develop regional economic development strategies, and potentially pay for portions of the infrastructure necessary, some funds are available through grant pro-grams from the U.S. Department of Commerce through the Economic Development Administration, or the U.S. Department of
Prosperity ClustersLeveraging Internet Technology and Broadband Access: Enhancing Broadband Access
59
Prosperity ClustersLeveraging Internet Technology and Broadband Access: Enhancing Broadband Access
Agriculture through the Rural Business Opportunity Grant/Loan Programs.
Since this is a strategy that assists both public and private entities with economic development activities, development of an e-commerce program would qualify for in-vestment from local government though the Community Development Block Grant program. In such a program investment, much of the revenue invested would come back in the form of increased sales tax revenue.
Resources for individual businesses and com-munity assets seeking to adopt e-commerce will likely require a combination of funding strategies. One source of funds could be the USDA Intermediary Relending Program, which provides funds to local public or private entities (intermediaries) for the establishment of revolving loan programs. These funds could be made available on a competitive or award-driven basis and be uti-lized to develop a set of best practices or case studies demonstrating successful deployment of broadband technologies. Another potential source of funding is through the California Enterprise Zone (EZ) Tax Credit Program.
Designated Enterprise Zones provide tax incentives, including hiring incentives, the ability to carry forward operating losses, tax credits for the purchase of equipment, inter-est deductions, and preferential treatment to businesses for state contracts to allow for private sector investment to revive local economies. Although the program is cur-rently undergoing revision and EZs must
be authorized by the state legislature, no California community has created an EZ with a focus on leveraging the installation of broadband technologies.
This would likely be a high profile oppor-tunity to link to emerging state economic development strategies heavily focused on the deployment of broadband technologies. Utilizing local banks to create a micro-lending program may also be successful on the east side. Since these are generally small loans with a low failure rate they should be attrac-tive to local lenders.
Finally, the most likely source of capital for local businesses will be individual investment by individual businesses and community assets. The purpose of the training programs should be to streamline the private develop-ment process for those participating, reduce costs by aggregating services, and provide clear metrics to demonstrate both poten-tial and real returns on investment to speed adoption of new technologies.
60
Prosperity ClustersLeveraging Internet Technology and Broadband Access: Committee Recommendations
Conduct an e-commerce assessment, linked • to the inventory of infrastructure and tech-nology assessments targeted as a strategy, to identify business and community asset needs
Develop a specific regional training partner-• ship program with state and federal agencies geared to speeding adoption of e-commerce as a business development strategy
Provide targeted e-commerce development • training including the following elements:
Assess business/community assets for • e-commerce opportunities
Seize regional, state and national co-mar-• keting opportunities
Conduct a regional, national and interna-• tional market analysis (with focus on value added, supply chain and tourism development as export products)
Develop a regional tool kit to assist with • market analysis
Assist with search engine optimization•
Improve Business systems•
Shipping/drop shipping*
Shopping cart/payment methods* Business Accounting* Security* Website development*
Incorporate e-commerce in business • planning
Optimize regional emergency preparedness•
Link e-commerce to other regional and state • clusters of development (specifically the clus-ters addressing tourism, hospitality and the arts, recreation and value added agriculture)
Improve and deploy social media tools•
Incorporate e-commerce into business • planning
Develop affiliate marketing tools•
Manage and improve customer service • (both online and brick-and-mortar)
Develop a local capital pool for investment • in deployment of e-commerce strategies in businesses and community assets through local banking institutions, social sector orga-nizations and private retail and institutional investors
Develop a specific set of metrics to measure •
Committee Recommendations:
Leveraging Broadband and Internet Technology
61
Prosperity ClustersLeveraging Internet Technology and Broadband Access: Committee Recommendations
and evaluate progress and adaptively manage deployment of an e-commerce strategy. These metrics might potentially including the following:
Broadband adoption percentage of * businesses and residential units
Number of businesses surveyed* Number of businesses visited (tracking *
mechanism)Number of orders or contacts *
processedPercentage of total revenue* Number of jobs created* Average salary of jobs created* Number of retained businesses* Average median income of sole *
proprietorshipsReturn on investment for investors*
Committee Recommendations:
Broadband and Internet Technology Metrics and Measuring Success
Use online surveys to understand how • businesses currently use technology
Provide regular technology training • programs for business staff and owners
Make a wide range of business training • and networking programs available online
Create online Business to Business (B2B) • and Business to Consumer (B2C) networks
Leverage B2B networks to reduce costs • by electronically integrating supply chains, expand markets, enhance collaboration and reduce leakage
Adapt existing business assistance • programs (such as those available through the Small Business Development Centers) to support technology investments and technology adaptive companies
Provide specific online training to improve • customer service
Committee Recommendations:
Strategies to Enhance Access to Broadband
62
Prosperity Clusters: Case StudyLeveraging Internet Technology and Broadband Access: Clear Capital
Clear Capital Truckee, California
Clear Capital has developed technologies that enable it to provide vital services and products to the real estate industry. These products include residential appraisal, broker price opinions, home data index information, property condition inspections, and value reconciliations.
Clear Capital has two locations: one in Truckee and one in Roseville, and employs more than 150 people in its Truckee office, drawing from Reno, Carson City, the North Shore of Lake Tahoe, and the Town of Truckee. Co-founders Duane Andrews and Kevin Marshall say they created Clear Capital® because they liked making peoples’ lives better. They also really liked technolo-gy. But in addition to really liking technology they love the outdoors, the recreation and sporting opportunities afforded by the Sierra Nevada, and the attraction of raising their families in a rural, amenity rich environment.
In 2000, they started their first venture, REONetwork.com — an online directory that brought together a community of like-minded brokers and asset managers — and still does today. Through REONetwork.com, Andrews and Marshall built strong, mutually beneficial relationships with banks and loan servicers across the country. Through these relationships, they saw that the Broker Price Opinion (BPO) fulfillment process needed a breath of fresh air. In 2001, they co-founded
BPOTracker.com — a new company that focused on providing reliable BPO outsourc-ing services. In 2004, they changed the company name to ClearCapital.com, Inc. to better reflect the broad range of valuation products and solutions they provided that today includes Appraisals, BPOs, Home Data Indexes, Property Condition Reports and Value Reconciliations.
The company offers a number of highly-skilled job opportunities in financial plan-ning and management, applications devel-opment, graphic design, communications, quality assurance and numerous other tech-nology driven career paths, in addition to their core business of BPOs and appraisals.
Andrews and Marshall have been very forthcoming about why they are in a rural community. Access to high-speed data networks has allowed them to work in the region. Access to passenger air service has allowed them to travel to meet clients and investors at will. Access to the quality of life in the region has brought access to highly skilled workers from both within and out of the area. And the high quality of life and recreational access in the region has im-proved metrics on employee retention and reduced business costs. In exchange, the Truckee community has benefited greatly, not just from increased business activity and tax revenue, but from engagement of Clear Capital’s highly skilled staff in the social fabric of the community through service in social sector organizations like the Chamber of Commerce and regional nonprofits.
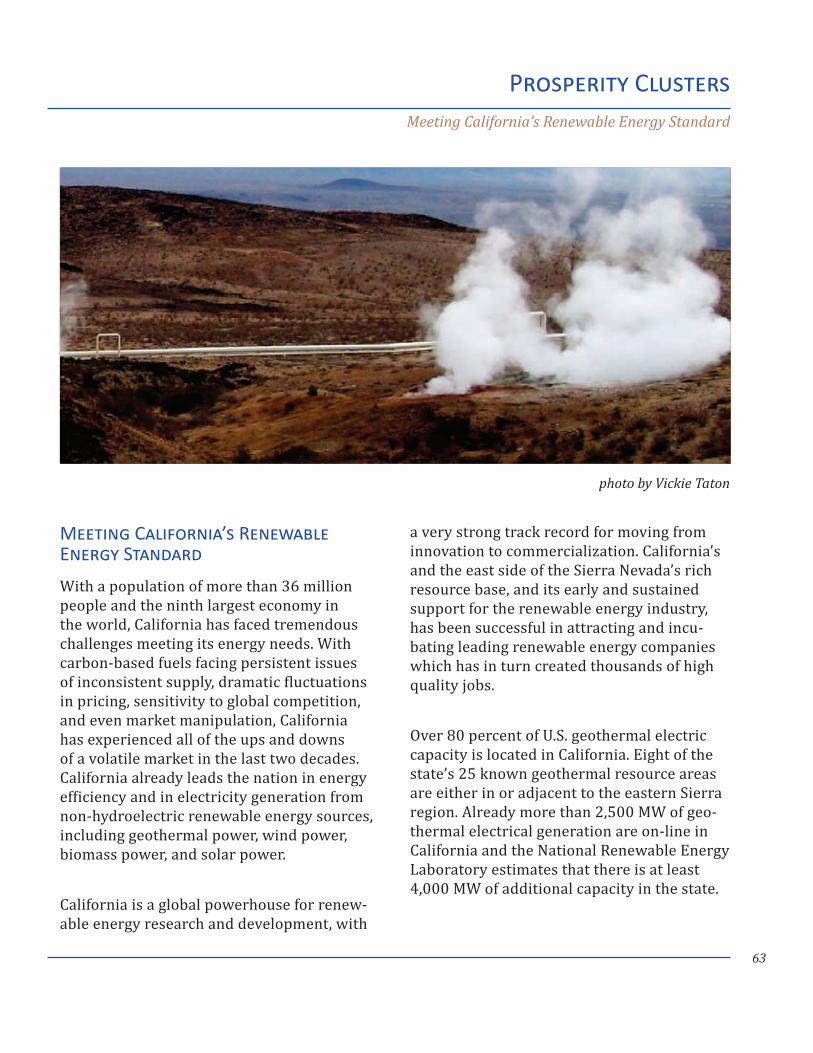
63
Prosperity ClustersMeeting California’s Renewable Energy Standard
Meeting California’s Renewable Energy Standard
With a population of more than 36 million people and the ninth largest economy in the world, California has faced tremendous challenges meeting its energy needs. With carbon-based fuels facing persistent issues of inconsistent supply, dramatic fluctuations in pricing, sensitivity to global competition, and even market manipulation, California has experienced all of the ups and downs of a volatile market in the last two decades. California already leads the nation in energy efficiency and in electricity generation from non-hydroelectric renewable energy sources, including geothermal power, wind power, biomass power, and solar power.
California is a global powerhouse for renew-able energy research and development, with
a very strong track record for moving from innovation to commercialization. California’s and the east side of the Sierra Nevada’s rich resource base, and its early and sustained support for the renewable energy industry, has been successful in attracting and incu-bating leading renewable energy companies which has in turn created thousands of high quality jobs.
Over 80 percent of U.S. geothermal electric capacity is located in California. Eight of the state’s 25 known geothermal resource areas are either in or adjacent to the eastern Sierra region. Already more than 2,500 MW of geo-thermal electrical generation are on-line in California and the National Renewable Energy Laboratory estimates that there is at least 4,000 MW of additional capacity in the state.
photo by Vickie Taton
64
California also has the largest market for solar photovoltaic applications in the country with more than 8,500 MW of solar installed and many hundreds of MW coming on-line every year. The eastern Sierra has many of the state’s most desirable solar resource areas and wind resource areas.
However, renewable energy development and transmission in the eastern Sierra can be a double-edged sword. A variety of large-scale projects have been proposed over the years, and local residents are concerned about whether potential long term environmen-tal impacts, and impacts on the recreation economy, have been adequately addressed. In the rush to capture the benefits of renewable energy development often the impacts can be overlooked.
The committee recognized that renewable energy development, and associated trans-mission, was a tremendous opportunity for strengthening existing industries, new job growth, creating career pathways, local tax revenue generation and promoting sustain-able economic development.
Due to the proximity of renewable energy resource areas in surrounding jurisdictions, particularly the Mohave Desert and Kern Plateau, opportunities to partner with neigh-boring jurisdictions to jointly plan for and capture benefits from renewable energy exist. In short, by extending those adjacent clusters into a similar landscape like Inyo and Mono Counties, benefit can be captured with a lower level of investment and effort.
Policy Drivers
Renewable Portfolio Standard (RPS):
California’s RPS required electric utilities to increase procurement from eligible renew-able energy resources by 1 percent of their retail sales annually, until they reached 20 percent by the end of 2010. In 2009, Governor Schwarzenegger issued an executive order in-creasing the standard to 33 percent by 2020. Governor Brown subsequently extended the RPS executive order.
Renewable Energy Credits (RECs):
Renewable energy credits (RECs) are used to demonstrate compliance with state RPS policies. In March 2010, the California Public Utilities Commission (CPUC) ruled that utili-ties may use unbundled or tradable RECs (TRECs), i.e. using generation sources other than those they own to meet up to 25 percent of their RPS requirement.
The penalty for not meeting annual procure-ment targets on time is five cents per kWh, capped at $25 million per utility per year. The REC’s represent a powerful incentive to encourage renewable development, and create a commodity that can be thought of as an export product if they are used to assist out-of-region utilities to meet the RPS.
Net Metering and Interconnection:
California’s net metering law requires all utilities to provide net metering for solar and
Prosperity ClustersMeeting California’s Renewable Energy Standard: Policy Drivers
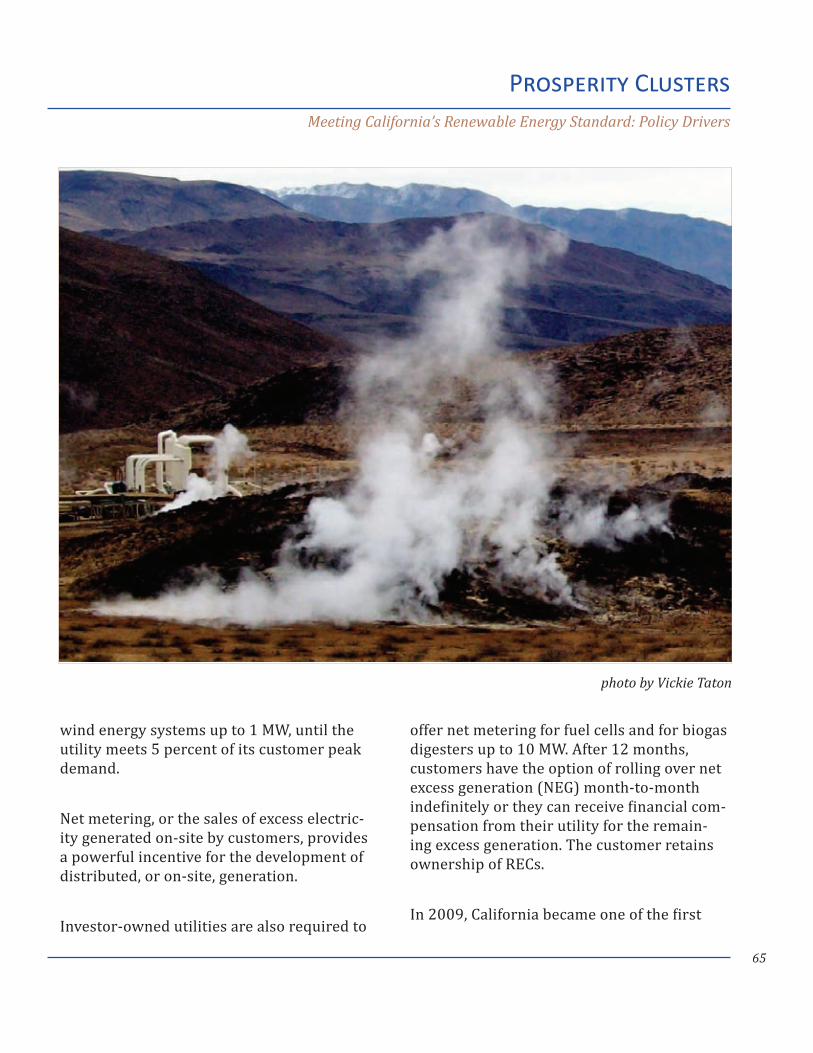
65
Prosperity ClustersMeeting California’s Renewable Energy Standard: Policy Drivers
wind energy systems up to 1 MW, until the utility meets 5 percent of its customer peak demand.
Net metering, or the sales of excess electric-ity generated on-site by customers, provides a powerful incentive for the development of distributed, or on-site, generation.
Investor-owned utilities are also required to
offer net metering for fuel cells and for biogas digesters up to 10 MW. After 12 months, customers have the option of rolling over net excess generation (NEG) month-to-month indefinitely or they can receive financial com-pensation from their utility for the remain-ing excess generation. The customer retains ownership of RECs.
In 2009, California became one of the first
photo by Vickie Taton
66
states to allow virtual net metering for multi-family affordable housing units and munici-palities. California’s interconnection stan-dards apply to distributed generation systems up to 10 MW in capacity, with simplified rules for small renewable energy systems under 10 kW. Netmetered systems up to 1 MW are exempt from paying costs associated with interconnection studies.
California Solar Initiative (CSI):
In 2006, the CSI program was created to provide more than $3.2 billion over 10 years in on-site, grid-connected solar energy used by customers in the territories of the state’s three investor-owned utilities (IOUs) and several municipal utilities.
Most of the eastern Sierra is within the ter-ritory of Southern California Edison, one of these three IOUs. Portions of Mono County are within the territory of Liberty Energy, which will be required to comply with similar rules. The program has a goal of reaching 3,000 MW of installed capacity by 2016.
CSI offers two types of incentives for solar PV on existing homes and nonresidential buildings: an Expected Performance-Based Buydown (EPBB) for systems under 30 kW, at $2.50/W (adjusted for system performance) for residential and commercial systems and $3.25/W for government entities and non-profits; or Performance-Based Incentive (PBI) payments for systems over 30 kW, offered over a period of five years at $0.39/kWh for taxable entities and $0.50/kWh for
government and nonprofit entities.
Systems lower than 30 kW may opt for either the PBI or an EPBB. CSI also offers rebates for solar water heating systems, for $12.82 per therm of natural gas displaced or $0.37 per estimated kWh of electricity displaced.
The maximum incentive is $1,875 for single-family residential systems and $500,000 for commercial and multifamily residential systems.
The CSI program is funded by electric rate-payers and the CSI-Thermal portion of the program is funded by gas ratepayers.
The program budget is $350 million, but is anticipated to increase as ratepayer funding expands. The program has separate budgets and administration plans for its low-income single and multi-family programs.
Other Rebate Programs:
The CPUC is funding a number of additional rebate or incentive programs, designed in a series of three-year cycles, intended to drive innovation and adoption of energy efficiency or renewable generation.
Several eastern Sierra jurisdictions are already participating in these programs through the Energy Leadership Partnership with Southern California Edison designed to promote energy efficiency in municipal
Prosperity ClustersMeeting California’s Renewable Energy Standard: Policy Drivers
67
facilities. Each of these new cycles repre-sents an opportunity to design and support an energy efficiency strategy specific to the eastern Sierra.
The Emerging Renewables Program offers cash incentives of $3/W to promote the in-stallation of grid-connected small wind and fuel cell electric generating systems. The New Solar Homes Partnership provides incentives for solar on new home construction for cus-tomers in IOU service territories, which vary by customer class and system performance. The Self-Generation Incentive Program offers incentives to customers who produce electric-ity with wind turbines and fuel cells ranging from $1.50/W - $4.50/W, depending on type. An additional 20 percent is awarded to proj-ects that utilize systems manufactured in California. Incentive payment is capped at 3 MW, and projects over 1 MW receive reduced rates after the first megawatt.
Feed-in Tariff:In 2006, California passed a feed-in tariff law (FIT) that would require IOUs to provide pay-ments to small-scale renewable energy proj-ects up to 1.5 MW in capacity. Additional FIT laws were passed in 2009 and 2011. The FIT rules allow eligible customer-generators to enter into 10-, 15-, or 20-year standard con-tracts with their utilities to sell the electricity produced by small renewable energy systems at market based prices.
The 2009 program expanded the original FIT to include all publicly-owned utilities (POUs)
that have 75,000 or more customers until the statewide POU cumulative capacity equals 250 MW, for a total program capacity of 750 MW. The eligible project size was increased to 3 MW. The 2011 law created additional pricing incentives. To further incentivize investments by self-generators, the CPUC passed the Renewable Auction Mechanism (RAM) program, which would require California’s three IOUs to purchase electricity from renewable energy systems up to 20 MW in size within their service territories.
For the initial part of the program, each utility is authorized to acquire up to 1 GW, with each utility allocated a portion of the 1 GW cap. Competitive auctions are to be held twice a year for two years, for 250 MW each. Although FITs are not available to customers who have participated in the California Solar Initiative or other ratepayer-funded genera-tion incentive programs, the existence of the FIT allows customers more flexibility in how they finance generation installation.
Public Benefit Fund:California’s three major IOUs collect a “public goods surcharge” on ratepayer electricity.
This charge established funds for renew-able energy ($540 million); energy efficiency ($872 million); and research, development & demonstration projects (RD&D) ($62.5 million).
The law authorizing these funds was up for renewal in 2010 and failed to pass the
Prosperity ClustersMeeting California’s Renewable Energy Standard: Policy Drivers
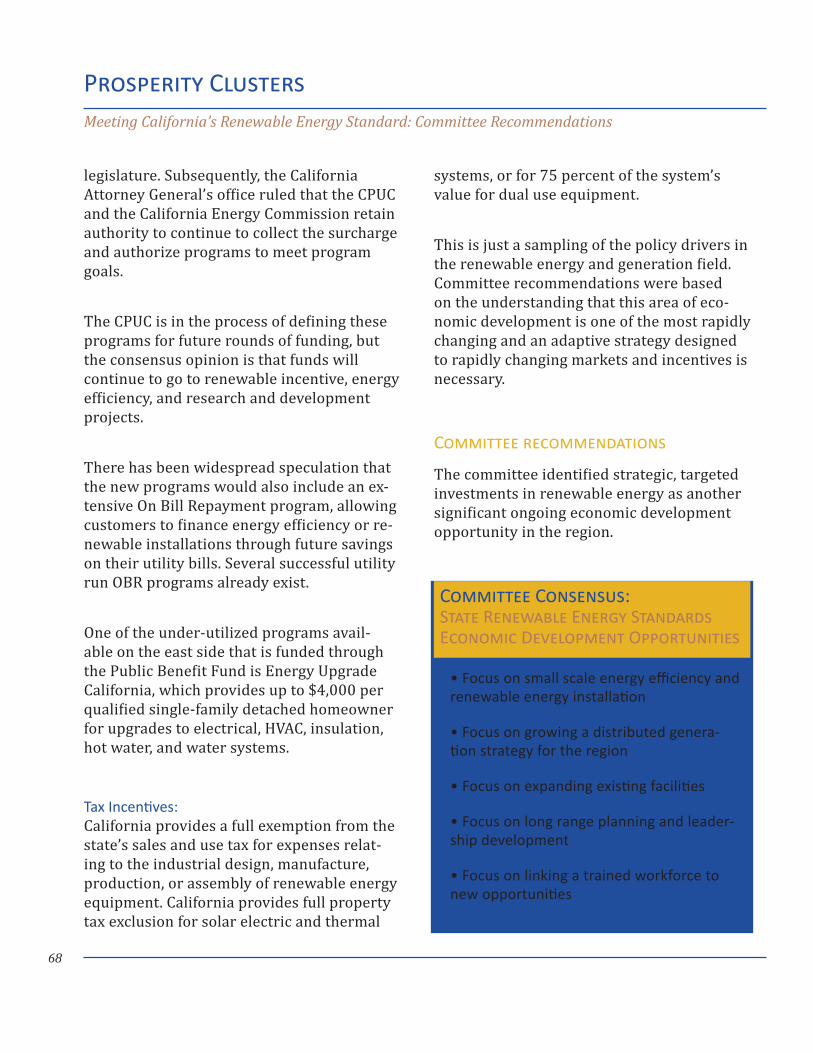
68
legislature. Subsequently, the California Attorney General’s office ruled that the CPUC and the California Energy Commission retain authority to continue to collect the surcharge and authorize programs to meet program goals.
The CPUC is in the process of defining these programs for future rounds of funding, but the consensus opinion is that funds will continue to go to renewable incentive, energy efficiency, and research and development projects.
There has been widespread speculation that the new programs would also include an ex-tensive On Bill Repayment program, allowing customers to finance energy efficiency or re-newable installations through future savings on their utility bills. Several successful utility run OBR programs already exist.
One of the under-utilized programs avail-able on the east side that is funded through the Public Benefit Fund is Energy Upgrade California, which provides up to $4,000 per qualified single-family detached homeowner for upgrades to electrical, HVAC, insulation, hot water, and water systems.
Tax Incentives:California provides a full exemption from the state’s sales and use tax for expenses relat-ing to the industrial design, manufacture, production, or assembly of renewable energy equipment. California provides full property tax exclusion for solar electric and thermal
systems, or for 75 percent of the system’s value for dual use equipment.
This is just a sampling of the policy drivers in the renewable energy and generation field. Committee recommendations were based on the understanding that this area of eco-nomic development is one of the most rapidly changing and an adaptive strategy designed to rapidly changing markets and incentives is necessary.
Committee recommendations
The committee identified strategic, targeted investments in renewable energy as another significant ongoing economic development opportunity in the region.
Prosperity ClustersMeeting California’s Renewable Energy Standard: Committee Recommendations
Focus on small scale energy efficiency and • renewable energy installation
Focus on growing a distributed genera-• tion strategy for the region
Focus on expanding existing facilities•
Focus on long range planning and leader-• ship development
Focus on linking a trained workforce to • new opportunities
Committee Consensus: State Renewable Energy Standards Economic Development Opportunities
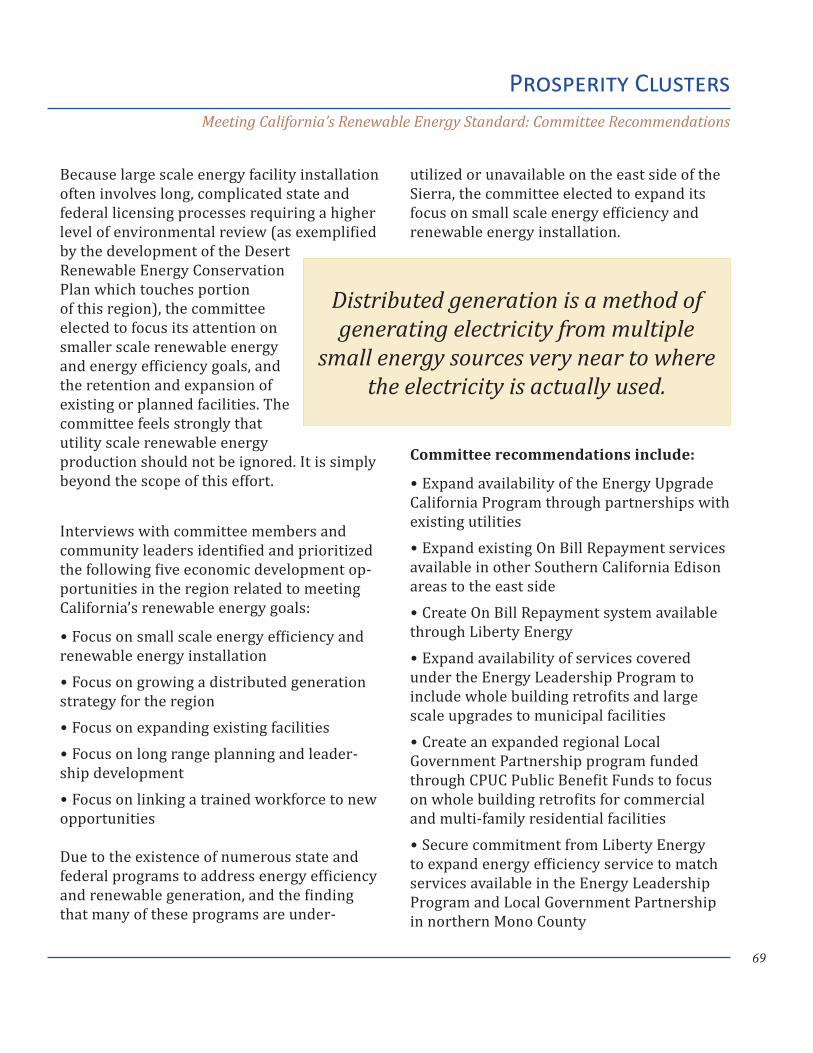
69
Prosperity ClustersMeeting California’s Renewable Energy Standard: Committee Recommendations
Because large scale energy facility installation often involves long, complicated state and federal licensing processes requiring a higher level of environmental review (as exemplified by the development of the Desert Renewable Energy Conservation Plan which touches portion of this region), the committee elected to focus its attention on smaller scale renewable energy and energy efficiency goals, and the retention and expansion of existing or planned facilities. The committee feels strongly that utility scale renewable energy production should not be ignored. It is simply beyond the scope of this effort.
Interviews with committee members and community leaders identified and prioritized the following five economic development op-portunities in the region related to meeting California’s renewable energy goals:
Focus on small scale energy efficiency and •renewable energy installation
Focus on growing a distributed generation •strategy for the region
Focus on expanding existing facilities •
Focus on long range planning and leader- •ship development
Focus on linking a trained workforce to new •opportunities
Due to the existence of numerous state and federal programs to address energy efficiency and renewable generation, and the finding that many of these programs are under-
utilized or unavailable on the east side of the Sierra, the committee elected to expand its focus on small scale energy efficiency and renewable energy installation.
Committee recommendations include:
Expand availability of the Energy Upgrade •California Program through partnerships with existing utilities
Expand existing On Bill Repayment services •available in other Southern California Edison areas to the east side
Create On Bill Repayment system available •through Liberty Energy
Expand availability of services covered •under the Energy Leadership Program to include whole building retrofits and large scale upgrades to municipal facilities
Create an expanded regional Local •Government Partnership program funded through CPUC Public Benefit Funds to focus on whole building retrofits for commercial and multi-family residential facilities
Secure commitment from Liberty Energy •to expand energy efficiency service to match services available in the Energy Leadership Program and Local Government Partnership in northern Mono County
Distributed generation is a method of generating electricity from multiple
small energy sources very near to where the electricity is actually used.
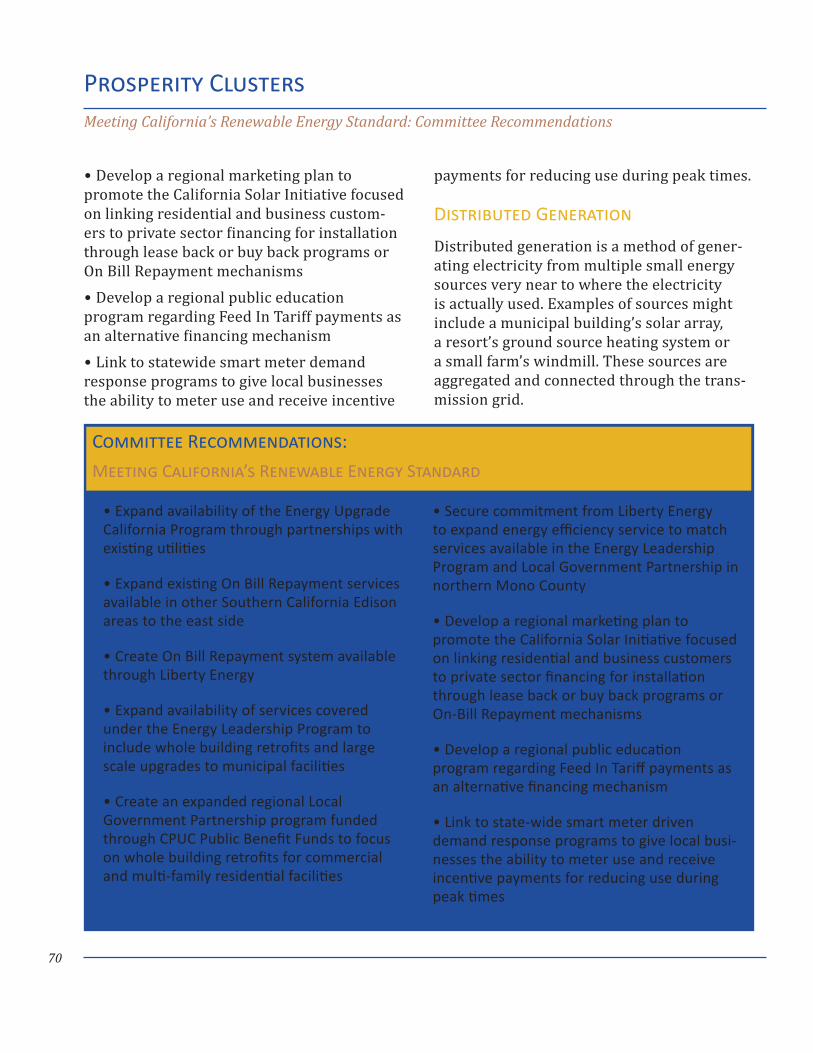
70
Develop a regional marketing plan to •promote the California Solar Initiative focused on linking residential and business custom-ers to private sector financing for installation through lease back or buy back programs or On Bill Repayment mechanisms
Develop a regional public education •program regarding Feed In Tariff payments as an alternative financing mechanism
Link to statewide smart meter demand •response programs to give local businesses the ability to meter use and receive incentive
payments for reducing use during peak times.
Distributed Generation
Distributed generation is a method of gener-ating electricity from multiple small energy sources very near to where the electricity is actually used. Examples of sources might include a municipal building’s solar array, a resort’s ground source heating system or a small farm’s windmill. These sources are aggregated and connected through the trans-mission grid.
Prosperity ClustersMeeting California’s Renewable Energy Standard: Committee Recommendations
Expand availability of the Energy Upgrade • California Program through partnerships with existing utilities
Expand existing On Bill Repayment services • available in other Southern California Edison areas to the east side
Create On Bill Repayment system available • through Liberty Energy
Expand availability of services covered • under the Energy Leadership Program to include whole building retrofits and large scale upgrades to municipal facilities
Create an expanded regional Local • Government Partnership program funded through CPUC Public Benefit Funds to focus on whole building retrofits for commercial and multi-family residential facilities
Secure commitment from Liberty Energy • to expand energy efficiency service to match services available in the Energy Leadership Program and Local Government Partnership in northern Mono County
Develop a regional marketing plan to • promote the California Solar Initiative focused on linking residential and business customers to private sector financing for installation through lease back or buy back programs or On-Bill Repayment mechanisms
Develop a regional public education • program regarding Feed In Tariff payments as an alternative financing mechanism
Link to state-wide smart meter driven • demand response programs to give local busi-nesses the ability to meter use and receive incentive payments for reducing use during peak times
Committee Recommendations:
Meeting California’s Renewable Energy Standard
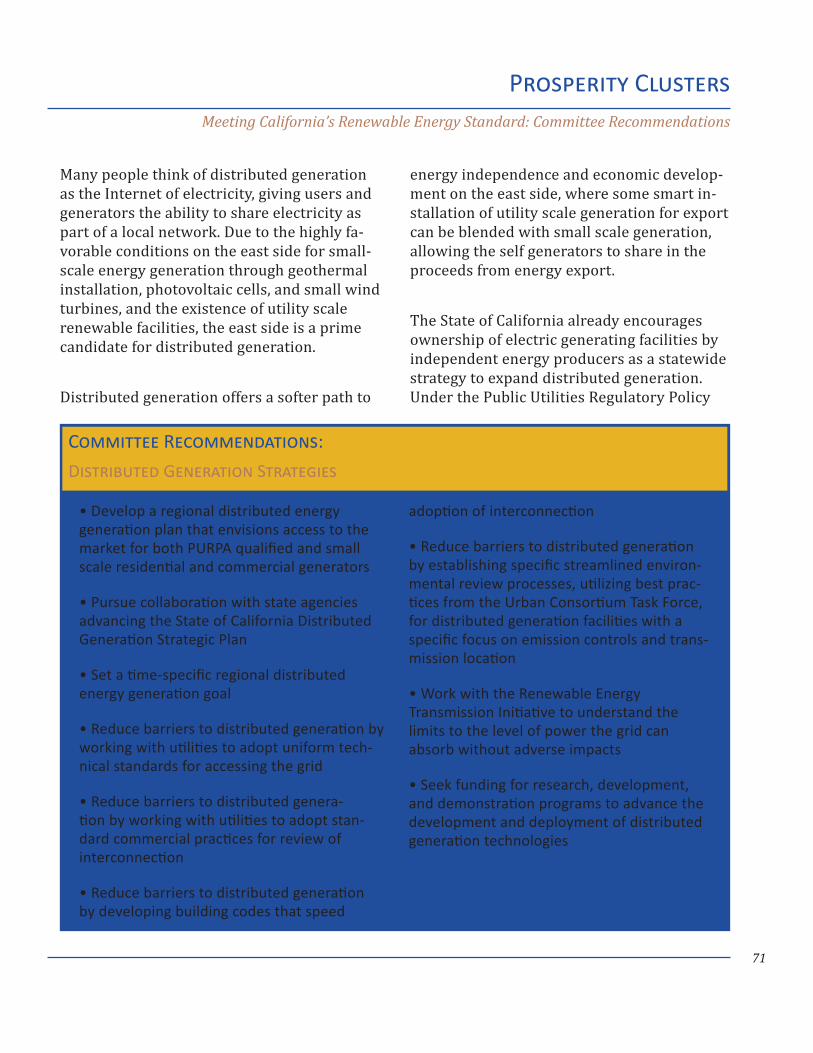
71
Many people think of distributed generation as the Internet of electricity, giving users and generators the ability to share electricity as part of a local network. Due to the highly fa-vorable conditions on the east side for small-scale energy generation through geothermal installation, photovoltaic cells, and small wind turbines, and the existence of utility scale renewable facilities, the east side is a prime candidate for distributed generation.
Distributed generation offers a softer path to
energy independence and economic develop-ment on the east side, where some smart in-stallation of utility scale generation for export can be blended with small scale generation, allowing the self generators to share in the proceeds from energy export.
The State of California already encourages ownership of electric generating facilities by independent energy producers as a statewide strategy to expand distributed generation. Under the Public Utilities Regulatory Policy
Prosperity ClustersMeeting California’s Renewable Energy Standard: Committee Recommendations
Develop a regional distributed energy • generation plan that envisions access to the market for both PURPA qualified and small scale residential and commercial generators
Pursue collaboration with state agencies • advancing the State of California Distributed Generation Strategic Plan
Set a time-specific regional distributed • energy generation goal
Reduce barriers to distributed generation by • working with utilities to adopt uniform tech-nical standards for accessing the grid
Reduce barriers to distributed genera-• tion by working with utilities to adopt stan-dard commercial practices for review of interconnection
Reduce barriers to distributed generation • by developing building codes that speed
adoption of interconnection
Reduce barriers to distributed generation • by establishing specific streamlined environ-mental review processes, utilizing best prac-tices from the Urban Consortium Task Force, for distributed generation facilities with a specific focus on emission controls and trans-mission location
Work with the Renewable Energy • Transmission Initiative to understand the limits to the level of power the grid can absorb without adverse impacts
Seek funding for research, development, • and demonstration programs to advance the development and deployment of distributed generation technologies
Committee Recommendations:
Distributed Generation Strategies
72
Prosperity ClustersMeeting California’s Renewable Energy Standard: Committee Recommendations
Act (PURPA), California guarantees a market for electricity from qualified facilities, such as the Mammoth Pacific facilities in Mono County and the Coso Geothermal Power Plant in Inyo County.
The committee elected to focus on growing a distributed generation strategy for the region by encouraging the following actions:
Develop a regional distributed energy •generation plan that envisions access to the market for both PURPA qualified and small scale residential and commercial generators
Pursue collaboration with state agencies •advancing the State of California Distributed Generation Strategic Plan
Set a time-specific regional distributed •energy generation goal
Reduce barriers to distributed generation •by working with utilities to adopt uniform technical standards for accessing the grid
Reduce barriers to distributed genera- •tion by working with utilities to adopt stan-dard commercial practices for review of interconnection
Reduce barriers to distributed generation •by developing building codes that speed adoption of interconnection
Reduce barriers to distributed generation •by establishing specific streamlined environ-mental review processes, utilizing best prac-tices from the Urban Consortium Task Force, for distributed generation facilities with a specific focus on emission controls and trans-mission location
Work with the Renewable Energy •Transmission Initiative to understand the limits to the level of power the grid can absorb without adverse impacts
Seek funding for research, development, •and demonstration programs to advance the development and deployment of distributed generation technologies.
The committee further found that substantial wind, solar and geothermal resources are present throughout Inyo and Mono Counties, and substantial opportunity for expansion of existing facilities exists. Existing transmission facilities through the counties provide some capacity to convey power generated locally to population centers throughout California and the west. However transmission capacity may not be sufficient for expanded production.
Access to the California Independent System Operators network also exists, giving power generated in the region access to Community
Target leadership development training • for local government leaders, nongovern-mental organizations, business leaders and environmental leaders to focus on energy policy and energy economic development opportunities
Coordinate development of a regional • Climate Action Plan
Committee Recommendations: Long Range Planning and Energy Policy
73
Choice Aggregators across the state, thus allowing access to more favorable pricing opportunities. However, efforts to advance general plan amendments to specifically plan for expansion of existing or new facilities has been held up by lack of environmental review.
The committee recommends the following actions:
Develop a strategy to advance approval of •an amended or redesigned Inyo County Solar and Wind Renewable Energy General Plan amendment
Coordinate efforts to seek funding for an •Environmental Impact Report for a Solar and Wind Renewable Energy General Plan amendment
Develop strategies to coordinate develop- •ment of a similar general plan amendment in Mono County
One of the key tools deployed in California for long range planning in adapting to climate change is the development of regional Climate Action Plans. Climate Action Plans include components that describe existing condi-tions regarding greenhouse gas emissions, specific climate action strategies, implemen-tation strategies, mitigation strategies, and actions to increase awareness of climate issues. Although a Climate Action Plan is not statutorily required in the eastern Sierra, op-portunities for substantial state funding are enhanced with the adoption of such a plan.
The committee further recognized that one barrier to advancing renewable energy
economic development strategies is a lack of long range planning and informed leader-ship in the region regarding energy policy. The committee recommended the following actions:
Targeted leadership development training • for local government leaders, nongovern-mental organizations, business leaders and environmental leaders, focusing on energy policy and economic development.
Coordination of the development of a • regional Climate Action Plan
Finally the committee recognized that all of these efforts represent a significant opportu-nity to leverage and expand existing vocation-al education and workforce development pro-grams, or create new programs, to increase opportunities for a skilled workforce.
Prosperity ClustersMeeting California’s Renewable Energy Standard: Committee Recommendations
Develop a strategy to advance approval • of an amended or redesigned Inyo County Solar and Wind Renewable Energy General Plan amendment
Coordinate efforts to seek funding for an • Environmental Impact Report for a Solar and Wind Renewable Energy General Plan amendment
Develop strategies to coordinate develop-• ment of a similar general plan amendment in Mono County
Committee Recommendations: Distributed Generation Strategies & Regulatory Policy
74
Prosperity ClustersMeeting California’s Renewable Energy Standard: Metrics and Measuring Success
The renewable energy cluster in the eastern Sierra is well concentrated but interviews with energy companies indicate that a sub-stantial portion of the new hires come from out of the region because it is difficult to find skilled workers, particularly mechanical engi-neers, skilled laborers and skilled mechanics.
The committee recommends the following actions:
Expand energy related vocational education •training at the community college level with a primary focus in four specific areas:
Energy efficiency technologies and * installation to drive cost savings to local businesses and residents
Green building technologies and installa-* tion to facilitate re-entry of idled workers in the construction workforce
Geothermal and solar power tech-* nologies and installation to leverage small scale and utility scale regional opportunities
Customized training programs in part-* nership with local businesses to meet specific needs
Expand partnerships with Workforce •Investment Boards on the Green Building and Clean Energy Pre-Apprenticeship Program
Actively recruit new partnerships with orga- •nized labor to expand apprenticeship training programs and streamline the assimilation of pre-trained workers into union programs
Create a regional online renewable energy •internship program linking local businesses with students at colleges and universities spe-cializing in renewable energy, including the University of Nevada at Reno, the University of Oregon, Stanford University, and the
Number of businesses, municipal facilities • and community assets served by energy efficiency programs
Number of businesses, municipal facili-• ties and community assets served by On Bill Repayment programs
Number of businesses or residential • customers served by Energy Upgrade California
Number of residential and commercial • solar installations
kWh electricity•
Number of jobs created•
Average salary of jobs created•
Financial contribution or avoided energy • costs to local businesses
Reduction in per capital greenhouse gas • emissions
Number of potential employees trained•
Actual number of employees placed•
Average median income of employees • placed
Committee Recommendations:
Meeting California’s Renewable Energy Standard — Metrics and Measuring Success
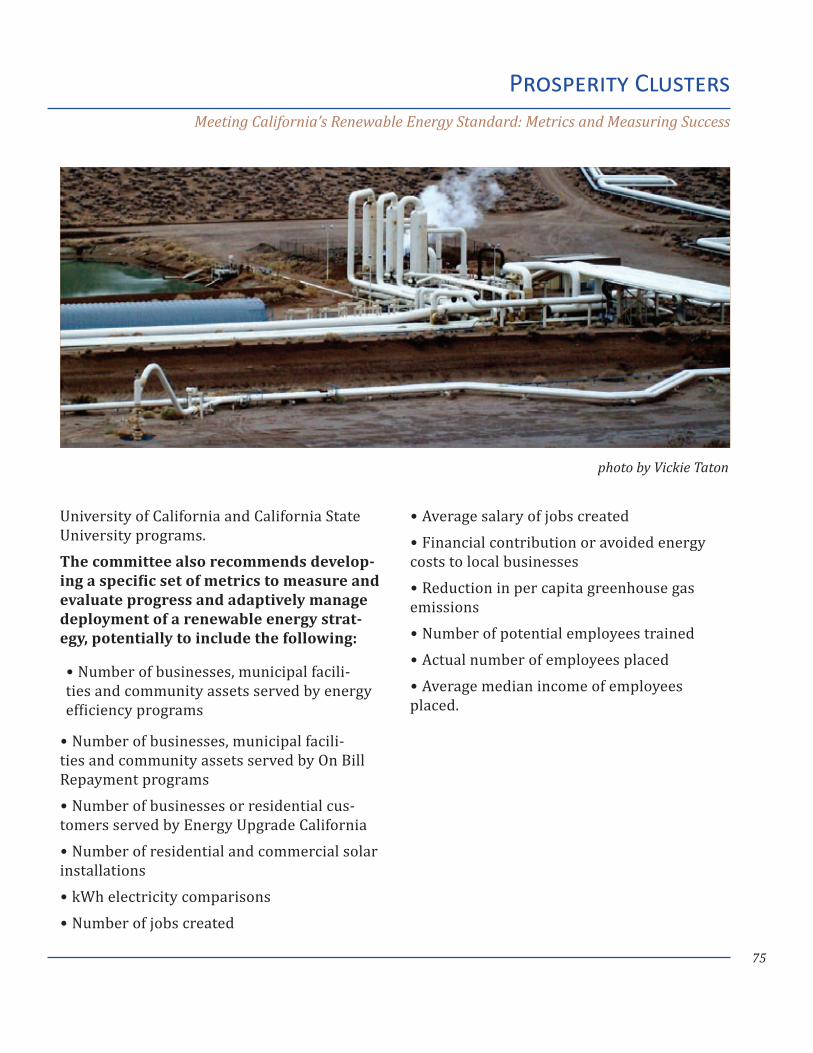
75
University of California and California State University programs.The committee also recommends develop-ing a specific set of metrics to measure and evaluate progress and adaptively manage deployment of a renewable energy strat-egy, potentially to include the following:
Number of businesses, municipal facili-• ties and community assets served by energy efficiency programs
Number of businesses, municipal facili- •ties and community assets served by On Bill Repayment programs
Number of businesses or residential cus- •tomers served by Energy Upgrade California
Number of residential and commercial solar •installations
kWh electricity comparisons •
Number of jobs created •
Average salary of jobs created •
Financial contribution or avoided energy •costs to local businesses
Reduction in per capita greenhouse gas •emissions
Number of potential employees trained •
Actual number of employees placed •
Average median income of employees •placed.
Prosperity ClustersMeeting California’s Renewable Energy Standard: Metrics and Measuring Success
photo by Vickie Taton
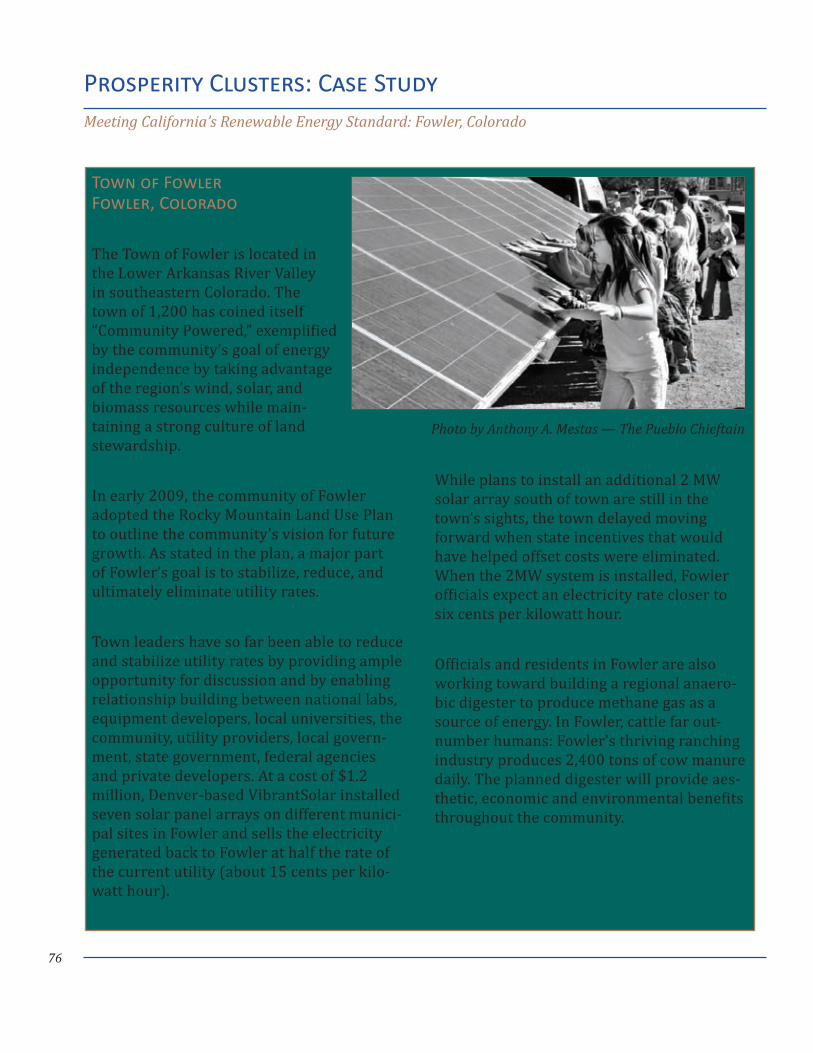
76
Prosperity Clusters: Case StudyMeeting California’s Renewable Energy Standard: Fowler, Colorado
Town of Fowler Fowler, Colorado
The Town of Fowler is located in the Lower Arkansas River Valley in southeastern Colorado. The town of 1,200 has coined itself “Community Powered,” exemplified by the community’s goal of energy independence by taking advantage of the region’s wind, solar, and biomass resources while main-taining a strong culture of land stewardship.
In early 2009, the community of Fowler adopted the Rocky Mountain Land Use Plan to outline the community’s vision for future growth. As stated in the plan, a major part of Fowler’s goal is to stabilize, reduce, and ultimately eliminate utility rates.
Town leaders have so far been able to reduce and stabilize utility rates by providing ample opportunity for discussion and by enabling relationship building between national labs, equipment developers, local universities, the community, utility providers, local govern-ment, state government, federal agencies and private developers. At a cost of $1.2 million, Denver-based VibrantSolar installed seven solar panel arrays on different munici-pal sites in Fowler and sells the electricity generated back to Fowler at half the rate of the current utility (about 15 cents per kilo-watt hour).
While plans to install an additional 2 MW solar array south of town are still in the town’s sights, the town delayed moving forward when state incentives that would have helped offset costs were eliminated. When the 2MW system is installed, Fowler officials expect an electricity rate closer to six cents per kilowatt hour.
Officials and residents in Fowler are also working toward building a regional anaero-bic digester to produce methane gas as a source of energy. In Fowler, cattle far out-number humans: Fowler’s thriving ranching industry produces 2,400 tons of cow manure daily. The planned digester will provide aes-thetic, economic and environmental benefits throughout the community.
Photo by Anthony A. Mestas — The Pueblo Chieftain
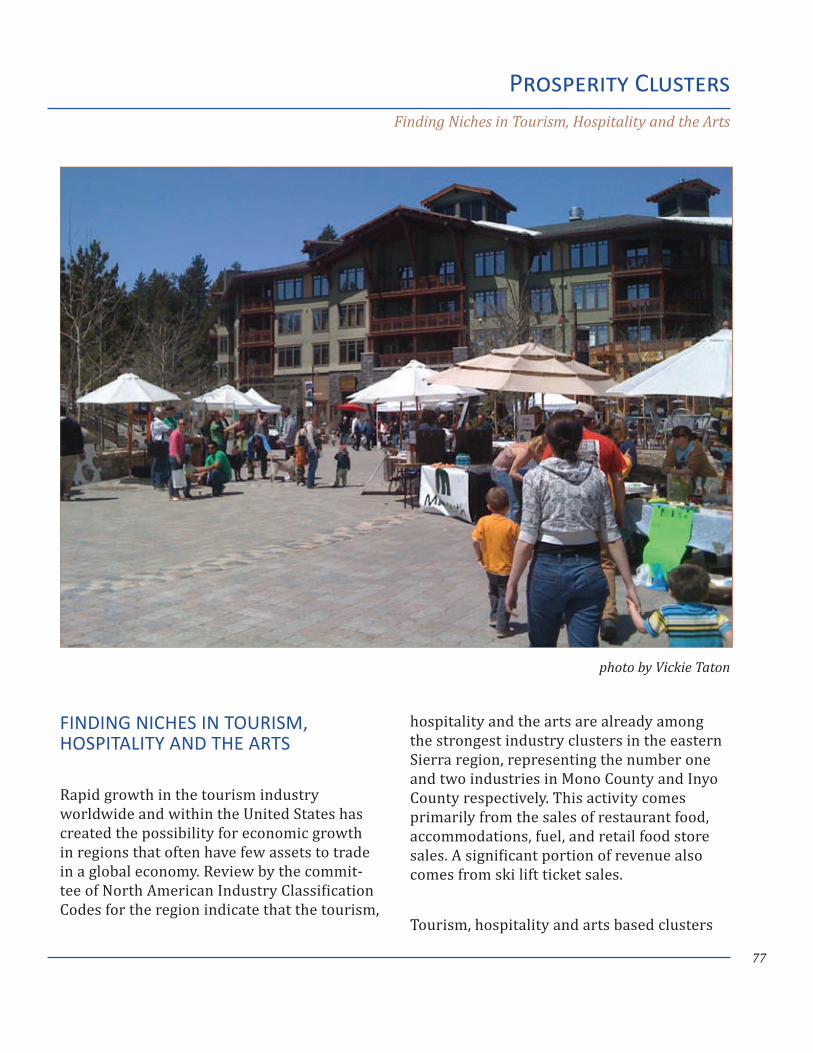
77
FINDING NICHES IN TOURISM, HOSPITALITY AND THE ARTS
Rapid growth in the tourism industry worldwide and within the United States has created the possibility for economic growth in regions that often have few assets to trade in a global economy. Review by the commit-tee of North American Industry Classification Codes for the region indicate that the tourism,
hospitality and the arts are already among the strongest industry clusters in the eastern Sierra region, representing the number one and two industries in Mono County and Inyo County respectively. This activity comes primarily from the sales of restaurant food, accommodations, fuel, and retail food store sales. A significant portion of revenue also comes from ski lift ticket sales.
Tourism, hospitality and arts based clusters
Prosperity ClustersFinding Niches in Tourism, Hospitality and the Arts
photo by Vickie Taton
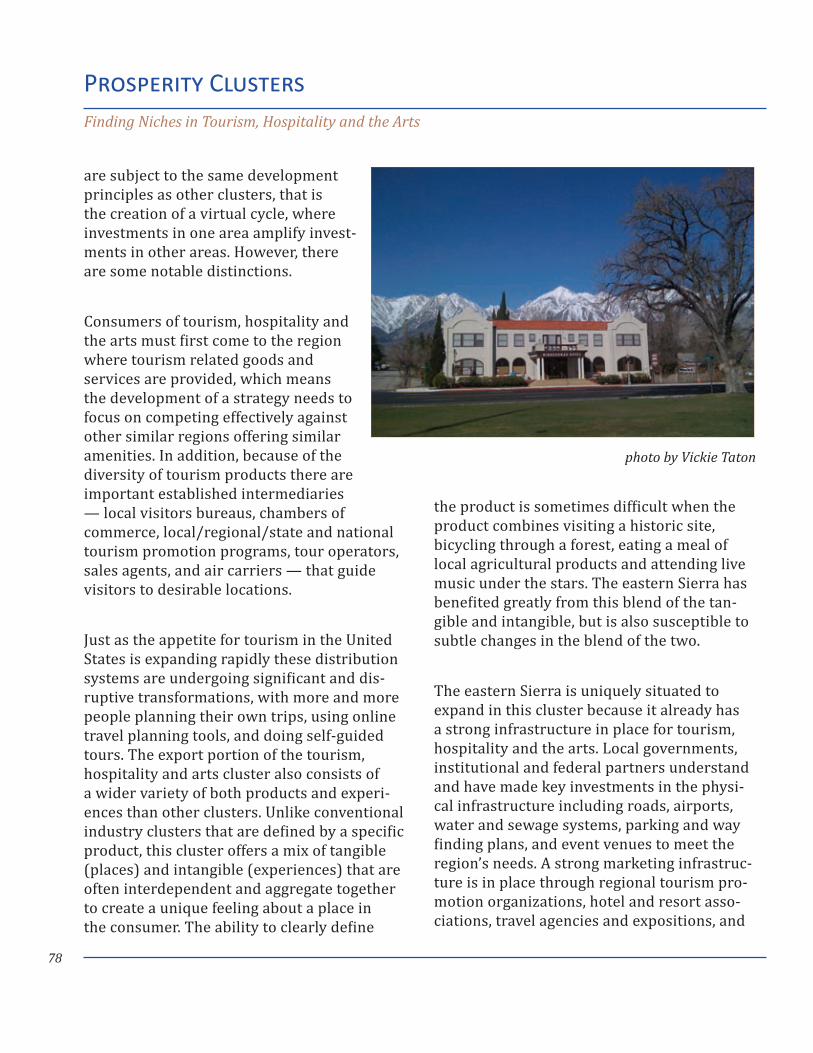
78
are subject to the same development principles as other clusters, that is the creation of a virtual cycle, where investments in one area amplify invest-ments in other areas. However, there are some notable distinctions.
Consumers of tourism, hospitality and the arts must first come to the region where tourism related goods and services are provided, which means the development of a strategy needs to focus on competing effectively against other similar regions offering similar amenities. In addition, because of the diversity of tourism products there are important established intermediaries — local visitors bureaus, chambers of commerce, local/regional/state and national tourism promotion programs, tour operators, sales agents, and air carriers — that guide visitors to desirable locations.
Just as the appetite for tourism in the United States is expanding rapidly these distribution systems are undergoing significant and dis-ruptive transformations, with more and more people planning their own trips, using online travel planning tools, and doing self-guided tours. The export portion of the tourism, hospitality and arts cluster also consists of a wider variety of both products and experi-ences than other clusters. Unlike conventional industry clusters that are defined by a specific product, this cluster offers a mix of tangible (places) and intangible (experiences) that are often interdependent and aggregate together to create a unique feeling about a place in the consumer. The ability to clearly define
the product is sometimes difficult when the product combines visiting a historic site, bicycling through a forest, eating a meal of local agricultural products and attending live music under the stars. The eastern Sierra has benefited greatly from this blend of the tan-gible and intangible, but is also susceptible to subtle changes in the blend of the two.
The eastern Sierra is uniquely situated to expand in this cluster because it already has a strong infrastructure in place for tourism, hospitality and the arts. Local governments, institutional and federal partners understand and have made key investments in the physi-cal infrastructure including roads, airports, water and sewage systems, parking and way finding plans, and event venues to meet the region’s needs. A strong marketing infrastruc-ture is in place through regional tourism pro-motion organizations, hotel and resort asso-ciations, travel agencies and expositions, and
Prosperity ClustersFinding Niches in Tourism, Hospitality and the Arts
photo by Vickie Taton
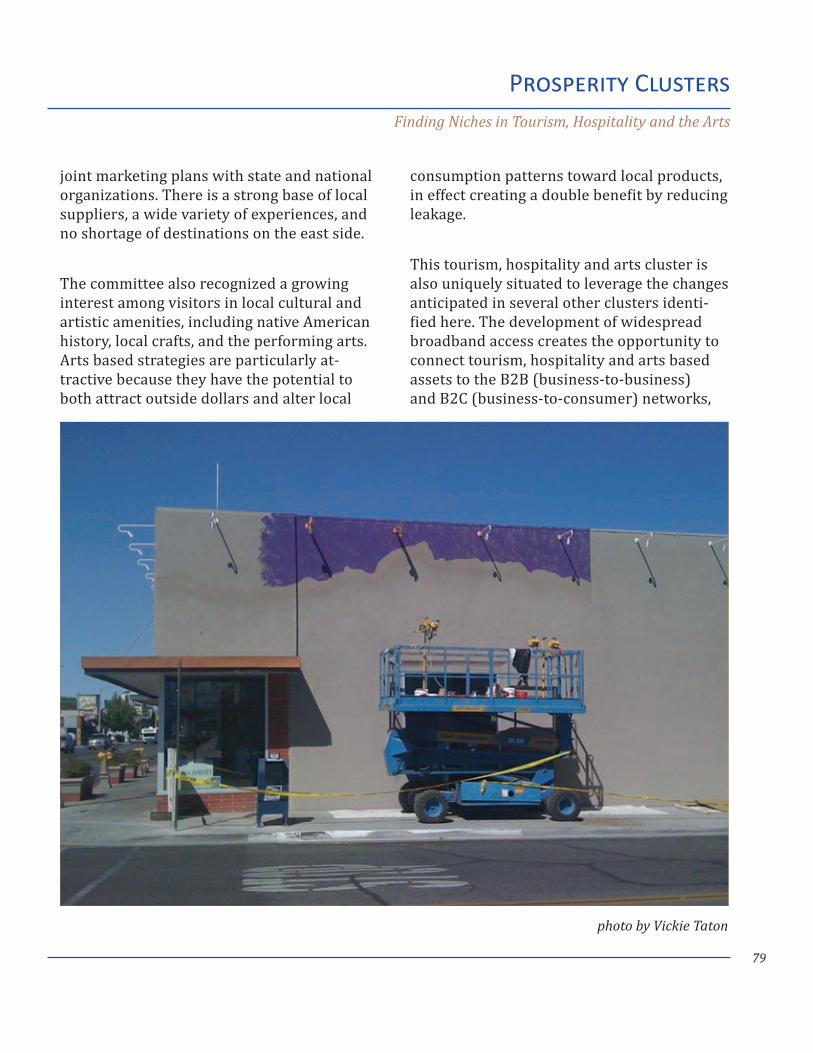
79
joint marketing plans with state and national organizations. There is a strong base of local suppliers, a wide variety of experiences, and no shortage of destinations on the east side.
The committee also recognized a growing interest among visitors in local cultural and artistic amenities, including native American history, local crafts, and the performing arts. Arts based strategies are particularly at-tractive because they have the potential to both attract outside dollars and alter local
consumption patterns toward local products, in effect creating a double benefit by reducing leakage.
This tourism, hospitality and arts cluster is also uniquely situated to leverage the changes anticipated in several other clusters identi-fied here. The development of widespread broadband access creates the opportunity to connect tourism, hospitality and arts based assets to the B2B (business-to-business) and B2C (business-to-consumer) networks,
Prosperity ClustersFinding Niches in Tourism, Hospitality and the Arts
photo by Vickie Taton
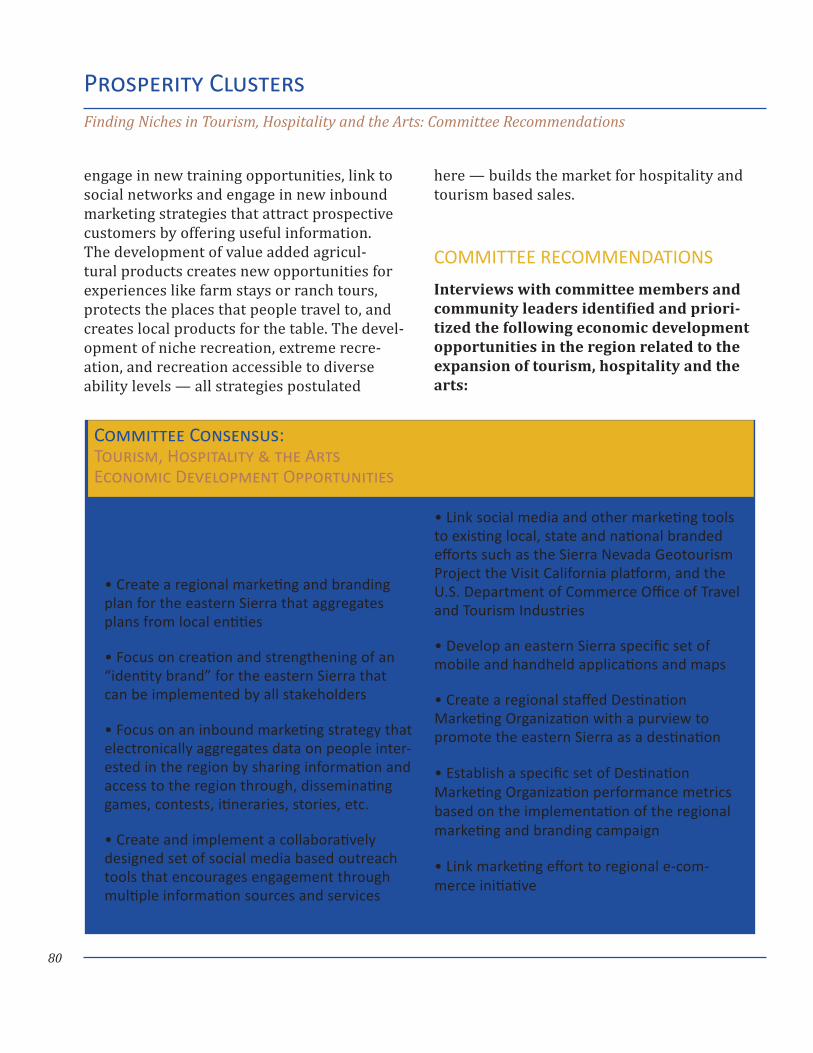
80
engage in new training opportunities, link to social networks and engage in new inbound marketing strategies that attract prospective customers by offering useful information. The development of value added agricul-tural products creates new opportunities for experiences like farm stays or ranch tours, protects the places that people travel to, and creates local products for the table. The devel-opment of niche recreation, extreme recre-ation, and recreation accessible to diverse ability levels — all strategies postulated
here — builds the market for hospitality and tourism based sales.
COMMITTEE RECOMMENDATIONS
Interviews with committee members and community leaders identified and priori-tized the following economic development opportunities in the region related to the expansion of tourism, hospitality and the arts:
Develop web based media and marketing tools to expand visibility and access to local assets and the arts
Create a regional marketing and branding • plan for the eastern Sierra that aggregates plans from local entities
Focus on creation and strengthening of an • “identity brand” for the eastern Sierra that can be implemented by all stakeholders
Focus on an inbound marketing strategy that • electronically aggregates data on people inter-ested in the region by sharing information and access to the region through, disseminating games, contests, itineraries, stories, etc.
Create and implement a collaboratively • designed set of social media based outreach tools that encourages engagement through multiple information sources and services
Link social media and other marketing tools • to existing local, state and national branded efforts such as the Sierra Nevada Geotourism Project the Visit California platform, and the U.S. Department of Commerce Office of Travel and Tourism Industries
Develop an eastern Sierra specific set of • mobile and handheld applications and maps
Create a regional staffed Destination • Marketing Organization with a purview to promote the eastern Sierra as a destination
Establish a specific set of Destination • Marketing Organization performance metrics based on the implementation of the regional marketing and branding campaign
Link marketing effort to regional e-com-• merce initiative
Prosperity ClustersFinding Niches in Tourism, Hospitality and the Arts: Committee Recommendations
Committee Consensus: Tourism, Hospitality & the Arts Economic Development Opportunities
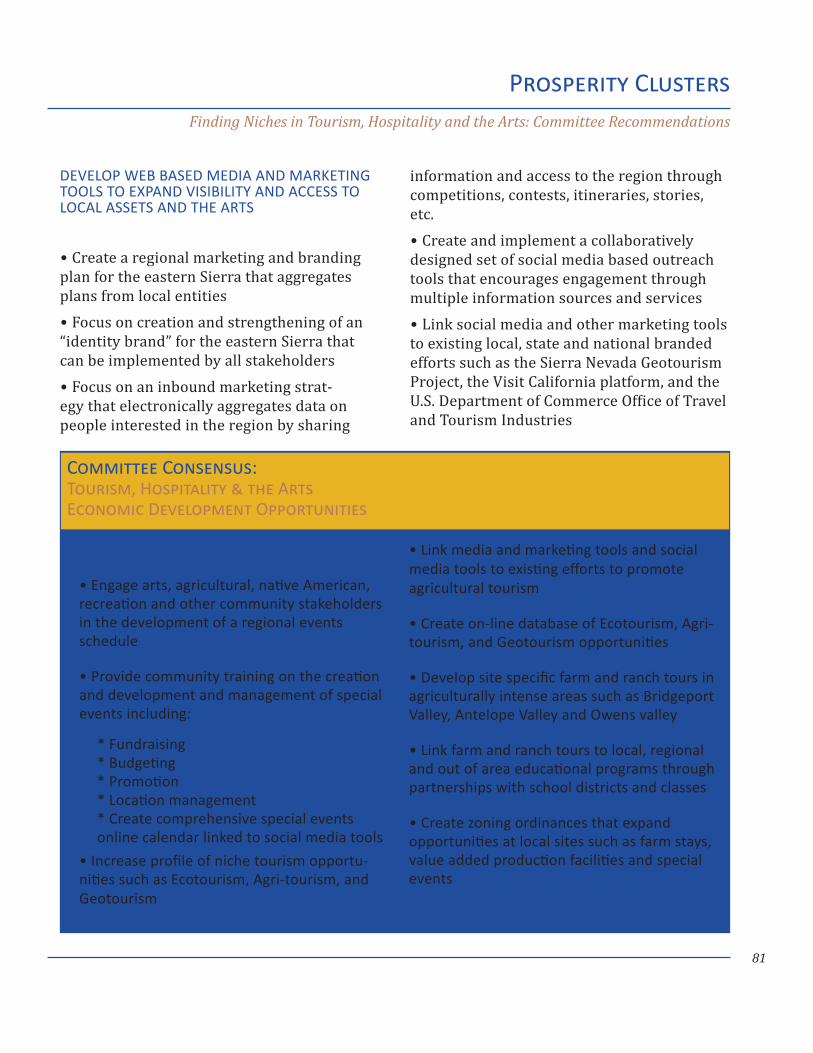
81
DEVELOP WEB BASED MEDIA AND MARKETING TOOLS TO EXPAND VISIBILITY AND ACCESS TO LOCAL ASSETS AND THE ARTS
Create a regional marketing and branding •plan for the eastern Sierra that aggregates plans from local entities
Focus on creation and strengthening of an •“identity brand” for the eastern Sierra that can be implemented by all stakeholders
Focus on an inbound marketing strat- •egy that electronically aggregates data on people interested in the region by sharing
information and access to the region through competitions, contests, itineraries, stories, etc.
Create and implement a collaboratively •designed set of social media based outreach tools that encourages engagement through multiple information sources and services
Link social media and other marketing tools •to existing local, state and national branded efforts such as the Sierra Nevada Geotourism Project, the Visit California platform, and the U.S. Department of Commerce Office of Travel and Tourism Industries
Prosperity ClustersFinding Niches in Tourism, Hospitality and the Arts: Committee Recommendations
Expand and Create New Special Events
Engage arts, agricultural, native American, • recreation and other community stakeholders in the development of a regional events schedule
Provide community training on the creation • and development and management of special events including:
Fundraising* Budgeting* Promotion* Location management* Create comprehensive special events *
online calendar linked to social media tools
Increase profile of niche tourism opportu-• nities such as Ecotourism, Agri-tourism, and Geotourism
Link media and marketing tools and social • media tools to existing efforts to promote agricultural tourism
Create on-line database of Ecotourism, Agri-• tourism, and Geotourism opportunities
Develop site specific farm and ranch tours in • agriculturally intense areas such as Bridgeport Valley, Antelope Valley and Owens valley
Link farm and ranch tours to local, regional • and out of area educational programs through partnerships with school districts and classes
Create zoning ordinances that expand • opportunities at local sites such as farm stays, value added production facilities and special events
Committee Consensus: Tourism, Hospitality & the Arts Economic Development Opportunities
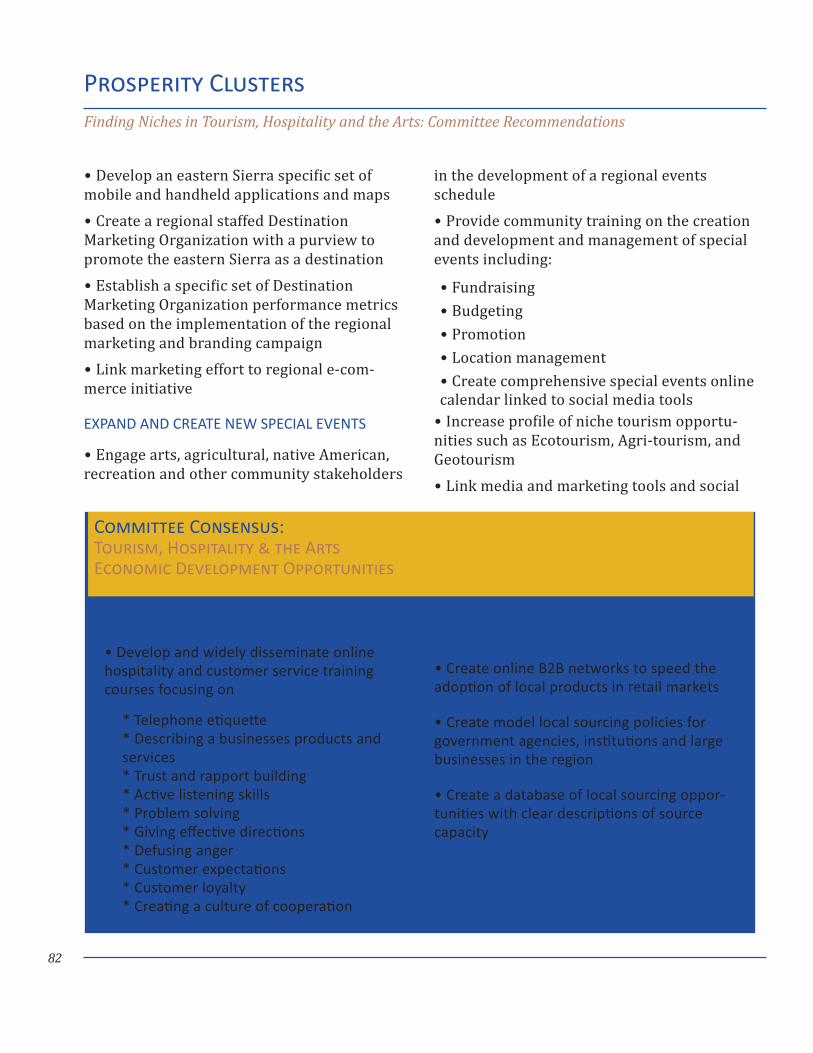
82
Develop an eastern Sierra specific set of •mobile and handheld applications and maps
Create a regional staffed Destination •Marketing Organization with a purview to promote the eastern Sierra as a destination
Establish a specific set of Destination •Marketing Organization performance metrics based on the implementation of the regional marketing and branding campaign
Link marketing effort to regional e-com- •merce initiative
EXPAND AND CREATE NEW SPECIAL EVENTS
Engage arts, agricultural, native American, •recreation and other community stakeholders
in the development of a regional events schedule
Provide community training on the creation •and development and management of special events including:
Fundraising•
Budgeting•
Promotion•
Location management•
Create comprehensive special events online • calendar linked to social media toolsIncrease profile of niche tourism opportu- •
nities such as Ecotourism, Agri-tourism, and Geotourism
Link media and marketing tools and social •
Prosperity ClustersFinding Niches in Tourism, Hospitality and the Arts: Committee Recommendations
Customer service/hospitality Training
Develop and widely disseminate online • hospitality and customer service training courses focusing on
Telephone etiquette* Describing a businesses products and *
servicesTrust and rapport building* Active listening skills* Problem solving* Giving effective directions* Defusing anger* Customer expectations* Customer loyalty* Creating a culture of cooperation*
Expand availability of local products through local retailers
Create online B2B networks to speed the • adoption of local products in retail markets
Create model local sourcing policies for • government agencies, institutions and large businesses in the region
Create a database of local sourcing oppor-• tunities with clear descriptions of source capacity
Committee Consensus: Tourism, Hospitality & the Arts Economic Development Opportunities
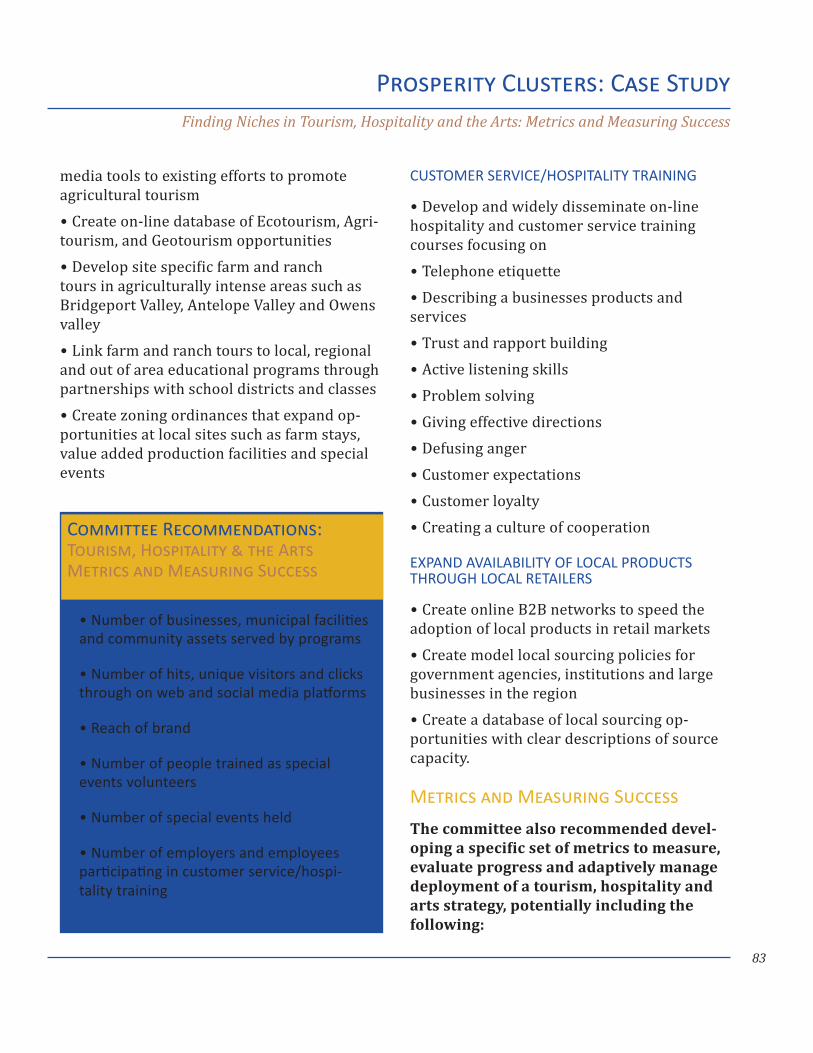
83
media tools to existing efforts to promote agricultural tourism
Create on-line database of Ecotourism, Agri- •tourism, and Geotourism opportunities
Develop site specific farm and ranch •tours in agriculturally intense areas such as Bridgeport Valley, Antelope Valley and Owens valley
Link farm and ranch tours to local, regional •and out of area educational programs through partnerships with school districts and classes
Create zoning ordinances that expand op- •portunities at local sites such as farm stays, value added production facilities and special events
CUSTOMER SERVICE/HOSPITALITY TRAINING
Develop and widely disseminate on-line •hospitality and customer service training courses focusing on
Telephone etiquette •
Describing a businesses products and •services
Trust and rapport building •
Active listening skills •
Problem solving •
Giving effective directions •
Defusing anger •
Customer expectations •
Customer loyalty •
Creating a culture of cooperation •
EXPAND AVAILABILITY OF LOCAL PRODUCTS THROUGH LOCAL RETAILERS
Create online B2B networks to speed the •adoption of local products in retail markets
Create model local sourcing policies for •government agencies, institutions and large businesses in the region
Create a database of local sourcing op- •portunities with clear descriptions of source capacity.
Metrics and Measuring Success
The committee also recommended devel-oping a specific set of metrics to measure, evaluate progress and adaptively manage deployment of a tourism, hospitality and arts strategy, potentially including the following:
Prosperity Clusters: Case StudyFinding Niches in Tourism, Hospitality and the Arts: Metrics and Measuring Success
Number of businesses, municipal facilities • and community assets served by programs
Number of hits, unique visitors and clicks • through on web and social media platforms
Reach of brand•
Number of people trained as special • events volunteers
Number of special events held•
Number of employers and employees • participating in customer service/hospi-tality training
Committee Recommendations: Tourism, Hospitality & the Arts Metrics and Measuring Success
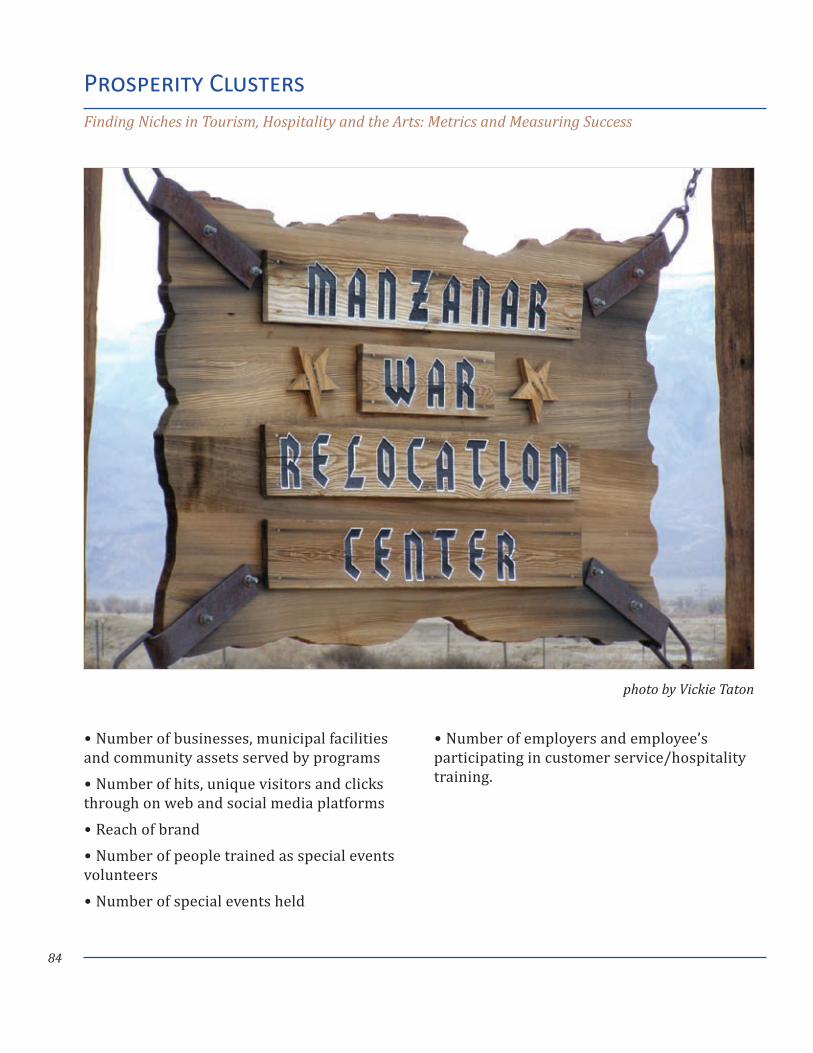
84
Number of businesses, municipal facilities •and community assets served by programs
Number of hits, unique visitors and clicks •through on web and social media platforms
Reach of brand •
Number of people trained as special events •volunteers
Number of special events held •
Number of employers and employee’s •participating in customer service/hospitality training.
Prosperity ClustersFinding Niches in Tourism, Hospitality and the Arts: Metrics and Measuring Success
photo by Vickie Taton
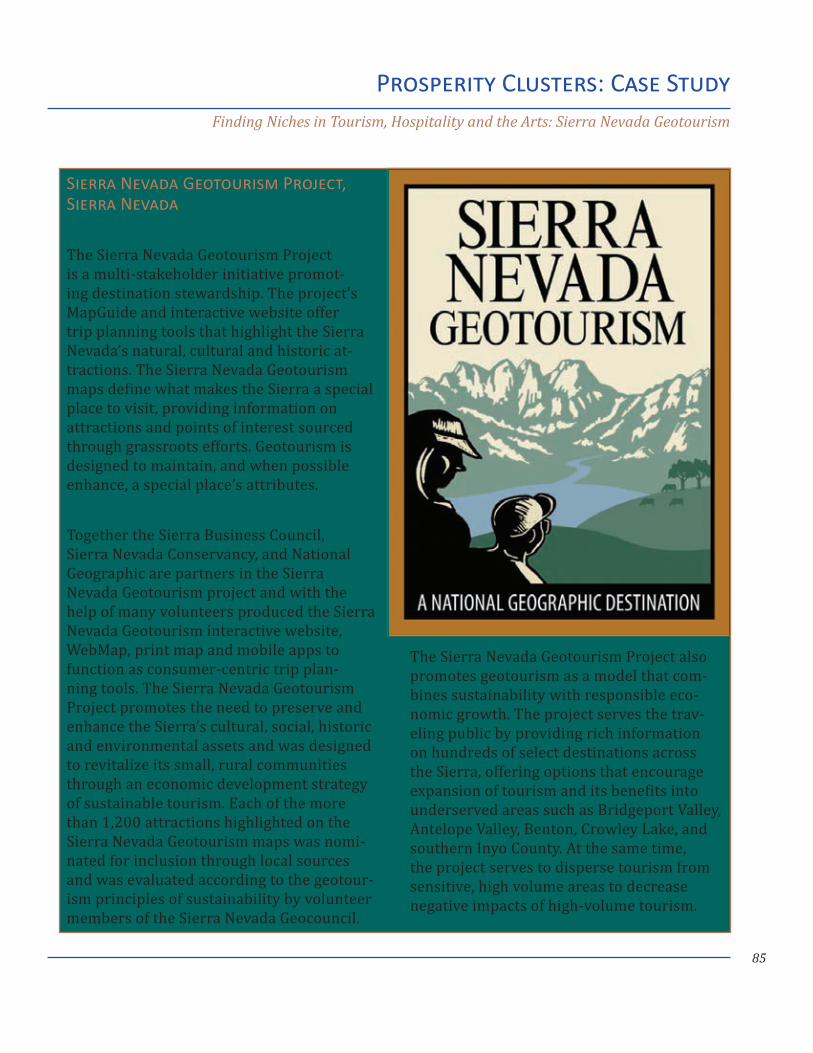
85
Prosperity Clusters: Case StudyFinding Niches in Tourism, Hospitality and the Arts: Sierra Nevada Geotourism
Sierra Nevada Geotourism Project, Sierra Nevada
The Sierra Nevada Geotourism Project is a multi-stakeholder initiative promot-ing destination stewardship. The project’s MapGuide and interactive website offer trip planning tools that highlight the Sierra Nevada’s natural, cultural and historic at-tractions. The Sierra Nevada Geotourism maps define what makes the Sierra a special place to visit, providing information on attractions and points of interest sourced through grassroots efforts. Geotourism is designed to maintain, and when possible enhance, a special place’s attributes.
Together the Sierra Business Council, Sierra Nevada Conservancy, and National Geographic are partners in the Sierra Nevada Geotourism project and with the help of many volunteers produced the Sierra Nevada Geotourism interactive website, WebMap, print map and mobile apps to function as consumer-centric trip plan-ning tools. The Sierra Nevada Geotourism Project promotes the need to preserve and enhance the Sierra’s cultural, social, historic and environmental assets and was designed to revitalize its small, rural communities through an economic development strategy of sustainable tourism. Each of the more than 1,200 attractions highlighted on the Sierra Nevada Geotourism maps was nomi-nated for inclusion through local sources and was evaluated according to the geotour-ism principles of sustainability by volunteer members of the Sierra Nevada Geocouncil.
The Sierra Nevada Geotourism Project also promotes geotourism as a model that com-bines sustainability with responsible eco-nomic growth. The project serves the trav-eling public by providing rich information on hundreds of select destinations across the Sierra, offering options that encourage expansion of tourism and its benefits into underserved areas such as Bridgeport Valley, Antelope Valley, Benton, Crowley Lake, and southern Inyo County. At the same time, the project serves to disperse tourism from sensitive, high volume areas to decrease negative impacts of high-volume tourism.
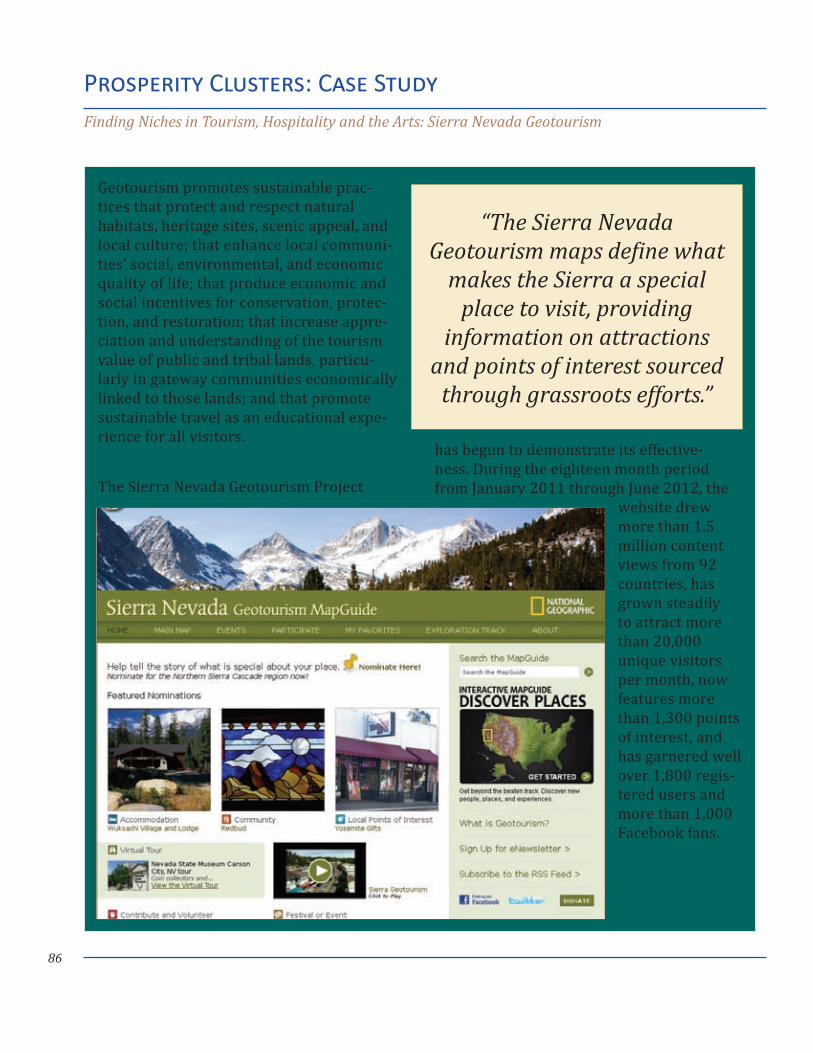
86
Geotourism promotes sustainable prac-tices that protect and respect natural habitats, heritage sites, scenic appeal, and local culture; that enhance local communi-ties’ social, environmental, and economic quality of life; that produce economic and social incentives for conservation, protec-tion, and restoration; that increase appre-ciation and understanding of the tourism value of public and tribal lands, particu-larly in gateway communities economically linked to those lands; and that promote sustainable travel as an educational expe-rience for all visitors.
The Sierra Nevada Geotourism Project
has begun to demonstrate its effective-ness. During the eighteen month period from January 2011 through June 2012, the
website drew more than 1.5 million content views from 92 countries, has grown steadily to attract more than 20,000 unique visitors per month, now features more than 1,300 points of interest, and has garnered well over 1,800 regis-tered users and more than 1,000 Facebook fans.
Prosperity Clusters: Case StudyFinding Niches in Tourism, Hospitality and the Arts: Sierra Nevada Geotourism
“The Sierra Nevada Geotourism maps define what
makes the Sierra a special place to visit, providing
information on attractions and points of interest sourced
through grassroots efforts.”
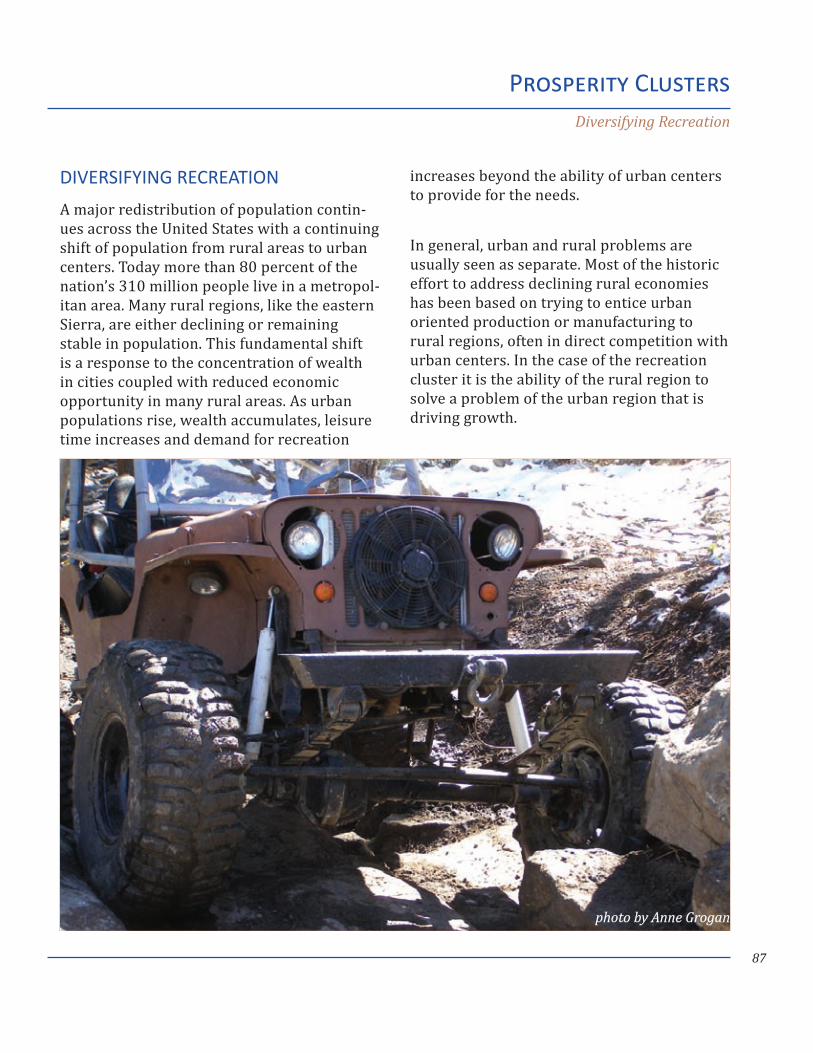
87
DIVERSIFYING RECREATION
A major redistribution of population contin-ues across the United States with a continuing shift of population from rural areas to urban centers. Today more than 80 percent of the nation’s 310 million people live in a metropol-itan area. Many rural regions, like the eastern Sierra, are either declining or remaining stable in population. This fundamental shift is a response to the concentration of wealth in cities coupled with reduced economic opportunity in many rural areas. As urban populations rise, wealth accumulates, leisure time increases and demand for recreation
increases beyond the ability of urban centers to provide for the needs.
In general, urban and rural problems are usually seen as separate. Most of the historic effort to address declining rural economies has been based on trying to entice urban oriented production or manufacturing to rural regions, often in direct competition with urban centers. In the case of the recreation cluster it is the ability of the rural region to solve a problem of the urban region that is driving growth.
Prosperity ClustersDiversifying Recreation
photo by Anne Grogan
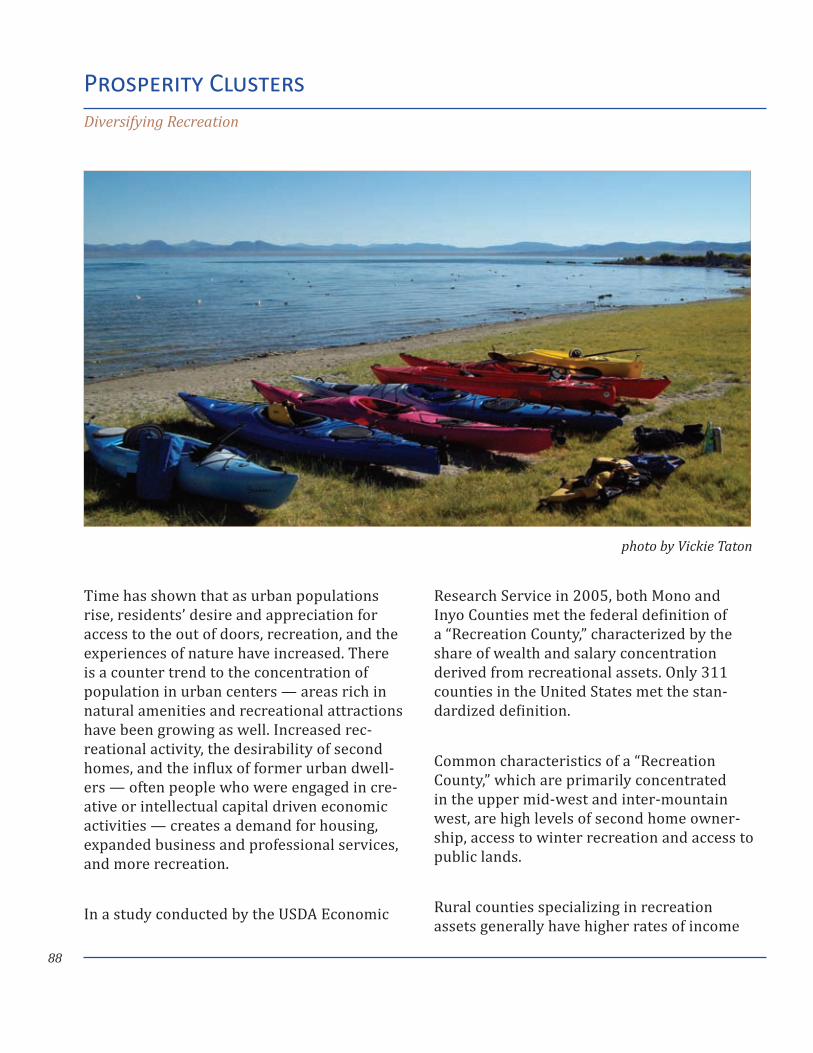
88
Time has shown that as urban populations rise, residents’ desire and appreciation for access to the out of doors, recreation, and the experiences of nature have increased. There is a counter trend to the concentration of population in urban centers — areas rich in natural amenities and recreational attractions have been growing as well. Increased rec-reational activity, the desirability of second homes, and the influx of former urban dwell-ers — often people who were engaged in cre-ative or intellectual capital driven economic activities — creates a demand for housing, expanded business and professional services, and more recreation.
In a study conducted by the USDA Economic
Research Service in 2005, both Mono and Inyo Counties met the federal definition of a “Recreation County,” characterized by the share of wealth and salary concentration derived from recreational assets. Only 311 counties in the United States met the stan-dardized definition.
Common characteristics of a “Recreation County,” which are primarily concentrated in the upper mid-west and inter-mountain west, are high levels of second home owner-ship, access to winter recreation and access to public lands.
Rural counties specializing in recreation assets generally have higher rates of income
Prosperity ClustersDiversifying Recreation
photo by Vickie Taton
89
growth than non-recreation counties, but due to cold winters some may not attract as many year round residents, leading to dra-matic seasonal fluctuations in population, and thus economic activity. They suffer a very special set of related problems as well. Often they struggle to achieve higher income job growth, are more dependent upon and sensi-tive to changes in the real estate market due to high levels of retirees and second home-owners, and have problems with seasonal-ity of employment. Recreation development can involve significant economic leakages since many of the goods and services used come from outside the community, tempo-rary workers may be required to fill jobs at ski resorts and hotels, and many retail estab-lishments may be national chains, meaning money from residents and tourists leaves the community. The eastern Sierra has suffered from all of these problems in the past.
Across the country changes in demographics, preferences and leisure time are driving rec-reation economies. No place is this more true than in regions rich in public lands.
The economic benefits of public lands in Inyo and Mono Counties are now the primary economic development drivers of the two economies, with public lands responsible for an estimated economic value of between $662.2 million and $784.2 million per year, between $124.9 million and $170.9 million of that associated with the direct use (rec-reation) of public lands, and $98.1 million identified as annual income earned in the counties (Richardson, 2002). Total visitors to public lands in Inyo and Mono Counties are
approximately 2,886,747 people per year. National trends since have shown visitation to public lands increasing.
This trend, coupled with the extensive use of private recreational assets and improvements on public lands, such as ski areas, indicates that tremendous additional economic value can be derived in Inyo and Mono Counties from these lands.
Increases in population in the inter-mountain west among the Latino community who are discovering the unique American experi-ence of visiting public lands is accelerating the rise of regional recreation economies. Approximately 12 million Latinos live in California, or about one-third of the popu-lation, expected to grow to more than 40 percent by 2025. Public lands provide a unique experience for Latinos who are drawn by scenery, sightseeing, and special events, and who often use facilities as a larger family unit and prefer developed sites with services. Public lands also have a tendency to attract private recreational development as well.
The eastern Sierra has benefited from this fundamental dynamic for generations, with an ample supply of not only public lands, but also privately developed recreational lands, and an amazingly diverse set of recreational opportunities, including everything from tra-ditional pursuits like hiking, golfing, fishing, hunting, skiing, boating, and camping, to more extreme pursuits like high altitude running, bike racing, ice climbing, winter camping, big wall climbing, and extreme Nordic skiing.
Prosperity ClustersDiversifying Recreation
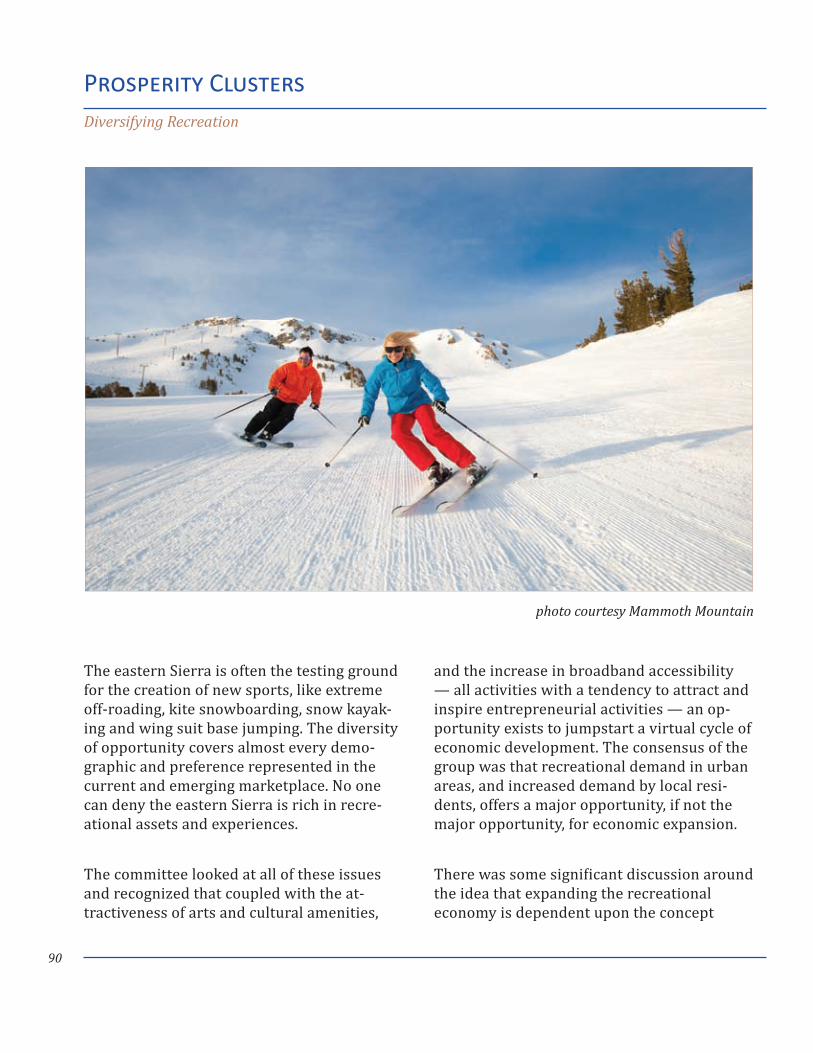
90
Prosperity ClustersDiversifying Recreation
The eastern Sierra is often the testing ground for the creation of new sports, like extreme off-roading, kite snowboarding, snow kayak-ing and wing suit base jumping. The diversity of opportunity covers almost every demo-graphic and preference represented in the current and emerging marketplace. No one can deny the eastern Sierra is rich in recre-ational assets and experiences.
The committee looked at all of these issues and recognized that coupled with the at-tractiveness of arts and cultural amenities,
and the increase in broadband accessibility — all activities with a tendency to attract and inspire entrepreneurial activities — an op-portunity exists to jumpstart a virtual cycle of economic development. The consensus of the group was that recreational demand in urban areas, and increased demand by local resi-dents, offers a major opportunity, if not the major opportunity, for economic expansion.
There was some significant discussion around the idea that expanding the recreational economy is dependent upon the concept
photo courtesy Mammoth Mountain
91
of creating a new relationship between the co-dependent rural and urban regions. Regardless of national recreational tourism trends, and due to the relatively remote loca-tion, the eastern Sierra is going to be more connected and dependent upon the specific urban-rural linkages, such as the southern California market and to a lesser degree the Nevada market, than are many other com-peting recreational areas. The advent of air service has begun to reduce this dependence, but the simple fact remains the eastern Sierra competes head-to-head with the Tahoe Basin for California’s second largest market: the Bay area.
In addition, there was agreement that al-though urban customers are seeking to remove themselves from the discomforts of the city they are not seeking to leave all of the amenities of the city. The scope of the com-mittee’s work did not address large-scale long-term public or private sector capital improvements, such as ice rinks, new parks, or entirely new facilities.
The committee recognized that the recreation cluster is an area where residents and busi-ness owners on the ground have already done a great deal of work. Consequently our group focused on areas where new opportunities could exist based on increasing usage by ex-isting or emerging markets due to the unique diversity of the eastern Sierra landscape primarily, and increasing our competitiveness with other recreation counties secondarily.
Finally, the committee recognized that there
were many different categories or types of recreation available in the eastern Sierra, from extreme to sedate, from winter to summer, from passive to active, as mentioned above. Any strategy to expand or fill under-utilized niches will require micro-targeting activities within specific categories.
COMMITTEE RECOMMENDATIONS
Interviews with committee members and community leaders identified and priori-tized the following economic development opportunities in the region related to the expansion of recreational tourism:
INCREASE FOCUS ON RECREATIONAL ACCESS FOR DIVERSE ABILITY AND AGE LEVELS AND UNDERSERVED GEOGRAPHIC AREAS
Conduct an existing conditions gaps analysis •to identify categories of recreation available by geographic location modeled on the Mono County Recreation Access Toolkit
Utilize existing inventories of recreational •access points to identify and classify assets based on categories and ability levels
Identify gaps in geographic areas, categories •and access for specific ability levels
Assess and prioritize existing categories and •access points relative to new, emerging, or growing areas of recreational activity
Produce a community based prioritized list •of category and access improvement projects by ability level (trail systems, parking, access points)
Link mobility plan and recreational access •goals
Prosperity ClustersDiversifying Recreation: Committee Recommendations
92
Link access improvement goals to boosting •off-season and mid-week access where sig-nificant underutilized capacity exists
Identify potential parties responsible for •implementation
Develop capital improvement plans in part- •nership with public and private entities to fill gaps in access
Link funding sources to capital •improvements
IMPROVE “WAY FINDING” AND EXPAND ACCESS TO INFORMATION ABOUT ITS USE
Increase coordination with •USFS and BLM to partner on way finding processes
Develop a regional way finding •master plan in partnership with federal land management agen-cies (utilizing processes already in place in Mammoth Lakes)
Develop regional way-finding •brand
Develop way finding print •maps
Develop online way finding tools, including •applications, online databases, downloadable directions, and printable maps, with a special emphasis on “How to get to what I see.”
Network online way finding tools to local, •regional, state and national online tools such as National Park Service maps and apps, Geotourism apps and maps, etc.
Focus portion of way finding effort on dra- •matically improving outreach and access for
the Latino community
DEVELOP OPPORTUNITIES FOR NON-TRADITIONAL ACTIVITIES
Use gaps analysis to identify top priority •recreational activities
Increase coordination with USFS and •BLM to develop and market joint recreation opportunities:
Extreme sports •
Create specific way finding materials for * extreme sports activities
Provide better information or online * “one stop shop” for permitting extreme activities
Develop regional film and social media *
Prosperity ClustersDiversifying Recreation: Economic Development Opportunities
“A Way-finding system incorporates branding, signs, maps and directional
devices that tell us where we are, where we want to go, and how to get there.
Symbols can contribute simplicity, clarity and personality to a way-finding
system.”
~ Courier News, January 6, 2008“Wayfinding: New Directions for NJ Signage”
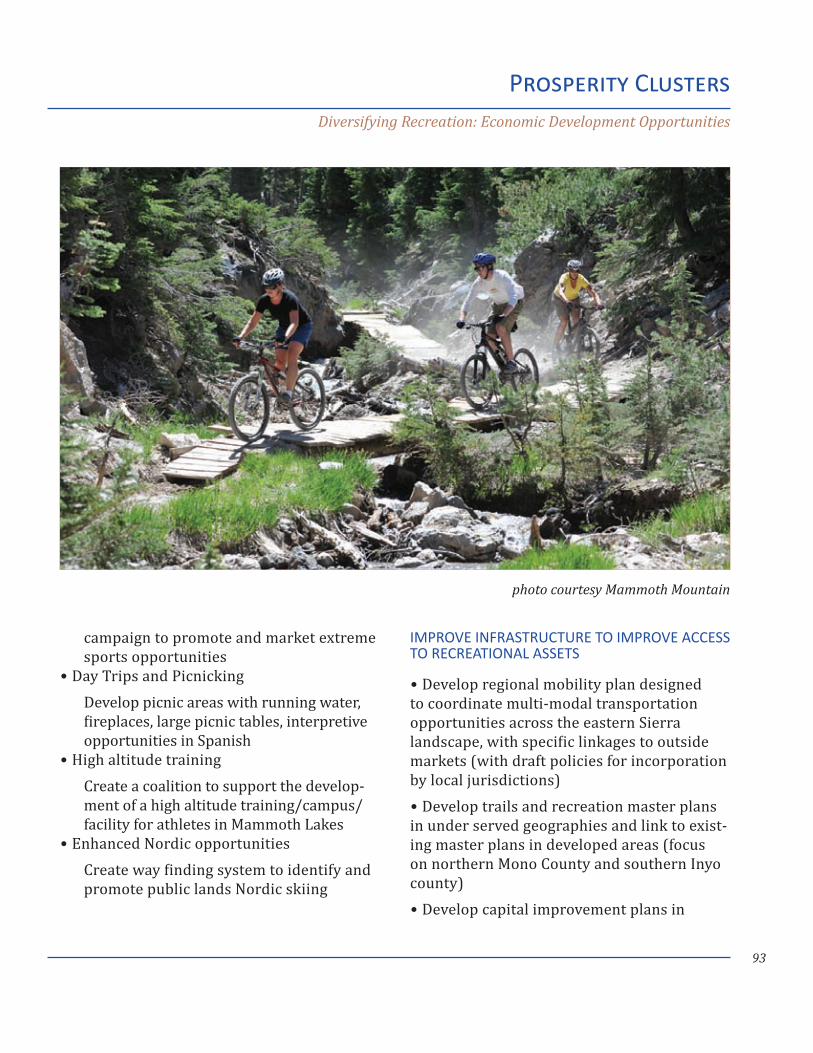
93
Prosperity ClustersDiversifying Recreation: Economic Development Opportunities
campaign to promote and market extreme sports opportunities
Day Trips and Picnicking •
Develop picnic areas with running water, fireplaces, large picnic tables, interpretive opportunities in Spanish
High altitude training •
Create a coalition to support the develop-ment of a high altitude training/campus/facility for athletes in Mammoth Lakes
Enhanced Nordic opportunities •
Create way finding system to identify and promote public lands Nordic skiing
IMPROVE INFRASTRUCTURE TO IMPROVE ACCESS TO RECREATIONAL ASSETS
Develop regional mobility plan designed •to coordinate multi-modal transportation opportunities across the eastern Sierra landscape, with specific linkages to outside markets (with draft policies for incorporation by local jurisdictions)
Develop trails and recreation master plans •in under served geographies and link to exist-ing master plans in developed areas (focus on northern Mono County and southern Inyo county)
Develop capital improvement plans in •
photo courtesy Mammoth Mountain
94
partnership with public and private entities to fill gaps in access
Link mobility plan and recreational access •goals
Identify potential parties responsible for •implementation
Link funding sources to capital •improvements
LINK RECREATIONAL ASSETS AND HISTORICAL CULTURAL ASSETS FOR A TOTAL EXPERIENCE
Coordinate operations, management and marketing between the recreation, arts, agriculture, and retail experience to provide consistent and co-branded information across clusters
Metrics and Measuring Success
The committee also recommended devel-oping a specific set of metrics to measure and evaluate progress and adaptively manage deployment of a diversified rec-reation strategy, potentially including the following:
Number of assets mapped •
Number of capital improvement projects •added to long range planning documents
Number of capital improvement projects •completed
Number of hits, unique visitors and clicks •through on web and social media platforms
Number of recreation visitors to regions •served with way finding programs
Actual number of employees placed •
Average median income of employees •placedFunding the deployment of a regional rec-reation tourism strategy will be a difficult challenge considering the continuous reduc-tions in funding for federal land management agencies.
However, because there is already consider-able private sector investment in recreation on the east side, and opportunity to leverage additional private sector investment is high, the challenge may be as much one of coordi-nation as it is funding.
This is another area where existing grant programs at the United States Department’s of Commerce, Interior, Agriculture,
Prosperity ClustersDiversifying Recreation: Metrics and Measuring Success
Number of assets mapped•
Number of capital improvement projects • added to long range planning documents
Number of capital improvement projects • completed
Number of hits, unique visitors and clicks • through on web and social media platforms
Number of recreation visitors to regions • served with way finding programs
Actual number of employees placed•
Average median income of employees • placed
Committee Recommendations: Diversifying Recreation Metrics and Measuring Success
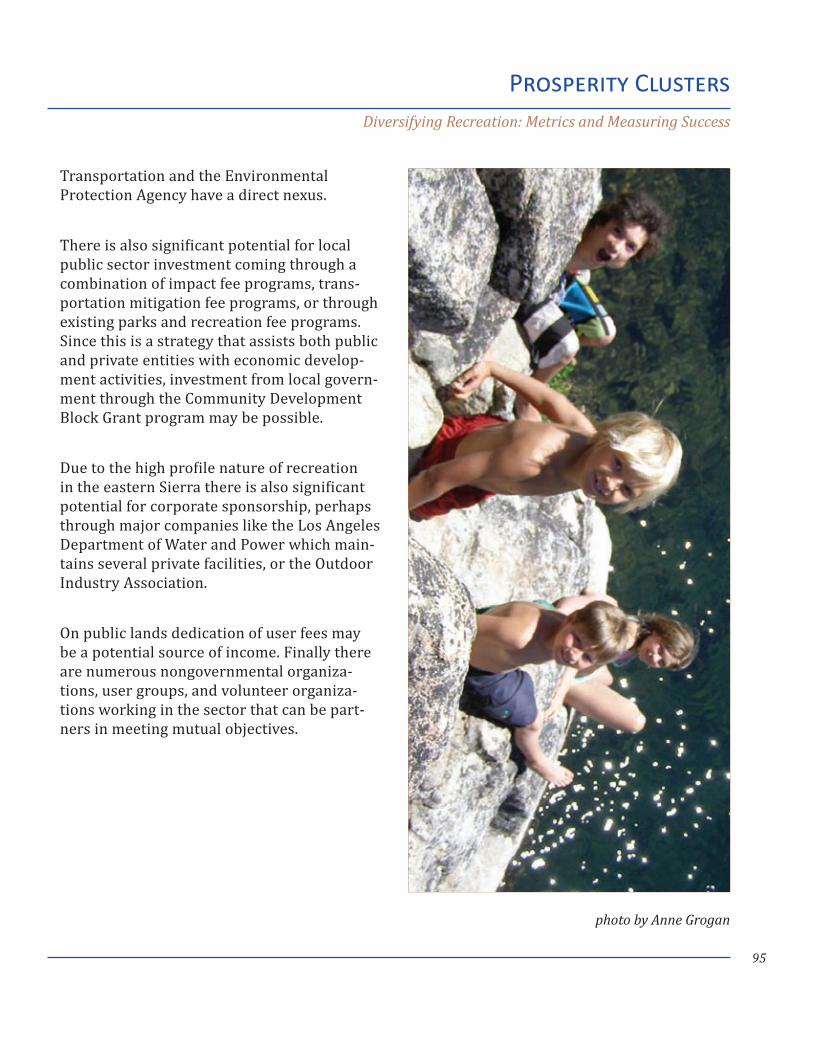
95
Transportation and the Environmental Protection Agency have a direct nexus.
There is also significant potential for local public sector investment coming through a combination of impact fee programs, trans-portation mitigation fee programs, or through existing parks and recreation fee programs. Since this is a strategy that assists both public and private entities with economic develop-ment activities, investment from local govern-ment through the Community Development Block Grant program may be possible.
Due to the high profile nature of recreation in the eastern Sierra there is also significant potential for corporate sponsorship, perhaps through major companies like the Los Angeles Department of Water and Power which main-tains several private facilities, or the Outdoor Industry Association.
On public lands dedication of user fees may be a potential source of income. Finally there are numerous nongovernmental organiza-tions, user groups, and volunteer organiza-tions working in the sector that can be part-ners in meeting mutual objectives.
Prosperity ClustersDiversifying Recreation: Metrics and Measuring Success
photo by Anne Grogan
96
Prosperity ClustersDiversifying Recreation: Committee Recommendations
Increase focus on recreational access for diverse ability and age levels and underserved geographic areas
Conduct an existing conditions gaps analysis • to identify categories of recreation available by geographic location modeled on the Mono County Recreation Access Toolkit
Utilize existing inventories of recreational • access points to identify and classify assets based on categories and ability levels
Identify gaps in geographic areas, categories • and access for specific ability levels
Assess and prioritize existing categories and • access points relative to new, emerging, or growing areas of recreational activity
Produce a community based prioritized list • of category and access improvement projects by ability level (trail systems, parking, access points)
Link mobility plan and recreational access • goals
Link access improvement goals to boosting • off-season and mid-week access where signifi-cant underutilized capacity exists
Identify potential parties responsible for • implementation
Develop capital improvements plans in part-• nership with public and private entities to fill
gaps in access
Link funding sources to capital • improvements
Improve “way finding” and expand access to information about using
Increase coordination with USFS and BLM to • partner on way finding processes
Develop a regional way finding master plan • in partnership with federal land management agencies (utilizing processes already in place in Mammoth Lakes)
Develop regional way-finding brand•
Develop way finding print maps•
Develop on-line way-finding tools, including • applications, on-line databases, downloadable directions, and printable maps, with a special emphasis on “how to get to what I see”
Network on-line way finding tools to local, • regional, state and national on-line tools such as National Park Service maps ad apps, Geotourism apps and maps, etc.
Focus portion of way finding effort on • dramatically improving outreach and access for the Latino community
Committee Recommendations: Diversifying Recreation Economic Development Opportunities
97
Prosperity ClustersDiversifying Recreation: Committee Recommendations
Develop opportunities for non-traditional activities
Use gaps analysis to identify top priority • recreational activities
Increase coordination with USFS and BLM • to develop and market joint recreation opportunities
Capitalize on Extreme Sports Attractions
Create specific way finding materials for • extreme sports activities
Provide better information or online “one • stop shop” for permitting extreme activities
Develop regional film and social media • campaign to promote and market extreme sports opportunities
Encourage Day Trips and Picnicking
Provide developed picnic areas with running • water, fireplaces, large picnic tables, interpre-tive opportunities in Spanish
Spotlight High Altitude Training
Create a coalition to support the develop-• ment of a high altitude training/campus/facility for athletes in Mammoth Lakes
Enhance Nordic Opportunities
Create way finding system to identify • and promote public lands Nordic skiing
Improve infrastructure to improve access to • recreational assets
Develop regional mobility plan designed to • coordinate multi-modal transportation oppor-tunities across the eastern Sierra landscape, with specific linkages to outside markets (with draft policies for incorporation by local jurisdictions)
Develop trails and recreation master plans in • under served geographies and link to existing master plans in developed areas (focus on northern Mono County and southern Inyo county)
Link mobility plan and recreational access • goals
Identify potential parties responsible for • implementation
Develop capital improvements plans in part-• nership with public and private entities to fill gaps in access
Link funding sources to capital • improvements
Link recreational assets and historical cultural assets for a total experience
Coordinate operations, management and • marketing between the recreation, arts, agriculture, and retail experience to provide consistent and co-branded information across clusters
Committee Recommendations: Diversifying Recreation Economic Development Opportunities
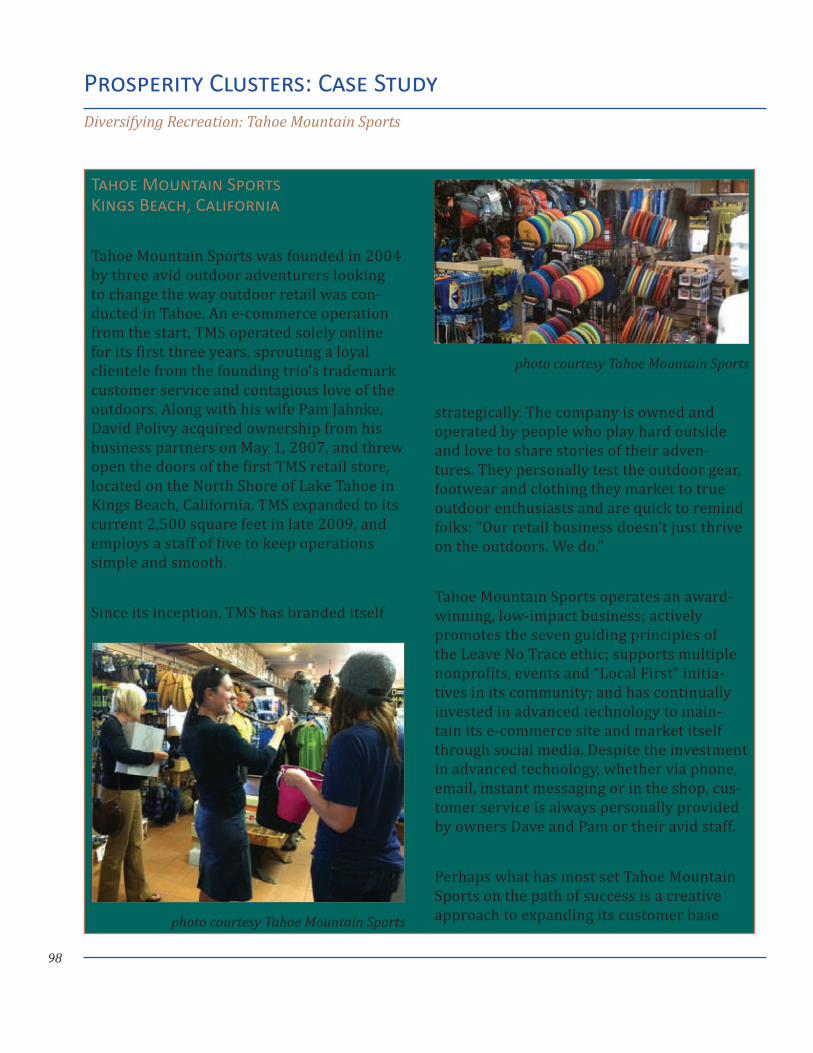
98
Prosperity Clusters: Case StudyDiversifying Recreation: Tahoe Mountain Sports
Tahoe Mountain Sports Kings Beach, California
Tahoe Mountain Sports was founded in 2004 by three avid outdoor adventurers looking to change the way outdoor retail was con-ducted in Tahoe. An e-commerce operation from the start, TMS operated solely online for its first three years, sprouting a loyal clientele from the founding trio’s trademark customer service and contagious love of the outdoors. Along with his wife Pam Jahnke, David Polivy acquired ownership from his business partners on May 1, 2007, and threw open the doors of the first TMS retail store, located on the North Shore of Lake Tahoe in Kings Beach, California. TMS expanded to its current 2,500 square feet in late 2009, and employs a staff of five to keep operations simple and smooth.
Since its inception, TMS has branded itself
strategically. The company is owned and operated by people who play hard outside and love to share stories of their adven-tures. They personally test the outdoor gear, footwear and clothing they market to true outdoor enthusiasts and are quick to remind folks: “Our retail business doesn’t just thrive on the outdoors. We do.”
Tahoe Mountain Sports operates an award-winning, low-impact business; actively promotes the seven guiding principles of the Leave No Trace ethic; supports multiple nonprofits, events and “Local First” initia-tives in its community; and has continually invested in advanced technology to main-tain its e-commerce site and market itself through social media. Despite the investment in advanced technology, whether via phone, email, instant messaging or in the shop, cus-tomer service is always personally provided by owners Dave and Pam or their avid staff.
Perhaps what has most set Tahoe Mountain Sports on the path of success is a creative approach to expanding its customer base
photo courtesy Tahoe Mountain Sports
photo courtesy Tahoe Mountain Sports
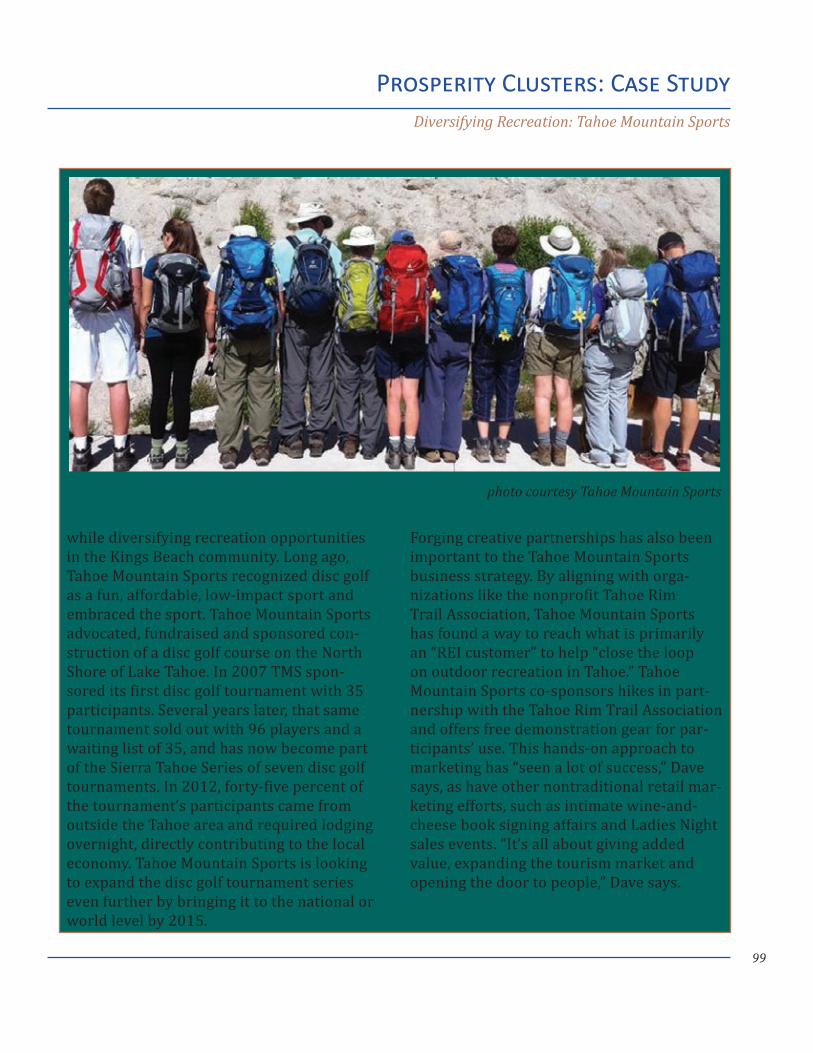
99
while diversifying recreation opportunities in the Kings Beach community. Long ago, Tahoe Mountain Sports recognized disc golf as a fun, affordable, low-impact sport and embraced the sport. Tahoe Mountain Sports advocated, fundraised and sponsored con-struction of a disc golf course on the North Shore of Lake Tahoe. In 2007 TMS spon-sored its first disc golf tournament with 35 participants. Several years later, that same tournament sold out with 96 players and a waiting list of 35, and has now become part of the Sierra Tahoe Series of seven disc golf tournaments. In 2012, forty-five percent of the tournament’s participants came from outside the Tahoe area and required lodging overnight, directly contributing to the local economy. Tahoe Mountain Sports is looking to expand the disc golf tournament series even further by bringing it to the national or world level by 2015.
Forging creative partnerships has also been important to the Tahoe Mountain Sports business strategy. By aligning with orga-nizations like the nonprofit Tahoe Rim Trail Association, Tahoe Mountain Sports has found a way to reach what is primarily an “REI customer” to help “close the loop on outdoor recreation in Tahoe.” Tahoe Mountain Sports co-sponsors hikes in part-nership with the Tahoe Rim Trail Association and offers free demonstration gear for par-ticipants’ use. This hands-on approach to marketing has “seen a lot of success,” Dave says, as have other nontraditional retail mar-keting efforts, such as intimate wine-and-cheese book signing affairs and Ladies Night sales events. “It’s all about giving added value, expanding the tourism market and opening the door to people,” Dave says.
Prosperity Clusters: Case StudyDiversifying Recreation: Tahoe Mountain Sports
photo courtesy Tahoe Mountain Sports
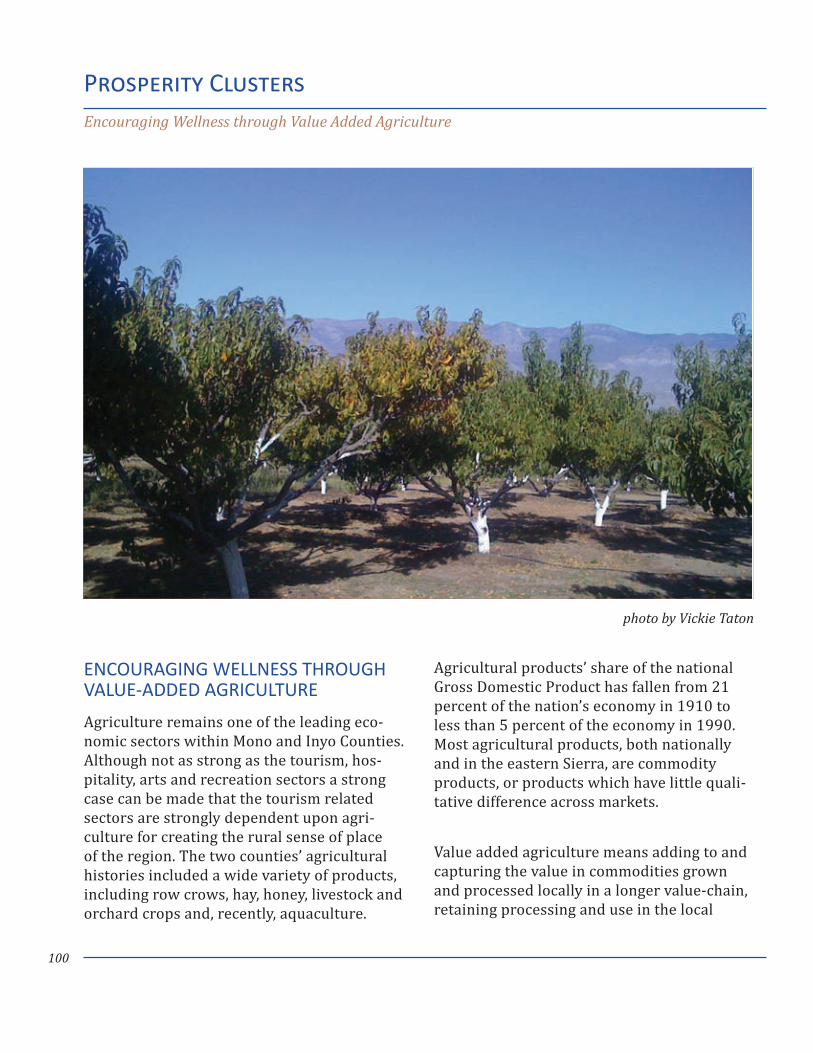
100
ENCOURAGING WELLNESS THROUGH VALUE-ADDED AGRICULTURE
Agriculture remains one of the leading eco-nomic sectors within Mono and Inyo Counties. Although not as strong as the tourism, hos-pitality, arts and recreation sectors a strong case can be made that the tourism related sectors are strongly dependent upon agri-culture for creating the rural sense of place of the region. The two counties’ agricultural histories included a wide variety of products, including row crows, hay, honey, livestock and orchard crops and, recently, aquaculture.
Agricultural products’ share of the national Gross Domestic Product has fallen from 21 percent of the nation’s economy in 1910 to less than 5 percent of the economy in 1990. Most agricultural products, both nationally and in the eastern Sierra, are commodity products, or products which have little quali-tative difference across markets.
Value added agriculture means adding to and capturing the value in commodities grown and processed locally in a longer value-chain, retaining processing and use in the local
photo by Vickie Taton
Prosperity ClustersEncouraging Wellness through Value Added Agriculture
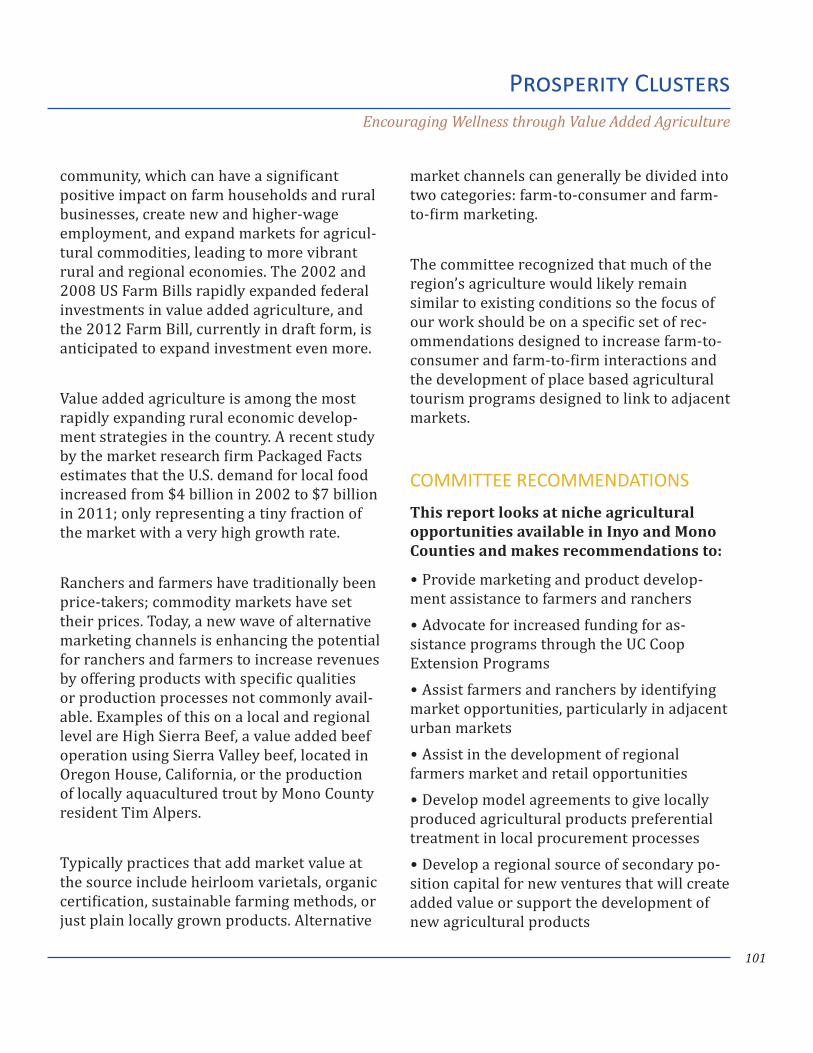
101
Prosperity ClustersEncouraging Wellness through Value Added Agriculture
community, which can have a significant positive impact on farm households and rural businesses, create new and higher-wage employment, and expand markets for agricul-tural commodities, leading to more vibrant rural and regional economies. The 2002 and 2008 US Farm Bills rapidly expanded federal investments in value added agriculture, and the 2012 Farm Bill, currently in draft form, is anticipated to expand investment even more.
Value added agriculture is among the most rapidly expanding rural economic develop-ment strategies in the country. A recent study by the market research firm Packaged Facts estimates that the U.S. demand for local food increased from $4 billion in 2002 to $7 billion in 2011; only representing a tiny fraction of the market with a very high growth rate.
Ranchers and farmers have traditionally been price-takers; commodity markets have set their prices. Today, a new wave of alternative marketing channels is enhancing the potential for ranchers and farmers to increase revenues by offering products with specific qualities or production processes not commonly avail-able. Examples of this on a local and regional level are High Sierra Beef, a value added beef operation using Sierra Valley beef, located in Oregon House, California, or the production of locally aquacultured trout by Mono County resident Tim Alpers.
Typically practices that add market value at the source include heirloom varietals, organic certification, sustainable farming methods, or just plain locally grown products. Alternative
market channels can generally be divided into two categories: farm-to-consumer and farm-to-firm marketing.
The committee recognized that much of the region’s agriculture would likely remain similar to existing conditions so the focus of our work should be on a specific set of rec-ommendations designed to increase farm-to-consumer and farm-to-firm interactions and the development of place based agricultural tourism programs designed to link to adjacent markets.
COMMITTEE RECOMMENDATIONS
This report looks at niche agricultural opportunities available in Inyo and Mono Counties and makes recommendations to:
Provide marketing and product develop- •ment assistance to farmers and ranchers
Advocate for increased funding for as- •sistance programs through the UC Coop Extension Programs
Assist farmers and ranchers by identifying •market opportunities, particularly in adjacent urban markets
Assist in the development of regional •farmers market and retail opportunities
Develop model agreements to give locally •produced agricultural products preferential treatment in local procurement processes
Develop a regional source of secondary po- •sition capital for new ventures that will create added value or support the development of new agricultural products
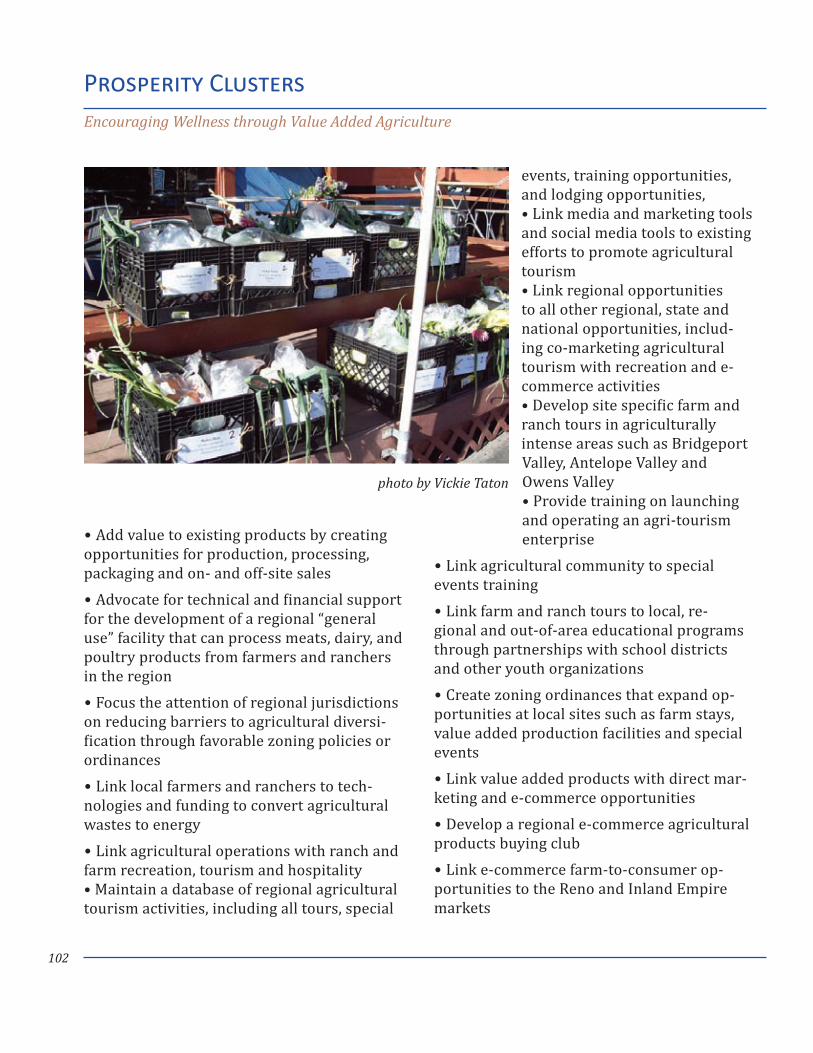
102
Add value to existing products by creating •opportunities for production, processing, packaging and on- and off-site sales
Advocate for technical and financial support •for the development of a regional “general use” facility that can process meats, dairy, and poultry products from farmers and ranchers in the region
Focus the attention of regional jurisdictions •on reducing barriers to agricultural diversi-fication through favorable zoning policies or ordinances
Link local farmers and ranchers to tech- •nologies and funding to convert agricultural wastes to energy
Link agricultural operations with ranch and •farm recreation, tourism and hospitality • Maintain a database of regional agricultural tourism activities, including all tours, special
events, training opportunities, and lodging opportunities, • Link media and marketing tools and social media tools to existing efforts to promote agricultural tourism • Link regional opportunities to all other regional, state and national opportunities, includ-ing co-marketing agricultural tourism with recreation and e-commerce activities • Develop site specific farm and ranch tours in agriculturally intense areas such as Bridgeport Valley, Antelope Valley and Owens Valley • Provide training on launching and operating an agri-tourism enterprise
Link agricultural community to special •events training
Link farm and ranch tours to local, re- •gional and out-of-area educational programs through partnerships with school districts and other youth organizations
Create zoning ordinances that expand op- •portunities at local sites such as farm stays, value added production facilities and special events
Link value added products with direct mar- •keting and e-commerce opportunities
Develop a regional e-commerce agricultural •products buying club
Link e-commerce farm-to-consumer op- •portunities to the Reno and Inland Empire markets
Prosperity ClustersEncouraging Wellness through Value Added Agriculture
photo by Vickie Taton
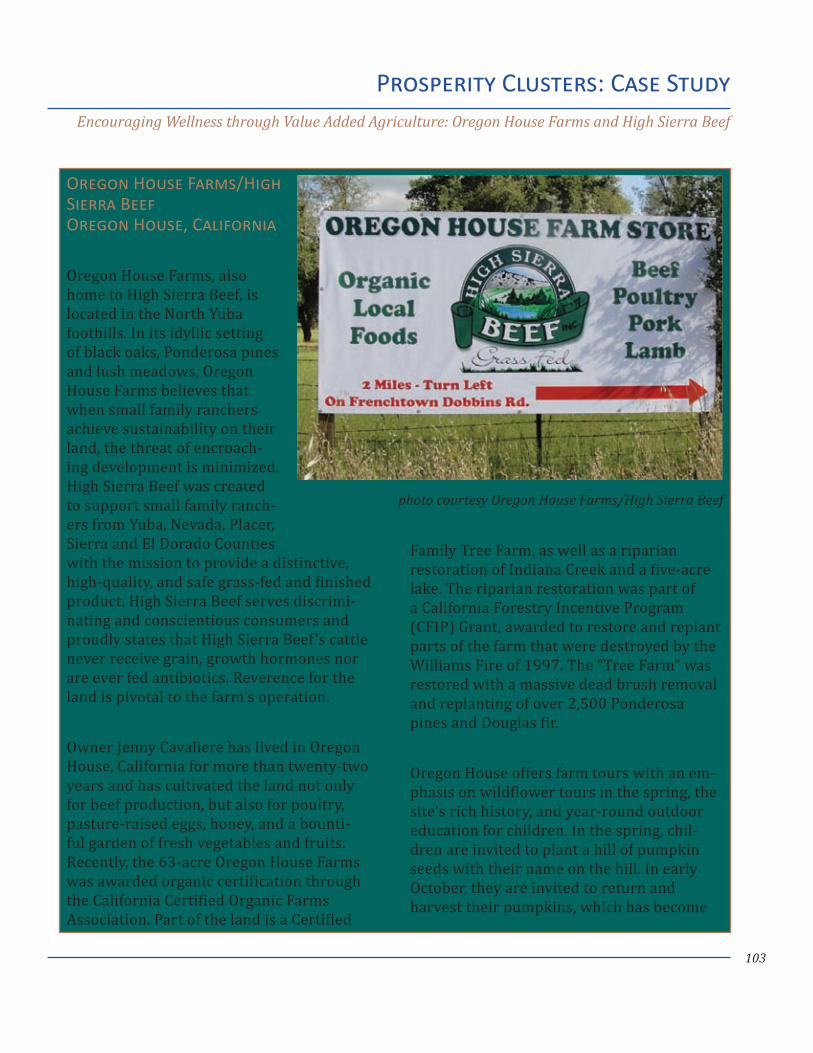
103
Oregon House Farms/High Sierra Beef Oregon House, California
Oregon House Farms, also home to High Sierra Beef, is located in the North Yuba foothills. In its idyllic setting of black oaks, Ponderosa pines and lush meadows, Oregon House Farms believes that when small family ranchers achieve sustainability on their land, the threat of encroach-ing development is minimized. High Sierra Beef was created to support small family ranch-ers from Yuba, Nevada, Placer, Sierra and El Dorado Counties with the mission to provide a distinctive, high-quality, and safe grass-fed and finished product. High Sierra Beef serves discrimi-nating and conscientious consumers and proudly states that High Sierra Beef ’s cattle never receive grain, growth hormones nor are ever fed antibiotics. Reverence for the land is pivotal to the farm’s operation.
Owner Jenny Cavaliere has lived in Oregon House, California for more than twenty-two years and has cultivated the land not only for beef production, but also for poultry, pasture-raised eggs, honey, and a bounti-ful garden of fresh vegetables and fruits. Recently, the 63-acre Oregon House Farms was awarded organic certification through the California Certified Organic Farms Association. Part of the land is a Certified
Family Tree Farm, as well as a riparian restoration of Indiana Creek and a five-acre lake. The riparian restoration was part of a California Forestry Incentive Program (CFIP) Grant, awarded to restore and replant parts of the farm that were destroyed by the Williams Fire of 1997. The “Tree Farm” was restored with a massive dead brush removal and replanting of over 2,500 Ponderosa pines and Douglas fir.
Oregon House offers farm tours with an em-phasis on wildflower tours in the spring, the site’s rich history, and year-round outdoor education for children. In the spring, chil-dren are invited to plant a hill of pumpkin seeds with their name on the hill. In early October, they are invited to return and harvest their pumpkins, which has become
Prosperity Clusters: Case StudyEncouraging Wellness through Value Added Agriculture: Oregon House Farms and High Sierra Beef
photo courtesy Oregon House Farms/High Sierra Beef
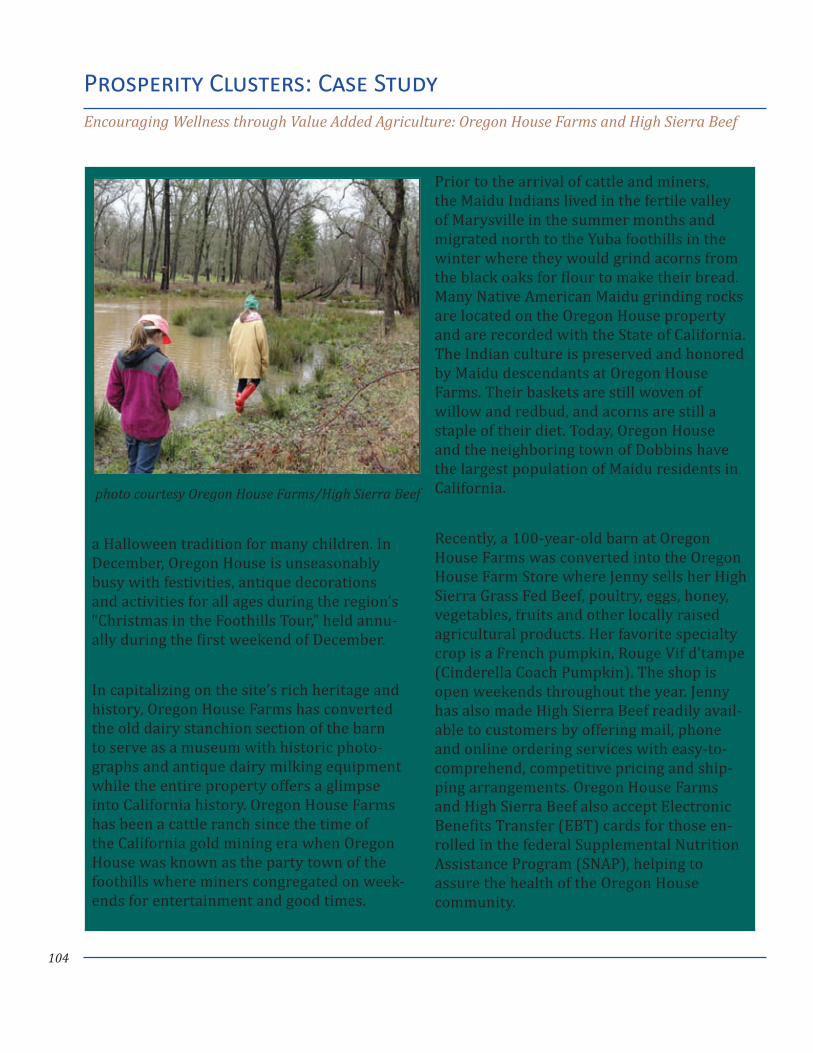
104
a Halloween tradition for many children. In December, Oregon House is unseasonably busy with festivities, antique decorations and activities for all ages during the region’s “Christmas in the Foothills Tour,” held annu-ally during the first weekend of December.
In capitalizing on the site’s rich heritage and history, Oregon House Farms has converted the old dairy stanchion section of the barn to serve as a museum with historic photo-graphs and antique dairy milking equipment while the entire property offers a glimpse into California history. Oregon House Farms has been a cattle ranch since the time of the California gold mining era when Oregon House was known as the party town of the foothills where miners congregated on week-ends for entertainment and good times.
Prior to the arrival of cattle and miners, the Maidu Indians lived in the fertile valley of Marysville in the summer months and migrated north to the Yuba foothills in the winter where they would grind acorns from the black oaks for flour to make their bread. Many Native American Maidu grinding rocks are located on the Oregon House property and are recorded with the State of California. The Indian culture is preserved and honored by Maidu descendants at Oregon House Farms. Their baskets are still woven of willow and redbud, and acorns are still a staple of their diet. Today, Oregon House and the neighboring town of Dobbins have the largest population of Maidu residents in California.
Recently, a 100-year-old barn at Oregon House Farms was converted into the Oregon House Farm Store where Jenny sells her High Sierra Grass Fed Beef, poultry, eggs, honey, vegetables, fruits and other locally raised agricultural products. Her favorite specialty crop is a French pumpkin, Rouge Vif d’tampe (Cinderella Coach Pumpkin). The shop is open weekends throughout the year. Jenny has also made High Sierra Beef readily avail-able to customers by offering mail, phone and online ordering services with easy-to-comprehend, competitive pricing and ship-ping arrangements. Oregon House Farms and High Sierra Beef also accept Electronic Benefits Transfer (EBT) cards for those en-rolled in the federal Supplemental Nutrition Assistance Program (SNAP), helping to assure the health of the Oregon House community.
Prosperity Clusters: Case StudyEncouraging Wellness through Value Added Agriculture: Oregon House Farms and High Sierra Beef
photo courtesy Oregon House Farms/High Sierra Beef
Committee Commentary:
Prosperity Clusters and Mining
106
Prosperity Clusters and MiningCommittee Commentary
The committee considered seriously the matter of addressing mining as a specific potential economic cluster for the purposes of our report. After significant discussion we opted not to identify mining as a po-tential cluster due to a number of special considerations.
First, since many of the larger scale mining operations envisioned in the eastern Sierra are primarily focused on public lands, and the public lands permitting processes have their own special set of circumstances and timelines, the committee recognized that its influence on these issues was relatively limited, within the timeline envisioned for implementation of the recommendations in this report.
Second, although mining is a significant in-dustry, it is an industry whose price sensitiv-ity is driven by global demand and markets, consequently a focus in this area was likely to produce a strategy that would be more subject to the vicissitudes of the market than the region’s direct actions. Finally, the com-mittee did see some significant potential for localized mining activities, specifically in the area of aggregate mining to meet local needs for road building and construction as the economy recovers, but since it was a relatively stable market it did not rise to the level that warrants a specific cluster analysis.
The committee did however discuss several of the issues relative to expanding mining in the region and believed that these were worth mentioning in this report. As a result of mining’s potential impacts on local and re-gional economies, the committee agreed that local communities should carefully compare potential benefits and costs to determine whether mining projects are desirable.
A broader assessment of the costs, benefits and impacts is needed to help local officials and residents understand the implications of mining in their communities. These issues should be critically examined as the deci-sions made could alter a region’s future economic prosperity and sustainability, particularly around many of the activities envisioned in this report, such as a focus on agriculture, recreation, tourism, and hospi-tality as growing industry clusters.
The regional economy in the eastern Sierra depends to a large part on a quality of life that is primarily due to environmental ame-nities flowing from protected public lands. This quality of life attracts visitors and new residents alike, thereby developing local economic vitality.
In the last 50 years, the economic value of the non-extractive uses of the public lands has come to dwarf that of extractive
Committee Commentary:
Prosperity Clusters and Mining
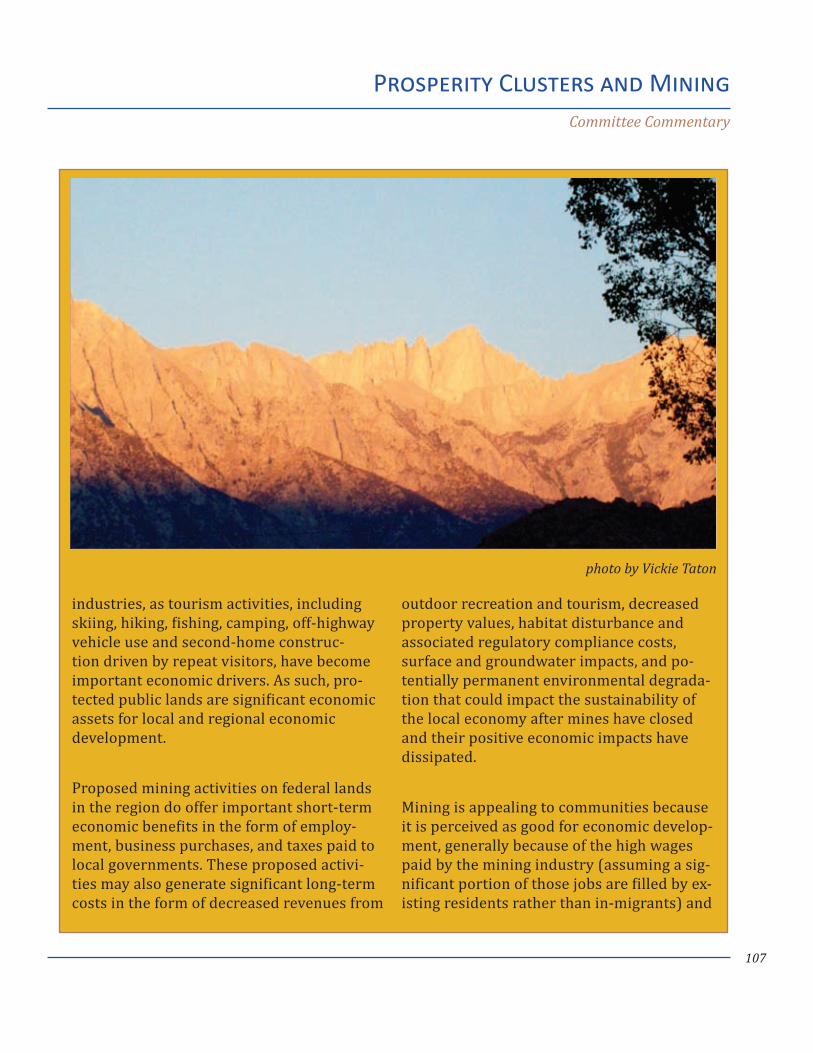
107
Prosperity Clusters and MiningCommittee Commentary
industries, as tourism activities, including skiing, hiking, fishing, camping, off-highway vehicle use and second-home construc-tion driven by repeat visitors, have become important economic drivers. As such, pro-tected public lands are significant economic assets for local and regional economic development.
Proposed mining activities on federal lands in the region do offer important short-term economic benefits in the form of employ-ment, business purchases, and taxes paid to local governments. These proposed activi-ties may also generate significant long-term costs in the form of decreased revenues from
outdoor recreation and tourism, decreased property values, habitat disturbance and associated regulatory compliance costs, surface and groundwater impacts, and po-tentially permanent environmental degrada-tion that could impact the sustainability of the local economy after mines have closed and their positive economic impacts have dissipated.
Mining is appealing to communities because it is perceived as good for economic develop-ment, generally because of the high wages paid by the mining industry (assuming a sig-nificant portion of those jobs are filled by ex-isting residents rather than in-migrants) and
photo by Vickie Taton
108
Prosperity Clusters and MiningCommittee Commentary
other contributions to the local economy; however, several factors associated with mining cause it to be detrimental to the eco-nomic development of communities in the longer term.
Mining profits are a function of production costs and metals prices. Metals are traded in the international market and are subject to global economic forces. As a result, metals prices are volatile; decreasing when there is overcapacity or large stockpiles and in-creasing when production or stocks are low relative to demand. Mines tend to shut down when prices are low and re-open when prices increase again. These boom-and-bust cycles cause mining income, employment and payrolls to be unstable. In addition, mining operations tend to have relatively short lives, generally less than 20 years. People with specialized skills tend to leave when mines close to seek mining employ-ment elsewhere.
Local communities should also be cognizant of potential fiscal impacts deriving from mining projects in the area. Area communi-ties and governments need to be prepared to deal with associated fiscal impacts. These could include:
Increased demand for social services;•
Increased costs to local school districts; • higher public safety costs; and,
Higher road maintenance and other infra-• structure requirements
Income volatility arising from mines opening and closing creates uncertainty for commu-nity economies, leading to increased invest-ment risk. This, in turn, can lead to lack of investment in the local economy by outside investors. Local business owners and entre-preneurs may not want to put money into business ventures if there is a risk of layoffs or mine closure. Community government expenditure decisions may also be affected if the local tax base is mining dependent.
All of these factors impact negatively on local and regional economies and thereby impede the development of stable, sustain-able economies. Elko, Nevada provides an example of how uncertainty associated with boom/bust economies prevents public and private investment in the community. As re-ported in a recent article in the Los Angeles Times, because of memories of the bust in the late 1990s due to low gold prices, even with very high gold prices and in the middle of a mining boom, the town is reluctant to build a new recreation center.
The police department is overwhelmed because they are afraid to hire new officers due to uncertainty. Some employees are living in recreational vehicles and intend to leave town when the bust comes instead of putting down roots in the community.
After considering all of these issues, the committee decided that it would not focus on mining as a specific industry cluster.
Summary Economic Profile of Inyo and Mono Counties
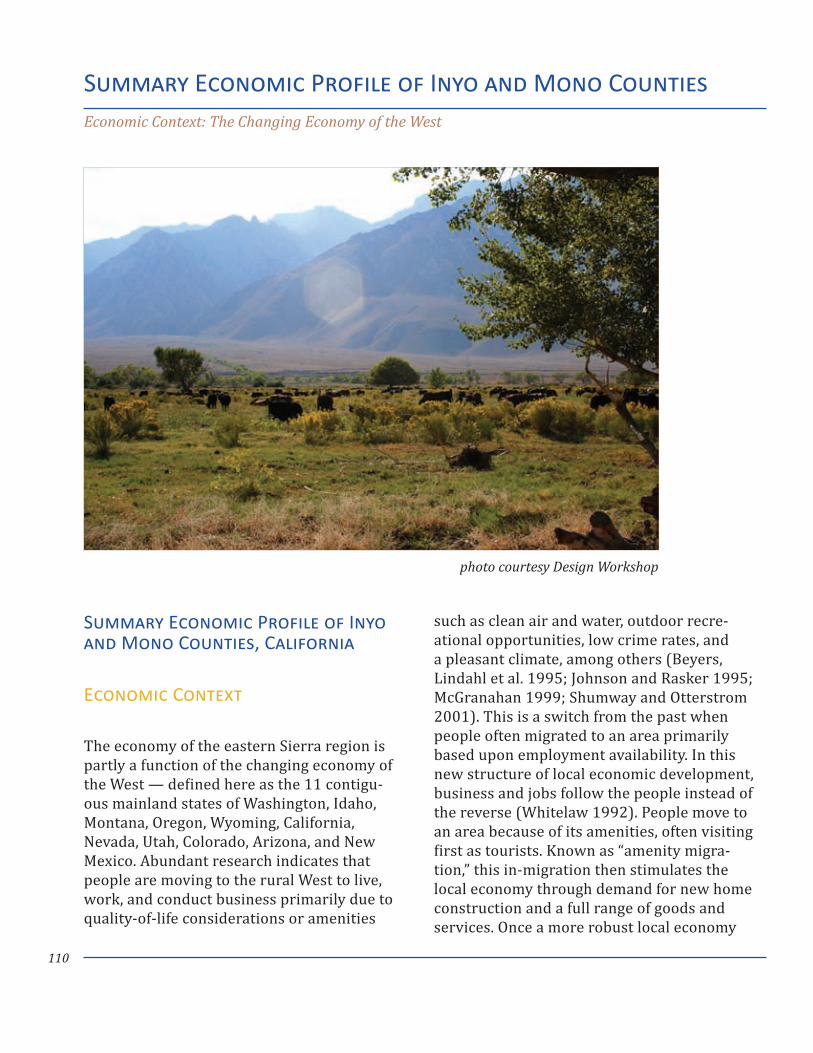
110
Summary Economic Profile of Inyo and Mono Counties, California
Economic Context
The economy of the eastern Sierra region is partly a function of the changing economy of the West — defined here as the 11 contigu-ous mainland states of Washington, Idaho, Montana, Oregon, Wyoming, California, Nevada, Utah, Colorado, Arizona, and New Mexico. Abundant research indicates that people are moving to the rural West to live, work, and conduct business primarily due to quality-of-life considerations or amenities
such as clean air and water, outdoor recre-ational opportunities, low crime rates, and a pleasant climate, among others (Beyers, Lindahl et al. 1995; Johnson and Rasker 1995; McGranahan 1999; Shumway and Otterstrom 2001). This is a switch from the past when people often migrated to an area primarily based upon employment availability. In this new structure of local economic development, business and jobs follow the people instead of the reverse (Whitelaw 1992). People move to an area because of its amenities, often visiting first as tourists. Known as “amenity migra-tion,” this in-migration then stimulates the local economy through demand for new home construction and a full range of goods and services. Once a more robust local economy
Summary Economic Profile of Inyo and Mono CountiesEconomic Context: The Changing Economy of the West
photo courtesy Design Workshop
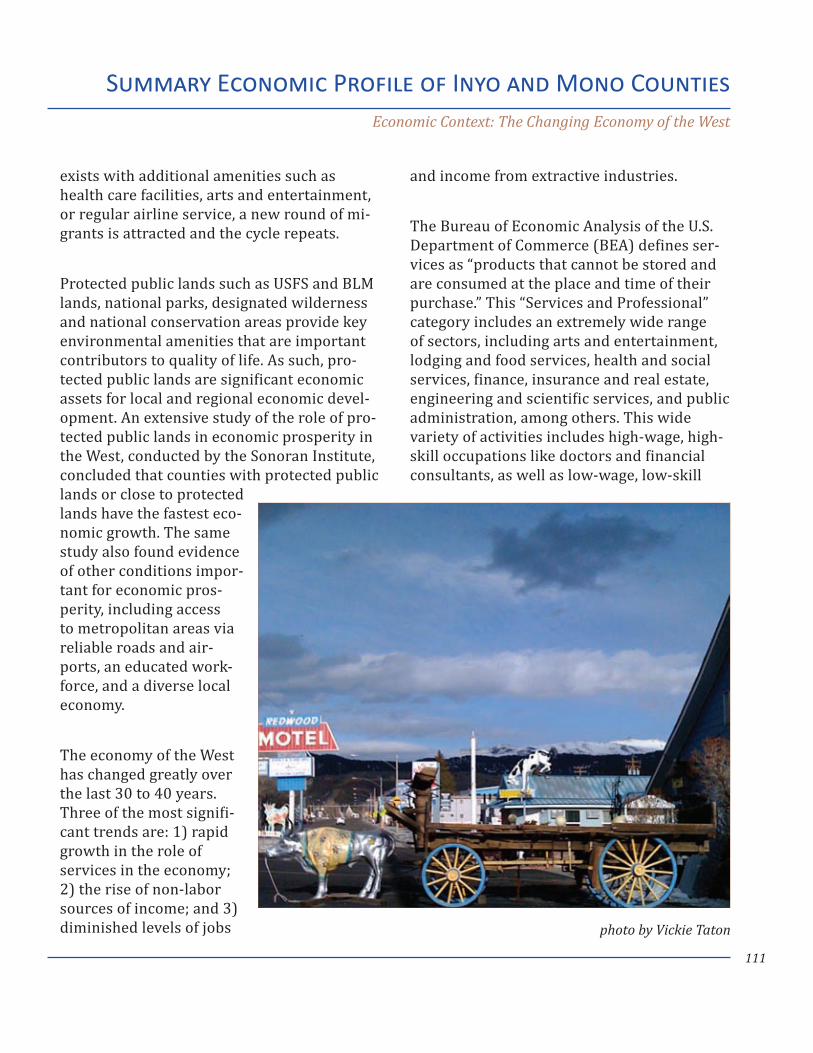
111
exists with additional amenities such as health care facilities, arts and entertainment, or regular airline service, a new round of mi-grants is attracted and the cycle repeats.
Protected public lands such as USFS and BLM lands, national parks, designated wilderness and national conservation areas provide key environmental amenities that are important contributors to quality of life. As such, pro-tected public lands are significant economic assets for local and regional economic devel-opment. An extensive study of the role of pro-tected public lands in economic prosperity in the West, conducted by the Sonoran Institute, concluded that counties with protected public lands or close to protected lands have the fastest eco-nomic growth. The same study also found evidence of other conditions impor-tant for economic pros-perity, including access to metropolitan areas via reliable roads and air-ports, an educated work-force, and a diverse local economy.
The economy of the West has changed greatly over the last 30 to 40 years. Three of the most signifi-cant trends are: 1) rapid growth in the role of services in the economy; 2) the rise of non-labor sources of income; and 3) diminished levels of jobs
and income from extractive industries.
The Bureau of Economic Analysis of the U.S. Department of Commerce (BEA) defines ser-vices as “products that cannot be stored and are consumed at the place and time of their purchase.” This “Services and Professional” category includes an extremely wide range of sectors, including arts and entertainment, lodging and food services, health and social services, finance, insurance and real estate, engineering and scientific services, and public administration, among others. This wide variety of activities includes high-wage, high-skill occupations like doctors and financial consultants, as well as low-wage, low-skill
Summary Economic Profile of Inyo and Mono CountiesEconomic Context: The Changing Economy of the West
photo by Vickie Taton
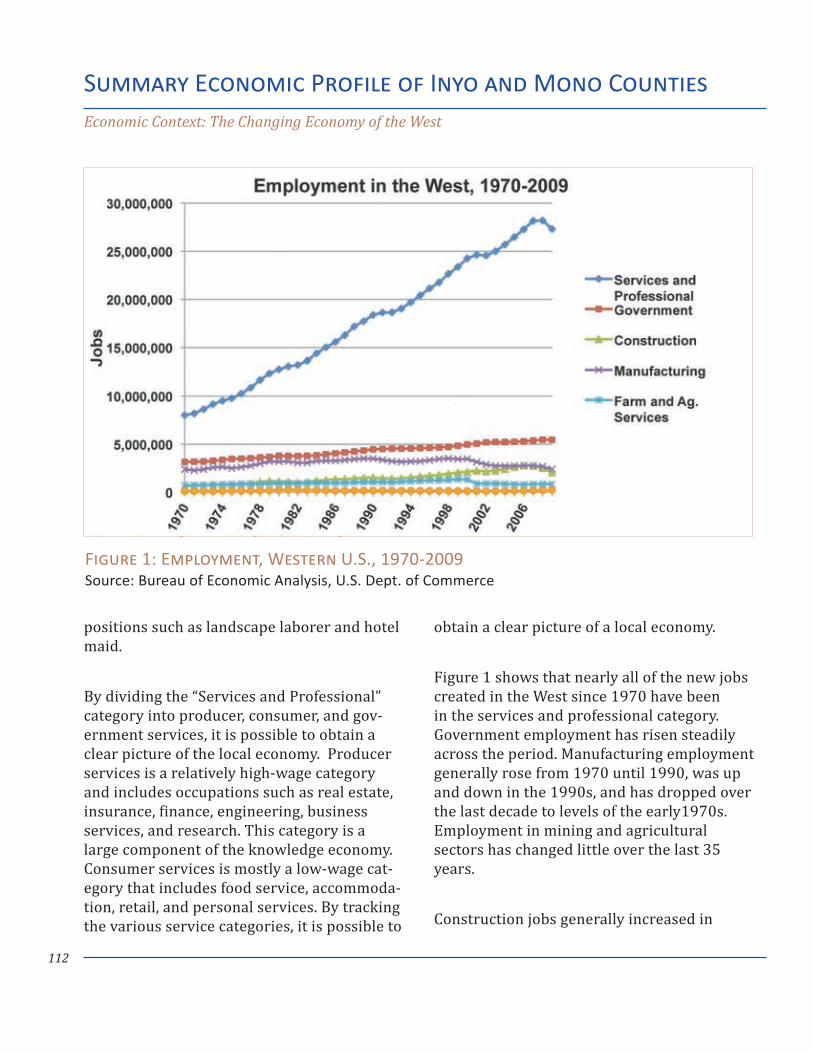
112
positions such as landscape laborer and hotel maid.
By dividing the “Services and Professional” category into producer, consumer, and gov-ernment services, it is possible to obtain a clear picture of the local economy. Producer services is a relatively high-wage category and includes occupations such as real estate, insurance, finance, engineering, business services, and research. This category is a large component of the knowledge economy. Consumer services is mostly a low-wage cat-egory that includes food service, accommoda-tion, retail, and personal services. By tracking the various service categories, it is possible to
obtain a clear picture of a local economy.
Figure 1 shows that nearly all of the new jobs created in the West since 1970 have been in the services and professional category. Government employment has risen steadily across the period. Manufacturing employment generally rose from 1970 until 1990, was up and down in the 1990s, and has dropped over the last decade to levels of the early1970s. Employment in mining and agricultural sectors has changed little over the last 35 years.
Construction jobs generally increased in
Summary Economic Profile of Inyo and Mono CountiesEconomic Context: The Changing Economy of the West
Figure 1: Employment, Western U.S., 1970-2009 Source: Bureau of Economic Analysis, U.S. Dept. of Commerce
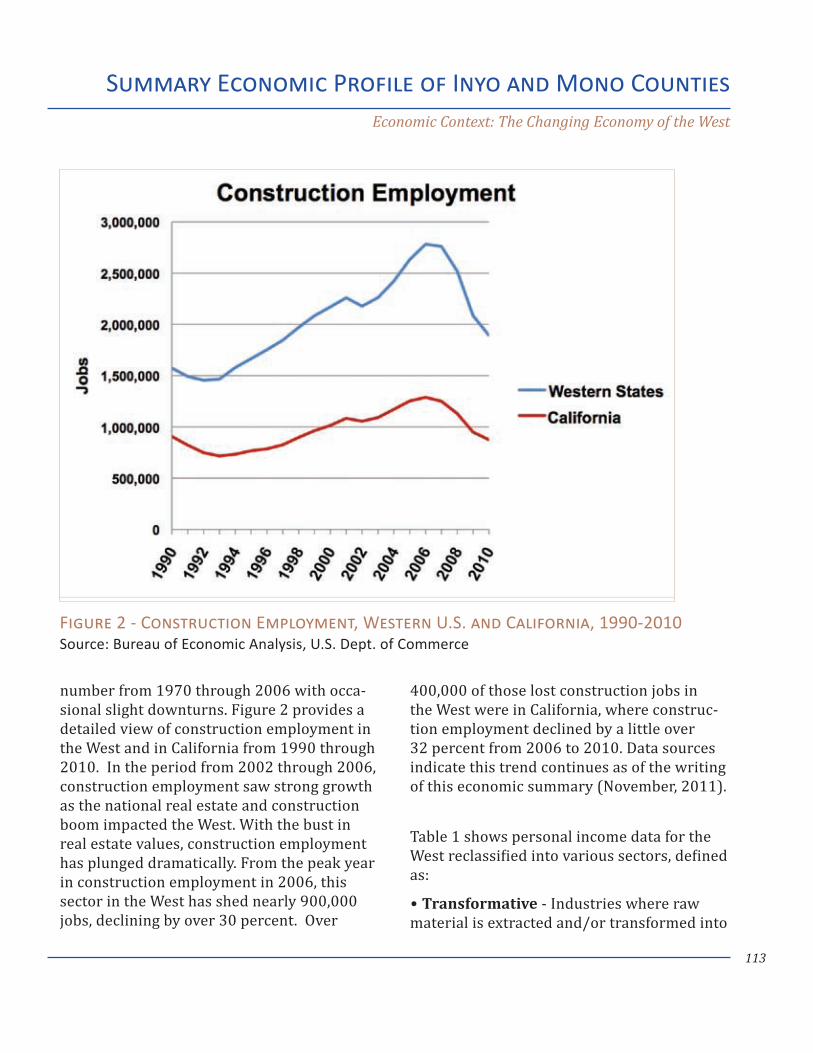
113
Summary Economic Profile of Inyo and Mono CountiesEconomic Context: The Changing Economy of the West
number from 1970 through 2006 with occa-sional slight downturns. Figure 2 provides a detailed view of construction employment in the West and in California from 1990 through 2010. In the period from 2002 through 2006, construction employment saw strong growth as the national real estate and construction boom impacted the West. With the bust in real estate values, construction employment has plunged dramatically. From the peak year in construction employment in 2006, this sector in the West has shed nearly 900,000 jobs, declining by over 30 percent. Over
400,000 of those lost construction jobs in the West were in California, where construc-tion employment declined by a little over 32 percent from 2006 to 2010. Data sources indicate this trend continues as of the writing of this economic summary (November, 2011).
Table 1 shows personal income data for the West reclassified into various sectors, defined as:
Transformative • - Industries where raw material is extracted and/or transformed into
Figure 2 - Construction Employment, Western U.S. and California, 1990-2010 Source: Bureau of Economic Analysis, U.S. Dept. of Commerce
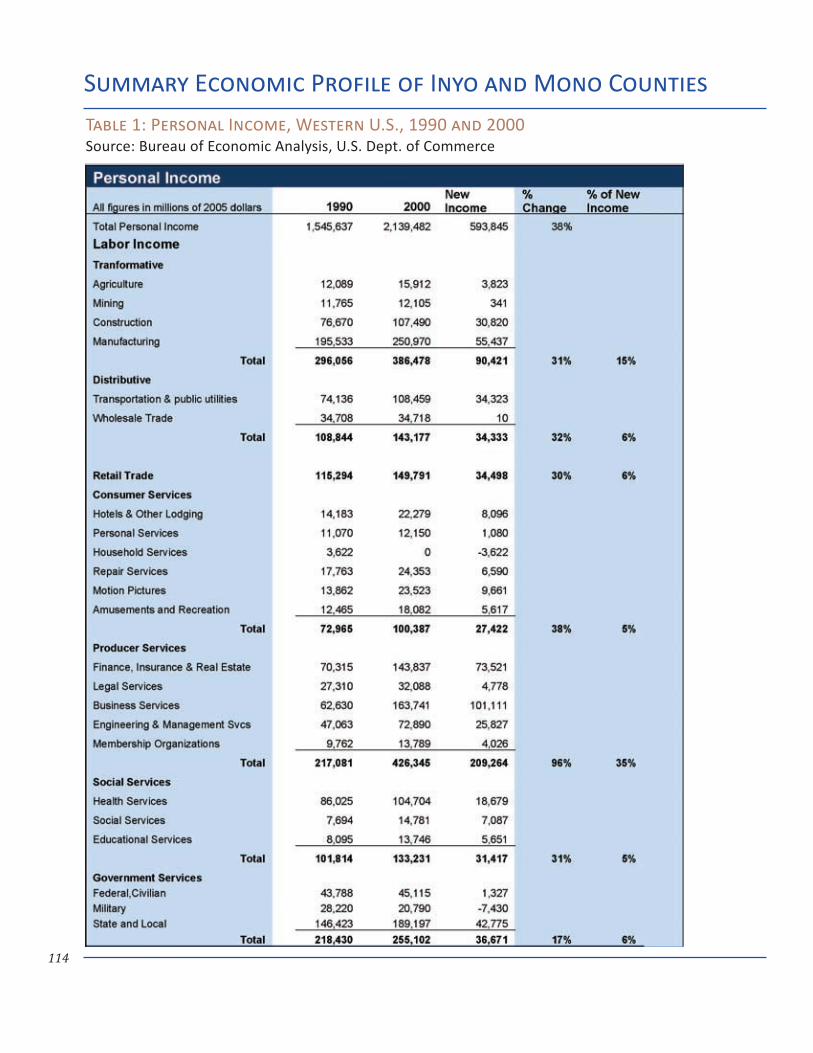
114
Summary Economic Profile of Inyo and Mono Counties
Table 1: Personal Income, Western U.S., 1990 and 2000 Source: Bureau of Economic Analysis, U.S. Dept. of Commerce
115
a finished product. This includes manufactur-ing, construction, agriculture, and mining.
Distributive • - Involved in the distribu-tion of goods and information, this includes transportation and public utilities, as well as telecommunications.
Retail Trade • - Retail sales, includes sales associates, managers and owners of retail stores.
Producer services • - Closely associated with goods production, these include engineer-ing and management services, finance and real estate, and are generally higher wage industries.
Consumer Services • - Includes many of the relatively low-wage sectors, often related to tourism, such as hotels and lodging, amuse-ment, and recreation. Also includes repair services, which can be higher wage.
Social Services • - A mix of high-wage and low -wages services including health services as well as in-person and social services.
Government • - State, local, federal and military.As can be seen in Table 1, the fastest-growing service sector in the West between 1990 and 2000 was producer services, which grew by 96 percent and accounted for 35 percent of all new personal income.
Non-labor income derives from two sources: investments and transfer payments. Investments — including income from re-tirement plans and investment accounts — provide dividends, interest, and rent. Transfer payments are government payments to indi-viduals, such as Social Security and Medicare.
Figure 3 shows that non-labor sources are the second largest source of personal income and the second fastest-growing source in the West, accounting for 30 percent of all per-sonal income in 2005 and 32 percent of new income growth between 1970 and 2005. In some areas of the West, non-labor income is the single largest source of income and has become a very important source of economic growth as people build second homes and retire in areas they once visited as tourists.
As the economy of the West has grown and diversified over the last 30 to 40 years, the traditional extractive industries of mining, logging, oil and gas, and agriculture have become a much smaller component of the economy in a relative sense. In 2000, per-sonal income from these sectors in non-metropolitan counties represented less than 8 percent of total personal income, down from 20 percent in 1970 (Rasker et al. 2004). Nearly all of the growth in employment and personal income has been in other sectors of the economy (Fig 3). Productivity increases driven by technological advances in the extractive industries have led to decreasing labor requirements. Higher-quality resource discoveries elsewhere in the world, in con-junction with freer international trade and low-cost labor, also contribute to the long-term decline of the resource industries in the West.
Rasker et al. (2004) found that states and counties in the West that were more depen-dent on the transformative industries such as mining, logging, agriculture, and manu-facturing had the slowest economic growth,
Summary Economic Profile of Inyo and Mono CountiesEconomic Context: The Changing Economy of the West
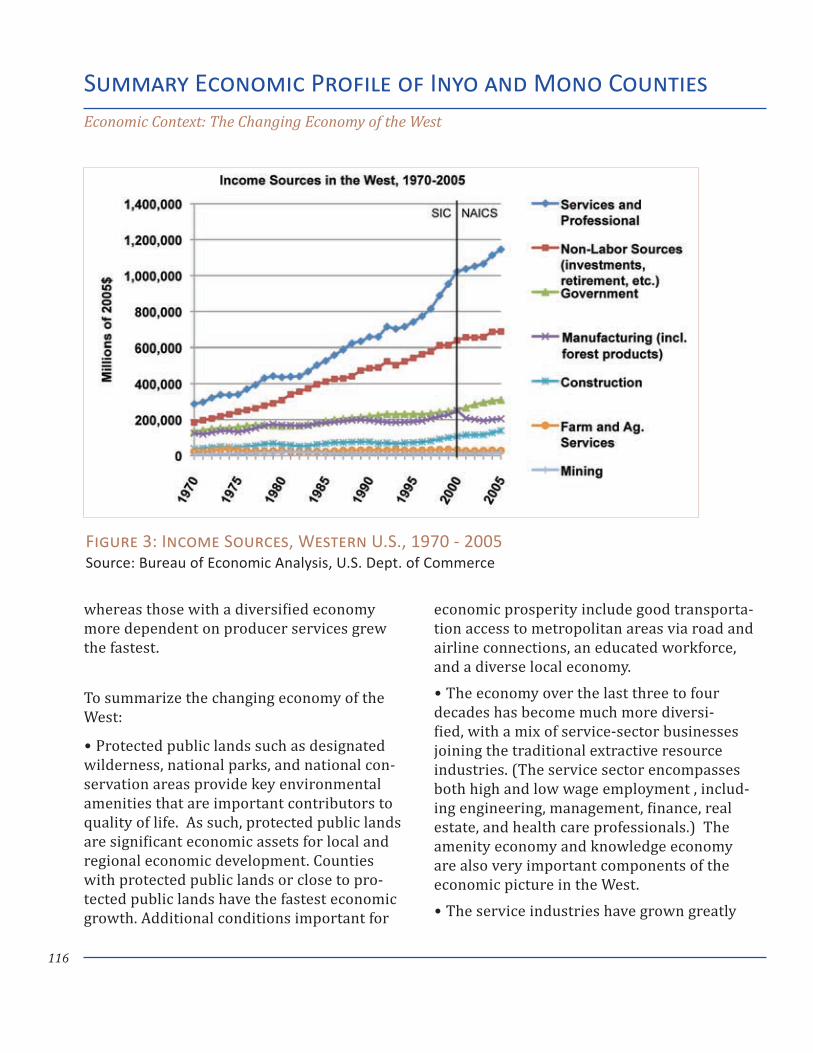
116
whereas those with a diversified economy more dependent on producer services grew the fastest.
To summarize the changing economy of the West:
Protected public lands such as designated •wilderness, national parks, and national con-servation areas provide key environmental amenities that are important contributors to quality of life. As such, protected public lands are significant economic assets for local and regional economic development. Counties with protected public lands or close to pro-tected public lands have the fastest economic growth. Additional conditions important for
economic prosperity include good transporta-tion access to metropolitan areas via road and airline connections, an educated workforce, and a diverse local economy.
The economy over the last three to four •decades has become much more diversi-fied, with a mix of service-sector businesses joining the traditional extractive resource industries. (The service sector encompasses both high and low wage employment , includ-ing engineering, management, finance, real estate, and health care professionals.) The amenity economy and knowledge economy are also very important components of the economic picture in the West.
The service industries have grown greatly •
Summary Economic Profile of Inyo and Mono CountiesEconomic Context: The Changing Economy of the West
Figure 3: Income Sources, Western U.S., 1970 - 2005 Source: Bureau of Economic Analysis, U.S. Dept. of Commerce
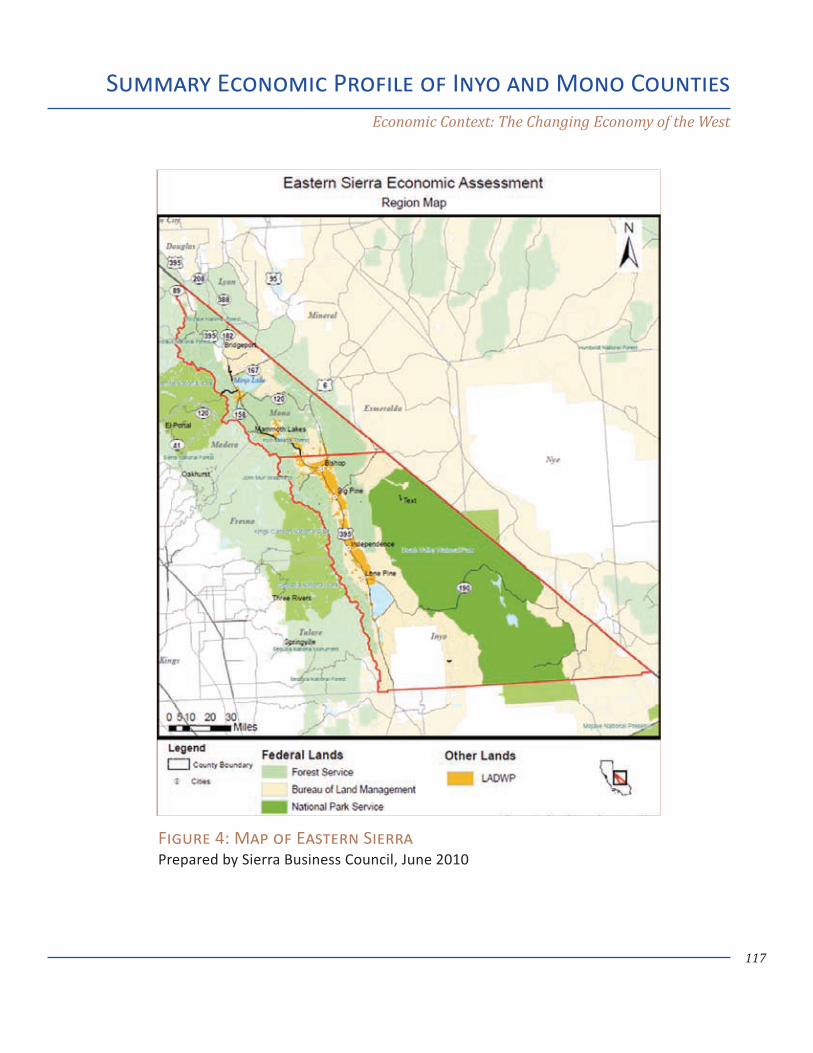
117
Summary Economic Profile of Inyo and Mono CountiesEconomic Context: The Changing Economy of the West
Figure 4: Map of Eastern Sierra Prepared by Sierra Business Council, June 2010
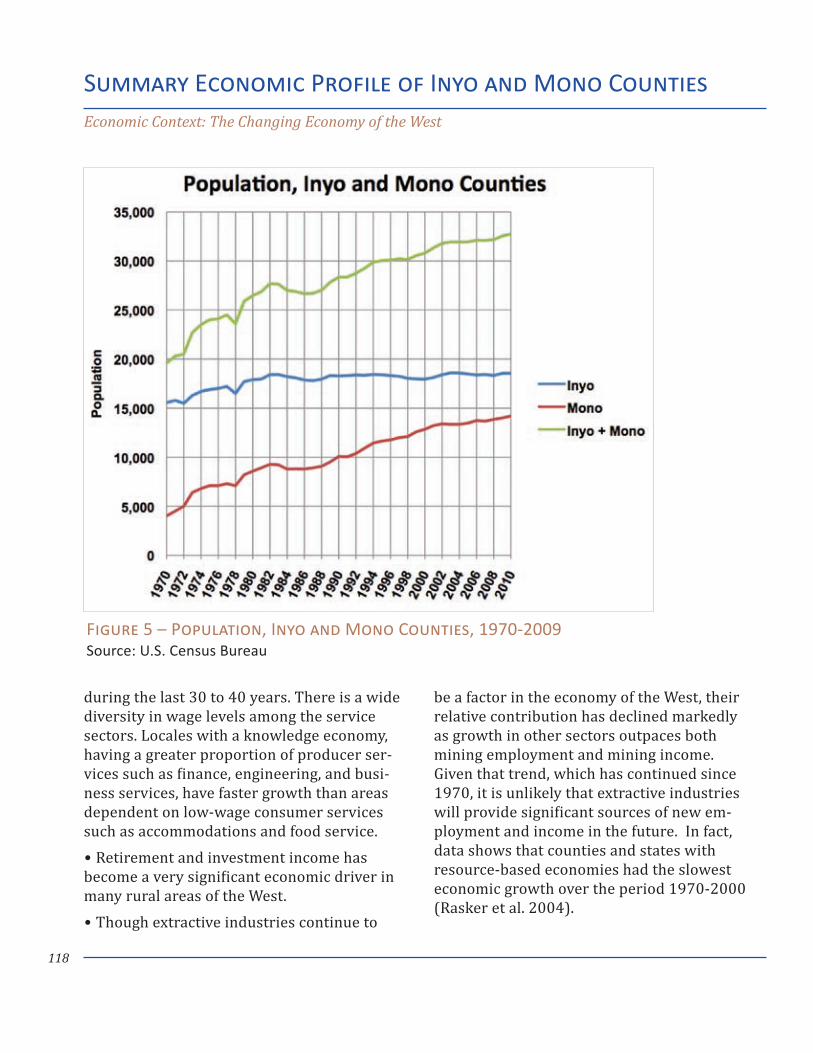
118
Summary Economic Profile of Inyo and Mono CountiesEconomic Context: The Changing Economy of the West
during the last 30 to 40 years. There is a wide diversity in wage levels among the service sectors. Locales with a knowledge economy, having a greater proportion of producer ser-vices such as finance, engineering, and busi-ness services, have faster growth than areas dependent on low-wage consumer services such as accommodations and food service.
Retirement and investment income has •become a very significant economic driver in many rural areas of the West.
Though extractive industries continue to •
be a factor in the economy of the West, their relative contribution has declined markedly as growth in other sectors outpaces both mining employment and mining income. Given that trend, which has continued since 1970, it is unlikely that extractive industries will provide significant sources of new em-ployment and income in the future. In fact, data shows that counties and states with resource-based economies had the slowest economic growth over the period 1970-2000 (Rasker et al. 2004).
Figure 5 – Population, Inyo and Mono Counties, 1970-2009 Source: U.S. Census Bureau
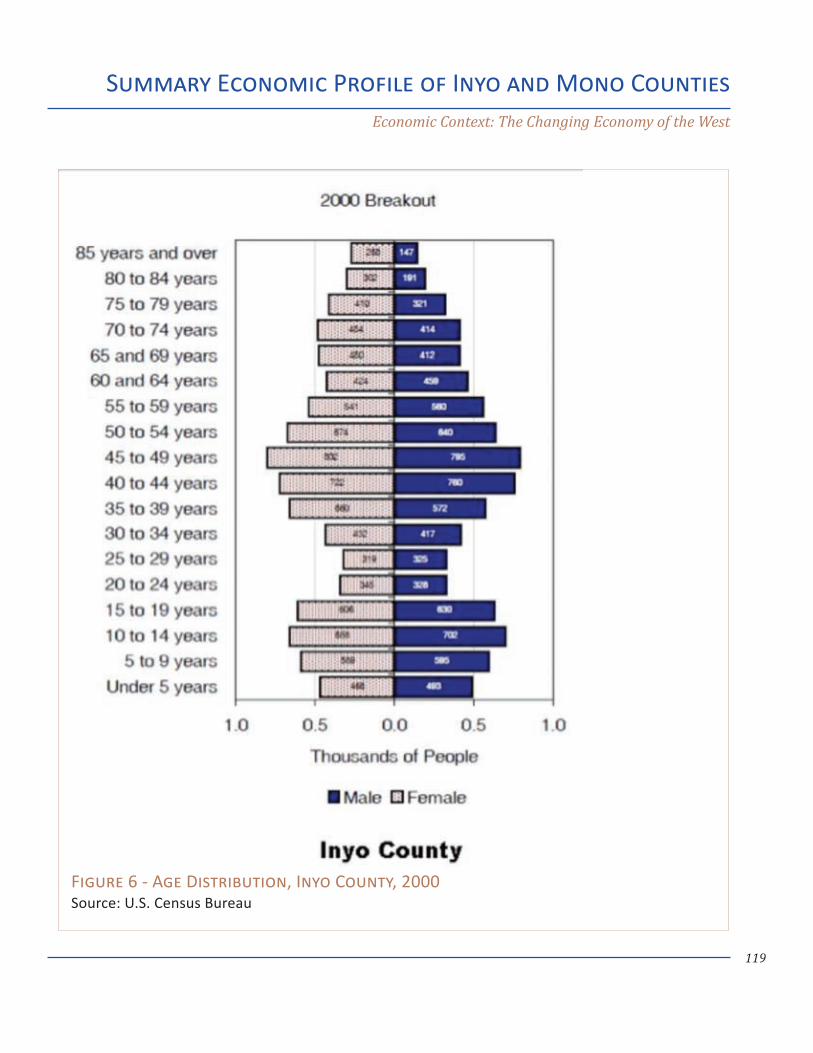
119
Summary Economic Profile of Inyo and Mono CountiesEconomic Context: The Changing Economy of the West
Figure 6 - Age Distribution, Inyo County, 2000 Source: U.S. Census Bureau
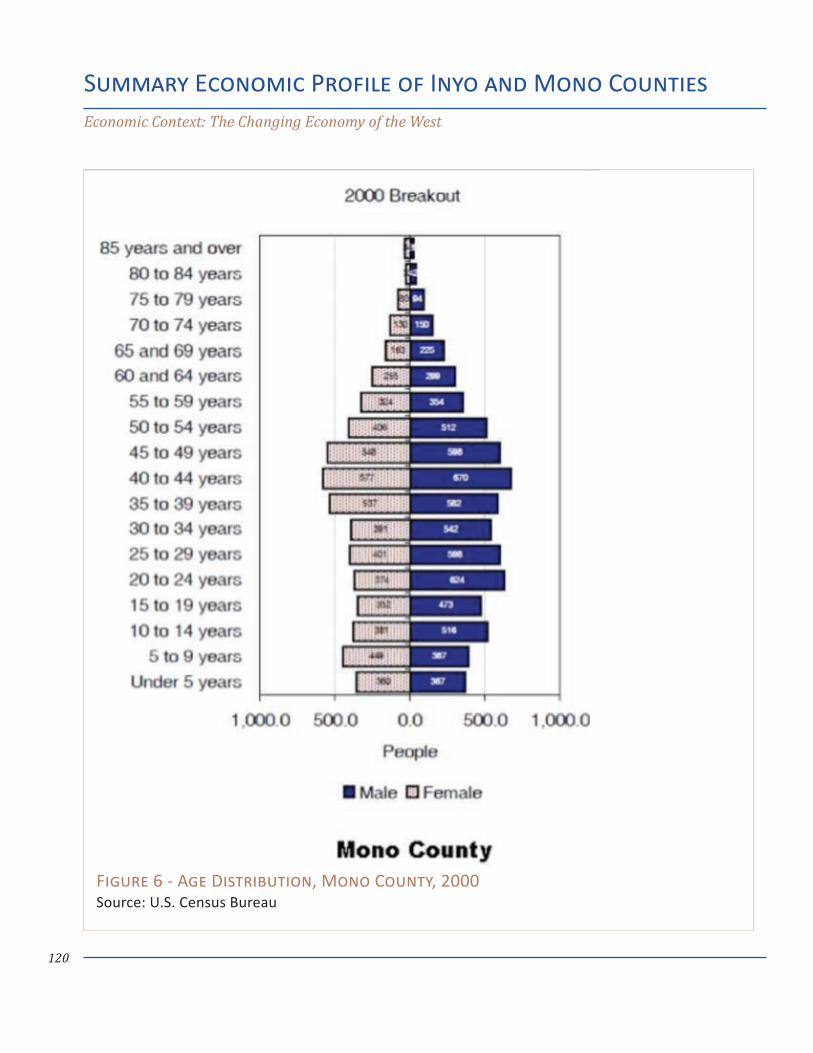
120
Summary Economic Profile of Inyo and Mono CountiesEconomic Context: The Changing Economy of the West
Figure 6 - Age Distribution, Mono County, 2000 Source: U.S. Census Bureau
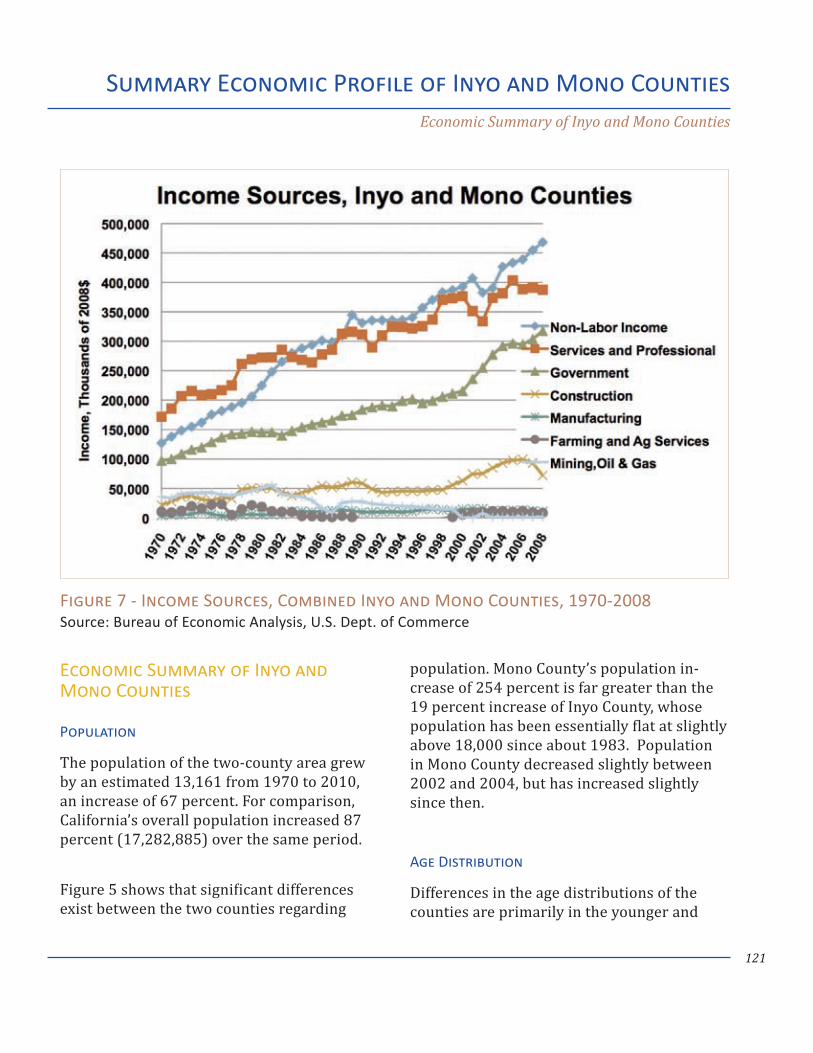
121
Summary Economic Profile of Inyo and Mono CountiesEconomic Summary of Inyo and Mono Counties
Economic Summary of Inyo and Mono Counties
Population
The population of the two-county area grew by an estimated 13,161 from 1970 to 2010, an increase of 67 percent. For comparison, California’s overall population increased 87 percent (17,282,885) over the same period.
Figure 5 shows that significant differences exist between the two counties regarding
population. Mono County’s population in-crease of 254 percent is far greater than the 19 percent increase of Inyo County, whose population has been essentially flat at slightly above 18,000 since about 1983. Population in Mono County decreased slightly between 2002 and 2004, but has increased slightly since then.
Age Distribution
Differences in the age distributions of the counties are primarily in the younger and
Figure 7 - Income Sources, Combined Inyo and Mono Counties, 1970-2008 Source: Bureau of Economic Analysis, U.S. Dept. of Commerce
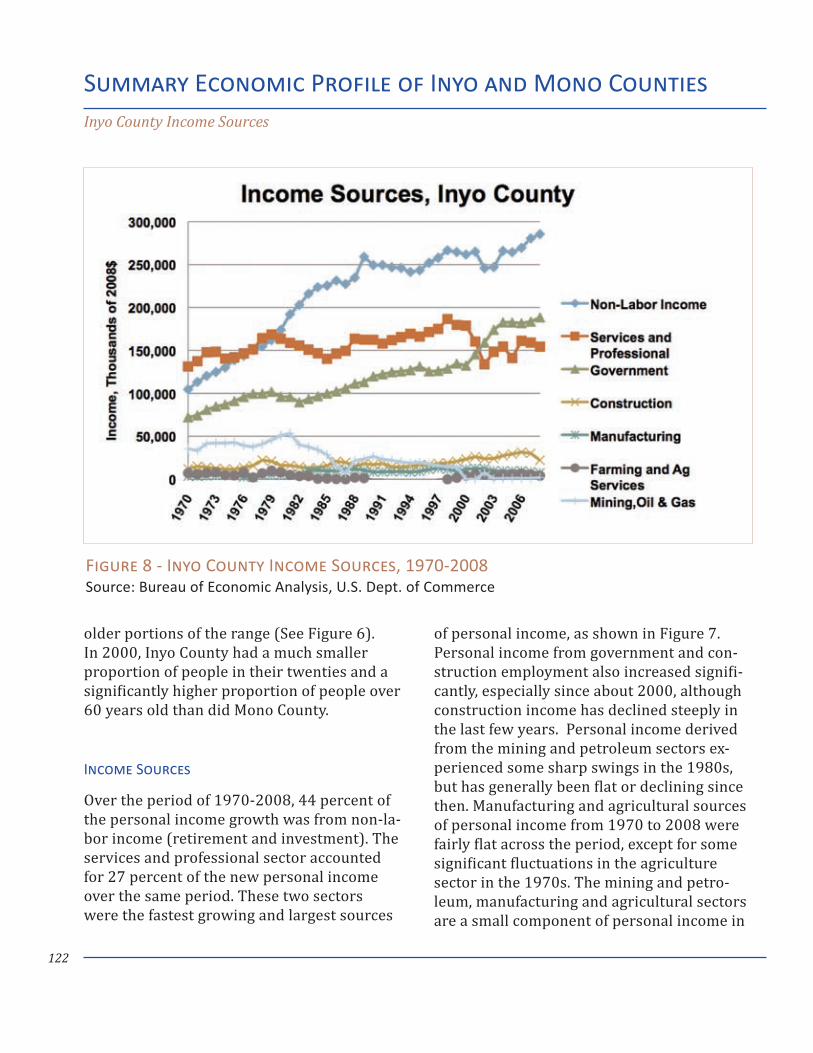
122
older portions of the range (See Figure 6). In 2000, Inyo County had a much smaller proportion of people in their twenties and a significantly higher proportion of people over 60 years old than did Mono County.
Income Sources
Over the period of 1970-2008, 44 percent of the personal income growth was from non-la-bor income (retirement and investment). The services and professional sector accounted for 27 percent of the new personal income over the same period. These two sectors were the fastest growing and largest sources
of personal income, as shown in Figure 7. Personal income from government and con-struction employment also increased signifi-cantly, especially since about 2000, although construction income has declined steeply in the last few years. Personal income derived from the mining and petroleum sectors ex-perienced some sharp swings in the 1980s, but has generally been flat or declining since then. Manufacturing and agricultural sources of personal income from 1970 to 2008 were fairly flat across the period, except for some significant fluctuations in the agriculture sector in the 1970s. The mining and petro-leum, manufacturing and agricultural sectors are a small component of personal income in
Summary Economic Profile of Inyo and Mono CountiesInyo County Income Sources
Figure 8 - Inyo County Income Sources, 1970-2008 Source: Bureau of Economic Analysis, U.S. Dept. of Commerce
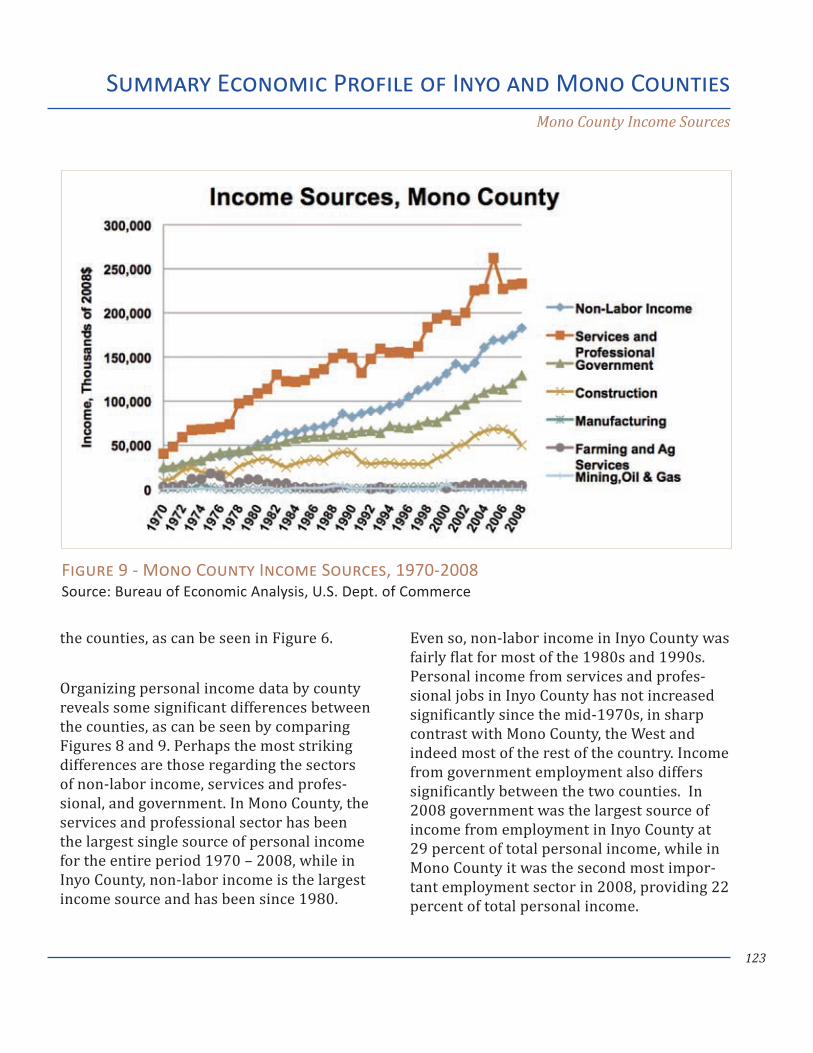
123
Summary Economic Profile of Inyo and Mono CountiesMono County Income Sources
the counties, as can be seen in Figure 6.
Organizing personal income data by county reveals some significant differences between the counties, as can be seen by comparing Figures 8 and 9. Perhaps the most striking differences are those regarding the sectors of non-labor income, services and profes-sional, and government. In Mono County, the services and professional sector has been the largest single source of personal income for the entire period 1970 – 2008, while in Inyo County, non-labor income is the largest income source and has been since 1980.
Even so, non-labor income in Inyo County was fairly flat for most of the 1980s and 1990s. Personal income from services and profes-sional jobs in Inyo County has not increased significantly since the mid-1970s, in sharp contrast with Mono County, the West and indeed most of the rest of the country. Income from government employment also differs significantly between the two counties. In 2008 government was the largest source of income from employment in Inyo County at 29 percent of total personal income, while in Mono County it was the second most impor-tant employment sector in 2008, providing 22 percent of total personal income.
Figure 9 - Mono County Income Sources, 1970-2008 Source: Bureau of Economic Analysis, U.S. Dept. of Commerce
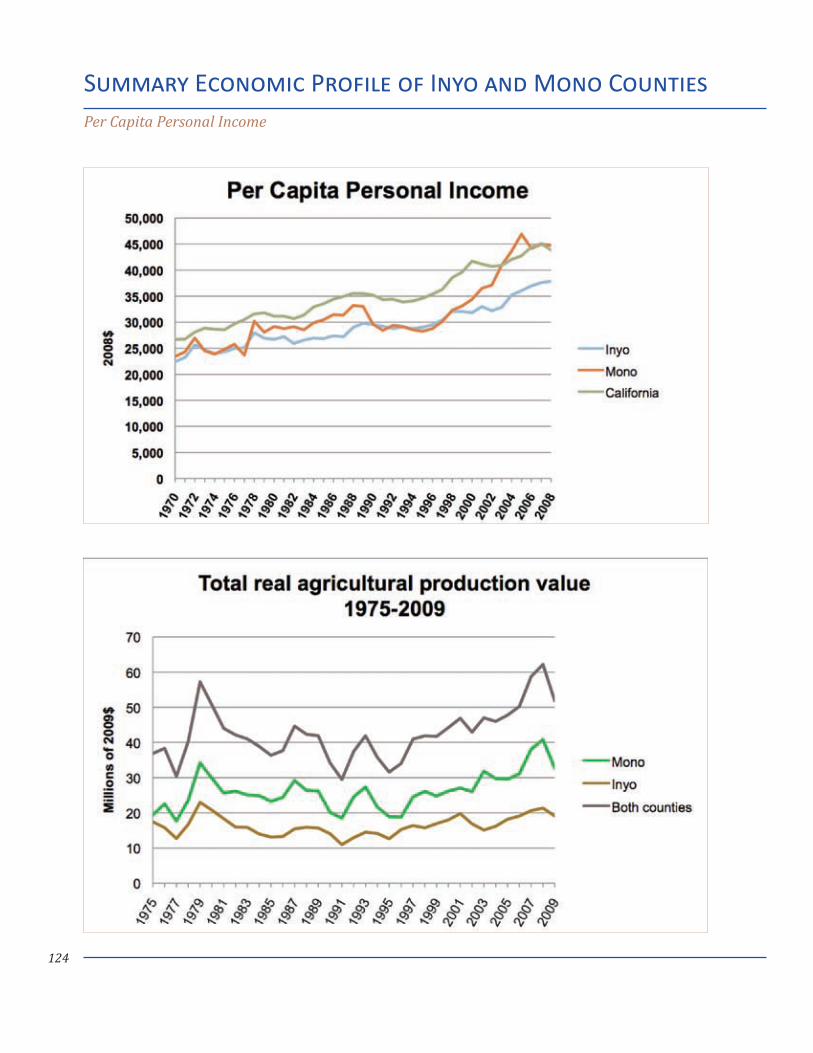
124
Summary Economic Profile of Inyo and Mono CountiesPer Capita Personal Income
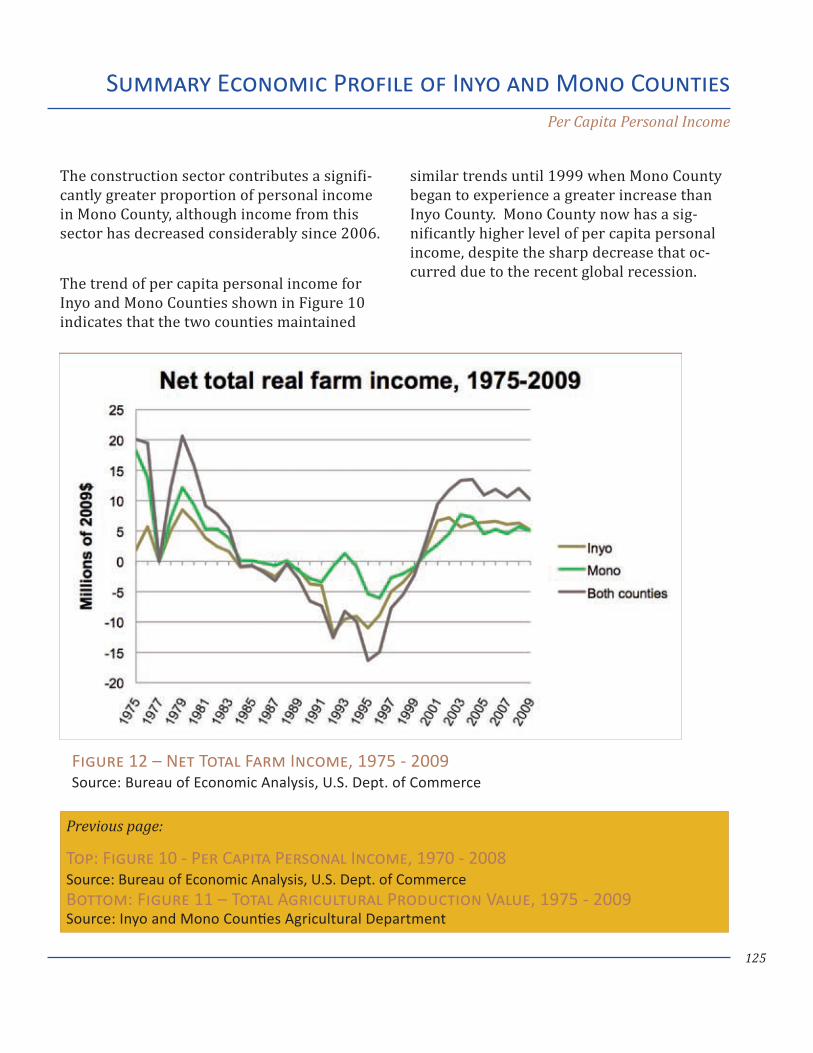
125
Summary Economic Profile of Inyo and Mono CountiesPer Capita Personal Income
The construction sector contributes a signifi-cantly greater proportion of personal income in Mono County, although income from this sector has decreased considerably since 2006.
The trend of per capita personal income for Inyo and Mono Counties shown in Figure 10 indicates that the two counties maintained
similar trends until 1999 when Mono County began to experience a greater increase than Inyo County. Mono County now has a sig-nificantly higher level of per capita personal income, despite the sharp decrease that oc-curred due to the recent global recession.
Figure 12 – Net Total Farm Income, 1975 - 2009 Source: Bureau of Economic Analysis, U.S. Dept. of Commerce
Previous page:
Top: Figure 10 - Per Capita Personal Income, 1970 - 2008 Source: Bureau of Economic Analysis, U.S. Dept. of CommerceBottom: Figure 11 – Total Agricultural Production Value, 1975 - 2009 Source: Inyo and Mono Counties Agricultural Department
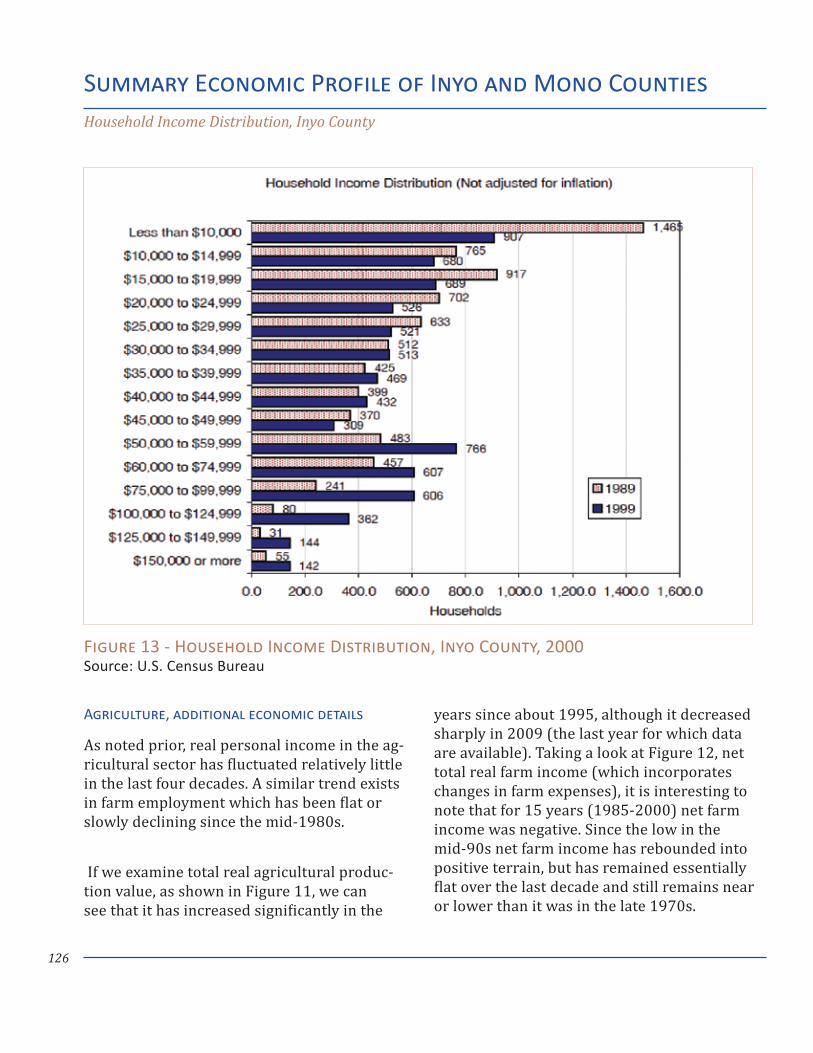
126
Agriculture, additional economic details
As noted prior, real personal income in the ag-ricultural sector has fluctuated relatively little in the last four decades. A similar trend exists in farm employment which has been flat or slowly declining since the mid-1980s.
If we examine total real agricultural produc-tion value, as shown in Figure 11, we can see that it has increased significantly in the
years since about 1995, although it decreased sharply in 2009 (the last year for which data are available). Taking a look at Figure 12, net total real farm income (which incorporates changes in farm expenses), it is interesting to note that for 15 years (1985-2000) net farm income was negative. Since the low in the mid-90s net farm income has rebounded into positive terrain, but has remained essentially flat over the last decade and still remains near or lower than it was in the late 1970s.
Summary Economic Profile of Inyo and Mono CountiesHousehold Income Distribution, Inyo County
Figure 13 - Household Income Distribution, Inyo County, 2000 Source: U.S. Census Bureau
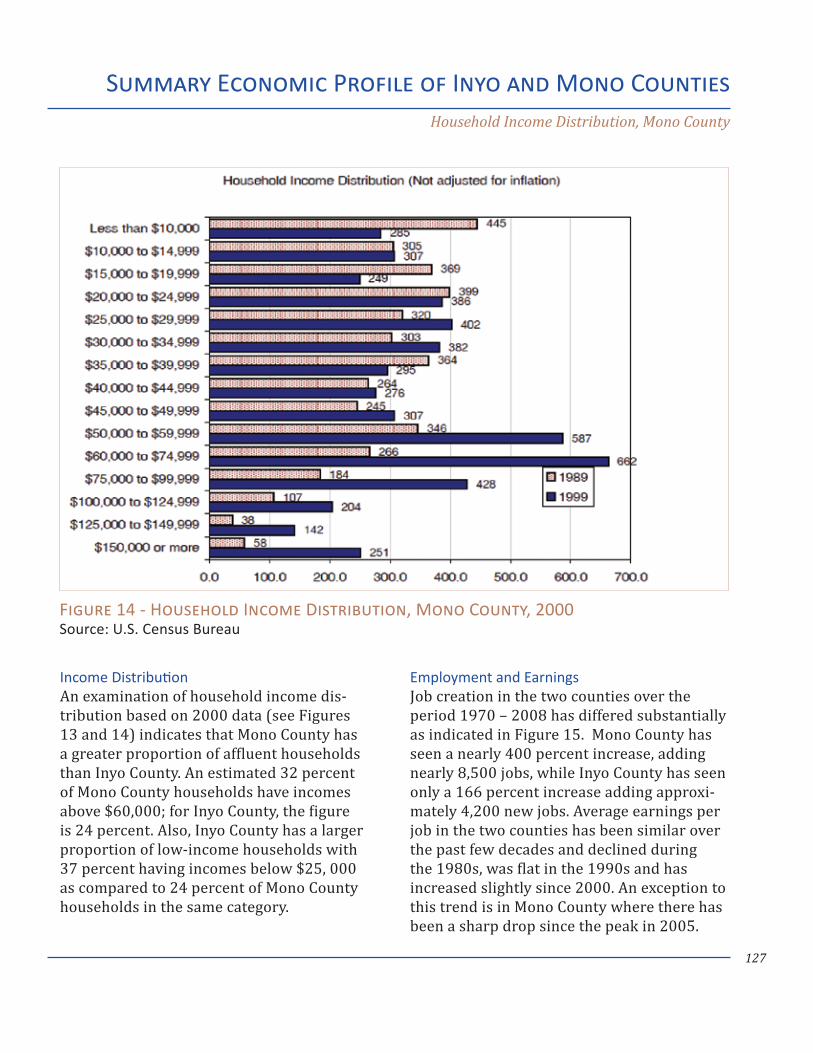
127
Income DistributionAn examination of household income dis-tribution based on 2000 data (see Figures 13 and 14) indicates that Mono County has a greater proportion of affluent households than Inyo County. An estimated 32 percent of Mono County households have incomes above $60,000; for Inyo County, the figure is 24 percent. Also, Inyo County has a larger proportion of low-income households with 37 percent having incomes below $25, 000 as compared to 24 percent of Mono County households in the same category.
Employment and EarningsJob creation in the two counties over the period 1970 – 2008 has differed substantially as indicated in Figure 15. Mono County has seen a nearly 400 percent increase, adding nearly 8,500 jobs, while Inyo County has seen only a 166 percent increase adding approxi-mately 4,200 new jobs. Average earnings per job in the two counties has been similar over the past few decades and declined during the 1980s, was flat in the 1990s and has increased slightly since 2000. An exception to this trend is in Mono County where there has been a sharp drop since the peak in 2005.
Summary Economic Profile of Inyo and Mono CountiesHousehold Income Distribution, Mono County
Figure 14 - Household Income Distribution, Mono County, 2000 Source: U.S. Census Bureau
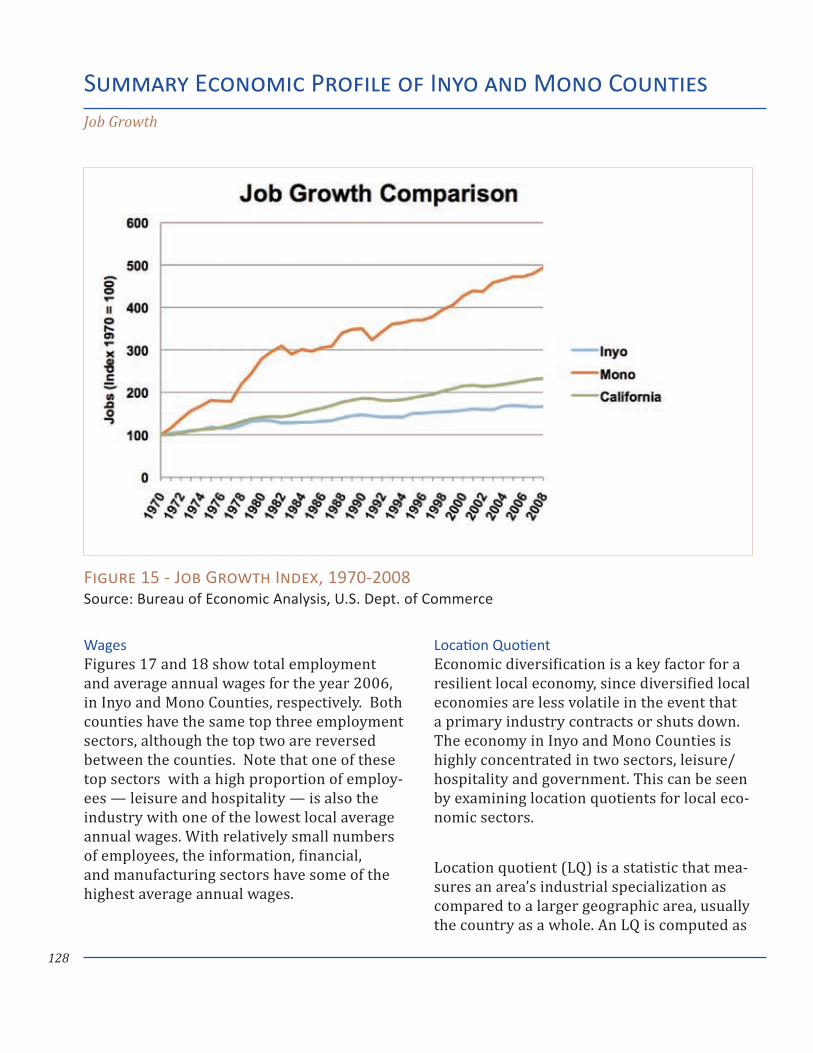
128
WagesFigures 17 and 18 show total employment and average annual wages for the year 2006, in Inyo and Mono Counties, respectively. Both counties have the same top three employment sectors, although the top two are reversed between the counties. Note that one of these top sectors with a high proportion of employ-ees — leisure and hospitality — is also the industry with one of the lowest local average annual wages. With relatively small numbers of employees, the information, financial, and manufacturing sectors have some of the highest average annual wages.
Location QuotientEconomic diversification is a key factor for a resilient local economy, since diversified local economies are less volatile in the event that a primary industry contracts or shuts down. The economy in Inyo and Mono Counties is highly concentrated in two sectors, leisure/hospitality and government. This can be seen by examining location quotients for local eco-nomic sectors.
Location quotient (LQ) is a statistic that mea-sures an area’s industrial specialization as compared to a larger geographic area, usually the country as a whole. An LQ is computed as
Summary Economic Profile of Inyo and Mono CountiesJob Growth
Figure 15 - Job Growth Index, 1970-2008 Source: Bureau of Economic Analysis, U.S. Dept. of Commerce
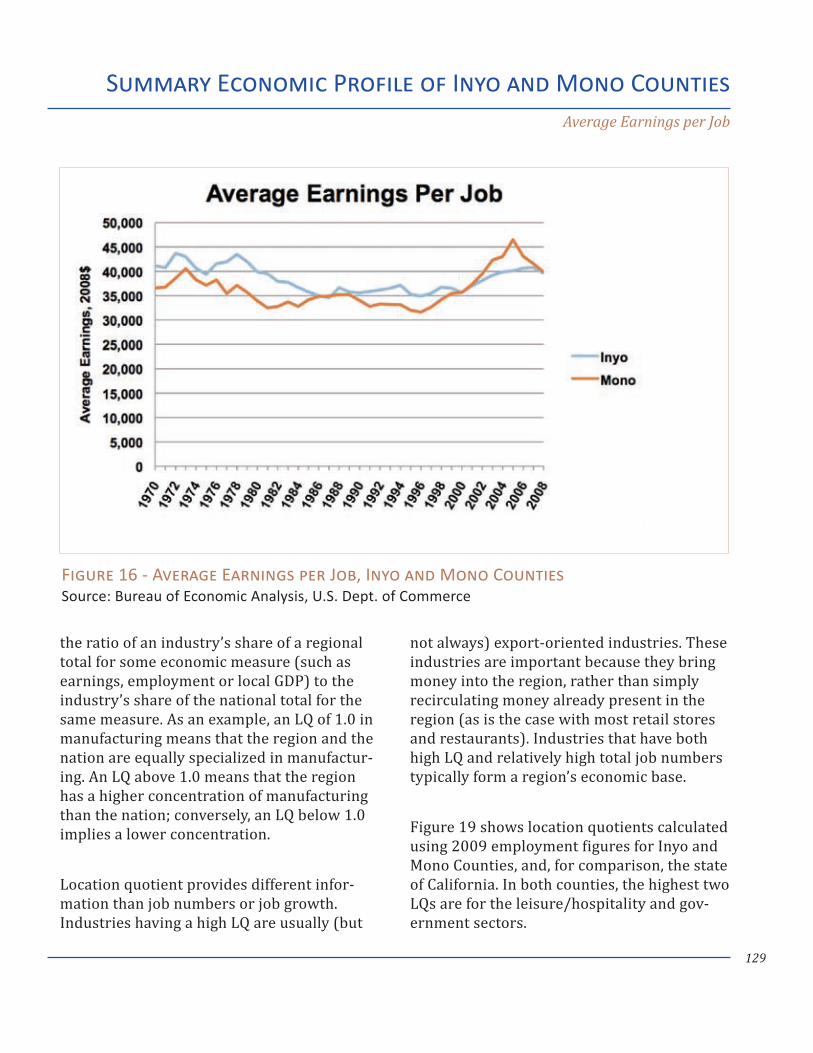
129
the ratio of an industry’s share of a regional total for some economic measure (such as earnings, employment or local GDP) to the industry’s share of the national total for the same measure. As an example, an LQ of 1.0 in manufacturing means that the region and the nation are equally specialized in manufactur-ing. An LQ above 1.0 means that the region has a higher concentration of manufacturing than the nation; conversely, an LQ below 1.0 implies a lower concentration.
Location quotient provides different infor-mation than job numbers or job growth. Industries having a high LQ are usually (but
not always) export-oriented industries. These industries are important because they bring money into the region, rather than simply recirculating money already present in the region (as is the case with most retail stores and restaurants). Industries that have both high LQ and relatively high total job numbers typically form a region’s economic base.
Figure 19 shows location quotients calculated using 2009 employment figures for Inyo and Mono Counties, and, for comparison, the state of California. In both counties, the highest two LQs are for the leisure/hospitality and gov-ernment sectors.
Summary Economic Profile of Inyo and Mono CountiesAverage Earnings per Job
Figure 16 - Average Earnings per Job, Inyo and Mono Counties Source: Bureau of Economic Analysis, U.S. Dept. of Commerce
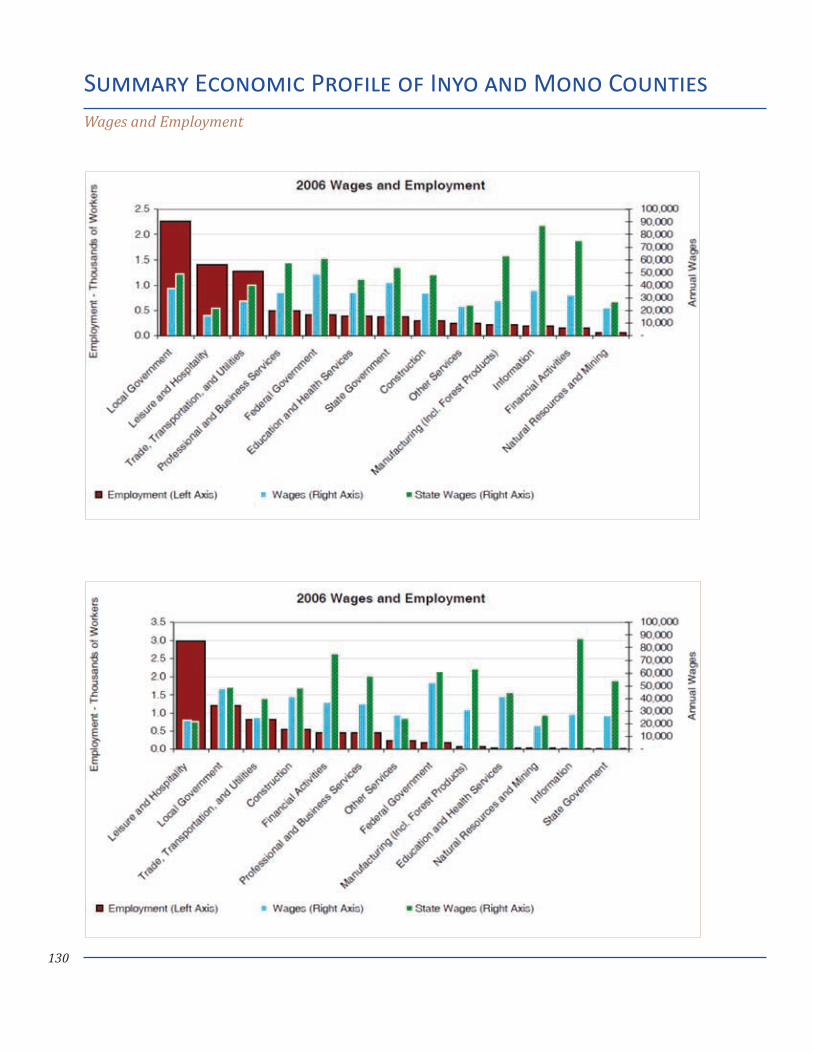
130
Summary Economic Profile of Inyo and Mono CountiesWages and Employment
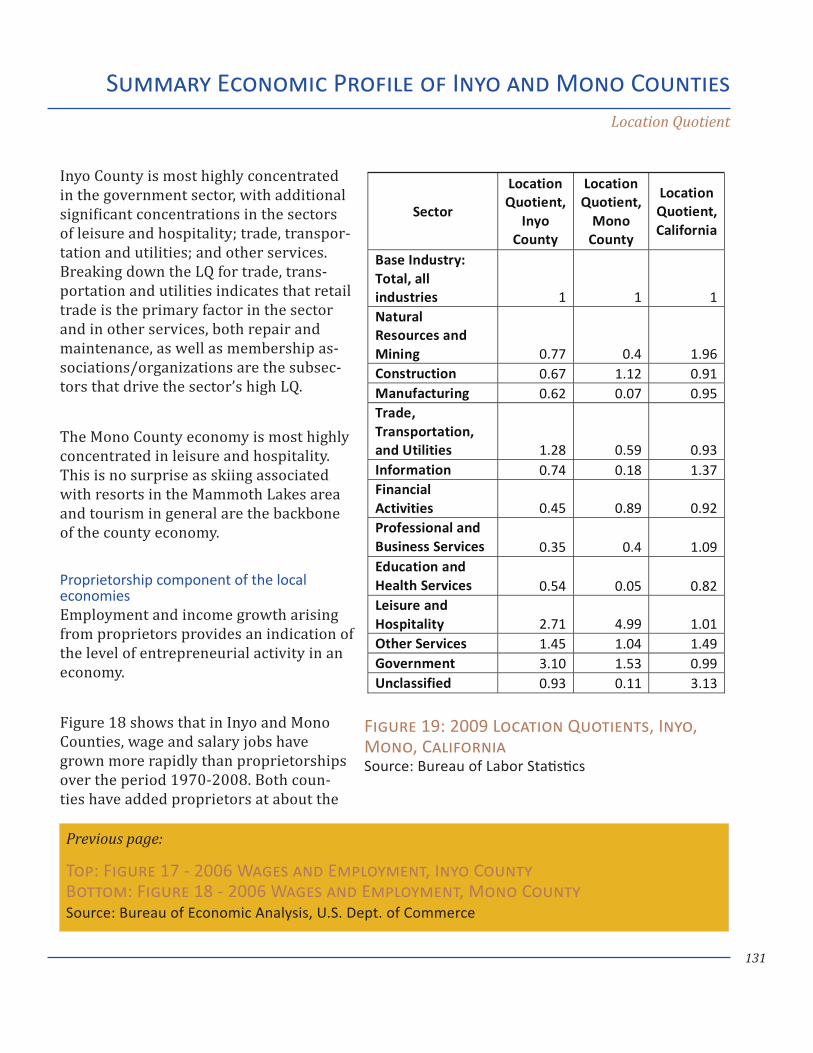
131
Inyo County is most highly concentrated in the government sector, with additional significant concentrations in the sectors of leisure and hospitality; trade, transpor-tation and utilities; and other services. Breaking down the LQ for trade, trans-portation and utilities indicates that retail trade is the primary factor in the sector and in other services, both repair and maintenance, as well as membership as-sociations/organizations are the subsec-tors that drive the sector’s high LQ.
The Mono County economy is most highly concentrated in leisure and hospitality. This is no surprise as skiing associated with resorts in the Mammoth Lakes area and tourism in general are the backbone of the county economy.
Proprietorship component of the local economiesEmployment and income growth arising from proprietors provides an indication of the level of entrepreneurial activity in an economy.
Figure 18 shows that in Inyo and Mono Counties, wage and salary jobs have grown more rapidly than proprietorships over the period 1970-2008. Both coun-ties have added proprietors at about the
Summary Economic Profile of Inyo and Mono CountiesLocation Quotient
Previous page:
Top: Figure 17 - 2006 Wages and Employment, Inyo County Bottom: Figure 18 - 2006 Wages and Employment, Mono County Source: Bureau of Economic Analysis, U.S. Dept. of Commerce
Figure 19: 2009 Location Quotients, Inyo, Mono, California Source: Bureau of Labor Statistics
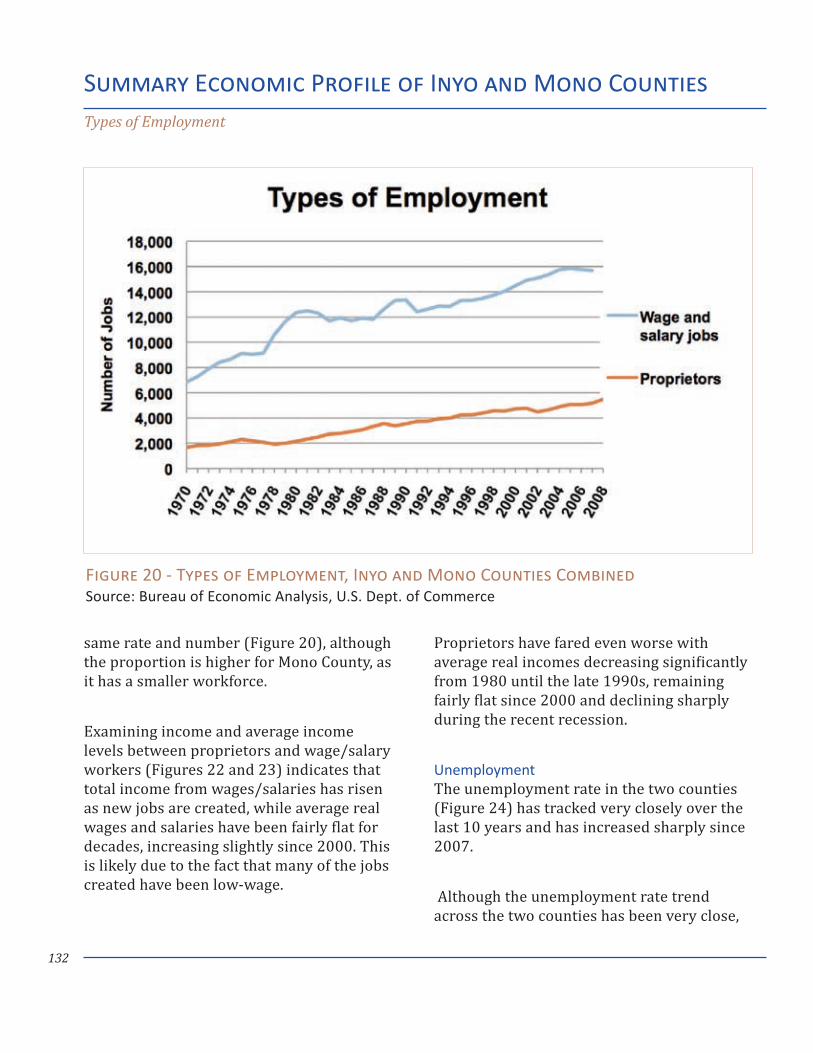
132
same rate and number (Figure 20), although the proportion is higher for Mono County, as it has a smaller workforce.
Examining income and average income levels between proprietors and wage/salary workers (Figures 22 and 23) indicates that total income from wages/salaries has risen as new jobs are created, while average real wages and salaries have been fairly flat for decades, increasing slightly since 2000. This is likely due to the fact that many of the jobs created have been low-wage.
Proprietors have fared even worse with average real incomes decreasing significantly from 1980 until the late 1990s, remaining fairly flat since 2000 and declining sharply during the recent recession.
UnemploymentThe unemployment rate in the two counties (Figure 24) has tracked very closely over the last 10 years and has increased sharply since 2007.
Although the unemployment rate trend across the two counties has been very close,
Summary Economic Profile of Inyo and Mono CountiesTypes of Employment
Figure 20 - Types of Employment, Inyo and Mono Counties Combined Source: Bureau of Economic Analysis, U.S. Dept. of Commerce
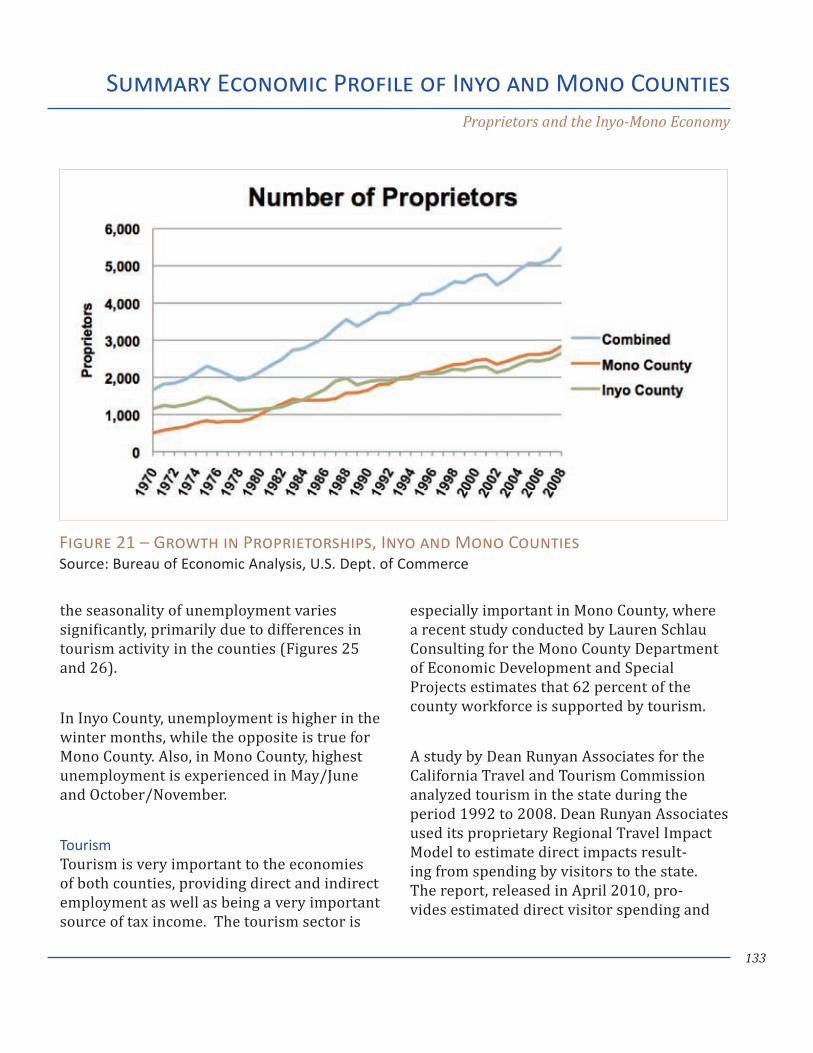
133
Summary Economic Profile of Inyo and Mono CountiesProprietors and the Inyo-Mono Economy
the seasonality of unemployment varies significantly, primarily due to differences in tourism activity in the counties (Figures 25 and 26).
In Inyo County, unemployment is higher in the winter months, while the opposite is true for Mono County. Also, in Mono County, highest unemployment is experienced in May/June and October/November.
TourismTourism is very important to the economies of both counties, providing direct and indirect employment as well as being a very important source of tax income. The tourism sector is
especially important in Mono County, where a recent study conducted by Lauren Schlau Consulting for the Mono County Department of Economic Development and Special Projects estimates that 62 percent of the county workforce is supported by tourism.
A study by Dean Runyan Associates for the California Travel and Tourism Commission analyzed tourism in the state during the period 1992 to 2008. Dean Runyan Associates used its proprietary Regional Travel Impact Model to estimate direct impacts result-ing from spending by visitors to the state. The report, released in April 2010, pro-vides estimated direct visitor spending and
Figure 21 – Growth in Proprietorships, Inyo and Mono Counties Source: Bureau of Economic Analysis, U.S. Dept. of Commerce
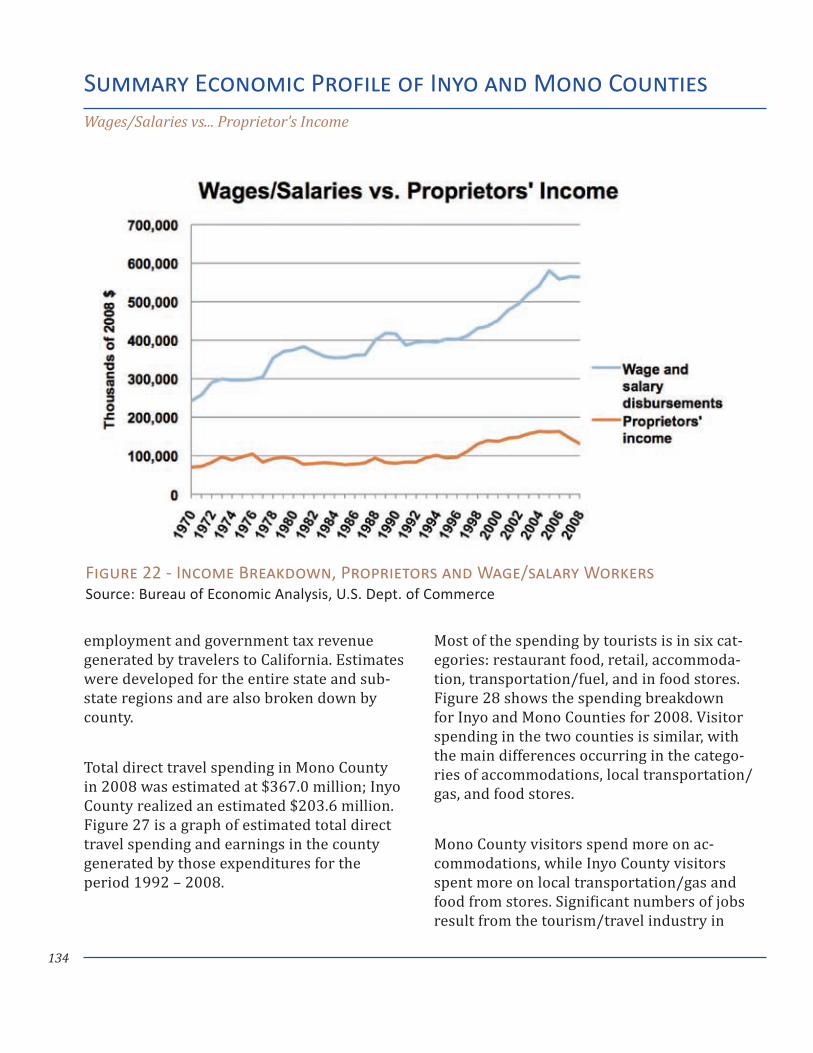
134
Summary Economic Profile of Inyo and Mono CountiesWages/Salaries vs... Proprietor’s Income
employment and government tax revenue generated by travelers to California. Estimates were developed for the entire state and sub-state regions and are also broken down by county.
Total direct travel spending in Mono County in 2008 was estimated at $367.0 million; Inyo County realized an estimated $203.6 million. Figure 27 is a graph of estimated total direct travel spending and earnings in the county generated by those expenditures for the period 1992 – 2008.
Most of the spending by tourists is in six cat-egories: restaurant food, retail, accommoda-tion, transportation/fuel, and in food stores. Figure 28 shows the spending breakdown for Inyo and Mono Counties for 2008. Visitor spending in the two counties is similar, with the main differences occurring in the catego-ries of accommodations, local transportation/gas, and food stores.
Mono County visitors spend more on ac-commodations, while Inyo County visitors spent more on local transportation/gas and food from stores. Significant numbers of jobs result from the tourism/travel industry in
Figure 22 - Income Breakdown, Proprietors and Wage/salary Workers Source: Bureau of Economic Analysis, U.S. Dept. of Commerce
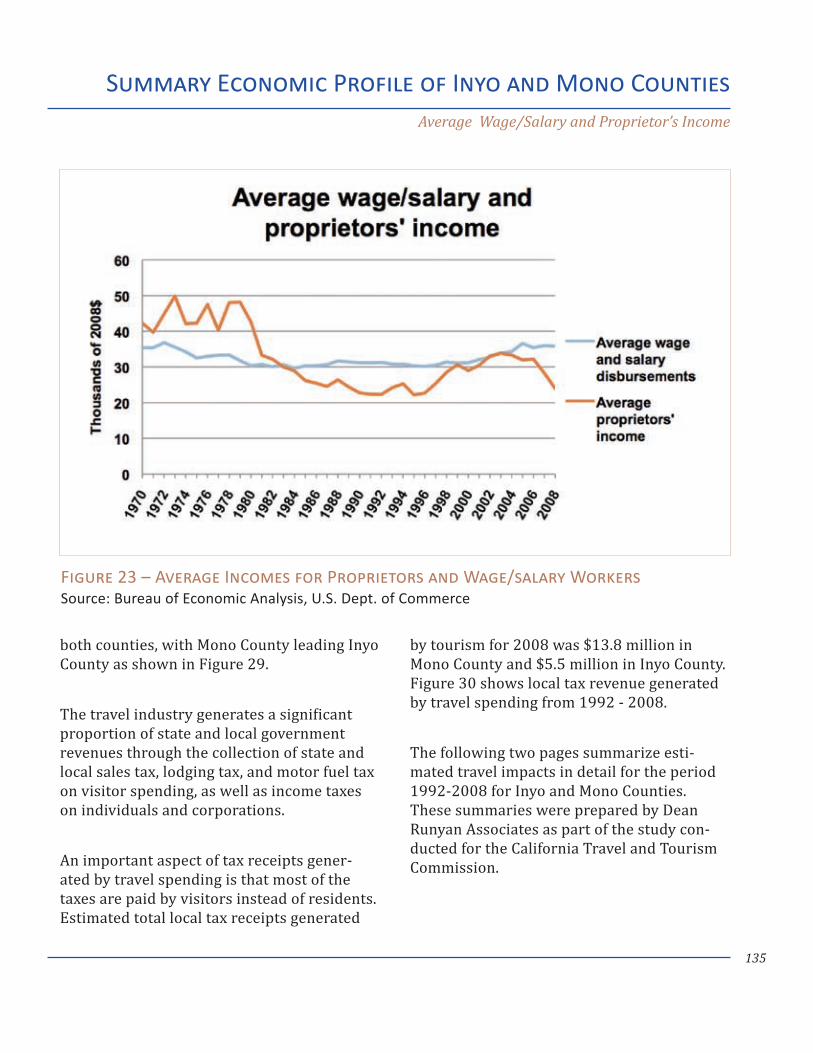
135
both counties, with Mono County leading Inyo County as shown in Figure 29.
The travel industry generates a significant proportion of state and local government revenues through the collection of state and local sales tax, lodging tax, and motor fuel tax on visitor spending, as well as income taxes on individuals and corporations.
An important aspect of tax receipts gener-ated by travel spending is that most of the taxes are paid by visitors instead of residents. Estimated total local tax receipts generated
by tourism for 2008 was $13.8 million in Mono County and $5.5 million in Inyo County. Figure 30 shows local tax revenue generated by travel spending from 1992 - 2008.
The following two pages summarize esti-mated travel impacts in detail for the period 1992-2008 for Inyo and Mono Counties. These summaries were prepared by Dean Runyan Associates as part of the study con-ducted for the California Travel and Tourism Commission.
Summary Economic Profile of Inyo and Mono CountiesAverage Wage/Salary and Proprietor’s Income
Figure 23 – Average Incomes for Proprietors and Wage/salary Workers Source: Bureau of Economic Analysis, U.S. Dept. of Commerce
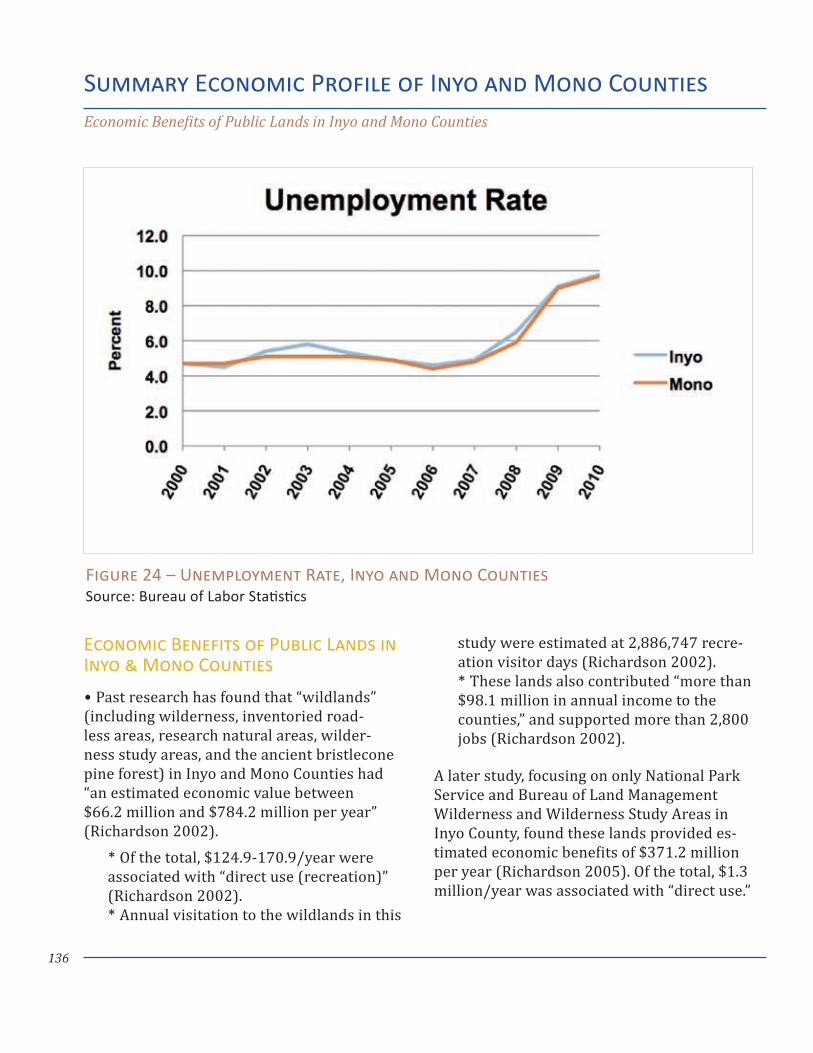
136
Summary Economic Profile of Inyo and Mono CountiesEconomic Benefits of Public Lands in Inyo and Mono Counties
Economic Benefits of Public Lands in Inyo & Mono Counties
Past research has found that “wildlands” •(including wilderness, inventoried road-less areas, research natural areas, wilder-ness study areas, and the ancient bristlecone pine forest) in Inyo and Mono Counties had “an estimated economic value between $66.2 million and $784.2 million per year” (Richardson 2002).
Of the total, $124.9-170.9/year were * associated with “direct use (recreation)” (Richardson 2002).
Annual visitation to the wildlands in this *
study were estimated at 2,886,747 recre-ation visitor days (Richardson 2002).
These lands also contributed “more than * $98.1 million in annual income to the counties,” and supported more than 2,800 jobs (Richardson 2002).
A later study, focusing on only National Park Service and Bureau of Land Management Wilderness and Wilderness Study Areas in Inyo County, found these lands provided es-timated economic benefits of $371.2 million per year (Richardson 2005). Of the total, $1.3 million/year was associated with “direct use.”
Figure 24 – Unemployment Rate, Inyo and Mono Counties Source: Bureau of Labor Statistics
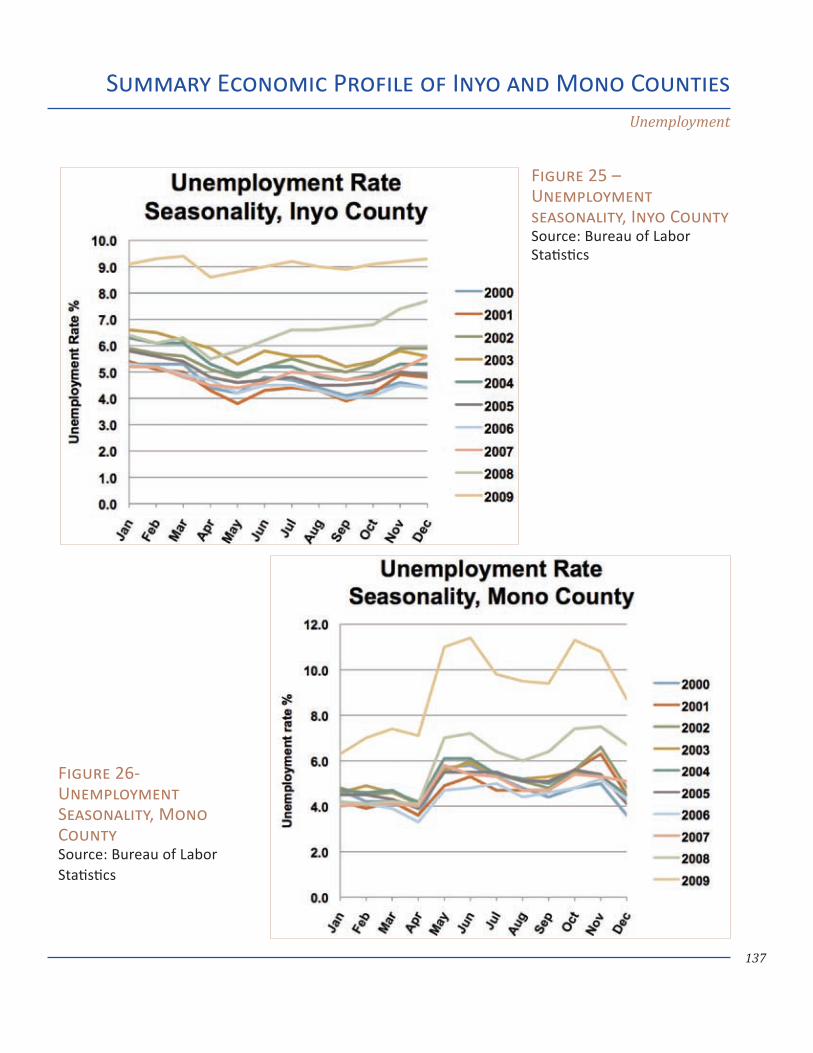
137
Summary Economic Profile of Inyo and Mono CountiesUnemployment
Figure 25 – Unemployment seasonality, Inyo County Source: Bureau of Labor Statistics
Figure 26- Unemployment Seasonality, Mono County Source: Bureau of Labor Statistics
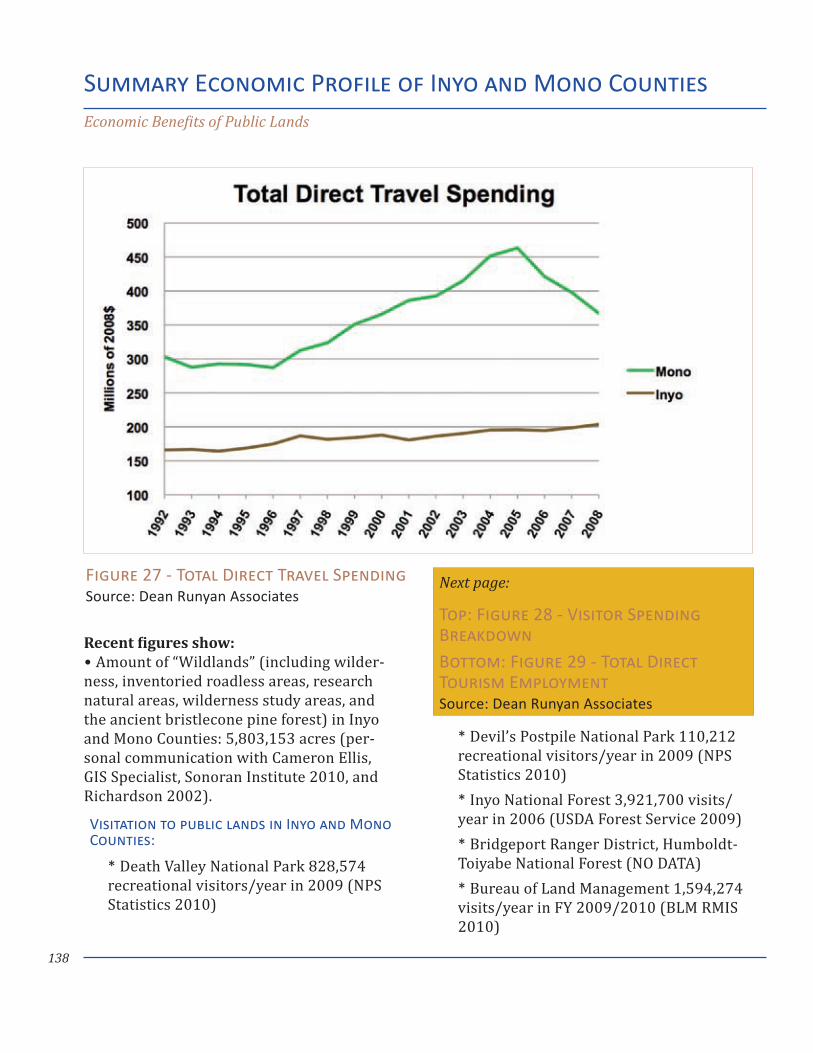
138
Recent figures show:Amount of “Wildlands” (including wilder- •
ness, inventoried roadless areas, research natural areas, wilderness study areas, and the ancient bristlecone pine forest) in Inyo and Mono Counties: 5,803,153 acres (per-sonal communication with Cameron Ellis, GIS Specialist, Sonoran Institute 2010, and Richardson 2002).
Visitation to public lands in Inyo and Mono Counties:
Death Valley National Park 828,574 * recreational visitors/year in 2009 (NPS Statistics 2010)
Devil’s Postpile National Park 110,212 * recreational visitors/year in 2009 (NPS Statistics 2010)
Inyo National Forest 3,921,700 visits/* year in 2006 (USDA Forest Service 2009)
Bridgeport Ranger District, Humboldt-* Toiyabe National Forest (NO DATA)
Bureau of Land Management 1,594,274 * visits/year in FY 2009/2010 (BLM RMIS 2010)
Summary Economic Profile of Inyo and Mono CountiesEconomic Benefits of Public Lands
Figure 27 - Total Direct Travel Spending Source: Dean Runyan Associates
Next page:
Top: Figure 28 - Visitor Spending BreakdownBottom: Figure 29 - Total Direct Tourism Employment Source: Dean Runyan Associates
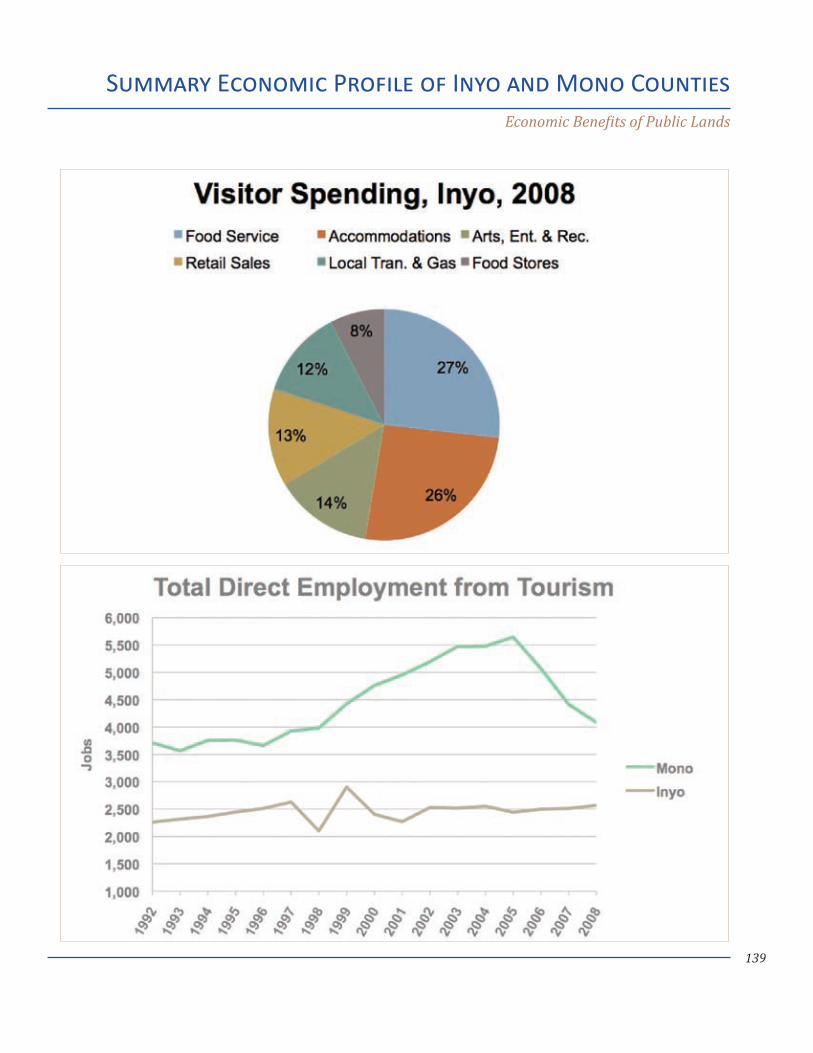
139
Summary Economic Profile of Inyo and Mono CountiesEconomic Benefits of Public Lands
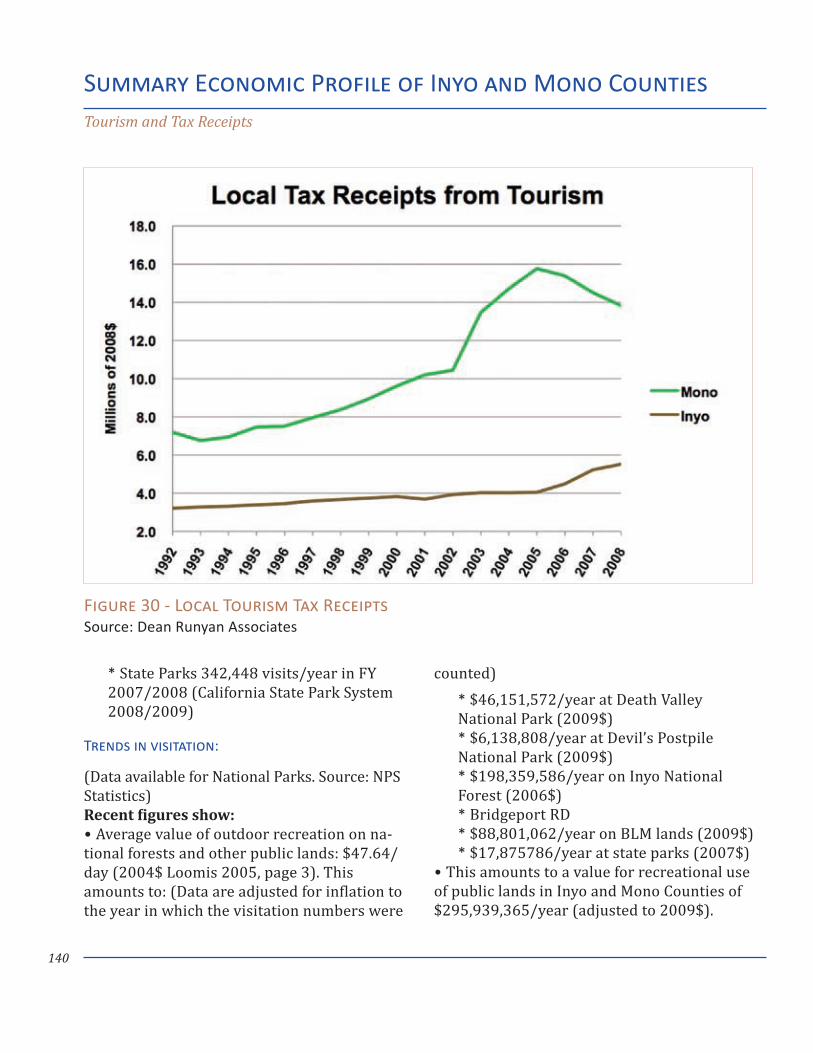
140
State Parks 342,448 visits/year in FY * 2007/2008 (California State Park System 2008/2009)
Trends in visitation:
(Data available for National Parks. Source: NPS Statistics)Recent figures show:
Average value of outdoor recreation on na- •tional forests and other public lands: $47.64/day (2004$ Loomis 2005, page 3). This amounts to: (Data are adjusted for inflation to the year in which the visitation numbers were
counted)$46,151,572/year at Death Valley *
National Park (2009$)$6,138,808/year at Devil’s Postpile *
National Park (2009$)$198,359,586/year on Inyo National *
Forest (2006$)Bridgeport RD* $88,801,062/year on BLM lands (2009$)* $17,875786/year at state parks (2007$)*
This amounts to a value for recreational use •of public lands in Inyo and Mono Counties of $295,939,365/year (adjusted to 2009$).
Summary Economic Profile of Inyo and Mono CountiesTourism and Tax Receipts
Figure 30 - Local Tourism Tax Receipts Source: Dean Runyan Associates
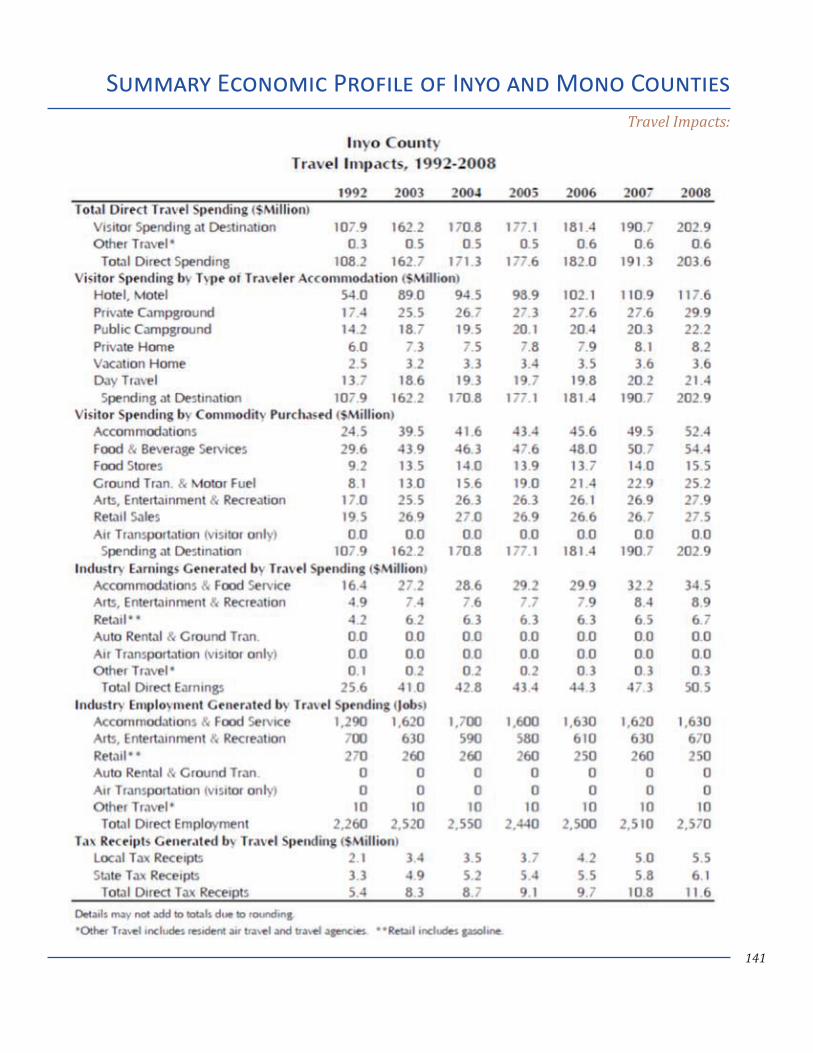
141
Summary Economic Profile of Inyo and Mono CountiesTravel Impacts:
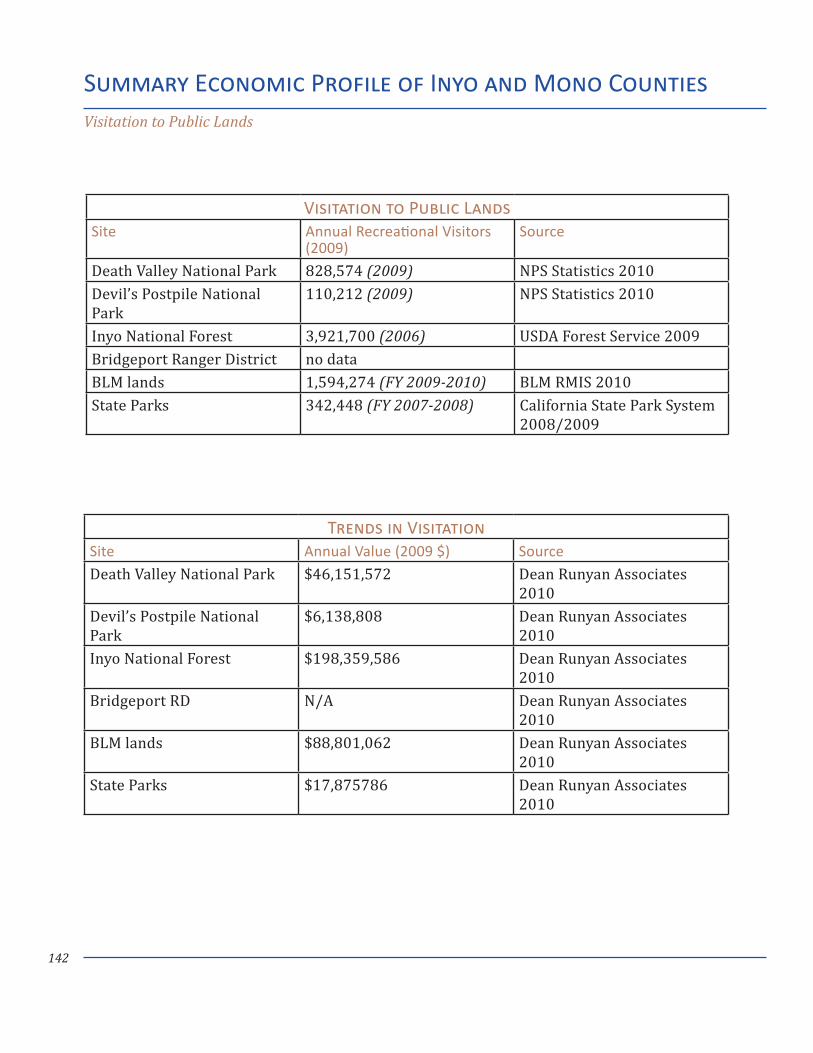
142
Summary Economic Profile of Inyo and Mono CountiesVisitation to Public Lands
Trends in VisitationSite Annual Value (2009 $) Source
Death Valley National Park $46,151,572 Dean Runyan Associates 2010
Devil’s Postpile National Park
$6,138,808 Dean Runyan Associates 2010
Inyo National Forest $198,359,586 Dean Runyan Associates 2010
Bridgeport RD N/A Dean Runyan Associates 2010
BLM lands $88,801,062 Dean Runyan Associates 2010
State Parks $17,875786 Dean Runyan Associates 2010
Visitation to Public LandsSite Annual Recreational Visitors
(2009)Source
Death Valley National Park 828,574 (2009) NPS Statistics 2010Devil’s Postpile National Park
110,212 (2009) NPS Statistics 2010
Inyo National Forest 3,921,700 (2006) USDA Forest Service 2009Bridgeport Ranger District no dataBLM lands 1,594,274 (FY 2009-2010) BLM RMIS 2010State Parks 342,448 (FY 2007-2008) California State Park System
2008/2009
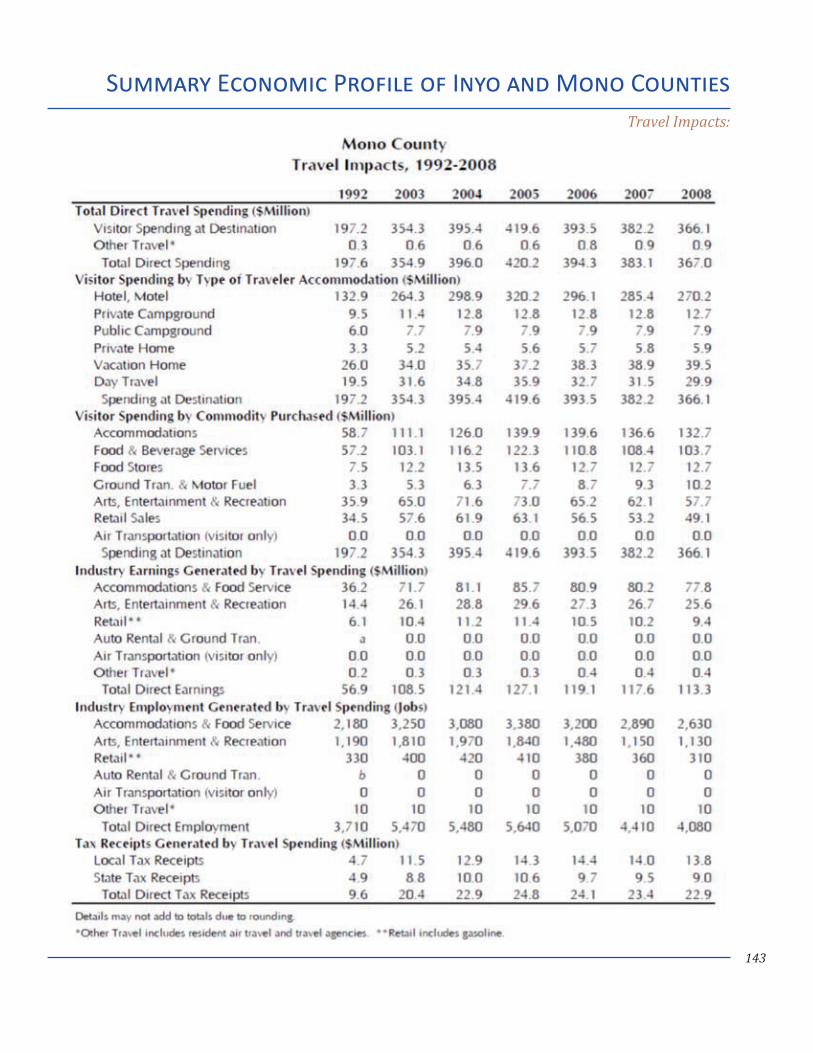
143
Summary Economic Profile of Inyo and Mono CountiesTravel Impacts:
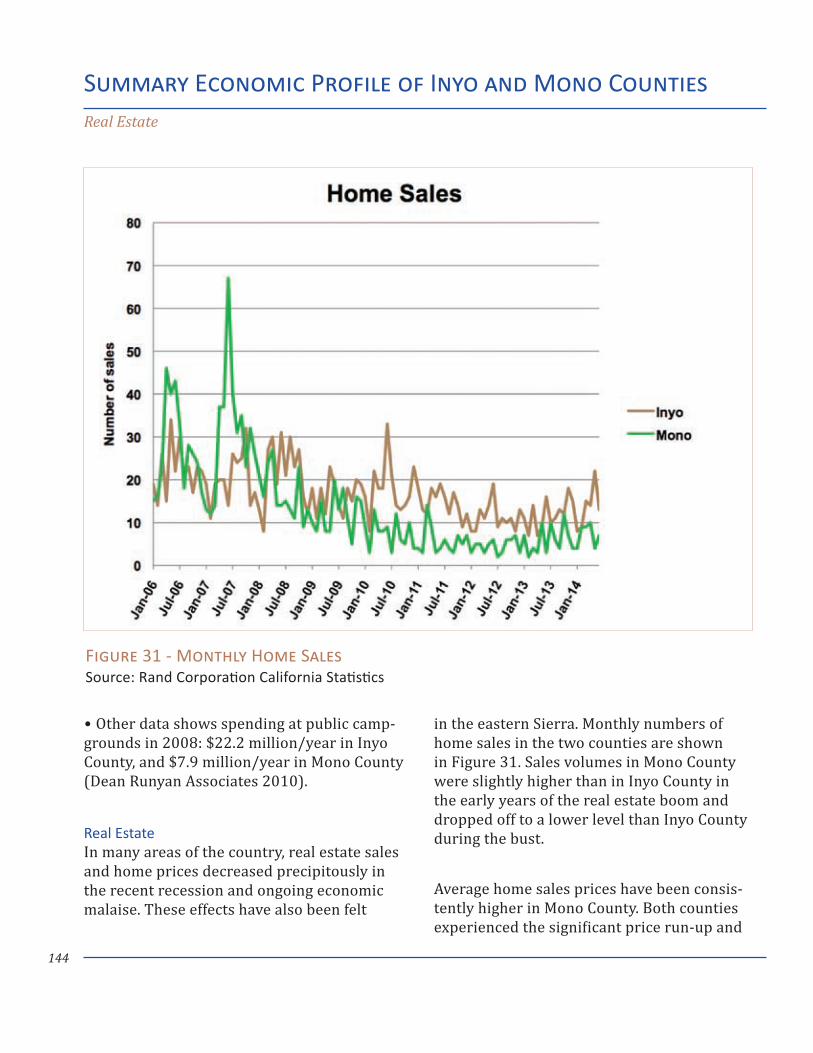
144
Other data shows spending at public camp- •grounds in 2008: $22.2 million/year in Inyo County, and $7.9 million/year in Mono County (Dean Runyan Associates 2010).
Real EstateIn many areas of the country, real estate sales and home prices decreased precipitously in the recent recession and ongoing economic malaise. These effects have also been felt
in the eastern Sierra. Monthly numbers of home sales in the two counties are shown in Figure 31. Sales volumes in Mono County were slightly higher than in Inyo County in the early years of the real estate boom and dropped off to a lower level than Inyo County during the bust.
Average home sales prices have been consis-tently higher in Mono County. Both counties experienced the significant price run-up and
Summary Economic Profile of Inyo and Mono CountiesReal Estate
Figure 31 - Monthly Home Sales Source: Rand Corporation California Statistics
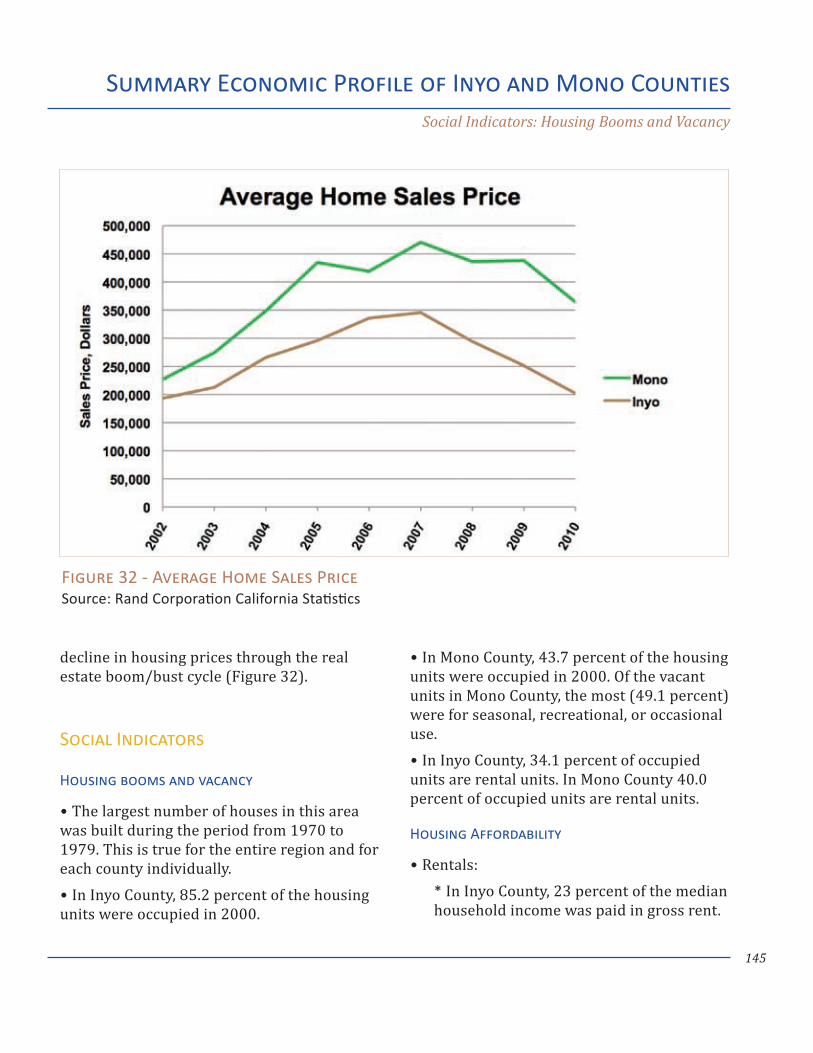
145
Summary Economic Profile of Inyo and Mono CountiesSocial Indicators: Housing Booms and Vacancy
decline in housing prices through the real estate boom/bust cycle (Figure 32).
Social Indicators
Housing booms and vacancy
The largest number of houses in this area •was built during the period from 1970 to 1979. This is true for the entire region and for each county individually.
In Inyo County, 85.2 percent of the housing •units were occupied in 2000.
In Mono County, 43.7 percent of the housing •units were occupied in 2000. Of the vacant units in Mono County, the most (49.1 percent) were for seasonal, recreational, or occasional use.
In Inyo County, 34.1 percent of occupied •units are rental units. In Mono County 40.0 percent of occupied units are rental units.
Housing Affordability
Rentals: •
In Inyo County, 23 percent of the median * household income was paid in gross rent.
Figure 32 - Average Home Sales Price Source: Rand Corporation California Statistics
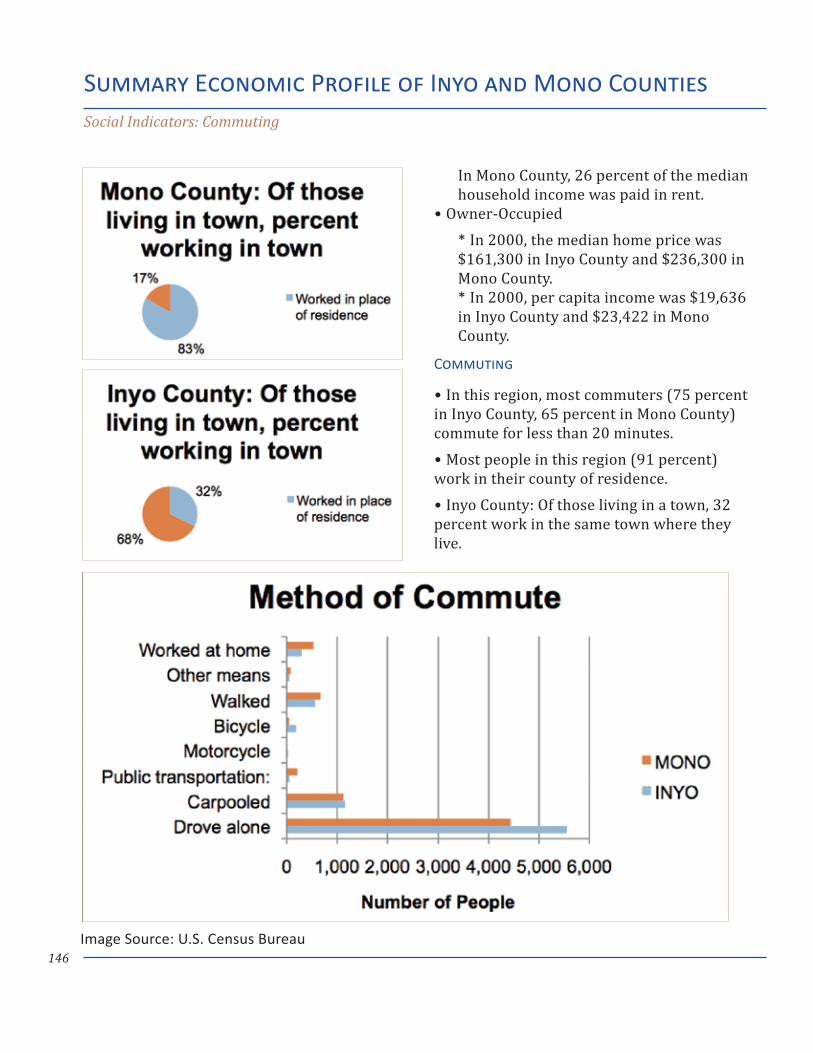
146
Summary Economic Profile of Inyo and Mono CountiesSocial Indicators: Commuting
In Mono County, 26 percent of the median household income was paid in rent.
Owner-Occupied •
In 2000, the median home price was * $161,300 in Inyo County and $236,300 in Mono County.
In 2000, per capita income was $19,636 * in Inyo County and $23,422 in Mono County.
Commuting
In this region, most commuters (75 percent •in Inyo County, 65 percent in Mono County) commute for less than 20 minutes.
Most people in this region (91 percent) •work in their county of residence.
Inyo County: Of those living in a town, 32 •percent work in the same town where they live.
Image Source: U.S. Census Bureau
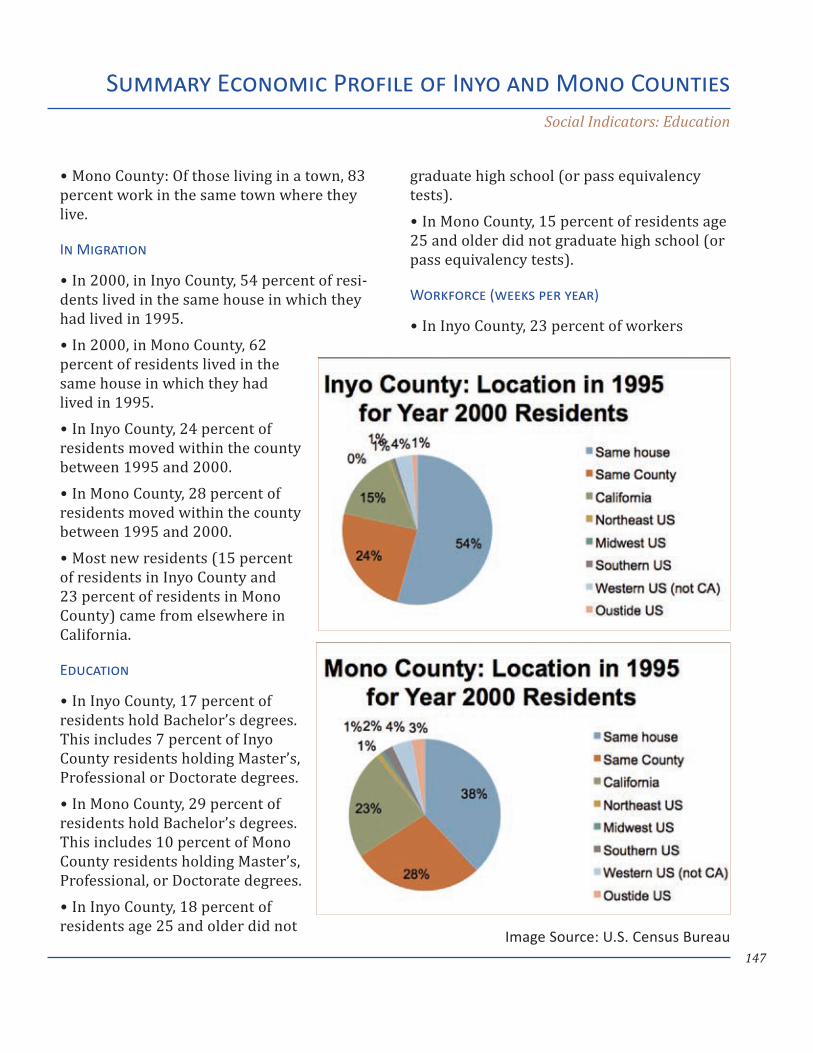
147
Summary Economic Profile of Inyo and Mono CountiesSocial Indicators: Education
Mono County: Of those living in a town, 83 •percent work in the same town where they live.
In Migration
In 2000, in Inyo County, 54 percent of resi- •dents lived in the same house in which they had lived in 1995.
In 2000, in Mono County, 62 •percent of residents lived in the same house in which they had lived in 1995.
In Inyo County, 24 percent of •residents moved within the county between 1995 and 2000.
In Mono County, 28 percent of •residents moved within the county between 1995 and 2000.
Most new residents (15 percent •of residents in Inyo County and 23 percent of residents in Mono County) came from elsewhere in California.
Education
In Inyo County, 17 percent of •residents hold Bachelor’s degrees. This includes 7 percent of Inyo County residents holding Master’s, Professional or Doctorate degrees.
In Mono County, 29 percent of •residents hold Bachelor’s degrees. This includes 10 percent of Mono County residents holding Master’s, Professional, or Doctorate degrees.
In Inyo County, 18 percent of •residents age 25 and older did not
graduate high school (or pass equivalency tests).
In Mono County, 15 percent of residents age •25 and older did not graduate high school (or pass equivalency tests).
Workforce (weeks per year)
In Inyo County, 23 percent of workers •
Image Source: U.S. Census Bureau
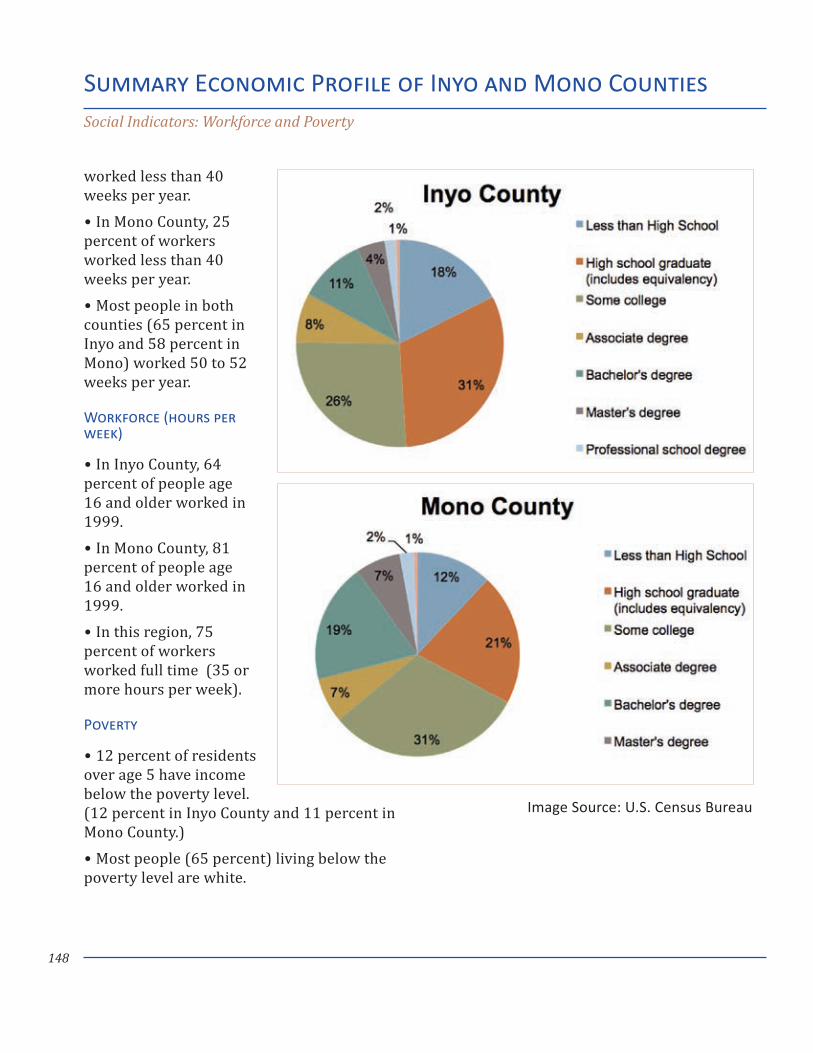
148
worked less than 40 weeks per year.
In Mono County, 25 •percent of workers worked less than 40 weeks per year.
Most people in both •counties (65 percent in Inyo and 58 percent in Mono) worked 50 to 52 weeks per year.
Workforce (hours per week)
In Inyo County, 64 •percent of people age 16 and older worked in 1999.
In Mono County, 81 •percent of people age 16 and older worked in 1999.
In this region, 75 •percent of workers worked full time (35 or more hours per week).
Poverty
12 percent of residents •over age 5 have income below the poverty level. (12 percent in Inyo County and 11 percent in Mono County.)
Most people (65 percent) living below the •poverty level are white.
Summary Economic Profile of Inyo and Mono CountiesSocial Indicators: Workforce and Poverty
Image Source: U.S. Census Bureau
Monitoring Progress and Evaluating
Results
150
As economic development proceeds in the Eastern Sierra, it will be important to monitor progress and evaluate results with respect to both the overall economy and specific targeted prosperity clusters. Using a set of indicators will greatly facilitate the monitor-ing and evaluation process. Creating a set of indicators to monitor and evaluate progress involves establishing indicator baselines to describe current conditions and then re-ex-amining the indicators on a periodic basis as economic development moves forward.
Tracking indicators of the overall economy in a region involves a significant time and re-source commitment to gather data, calculate indicator metrics and interpret the numbers. Fortunately for the Eastern Sierra region, an excellent indicator set to track environ-mental, economic and social well-being in the Sierra Nevada has been established by the Sierra Nevada Conservancy (SNC), who will also be updating these indicators on a regular basis in the future. These indicators are described in detail in the Sierra Nevada Conservancy 2012-2013 Action Plan and in the Demographic and Economy System Indicator Report, available on the Sierra Nevada Conservancy website at www.sier-ranevada.ca.gov Using the SNC Demographic and Economy System Indicator Report aug-mented with local data the eastern Sierra region will be able to evaluate overall eco-nomic progress and allow comparisons with other sections of the Sierra Nevada and the state of California as a whole
Evaluating progress in developing the five Prosperity Clusters will also require a set of
more specific indicators. Some useful metrics regarding the Prosperity Clusters already exist in the SNC indicator dataset and other, more targeted metrics will need to be devel-oped and tracked as the Prosperity Clusters expand and evolve. The following sections will examine indicators for each of the five Prosperity Clusters.
PROSPERITY CLUSTER: LEVERAGING INFORMATION TECHNOLOGY AND BROADBAND ACCESS
For this cluster, indicators providing informa-tion on access to broadband infrastructure are required, along with specific metrics regarding specific opportunities identified: online sales, use of broadband in providing professional services, and industry develop-ment (e.g. telemedicine).
The California Emerging Technology Fund (CETF) has initiated development of a set of metrics that will track on an annual basis the supply and demand aspects of broadband technology. These indicators will be very useful to track progress in the Eastern Sierra.
PROSPERITY CLUSTER: MEETING CALIFORNIA’S RENEWABLE ENERGY STANDARD
General renewable energy indicators are part of the Sierra Nevada Conservancy’s System Indicator reports. Tracking county-level renewable energy and large hydro capac-ity will provide general information on the
Monitoring Progress and Evaluating Results
151
magnitude and types of renewable energy produced by Inyo and Mono Counties. To request SNC’s System Indicator reports for Inyo or Mono County, visit http://www.sier-ranevada.ca.gov/.
In this cluster, the specific opportunities identified are workforce training and support services.
Metrics used to evaluate workforce training should include the number of high schools and community college campuses offering re-newable energy training, number of courses, number of students enrolled in the curricu-lum and completing it, and the number of students receiving certification in renewable energy technology.
Measuring progress in developing a renew-able energy support services industry in the region can be accomplished by counting the number of support services businesses estab-lished, total number of jobs in this sector, and personal and business income attributed to the sector.
PROSPERITY CLUSTER: FINDING THE NICHES IN TOURISM, HOSPITALITY AND THE ARTS
General tourism indicators are tracked in the Sierra Nevada Conservancy System Indicator reports. Amount of total direct travel spending by county is a useful metric for the Eastern Sierra counties. To request SNC’s System Indicator reports for Inyo or
Mono County, visit http://www.sierranevada.ca.gov/.
Additional indicators that should be tracked include county-level metrics on the break-down of spending by category. Tourism employment, earnings and tax receipts will provide more detailed information on this sector.
These are produced annually by Dean Runyan Associates under contract to the state of California and made available via the follow-ing website: http://industry.visitcalifornia.com/Research/California-Statistics-and-Trends/.
The identified opportunities in this cluster are: increased geotourism and agricultural tourism; improved customer service in the hospitality sector; and improved marketing of museums, cultural events and festivals.
Tracking increased geotourism, agricultural tourism and improved destination market-ing should be done through surveys of the Eastern Sierra businesses/parks/destina-tions shown on the Sierra Nevada Geotourism mapguide and the project supporters located within Inyo and Mono Counties (http://www.sierranevadageotourism.org/index.php).
Data on numbers of visitors, spending and activities will be useful to track progress for this identified cluster opportunity.
Monitoring Progress and Evaluating Results
152
Monitoring Progress and Evaluating Results
To gather information on customer service improvement in hospitality, comprehensive annual surveys should be conducted of visi-tors’ impressions of quality and consistency of customer service.
PROSPERITY CLUSTER: DIVERSIFYING RECREATION
This cluster is strongly related to Tourism, Hospitality and the Arts. As a result, the general tourism indicators previously de-scribed will allow evaluation of overall cluster progress.
Opportunities identified in this cluster are development of niche activities and improved access to information about recreation activi-ties in the region.
Evaluating the development of additional niche activities can be accomplished using in-dicators on the number of activities available to visitors, number of visitors participating in those activities, visitor spending on these activities, and number of local businesses/proprietors providing services in the various niche activities.
Measuring improved access to information about recreation activities should include data generated from surveys of visitors re-garding how they planned their visits to the area and data from websites maintained by area destinations and businesses serving rec-reation visitors.
PROSPERITY CLUSTER: ENCOURAGING WELLNESS THROUGH VALUE-ADDED AGRICULTURE
An extensive set of indicators on agriculture in the Eastern Sierra is generated for the Annual Crop Reports by the Inyo and Mono Counties’ Agricultural Commissioner’s Office: http://www.inyomonoagriculture.com/reports.html.
For this Prosperity Cluster, three opportuni-ties have been identified: locally branded foods; value-added agriculture and agricul-tural tourism.
Specific indicators for the locally branded foods opportunity should include number of farms and businesses producing locally branded foods, number of restaurants and stores selling these foods, magnitude of sales, types of products, numbers of out-of-region distributors, and level of statewide or nation-al recognition of these foods.
Value-added agriculture indicators can include total amount of added value, number of businesses involved in this sector and proportion of local agricultural production going into value-added products. Agricultural tourism indicators were discussed in the section on tourism. Additional indicators useful for measuring agricultural tourism include numbers of operations, number of agricultural visitors, types of agricultural tourism activities available to visitors, and number of annual farm tours.

Funding Opportunities
154
Funding Opportunities from State and Federal Agencies
U.S. Economic Development Administration (EDA)
The EDA was established under the Public Works and Economic Development Act of 1965 (42 U.S.C. § 3121), as amended, to generate jobs, help retain existing jobs, and stimulate industrial and commercial growth in economically distressed areas of the United States.
EDA assistance is available to rural and urban areas of the nation experiencing high unem-ployment, low income, or other severe eco-nomic distress. In fulfilling its mission, EDA is guided by the basic principle that distressed communities must be empowered to develop and implement their own economic develop-ment and revitalization strategies.
Based on these locally and regionally devel-oped priorities, EDA works in partnership with state and local governments, regional economic development districts, public and private nonprofit organizations, and Indian tribes. EDA helps distressed communities address problems associated with long-term economic distress, as well as sudden and severe economic dislocations including recov-ering from the economic impacts of natural disasters, the closure of military installa-tions and other federal facilities, changing trade patterns, and the depletion of natural resources.
Programs
Public Works and Economic •Development Supports construction, expansion, or upgrade of essential public infrastructure and facilities.
Economic Adjustment Assistance (EAA) •Provides a wide range of technical, planning, and public works and infrastructure assis-tance in regions experiencing adverse eco-nomic changes that may occur suddenly or over time (e.g., strategy development, infra-structure construction, revolving loan fund capitalization).
Planning • Assists local and regional organizations (District organizations, Tribal agencies, and other eligible entities) with short- and long-term planning efforts.
Technical Assistance •Focused assistance provided to public and nonprofit leaders to help in economic devel-opment decision making (e.g., project plan-ning, impact analyses, feasibility studies); also includes the University Center Economic Development Program, which makes the re-sources of universities available to the eco-nomic development community.
Contacts
California (Northern and Coastal) David Martin Seattle Regional Office 915 Second Avenue, Room 1890 Seattle, WA 98174 T: (206) 220-7699 E: [email protected]
Funding OpportunitiesState and Federal Funding Opportunities
155
Funding OpportunitiesState and Federal Funding Opportunities
California (Southern and Central) Wilfred Marshall 5777 West Century Boulevard, Suite 1675 Los Angeles, CA 90045 T: (310) 348-5386 E: [email protected]
Agency Website http://www.eda.gov
U.S. Department of Agriculture, Rural Development (USDA RD)
USDA Rural Development financial programs support essential public facilities and servic-es: water and sewer systems, housing, health clinics, emergency service facilities, electric and telephone service. It supports loans to businesses through banks, credit unions, and community-managed lending pools and offers technical assistance and information to help agricultural producers and coopera-tives launch and improve the effectiveness of operations, and provides technical assistance for community empowerment programs. USDA RD has a $155 billion portfolio of loans and will administer $20 billion in loans, loan guarantees, and grants through programs in the current fiscal year. It achieves its mission by helping rural individuals, communities and businesses obtain the financial and techni-cal assistance needed to address diverse and unique needs.
Programs
Business Loans and Grants • The Business Program (BP) works in
partnership with the private sector and community-based organizations to provide financial assistance and business plan-ning. BP helps fund projects that create or preserve quality jobs and/or promote a clean rural environment. Financial resources of BP are often leveraged with those of other public and private lenders to meet busi-ness and credit needs in underserved areas. Recipients of these programs may include individuals, corporations, partnerships, cooperatives, public bodies, nonprofit corpo-rations, Indian tribes, and private companies.
Telecommunications Loans and Grants • USDA Rural Development continues to provide many programs for financing rural America’s telecommunications infra-structure. The Traditional Telephone Loan program consists of hardship, cost of money, and guaranteed loans that finance voice telephone service. The Broadband Access Loan program provides loans for funding the costs of construction, improvement, and acquisition of facilities to provide broad-band service to eligible rural communities. The Distance Learning and Telemedicine program continues its charge of bringing electronic educational resources to rural schools and improving health care delivery in rural America. Lastly, the Community Connect Grant program provides finan-cial assistance to eligible applicants that will provide currently unserved areas with broadband service that fosters economic growth and public safety services.
Community and Economic Development • Programs The CEDP administers programs and
156
initiatives that promote self-sustaining, long-term economic and regional development in rural areas. The programs demonstrate how rural communities can achieve self-sufficiency through innovative and compre-hensive strategic plans developed and imple-mented at a grassroots level. The programs stress continued local involvement and decision making supported by partnerships among private, public and nonprofit entities.
Contacts
Area 2 (includes Mono County) Sue Ladner, Acting Area Director (916) 799-5143
Auburn Office 251 Auburn Ravine Rd, Ste. 107 Auburn, CA Phone: (530) 885-7081 x4 Fax: (530) 823-5504
Elk Grove Office 9701 Dino Drive, Ste. 170 Elk Grove, CA Phone: (916) 714-1104 x4 Fax: (916) 714-1118
Area 3 (includes Inyo County) Richard Brassfield, Area Director (559) 276-7494 x 137
Fresno Office 4625 W Jennifer St, Ste. 126 Fresno, CA Phone: (559) 276-7494 x4 Fax: (559) 276-1791
Merced Office 2135 Wardrobe Ave., Ste. A Merced, CA Phone: (209) 722-4119 x4 Fax: (209) 725-2964
Modesto Office 3800 Cornucopia Way, Ste. E Modesto, CA Phone: (209) 491-9320 x4 Fax: (209) 491-9331
California Department of Housing and Community Development
Provides leadership, policies and programs to preserve and expand safe and affordable housing opportunities and promote strong communities for all Californians.
Programs
Community Development Block Grant Program
The purpose of the program is to create or retain jobs for low-income workers in rural communities. Grants are available of up to $2.5 million for eligible cities and counties to lend to identified businesses, or use for infrastructure improvements necessary to ac-commodate the creation, expansion, or reten-tion of identified businesses. Assistance may include loans or loan guarantees to business-es for construction, on-site improvements, equipment purchase, working capital, and site acquisition. It may also include loans for business start-ups, grants for publicly owned
Funding OpportunitiesState and Federal Funding Opportunities
157
infrastructure, and loan or grants for small business incubators.
Eligible applicants include counties with fewer than 200,000 residents in unincor-porated areas and cities with fewer than 50,000 residents that are not participants in the U.S. Department of Housing and Urban Development (HUD) Community Development Block Grant (CDBG) entitle-ment program. Applications are invited by an annual Notice of Funding Availability (NOFA). Applications are continuously received and reviewed throughout the year. Awards are made on an ongoing basis, normally within 60 days of HCD receipt of a completed application.
Contacts
Mono and Inyo Counties John Almanza, Program Rep (916) 323-1450 [email protected]
Funding Opportunities from State Agencies
Governor’s Office of Economic Development
Programs
Economic Adjustment Assistance (EAA) Provides a wide range of technical, plan-ning, and public works and infrastructure assistance in regions experiencing adverse economic changes that may occur suddenly or over time (e.g., strategy development,
infrastructure construction, revolving loan fund capitalization).
Planning • Assists local and regional organizations (District organizations, Tribal agencies, and other eligible entities) with their short-and long-term planning efforts.
Technical Assistance •Focused assistance provided to public and nonprofit leaders to help in economic devel-opment decision making (e.g., project plan-ning, impact analyses, feasibility studies); also includes the University Center Economic Development Program, which makes the re-sources of universities available to the eco-nomic development community.
Contacts
California (Northern and Coastal) David Martin Seattle Regional Office 915 Second Avenue, Room 1890 Seattle, WA 98174 T: (206) 220-7699 E: [email protected]
California (Southern and Central) Wilfred Marshall 5777 West Century Boulevard, Suite 1675 Los Angeles, CA 90045 T: (310) 348-5386 E: [email protected]
Agency Website: http://www.eda.gov/
Funding OpportunitiesState Funding Opportunities
158
Business Loans and Grants
The Business Program (BP) works in part-nership with the private sector and commu-nity-based organizations to provide financial assistance and business planning.
BP helps fund projects that create or preserve quality jobs and/or promote a clean rural en-vironment. The financial resources of BP are often leveraged with those of other public and private credit source lenders to meet business and credit needs in underserved areas.
Recipients of these programs may include in-dividuals, corporations, partnerships, cooper-atives, public bodies, nonprofit corporations, Indian tribes, and private companies.
Telecommunications Loans and Grants
USDA Rural Development continues to provide many programs for financing rural America’s telecommunications infrastructure.
The Traditional Telephone Loan program consists of hardship, cost of money, and guaranteed loans that finance voice telephone service.
The Broadband Access Loan program pro-vides loans for funding the costs of construc-tion, improvement, and acquisition of facili-ties to provide broadband service to eligible rural communities.
The Distance Learning and Telemedicine program continues its charge of bringing
electronic educational resources to rural schools and improving health care delivery in rural America.
Lastly, the Community Connect Grant program provides financial assistance to eligible applicants that will provide currently unserved areas with broadband service that fosters economic growth and public safety services.
Community and Economic Development Programs
The CEDP administers programs and initia-tive that promote self-sustaining, long-term economic and regional development in rural areas.
The programs demonstrate how every rural community can achieve self-sufficiency through innovative and comprehensive stra-tegic plans developed and implemented at a grassroots level.
The programs stress continued local involve-ment and decision making which is supported by partnerships among private, public and nonprofit entities.
Contacts
Area 2 (includes Mono County) Sue Ladner, Acting Area Director (916) 799-5143
Funding OpportunitiesState Funding Opportunities
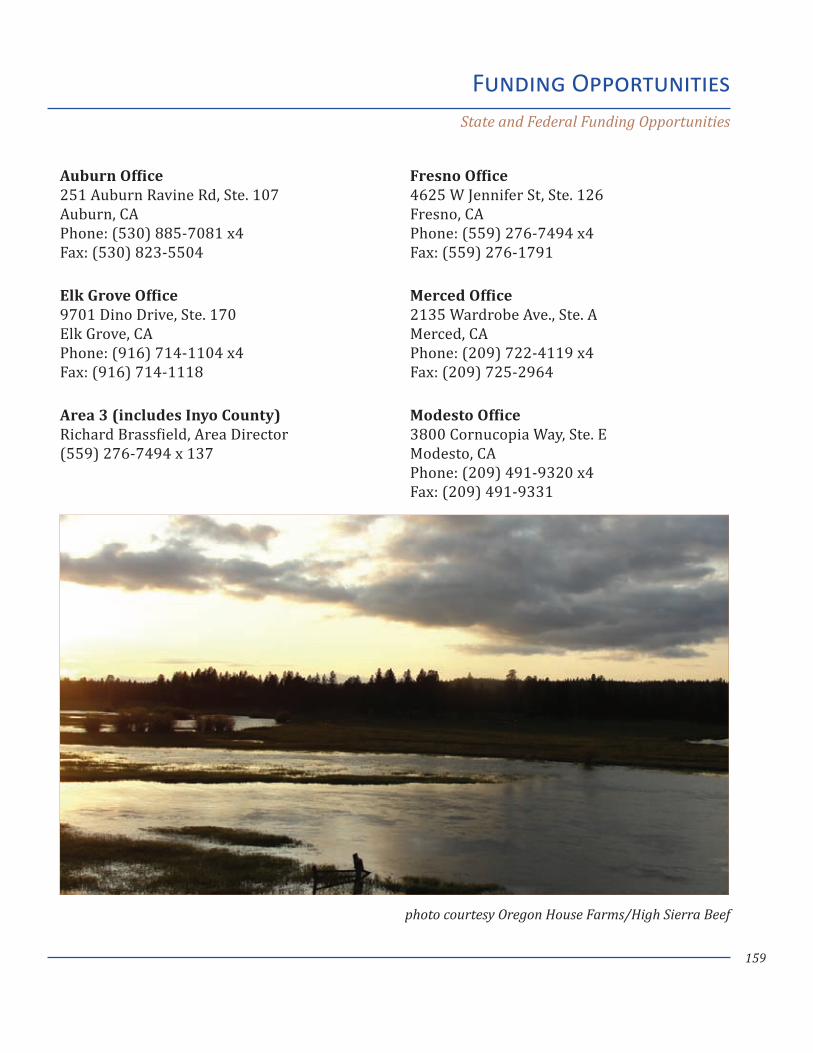
159
Auburn Office 251 Auburn Ravine Rd, Ste. 107 Auburn, CA Phone: (530) 885-7081 x4 Fax: (530) 823-5504
Elk Grove Office 9701 Dino Drive, Ste. 170 Elk Grove, CA Phone: (916) 714-1104 x4 Fax: (916) 714-1118
Area 3 (includes Inyo County) Richard Brassfield, Area Director (559) 276-7494 x 137
Fresno Office 4625 W Jennifer St, Ste. 126 Fresno, CA Phone: (559) 276-7494 x4 Fax: (559) 276-1791
Merced Office 2135 Wardrobe Ave., Ste. A Merced, CA Phone: (209) 722-4119 x4 Fax: (209) 725-2964
Modesto Office 3800 Cornucopia Way, Ste. E Modesto, CA Phone: (209) 491-9320 x4 Fax: (209) 491-9331
Funding OpportunitiesState and Federal Funding Opportunities
photo courtesy Oregon House Farms/High Sierra Beef

[This page intentionally left blank]

Supporting Documentation
162
Supporting Documentation
Introduction
Cassel E.J., Graham S.A., Chamberlain C.P., (2009). Cenozoic tectonic and topographic evolution of the northern Sierra Nevada, California, through stable isotope paleoaltimetry in volcanic glass. Geology, 37: 547– 550.
http://factfinder2.census.gov retrieved 5/1/2012
http://quickfacts.census.gov retrieved 5/1/2012
http://www.inyocounty.us retrieved 5/1/2012
http://www.monocounty.ca.gov retrieved 5/1/2012
http://www.nature.nps.gov/geology/usgsnps/deva/devatime.html retrieved 5/1/2012
James Irvine Foundation, The, (2006). Critical Issues Facing the Arts in California: A Working Paper from the James Irvine Foundation. Retrieved from http://www.thegilbertfoundation.org/websiteresources/critical.pdf
Johnson, J. D. and R. Rasker (1995). “The Role of Economic and Quality of Life Values in Rural Busi-ness Location.” Journal of Rural Studies 11(4): 405-416.
McGranahan, D. A. (1999). Natural Amenities Drive Population Change, Food and Rural Economics Division, Economic Research Service, U.S. Department of Agriculture: 1(24).
Mulch A., Graham S.A., Chamberlain C.P., 2006, Hydrogen isotopes in Eocene river gravels and pa-leoelevation of the Sierra Nevada: Science 313: 87– 89.
Porter, Michael. “Clusters and the new Economies of Competition” Harvard Business Review Novem-ber-December 1998.
Rilla, E., Hardesty, S.D., Getz, C., & George, H. (2011) California agritourism operations and their economic potential are growing. California Agriculture, 65(2). Retrieved from http://cali-forniaagriculture.ucanr.org
Supporting Documentation
163
Salyards and Shoemaker. Landslide and Debris Flow Deposits in Miocene Horse Spring Formation, Ne-vada: A Measure of Basin and Range Extension. GSA Centennial Field Guide, 1987
Shumway, J. M. and S. M. Otterstrom (2001). Spatial patterns of migration and income change in the mountain west: the dominance of service-based, amenity-rich counties. Professional Ge-ographer 53(4): 492-502.
Small E.E., Anderson R.S., 1995, Geomorphically driven late Cenozoic rock uplift in the Sierra Nevada, California. Science, 270:. 277– 280. doi: 10.1126/science.270.5234.277.
Unruh J.R., (1991). The uplift of the Sierra Nevada and implications for late Cenozoic epeirogeny in the western Cordillera. Geological Society of America Bulletin, 103: 1395– 1404. doi: 10.1130/0016-7606(1991)103<1395:TUOTSN>2.3.CO;2.
Wakabayashi J., Sawyer T.L., 2001, Stream incision, tectonics, uplift, and evolution of topography of the Sierra Nevada, California. The Journal of Geology, 109: 539– 562. doi: 10.1086/321962.
Industry Cluster Concept Overview
Cooke, P., & Morgan, K., (1998). The Associational Economy: Firms, Regions and Innovation. Oxford University Press, 1998.
Porter, Michael. “Clusters and the New Economies of Competition” Harvard Business Review Novem-ber-December 1998.
Porter, Michael (2000). Location, Competition, and Economic Development: Local Clusters in a Global Economy. Economic Development Quarterly, 14(1): 15-34.
Regional Technology Strategies, Inc. (2009). Generating Local Wealth, Opportunity, and Sustainability through Rural Clusters, March 2009. Retrieved from http://www.isc.hbs.edu/pdf/Region-al_Technology_Strategies_200906.pdf
Applying Clusters to Rural Economies
Brookings Institution, The, (2006). Making Sense of Clusters: Regional Competitiveness and Economic Development.
Supporting Documentation
164
Feser, E., & Isserman, A. M., (2007). The Rural Role in National Value Chains and Regional Clusters. Retrieved from http://reap.ace.illinois.edu/Papers.htm
Gibbs, R. M. & Bernat, G. A. (1998). Rural Industry Clusters Raise Local Earnings. Rural Develop-ment Perspectives, 12(3): 18-25.
Mishkovsky, N., Dalbey, M., Bertaina, S., Read, A., & McGalliard, T. (2010). Putting smart growth to work in rural communities. Smart Growth Network.
Munnich, Schrock and Cook. Rural Knowledge Clusters: The Challenge of Rural Economic Prosperity. Hubert H. Humphrey Institute of Public Affairs, University of Minnesota August 2002.
Porter, Michael. “Clusters and the New Economies of Competition” Harvard Business Review Novem-ber-December 1998.
Regional Technology Strategies, Inc. (2009). Generating Local Wealth, Opportunity, and Sustainability through Rural Clusters, March 2009. Retrieved from http://www.isc.hbs.edu/pdf/Region-al_Technology_Strategies_200906.pdf
Rosenfeld, S. (2002). Creating Smart Systems: A guide to cluster strategies in less-favoured regions. European Union Innovation Strategies, April 2002. Retrieved from http://ec.europa.eu/regional_policy/archive/innovation/pdf/guide_rosenfeld_final.pdf
Rosenfeld, S. (2009). Generating Local Wealth, Opportunity and Sustainability through Rural Clusters. Retrieved from http://rtsinc.org/publications/documents/RuralClusters09
The California Context
California Stewardship Network, (2010). Thriving Regions Lead to a Thriving State: A Shared Agenda for Action. Retrieved from http://www.castewardship.org/Artwork/ThrivingRegion-sThrivingState.pdf
http://www.caeconomy.org
Newsom, G., (2011). An Economic Growth and Competitiveness Agenda for California. Retrieved from http://ltg.ca.gov/docs/LGN_Econ_Agenda.pdf
Nicolas Berggruen Institute, (2011). A Blueprint to Renew California: Report and recommendations pre-sented by the Think Long Committee for California. Retrieved from http://berggruen.org
Supporting Documentation
165
Prosperity Clusters Leveraging Internet Technology and Broadband Access
Advance Human Technologies, (2005). The Seven Megatrends of Professional Services: The forces that are transforming professional services industries and how to respond. Retrieved from http://rossdawsonblog.com/weblog/archives/2006/02/the_seven_megat.html
Atkinson, R.D., Castro, D. & Ezell, S.J., (2009). The digital road to recovery: a stimulus plan to create jobs, boost productivity and revitalize America. The Information Technology & Innova-tion Foundation, (January 2009). Retrieved from http:// www.itif.org/files/roadtorecov-ery.pdf
Bureau of Labor Statistics, U.S. Department of Labor, Career Guide to Industries, 2010-2011 Edition, Telecommunications. Retrieved from http://www.bls.gov/oco/cg/cgs020.htm
Foundation for Rural Service, (2008). Rural Economic Development: Building a Sustainable Commu-nity. Rural Telecom Educational Series. Retrieved from http://www.frs.org/education/rural-telecom-educational-series
http://www.clearcapital.com
Insight Research Corporation, The, (2012). The 2012 Telecommunications Industry Review: An Anthol-ogy of Market Facts and Forecasts 2011-2016. Retrieved from http://insight-corp.com/reports/review12.asp
Iowa Department of Economic Development, (2007). Existing Business Initiative (EBI) Toolkit: An Economic Development Resource for Iowa Communities. Retrieved from http://iowaeco-nomicdevelopment.com.
Public Policy Institute of California (2010). Does Broadband Boost Local Economic Development? Re-trieved from http://www.ppic.org
RUPRI (Rural Policy Research Institute), (2008). RUPRI Policy brief: Rural broadband. Retrieved from http://www.rupri.org
Russo, H., (2001). Window of opportunity for home care nurses: Telehealth technologies. Online Jour-nal of Issues in Nursing, (September 30, 2001). Retrieved from http://www.nursingworld.org/mainmenucategories/anamarketplace/anaperiodicals/OJIN/TableofContents/Vol-ume62001/No3Sept01/TelehealthTechnologies.html
Sikich Certified Public Accountants & Advisors, (2011). Report: Professional Services Industry Trends. Retrieved from http://www.sikich.com/industries/professional-services/professional-ser-vices-trends.html
Supporting Documentation
166
Supporting Documentation
Prosperity Clusters Meeting California’s Renewable Energy Standard
Deakin, E., (2008). California futures: Accommodating growth in an era of climate change and rising fuel prices. Access, 32(Spring 2008). Retrieved from http://metrostudies.berkeley.edu/pubs.html
National Energy Technology Laboratory, (2009). An Investigation into California’s Residential Electric-ity Consumption. U.S. Department of Energy, 1371. Retrieved from http://www.netl.doe.gov/energy-analyses/pubs/CA_US_elec_consumption_FINAL_July-29-2009.pdf
Office of the Governor, State of California, (2010). California’s Clean Energy Future: An overview on meeting California’s energy and environmental goals in the electric power sector in 2020 and beyond. Retrieved from http://www.cpuc.ca.gov/NR/rdonlyres/ED820DFE-46A3-40-A8-8E84-F728BC94DCA5/0/CleanEnergyFuture092110.pdf
University of Wisconsin Center for Cooperatives, (2010). Rural telephone cooperatives overview. Re-search on the Economic Impact of Cooperatives. Retrieved from http://reic.uwcc.wisc.edu/telephone
Prosperity Clusters Finding Niches in Tourism, Hospitality and the Arts
Kim, N., Wicks, B.E., (2010). Rethinking tourism cluster development model for global competitive-ness. International CHRIE Conference-Refereed Track, Paper 28. Retrieved from http://scholarworks.umass.edu/refereed/CHRIE_2010/Friday/28
http://www.sierranevadageotourism.org
Prosperity Clusters Diversifying Recreation
Wyman, O., (2009). Ontario Way-finding Research Study. Retrieved from http://www.mtc.gov.on.ca/en/publications/Ontario_Way_Finding.pdf
167
Courier News, (2008). Wayfinding: New Directions for NJ Signage. Courier News January 6, 2008. Retrieved from http://www.successcomgroup.com/images/press_kits/njcoc/1-6-08%20Sunday%20Courier%20News.pdf
http://tahoemountainsports.com
Prosperity Clusters Encouraging Wellness through Value Added Agriculture
Rilla, E., Hardesty, S.D., Getz, C., & George, H. (2011) California agritourism operations and their economic potential are growing. California Agriculture, 65(2). Retrieved from http://cali-forniaagriculture.ucanr.org
Low, S.A., & Vogel, S. (2011). Direct and intermediated marketing of local foods in the United States. United States Department of Agriculture Economic Research Service Economic Research Report, 2011(128). Retrieved from http://www.ers.usda.gov
http://www.highsierrabeef.com
Committee Commentary Prosperity Clusters and Mining
http://articles.latimes.com/2011/sep/20/nation/la-na-nevada-gold-20110921
Summary Economic Profile of Inyo and Mono Counties
Beyers, W. B., D. P. Lindahl, et al. (1995). Lone Eagles and Other High Fliers in the Rural Producer Ser-vices. Pacific Northwest Regional Economic Conference. Missoula, Montana.
Dean Runyan Associates, (April, 2011). California Travel Impacts by County, 1992-2009, 2010 Prelimi-nary State & Regional Estimates. Retrieved from http://www.visitcalifornia.com
Johnson, J. D. and R. Rasker (1995). The Role of Economic and Quality of Life Values in Rural Busi-ness Location. Journal of Rural Studies 11(4): 405-416.
McGranahan, D. A. (1999). Natural Amenities Drive Population Change, Food and Rural Economics Division, Economic Research Service, U.S. Department of Agriculture: 1-24.
Supporting Documentation
168
Rasker, R., B. Alexander, et al. (2004). Public Lands Conservation and Economic Well-Being, Sonoran Institute: 160.
Shumway, J. M. and S. M. Otterstrom (2001). Spatial patterns of migration and income change in the mountain west: the dominance of service-based, amenity-rich counties. Professional Ge-ographer 53(4): 492-502.
Whitelaw, E. (1992). Oregon’s real economy. Old Oregon. Winter: 31-33.
Supporting Documentation

Tables, Figures and Images
170
Tables, Figures and Images
Spring IrrigationPhoto by Vickie Taton 4
Conway SummitPhoto by Vickie Taton 6
Bridgeport Ranch Barns and TerracePhoto by Vickie Taton 10
Big Pine ParadePhoto by Vickie Taton 12
Alabama Hills Photo by Vickie Taton 16
Wedding Laws Railroad Museum Photo by Vickie Taton 18
Inyo Independence Market Photo courtesy Design Workshop 21
Spring Irrigation II Photo by Vickie Taton 23
Benton Hot Springs Photo by Vickie Taton 25
Eastern Sierra Economic Assessment Region Map Prepared by Sierra Business Council 27
Camping at the Bishop Mule Days Celebration Photo by Vickie Taton 28
Bishop Mural Photo by Vickie Taton 31
Lone Pine Film Photo by Vickie Taton 34
Bridgeport Courthouse Photo by Vickie Taton 39
Grass Fed and Happy Photo courtesy Oregon House Farms/High Sierra Beef 48
171
Tables, Figures and Images
Wireline Broadband Availability - Inyo County Image courtesy California Emerging Technologies Fund 52
Wireline Broadband Availability - Mono County Image courtesy California Emerging Technologies Fund 55
Coso Geothermal Pools, I Photo by Vickie Taton 63
Coso Geothermal Pools, II Photo by Vickie Taton 65
Coso Geothermal Power Photo by Vickie Taton 75
Students from Fowler Elementary touch a new solar panel in Fowler. Photo by Anthony A. Mestas — The Pueblo Chieftain 76
Earth Day at the Village at Mammoth Photo by Vickie Taton 77
Winnedumah Hotel, Independence Photo by Vickie Taton 78
Sage to Summit Mural, Bishop Photo by Vickie Taton 79
Manzanar Photo by Vickie Taton 84
H8SGPZ Photo by Anne Grogan 87
Kayaks at Mono Lake Photo by Vickie Taton 88
Mammoth Mountain Action Photo courtesy Mammoth Mountain 90
Mammoth Mountain Bike Park Photo courtesy Mammoth Mountain 93
“We’re goin’ in...” Photo by Anne Grogan 95
172
Ladies Night at Tahoe Mountain Sports Photo courtesy Tahoe Mountain Sports 98
On location: Tahoe Mountain Sports Retail Photo courtesy Tahoe Mountain Sports 98
Backpack demo day on the Tahoe Rim Trail Photo courtesy Tahoe Mountain Sports 99
Apple Hill Orchard Photo by Vickie Taton 100
Sierra Bounty Food Collective Photo by Vickie Taton 102
Show Me the Way to Good, Healthy Food Photo courtesy Oregon House Farms/High Sierra Beef 103
Outdoor education at Oregon House Farms Photo courtesy Oregon House Farms/High Sierra Beef 104
Mount Whitney Sunrise Photo by Vickie Taton 107
Olancha Cattle Grazing, Inyo County Photo courtesy Design Workshop 110
Bridgeport Motel Photo by Vickie Taton 111
Figure 1: Employment, Western U.S., 1970-2009
Source: Bureau of Economic Analysis, U.S. Dept. of Commerce 112
Figure 2: Construction Employment, Western U.S. and California, 1990-2010
Source: Bureau of Economic Analysis, U.S. Dept. of Commerce 113
Table 1Personal Income, Western U.S., 1990 and 2000
Source: Bureau of Economic Analysis, U.S. Dept. of Commerce 114
Figure 3:Income Sources, Western U.S., 1970-2005
Source: Bureau of Economic Analysis, U.S. Dept. of Commerce 116
Tables, Figures and Images
173
Figure 4:Eastern Sierra Economic Assessment Region Map
Prepared by Sierra Business Council 117
Figure 5:Population, Inyo and Mono Counties, 1970-2009
Source: U.S. Census Bureau 118
Figure 6(a):Age Distribution, Inyo County, 2000
Source: U.S. Census Bureau 119
Figure 6(b):Age Distribution, Mono County, 2000
Source: U.S. Census Bureau 120
Figure 7: Income Sources, Combined Inyo and Mono Counties, 1970-2008
Source: Bureau of Economic Analysis, U.S. Dept. of Commerce 121
Figure 8:Inyo County Income Sources, 1970-2008
Source: Bureau of Economic Analysis, U.S. Dept. of Commerce 122
Figure 9:Mono County Income Sources, 1970-2008
Source: Bureau of Economic Analysis, U.S. Dept. of Commerce 123
Figure 10:Per Capita Personal Income, 1970-2009
Source: Bureau of Economic Analysis, U.S. Dept. of Commerce 124
Figure 11:Total Agricultural Production Value, 1975-2009
Source: Inyo and Mono Counties Agricultural Department 124
Figure 12:Net Total Farm Income, 1975-2009
Source: Bureau of Economic Analysis, U.S. Dept. of Commerce 125
Figure 13:Household Income Distribution, Inyo County, 2000
Source: U.S. Census Bureau 126
Tables, Figures and Images
174
Tables, Figures and Images
Figure 14:Household Income Distribution, Mono County, 2000
Source: U.S. Census Bureau 127
Figure 15:Job Growth Index, 1970-2008
Source: Bureau of Economic Analysis, U.S. Dept. of Commerce 128
Figure 16:Average Earnings per Job, Inyo and Mono Counties
Source: Bureau of Economic Analysis, U.S. Dept. of Commerce 129
Figure 17:2006 Wages and Employment, Inyo County
Source: Bureau of Economic Analysis, U.S. Dept. of Commerce 130
Figure 18:2006 Wages and Employment, Mono County
Source: Bureau of Economic Analysis, U.S. Dept. of Commerce 130
Figure 19:2009 Location Quotients, Inyo, Mono, California
Source: U.S. Bureau of Labor Statistics 131
Figure 20:Types of Employment, Inyo and Mono Counties Combined
Source: Bureau of Economic Analysis, U.S. Dept. of Commerce 132
Figure 21:Growth in Proprietorships, Inyo and Mono Counties
Source: Bureau of Economic Analysis, U.S. Dept. of Commerce 133
Figure 22:Income Breakdown, Proprietors and Wage/Salary Workers
Source: Bureau of Economic Analysis, U.S. Dept. of Commerce 134
Figure 23:Average Incomes for Proprietors and Wage/Salary Workers
Source: Bureau of Economic Analysis, U.S. Dept. of Commerce 135
Figure 24:Unemployment Rate, Inyo and Mono Counties
Source: Bureau of Labor Statistics 136
Figure 25:Unemployment Seasonality, Inyo County
Source: Bureau of Labor Statistics 137
175
Tables, Figures and Images
Figure 26:Unemployment Seasonality, Mono County
Source: Bureau of Labor Statistics 137
Figure 27:Total Direct Travel Spending
Source: Dean Runyan Associates 138
Figure 28:Visitor Spending Breakdown
Source: Dean Runyan Associates 139
Figure 29:Total Direct Tourism Employment
Source: Dean Runyan Associates 139
Figure 30:Local Tourism Tax Receipts
Source: Dean Runyan Associates 140
Inyo County Travel Impacts, 1992-2008Source: Dean Runyan Associates 141
Visitation to Public LandsSources: National Park Service Statistics 2010; USDA Forest Service 2009; BLM RMIS 2010; California State Park System 2008/2009 142
Trends in VisitationSource: Dean Runyan Associates, 2010 142
Mono County Travel Impacts, 1992-2008Source: Dean Runyan Associates 143
Figure 31:Monthly Home Sales
Source: U.S. Census Bureau 144
Figure 32:Average Home Sales Price
Source: U.S. Census Bureau 145
Family farm pond restoration funded by CFIP grant Photo courtesy Oregon House Farms/High Sierra Beef 159