Embed Size (px)
Citation preview
Page 1 of 12
Submitted by: Nadine Shiroma, Kirkland, WA August 15, 2011
EASTSIDE COMMUNITY OF INTEREST
NEEDS
REPRESENTATION
TO: Washington State Redistricting Commissioners
My family has resided in the State of Washington since April, 1990. 2 of our children graduated from Lake Washington High School in Kirkland and 1 from
Interlake High School in Bellevue. All three attended the University of Washington.
According to the economic forecasts released shortly after we moved to Washington, Bellevue was expected to evolve from a suburban city to the business hub of the Eastside. That forecast is now a reality and has been accompanied by
the tremendous growth of Microsoft and other high tech development and support services in South Redmond. With this growth has come new roads, highway
improvement, homes, commercial buildings, business centers, schools, social services, and city services and infrastructure that now call for a wide range of services and a more diverse workforce than existed in the days
when Bellevue and Redmond were described simply as suburbs across the lake from Seattle.
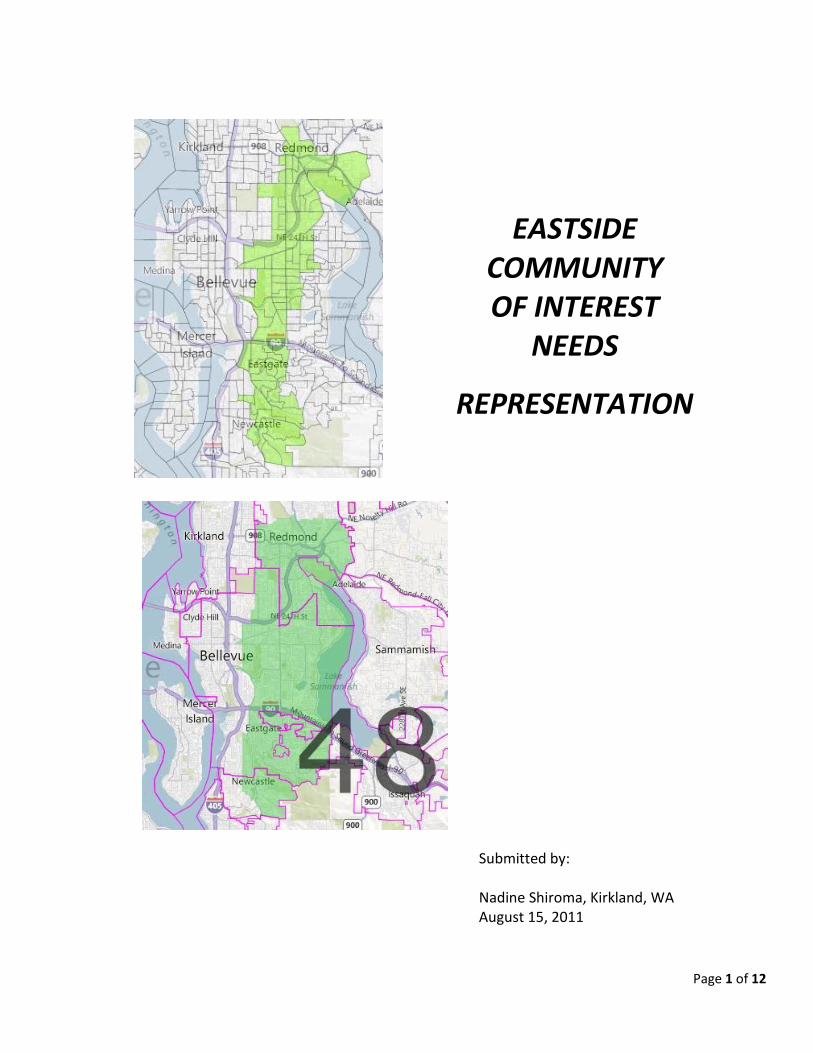
In 2001, I and other community members from the Eastside testified before the Redistricting Commission to request representation for a
growing community of interest (COI) extending from South Redmond through Bellevue, east of I-405 and along 148th Ave NE through Overlake,
Crossroads, Lake Hills and across I-90 through Factoria, Eastgate and Newcastle (hereinafter referred to as the So. Redmond-148th Ave NE COI). We urged redistricting commissioners to acknowledgge this community of interest
and create a legislative district that would allow voters in the community to elect candidates of their choice to represent them in the state legislature.
Over the last 10 years the So. Redmond-148th Ave NE COI has continued to grow, but its voting strength has been diluted by legislative boundaries
that bisect the community. NOTE: Currently, the 48th district extends from Hunts Point, Medina and Clyde Hill, downtown Bellevue and Kirkland across I-405
through Overlake, Crossroads and Lake Hills to West Lake Sammamish; while the 41st district, which includes most of Mercer Island, and West Renton runs east
through Factoria, Eastgate, New Castle and Renton Highlands. It should be noted that none of the 41st or 48th state legislators live in this community of interest. In the past, people of color from this COI have had to look to Seattle minority
communities and legislators to address issues of racial profiling, excessive police force or school district inequities.
The South Redmond-148th Ave NE COI is vastly different from Clyde Hill, Medina, the point communities, Mercer Island and Downtown Bellevue.
This statement is supported by property tax assessments, apartment and rental housing costs, locations of King County Housing Authority subsidized
housing, and South Lake Washington School District and Bellevue School District free and reduced lunch participation and test scores. If we were to plot on a map the locations of ethnic grocery stores, churches and language schools, we
would find that the majority of them are located East of I-405.
Page 3 of 12
The South Redmond-148th Ave NE COI has a higher percentage of immigrants and skilled and unskilled laborers who rely on public
transportation and utilize the services of Hopelink, Youth Eastside Services, Jewish Family Services, Catholic Community Services, Jubilee
Reach and other social service organizations. And not surprisingly, immigrants and people of color account for a much larger proportion of the population in this area than they do in the community west of I-405.
Understand, too, that given our country's history, the proportion of people of color is indicative of the social-economic forces that have resulted in the
gathering and concentration of people of color in certain geographic areas. This redistricting year the 41st LD is 5,486 over and the 48th LD is 6,813 under
target population. While it might be easy and expedient to simply tweak the boundary and shift population from the 41st to the 48th LD, the Redistricting
Commission is expected to comply with the Voting Rights Act to insure equal opportunities for minority communities to elect representatives of their choice. Commissioners therefore have an opportunity to revise the
boundaries of the 48th legislative district and address the needs of an underrepresented Eastside community of interest.
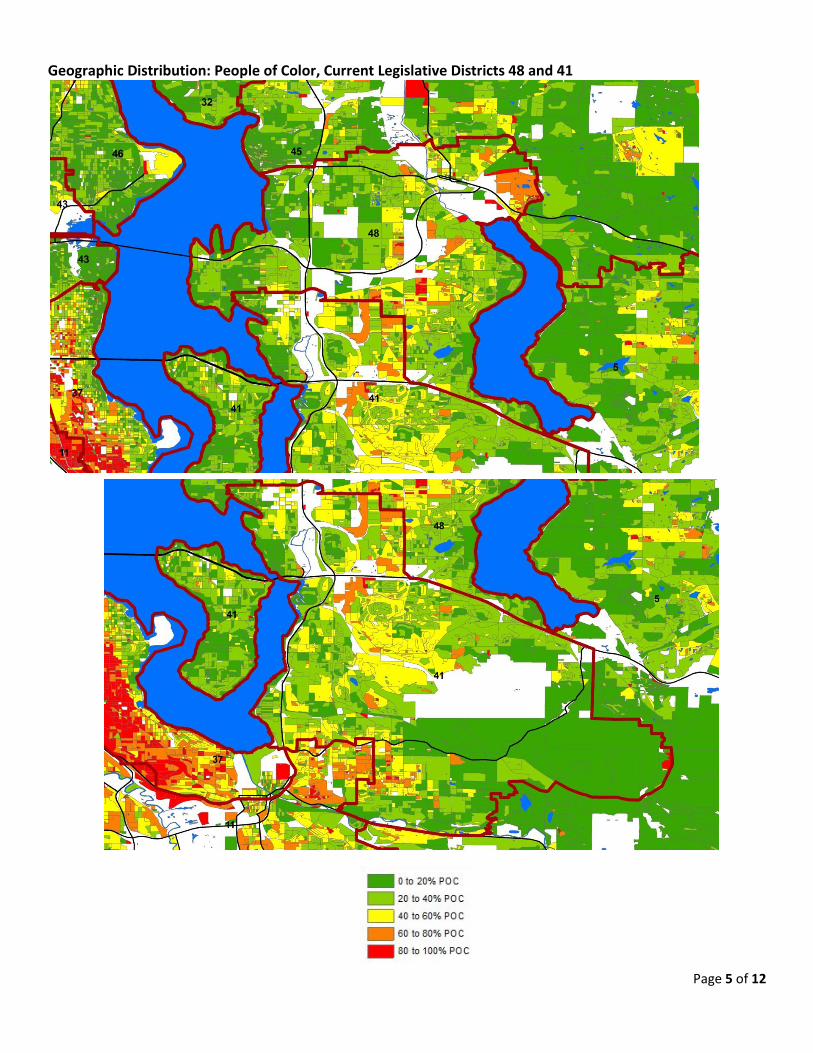
While people of color in the identified Eastside COI do not yet have
sufficient numbers to call for a majority-minority district, a map of this community of interest -- 77,372 constituents – reveals that people of color already account for 50% of the population in their census blocks. And
when we include Eastern European and Russian immigrants who also reside in these communities, the numbers are well over 50% of existing
population. I urge you to adhere to the Redistricting Commission's published criteria for
redrawing of voting district boundaries and provide constituents in the South Redmond-148th Avenue NE community of interest equal opportunities to elect
representatives of their choice to represent them in Olympia. It is unjust to wait another 10 years to provide representation for this Eastside community of interest.
Page 4 of 12
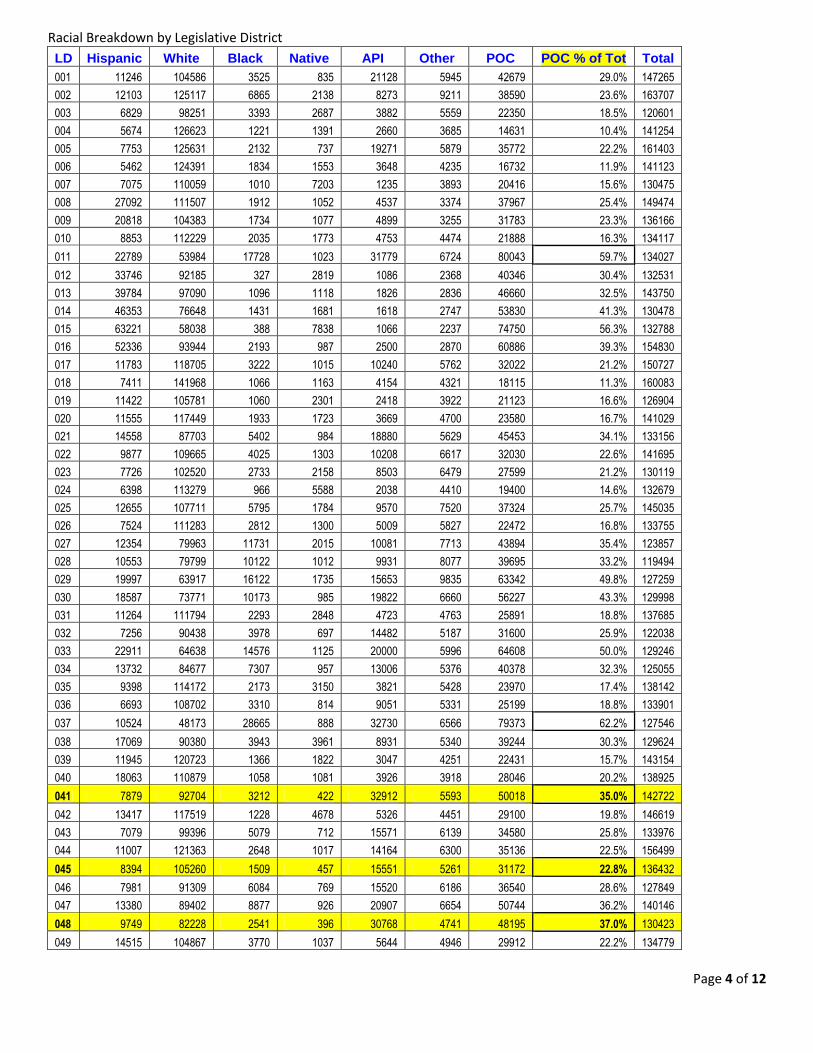
Racial Breakdown by Legislative District
LD Hispanic White Black Native API Other POC POC % of Tot Total
001 11246 104586 3525 835 21128 5945 42679 29.0% 147265
002 12103 125117 6865 2138 8273 9211 38590 23.6% 163707
003 6829 98251 3393 2687 3882 5559 22350 18.5% 120601
004 5674 126623 1221 1391 2660 3685 14631 10.4% 141254
005 7753 125631 2132 737 19271 5879 35772 22.2% 161403
006 5462 124391 1834 1553 3648 4235 16732 11.9% 141123
007 7075 110059 1010 7203 1235 3893 20416 15.6% 130475
008 27092 111507 1912 1052 4537 3374 37967 25.4% 149474
009 20818 104383 1734 1077 4899 3255 31783 23.3% 136166
010 8853 112229 2035 1773 4753 4474 21888 16.3% 134117
011 22789 53984 17728 1023 31779 6724 80043 59.7% 134027
012 33746 92185 327 2819 1086 2368 40346 30.4% 132531
013 39784 97090 1096 1118 1826 2836 46660 32.5% 143750
014 46353 76648 1431 1681 1618 2747 53830 41.3% 130478
015 63221 58038 388 7838 1066 2237 74750 56.3% 132788
016 52336 93944 2193 987 2500 2870 60886 39.3% 154830
017 11783 118705 3222 1015 10240 5762 32022 21.2% 150727
018 7411 141968 1066 1163 4154 4321 18115 11.3% 160083
019 11422 105781 1060 2301 2418 3922 21123 16.6% 126904
020 11555 117449 1933 1723 3669 4700 23580 16.7% 141029
021 14558 87703 5402 984 18880 5629 45453 34.1% 133156
022 9877 109665 4025 1303 10208 6617 32030 22.6% 141695
023 7726 102520 2733 2158 8503 6479 27599 21.2% 130119
024 6398 113279 966 5588 2038 4410 19400 14.6% 132679
025 12655 107711 5795 1784 9570 7520 37324 25.7% 145035
026 7524 111283 2812 1300 5009 5827 22472 16.8% 133755
027 12354 79963 11731 2015 10081 7713 43894 35.4% 123857
028 10553 79799 10122 1012 9931 8077 39695 33.2% 119494
029 19997 63917 16122 1735 15653 9835 63342 49.8% 127259
030 18587 73771 10173 985 19822 6660 56227 43.3% 129998
031 11264 111794 2293 2848 4723 4763 25891 18.8% 137685
032 7256 90438 3978 697 14482 5187 31600 25.9% 122038
033 22911 64638 14576 1125 20000 5996 64608 50.0% 129246
034 13732 84677 7307 957 13006 5376 40378 32.3% 125055
035 9398 114172 2173 3150 3821 5428 23970 17.4% 138142
036 6693 108702 3310 814 9051 5331 25199 18.8% 133901
037 10524 48173 28665 888 32730 6566 79373 62.2% 127546
038 17069 90380 3943 3961 8931 5340 39244 30.3% 129624
039 11945 120723 1366 1822 3047 4251 22431 15.7% 143154
040 18063 110879 1058 1081 3926 3918 28046 20.2% 138925
041 7879 92704 3212 422 32912 5593 50018 35.0% 142722
042 13417 117519 1228 4678 5326 4451 29100 19.8% 146619
043 7079 99396 5079 712 15571 6139 34580 25.8% 133976
044 11007 121363 2648 1017 14164 6300 35136 22.5% 156499
045 8394 105260 1509 457 15551 5261 31172 22.8% 136432
046 7981 91309 6084 769 15520 6186 36540 28.6% 127849
047 13380 89402 8877 926 20907 6654 50744 36.2% 140146
048 9749 82228 2541 396 30768 4741 48195 37.0% 130423
049 14515 104867 3770 1037 5644 4946 29912 22.2% 134779
Page 5 of 12
Geographic Distribution: People of Color, Current Legislative Districts 48 and 41
Page 6 of 12
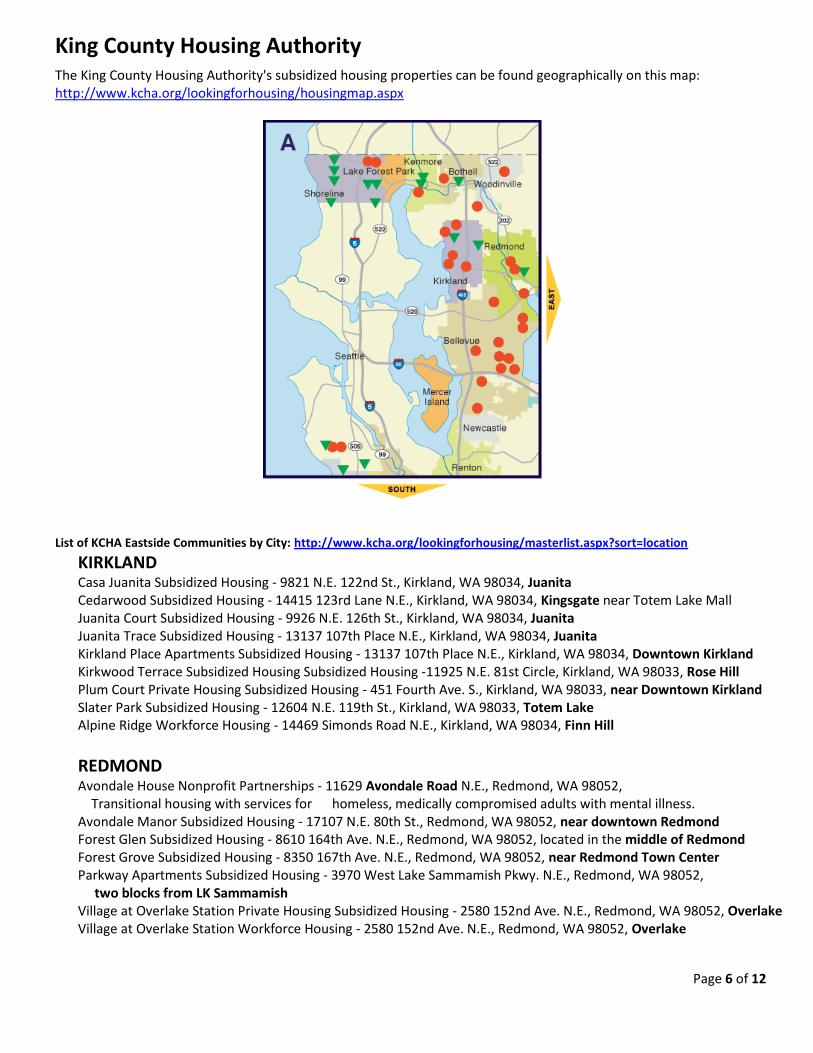
King County Housing Authority The King County Housing Authority's subsidized housing properties can be found geographically on this map:
http://www.kcha.org/lookingforhousing/housingmap.aspx
List of KCHA Eastside Communities by City: http://www.kcha.org/lookingforhousing/masterlist.aspx?sort=location
KIRKLAND Casa Juanita Subsidized Housing - 9821 N.E. 122nd St., Kirkland, WA 98034, Juanita Cedarwood Subsidized Housing - 14415 123rd Lane N.E., Kirkland, WA 98034, Kingsgate near Totem Lake Mall Juanita Court Subsidized Housing - 9926 N.E. 126th St., Kirkland, WA 98034, Juanita Juanita Trace Subsidized Housing - 13137 107th Place N.E., Kirkland, WA 98034, Juanita Kirkland Place Apartments Subsidized Housing - 13137 107th Place N.E., Kirkland, WA 98034, Downtown Kirkland Kirkwood Terrace Subsidized Housing Subsidized Housing -11925 N.E. 81st Circle, Kirkland, WA 98033, Rose Hill Plum Court Private Housing Subsidized Housing - 451 Fourth Ave. S., Kirkland, WA 98033, near Downtown Kirkland Slater Park Subsidized Housing - 12604 N.E. 119th St., Kirkland, WA 98033, Totem Lake Alpine Ridge Workforce Housing - 14469 Simonds Road N.E., Kirkland, WA 98034, Finn Hill
REDMOND
Avondale House Nonprofit Partnerships - 11629 Avondale Road N.E., Redmond, WA 98052, Transitional housing with services for homeless, medically compromised adults with mental illness. Avondale Manor Subsidized Housing - 17107 N.E. 80th St., Redmond, WA 98052, near downtown Redmond Forest Glen Subsidized Housing - 8610 164th Ave. N.E., Redmond, WA 98052, located in the middle of Redmond Forest Grove Subsidized Housing - 8350 167th Ave. N.E., Redmond, WA 98052, near Redmond Town Center Parkway Apartments Subsidized Housing - 3970 West Lake Sammamish Pkwy. N.E., Redmond, WA 98052, two blocks from LK Sammamish Village at Overlake Station Private Housing Subsidized Housing - 2580 152nd Ave. N.E., Redmond, WA 98052, Overlake Village at Overlake Station Workforce Housing - 2580 152nd Ave. N.E., Redmond, WA 98052, Overlake
Page 7 of 12
BELLEVUE Bellevue Houses, Subsidized Housing - various addresses Chalet Apartments Private Housing, Subsidized Housing - 2627 148th Ave. S.E., Bellevue, WA 98007, Eastgate College Place, Subsidized Housing - 1249 145th Place S.E., Bellevue, WA 98007, Convenience in Lake Hills Eastside Terrace, Subsidized Housing - 704 147th Place N.E., Bellevue, WA 98007, Crossroads Hidden Village, Subsidized Housing - 14508 S.E. 24th St., Bellevue, WA 98007, Lake Hills Landmark Private Housing, Subsidized Housing - 16330 N.E. 11th St., Bellevue, WA 98008, Crossroads neighborhood Newport Apartments, Subsidized Housing - 12646 S.E. 42nd St., Bellevue, WA 98006, Factoria Newporter, Subsidized Housing -5900 119th Ave. S.E., Bellevue, WA 98006, Newport Hills Spiritwood Manor, Subsidized Housing - 1424 148th Ave. S.E., Bellevue, WA 98007, Lake Hills Timberwood, Subsidized Housing - 3809 148th Ave. N.E., Bellevue, WA 98007, near Microsoft & Overlake Shopping Ctr Woodside East, Subsidized Housing - 16240 N.E. 14th St., Bellevue, WA 98008, Crossroads Bellepark East, Workforce Housing - 16203 N.E. 13th Place, Bellevue, WA 98008, Crossroads Cascadian, Workforce Housing - 15517 N.E. 12th St., Bellevue, WA 98008, Crossroads Eastwood Square, Workforce Housing - 14511 N.E. 35th St., Bellevue, WA 98007, near 148th Ave NE, Overlake Somerset Gardens Workforce Housing -14700 N.E. 29th Place, Bellevue, WA 98007, Overlake The Landmark Workforce Housing - 16330 N.E. 11th St., Bellevue, WA 98008, Crossroads The Newporter Workforce Housing - 5900 119th Ave. S.E., Bellevue, WA 98006, Newport Hills near Factoria Mall Timberwood Workforce Housing - 3809 148th Ave. N.E., Bellevue, WA 98007, Overlake near Microsoft Woodside East Workforce Housing - 16240 N.E. 14th St., Bellevue, WA 98008, Crossroads
KCHA Preservation Program
Four communities in Bellevue and Redmond, representing a total of 271 units, are managed by KCHA's Preservation Program. All of the units at Spiritwood Manor , Hidden Village, Newport Apartments and Parkway Apartments are open to low-income families, with incomes at 50 percent or less of the area median income. Residents in all of the housing in the Preservation developments pay an income-based rent (equal to no more than 30 percent of their adjusted monthly income).
Spiritwood Manor
1424 148th Ave. S.E., Bellevue, WA 98007
Apartments in Lake Hills
Hidden Village
Large Apartments in Lake Hills
14508 S.E. 24th St., Bellevue, WA 98007
Newport Apartments
Factoria
12646 S.E. 42nd St., Bellevue, WA 98006
Parkway Apartments
3970 West Lake Sammamish Pkwy. N.E., Redmond, WA 98052
Two blocks from Lake Sammamish.
Slater Park
12604 N.E. 119th St., Kirkland, WA 98033
Totem Lake
Seniors (60 and older) can rent comfortable condominiums conveniently located near shopping and services in the Totem Lake neighborhood of Kirkland.
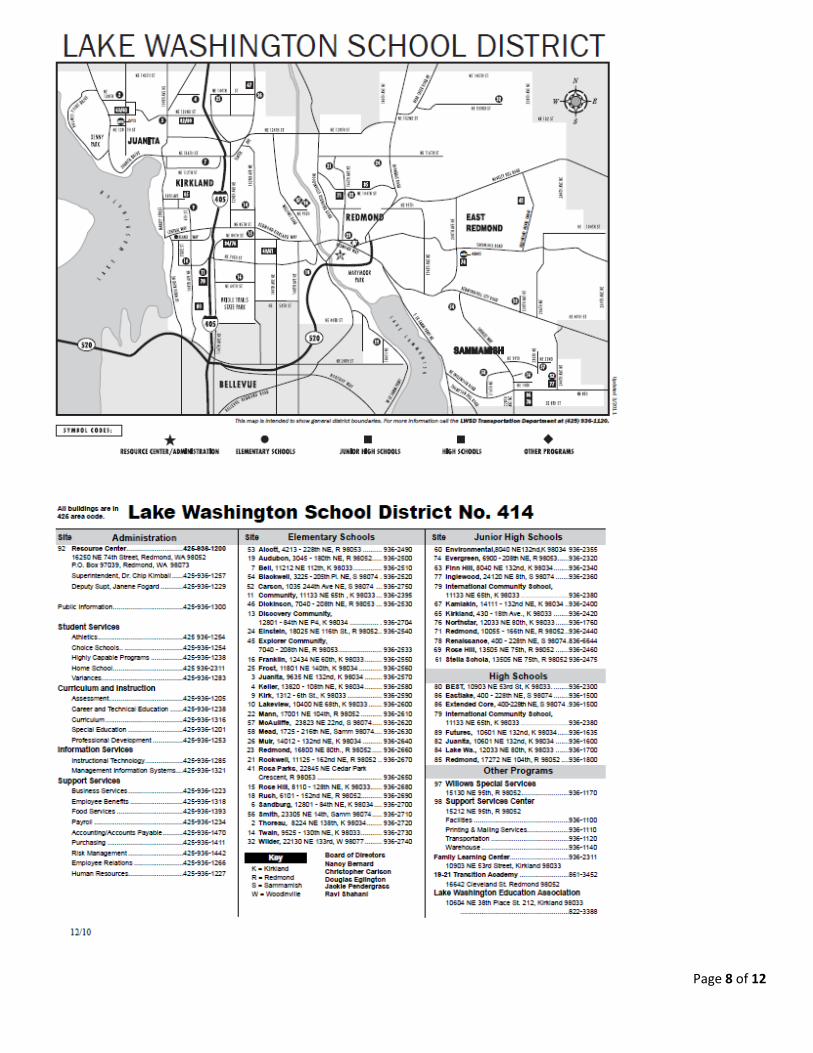
Page 8 of 12
Page 9 of 12
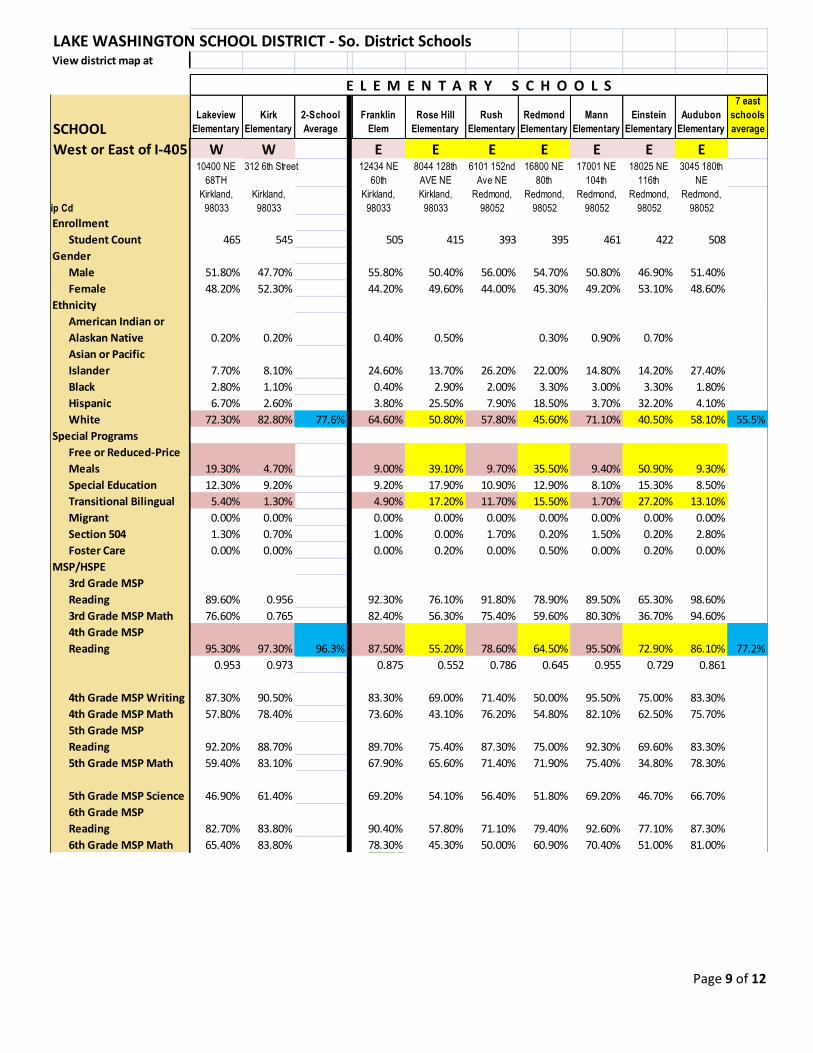
LAKE WASHINGTON SCHOOL DISTRICT - So. District SchoolsView district map at
SCHOOLLakeview
Elementary
Kirk
Elementary
2-School
Average
Franklin
Elem
Rose Hill
Elementary
Rush
Elementary
Redmond
Elementary
Mann
Elementary
Einstein
Elementary
Audubon
Elementary
7 east
schools
average
W W E E E E E E E10400 NE
68TH
1312 6th Street 12434 NE
60th
8044 128th
AVE NE
6101 152nd
Ave NE
16800 NE
80th
17001 NE
104th
18025 NE
116th
3045 180th
NE
Zip Cd
Kirkland,
98033
Kirkland,
98033
Kirkland,
98033
Kirkland,
98033
Redmond,
98052
Redmond,
98052
Redmond,
98052
Redmond,
98052
Redmond,
98052
Student Count 465 545 505 415 393 395 461 422 508
Male 51.80% 47.70% 55.80% 50.40% 56.00% 54.70% 50.80% 46.90% 51.40%
Female 48.20% 52.30% 44.20% 49.60% 44.00% 45.30% 49.20% 53.10% 48.60%
American Indian or
Alaskan Native 0.20% 0.20% 0.40% 0.50% 0.30% 0.90% 0.70%
Asian or Pacific
Islander 7.70% 8.10% 24.60% 13.70% 26.20% 22.00% 14.80% 14.20% 27.40%
Black 2.80% 1.10% 0.40% 2.90% 2.00% 3.30% 3.00% 3.30% 1.80%
Hispanic 6.70% 2.60% 3.80% 25.50% 7.90% 18.50% 3.70% 32.20% 4.10%
White 72.30% 82.80% 77.6% 64.60% 50.80% 57.80% 45.60% 71.10% 40.50% 58.10% 55.5%
0.723 0.828 0.646 0.508 0.578 0.456 0.711 0.405 0.581
Free or Reduced-Price
Meals 19.30% 4.70% 9.00% 39.10% 9.70% 35.50% 9.40% 50.90% 9.30%
Special Education 12.30% 9.20% 9.20% 17.90% 10.90% 12.90% 8.10% 15.30% 8.50%
Transitional Bilingual 5.40% 1.30% 4.90% 17.20% 11.70% 15.50% 1.70% 27.20% 13.10%
Migrant 0.00% 0.00% 0.00% 0.00% 0.00% 0.00% 0.00% 0.00% 0.00%
Section 504 1.30% 0.70% 1.00% 0.00% 1.70% 0.20% 1.50% 0.20% 2.80%
Foster Care 0.00% 0.00% 0.00% 0.20% 0.00% 0.50% 0.00% 0.20% 0.00%
3rd Grade MSP
Reading 89.60% 0.956 92.30% 76.10% 91.80% 78.90% 89.50% 65.30% 98.60%
3rd Grade MSP Math 76.60% 0.765 82.40% 56.30% 75.40% 59.60% 80.30% 36.70% 94.60%
4th Grade MSP
Reading 95.30% 97.30% 96.3% 87.50% 55.20% 78.60% 64.50% 95.50% 72.90% 86.10% 77.2%
0.953 0.973 0.875 0.552 0.786 0.645 0.955 0.729 0.861
4th Grade MSP Writing 87.30% 90.50% 83.30% 69.00% 71.40% 50.00% 95.50% 75.00% 83.30%
4th Grade MSP Math 57.80% 78.40% 73.60% 43.10% 76.20% 54.80% 82.10% 62.50% 75.70%
5th Grade MSP
Reading 92.20% 88.70% 89.70% 75.40% 87.30% 75.00% 92.30% 69.60% 83.30%
5th Grade MSP Math 59.40% 83.10% 67.90% 65.60% 71.40% 71.90% 75.40% 34.80% 78.30%
5th Grade MSP Science 46.90% 61.40% 69.20% 54.10% 56.40% 51.80% 69.20% 46.70% 66.70%
6th Grade MSP
Reading 82.70% 83.80% 90.40% 57.80% 71.10% 79.40% 92.60% 77.10% 87.30%
6th Grade MSP Math 65.40% 83.80% 78.30% 45.30% 50.00% 60.90% 70.40% 51.00% 81.00%
Gender
Ethnicity
Special Programs
MSP/HSPE
Enrollment
E L E M E N T A R Y S C H O O L S
West or East of I-405
Page 10 of 12
Page 11 of 12
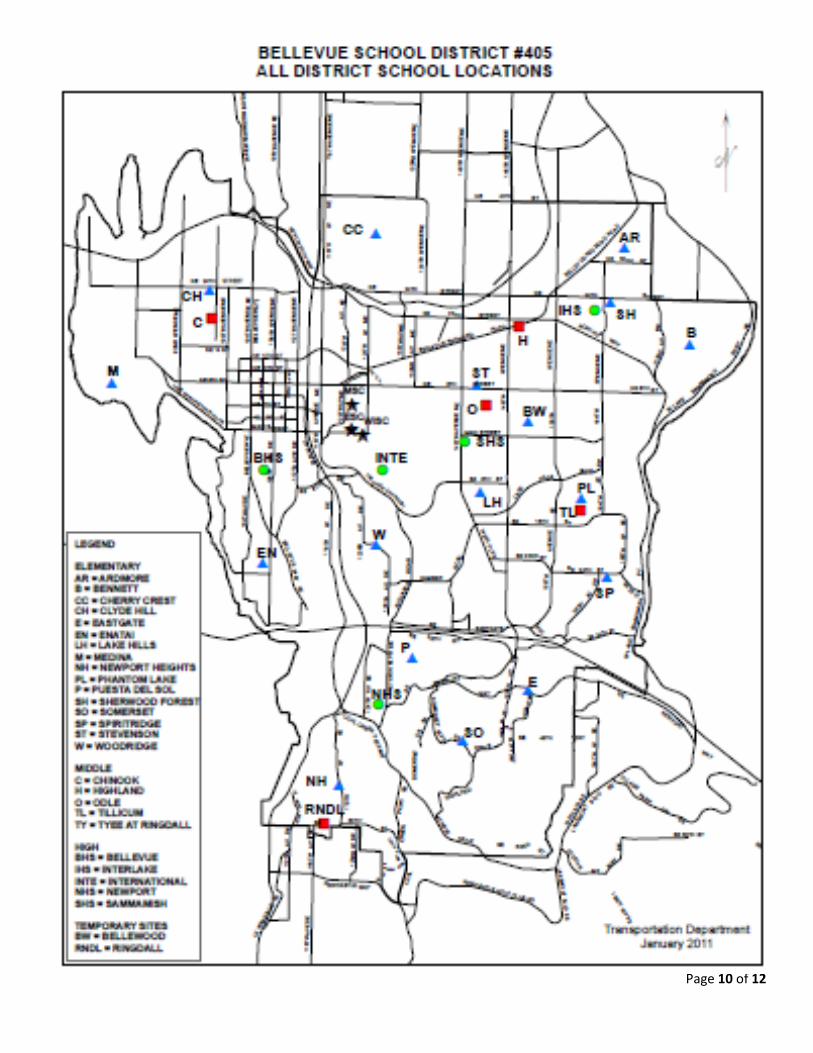
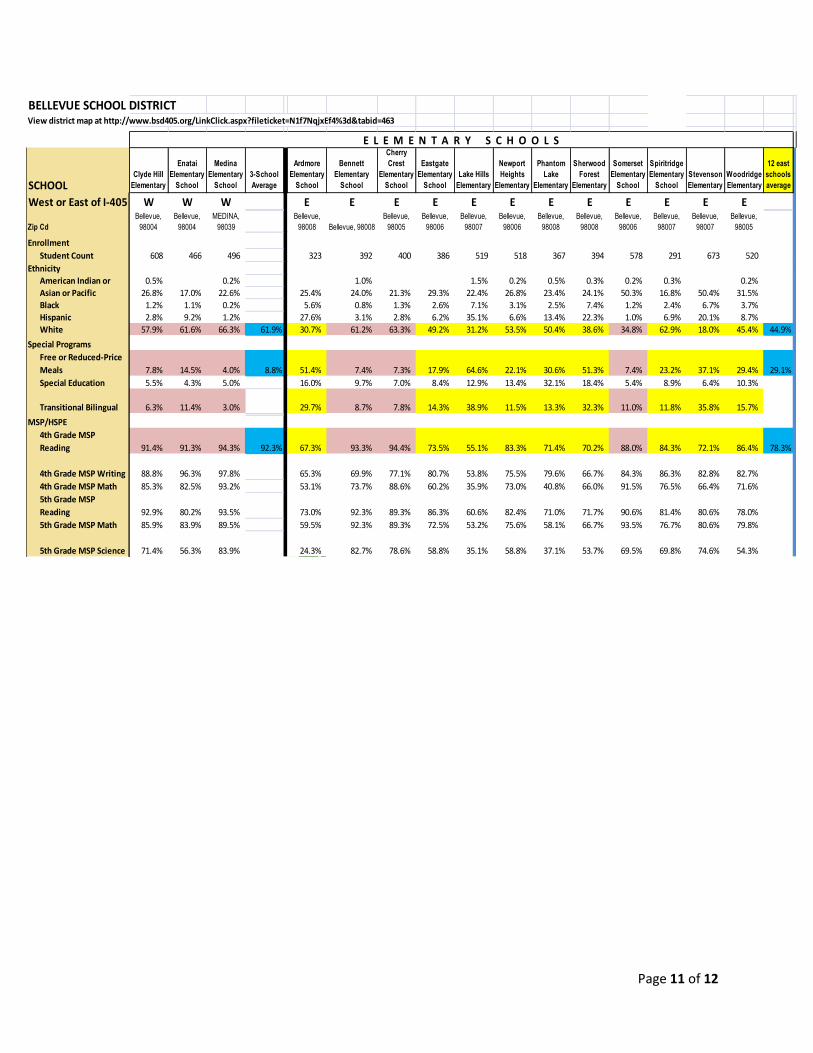
BELLEVUE SCHOOL DISTRICTView district map at http://www.bsd405.org/LinkClick.aspx?fileticket=N1f7NqjxEf4%3d&tabid=463
SCHOOLClyde Hill
Elementary
Enatai
Elementary
School
Medina
Elementary
School
3-School
Average
Ardmore
Elementary
School
Bennett
Elementary
School
Cherry
Crest
Elementary
School
Eastgate
Elementary
School
Lake Hills
Elementary
Newport
Heights
Elementary
Phantom
Lake
Elementary
Sherwood
Forest
Elementary
Somerset
Elementary
School
Spiritridge
Elementary
School
Stevenson
Elementary
Woodridge
Elementary
12 east
schools
average
W W W E E E E E E E E E E E E
Zip Cd
Bellevue,
98004
Bellevue,
98004
MEDINA,
98039
Bellevue,
98008 Bellevue, 98008
Bellevue,
98005
Bellevue,
98006
Bellevue,
98007
Bellevue,
98006
Bellevue,
98008
Bellevue,
98008
Bellevue,
98006
Bellevue,
98007
Bellevue,
98007
Bellevue,
98005
Student Count 608 466 496 323 392 400 386 519 518 367 394 578 291 673 520
American Indian or 0.5% 0.2% 1.0% 1.5% 0.2% 0.5% 0.3% 0.2% 0.3% 0.2%
Asian or Pacific 26.8% 17.0% 22.6% 25.4% 24.0% 21.3% 29.3% 22.4% 26.8% 23.4% 24.1% 50.3% 16.8% 50.4% 31.5%
Black 1.2% 1.1% 0.2% 5.6% 0.8% 1.3% 2.6% 7.1% 3.1% 2.5% 7.4% 1.2% 2.4% 6.7% 3.7%
Hispanic 2.8% 9.2% 1.2% 27.6% 3.1% 2.8% 6.2% 35.1% 6.6% 13.4% 22.3% 1.0% 6.9% 20.1% 8.7%
White 57.9% 61.6% 66.3% 61.9% 30.7% 61.2% 63.3% 49.2% 31.2% 53.5% 50.4% 38.6% 34.8% 62.9% 18.0% 45.4% 44.9%
0.579 0.616 0.663 0.307 0.612 0.633 0.492 0.312 0.535 0.504 0.386 0.348 0.629 0.18 0.454
Free or Reduced-Price
Meals 7.8% 14.5% 4.0% 8.8% 51.4% 7.4% 7.3% 17.9% 64.6% 22.1% 30.6% 51.3% 7.4% 23.2% 37.1% 29.4% 29.1%
Special Education 5.5% 4.3% 5.0% 16.0% 9.7% 7.0% 8.4% 12.9% 13.4% 32.1% 18.4% 5.4% 8.9% 6.4% 10.3%
Transitional Bilingual 6.3% 11.4% 3.0% 29.7% 8.7% 7.8% 14.3% 38.9% 11.5% 13.3% 32.3% 11.0% 11.8% 35.8% 15.7% Foster Care 0.0% 0.2% 0.0% 0.3% 0.3% 0.0% 0.0% 0.6% 0.4% 0.3% 0.3% 0.2% 0.0% 0.3% 0.2%
4th Grade MSP
Reading 91.4% 91.3% 94.3% 92.3% 67.3% 93.3% 94.4% 73.5% 55.1% 83.3% 71.4% 70.2% 88.0% 84.3% 72.1% 86.4% 78.3%
4th Grade MSP Writing 88.8% 96.3% 97.8% 65.3% 69.9% 77.1% 80.7% 53.8% 75.5% 79.6% 66.7% 84.3% 86.3% 82.8% 82.7%
4th Grade MSP Math 85.3% 82.5% 93.2% 53.1% 73.7% 88.6% 60.2% 35.9% 73.0% 40.8% 66.0% 91.5% 76.5% 66.4% 71.6%
5th Grade MSP
Reading 92.9% 80.2% 93.5% 73.0% 92.3% 89.3% 86.3% 60.6% 82.4% 71.0% 71.7% 90.6% 81.4% 80.6% 78.0%
5th Grade MSP Math 85.9% 83.9% 89.5% 59.5% 92.3% 89.3% 72.5% 53.2% 75.6% 58.1% 66.7% 93.5% 76.7% 80.6% 79.8%
5th Grade MSP Science 71.4% 56.3% 83.9% 24.3% 82.7% 78.6% 58.8% 35.1% 58.8% 37.1% 53.7% 69.5% 69.8% 74.6% 54.3%
West or East of I-405
E L E M E N T A R Y S C H O O L S
Enrollment
Ethnicity
Special Programs
MSP/HSPE
Page 12 of 12
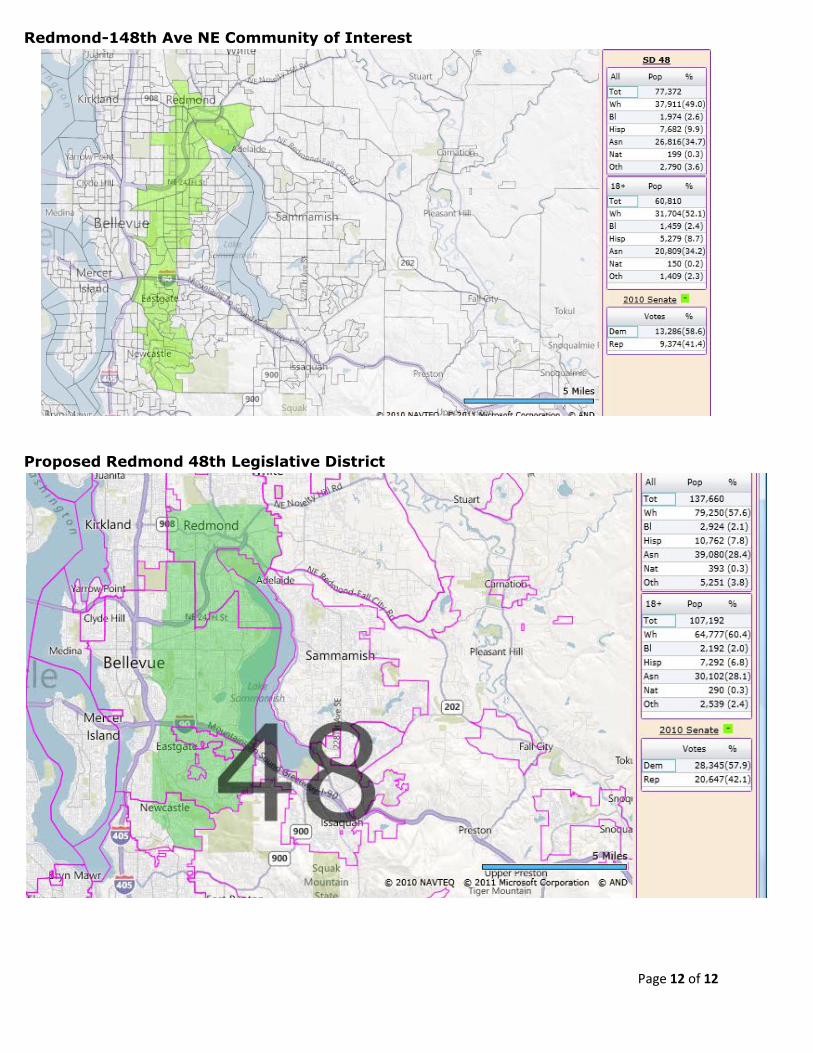
Redmond-148th Ave NE Community of Interest
Proposed Redmond 48th Legislative District