Embed Size (px)
Citation preview

EBA ESTIMATES: ANALYSIS OF 2016 CURRENT ACCOUNTS AND REAL EFFECTIVE EXCHANGE RATES
Introduction The attached tables contain estimates from the External Balance Assessment (EBA) analysis of 2016 current accounts and real exchange rates, computed in June 2017 by the Research Department. These EBA estimates are used as input in the 2017 External Sector Report and the 2017 External Sector Report: Individual Economy Assessments. The EBA analysis is of the 2016 outturns of the current account (CA) and 2016 year-average real effective exchange rates (REER). The external sustainability (ES) analysis is with reference to projections of 2021 current accounts. EBA estimates presented in the attached tables are provided for the 25 countries that are analyzed in the 2017 External Sector Report. In addition, estimates are also shown for the euro area aggregate, which are constructed using weighted averages of the EBA estimates for the 11 largest euro area economies. Underlying the EBA analyses are the same methodologies used in the previous External Sector Report.1 Data Vintage All analyses draw on data that were available to IMF staff as of June 2017:2
World Economic Outlook (WEO) database as of June 2017. Demographic data are drawn from UN World Population Prospects (2015). Relative to
the previous update in 2012, the new demographic inputs reflect in part changes in migration flows, fertility, and longevity across countries.
The capital control index from Quinn (1997) was updated through 2015. Other third-party indicators (e.g. ICRG) were updated accordingly.
Organization The attached tables are organized in four sections. As with the 2016 External Sector Report, these correspond to four sets of estimates: Section I: Regression-based analysis of 2016 Current Accounts Section II: Regression-based analysis of the 2016 Index REER Section III: Regression-based analysis of the 2016 Level REER Section IV: External Sustainability Analysis
1 See IMF Working Paper WP/13/272 for a complete description of the EBA methodology and Annex I of the 2015 External Sector Report for a discussion of more recent refinements. 2 The dataset is available upon request by sending an email to [email protected]. The data will also be made publicly available upon publication of the 2017 ESR papers.

SECTION I—CURRENT ACCOUNT REGRESSION-BASED ANALYSIS
The tables on the following pages contain results from the EBA analysis of 2016 current account balances (CA, as percent of GDP). The first table decomposes the 2016 CAs into a cyclical component (related to both the business cycle and commodity price cycle) and a cyclically-adjusted component. The latter is further decomposed into a cyclically-adjusted CA “norm” (calculated using desirable P* policy settings), a gap that arises from the estimated contributions of five policy gaps, and a regression residual. The last column is the Total CA Gap, the sum of the overall policy gaps and the residual. The CA numbers in the first table include small adjustments that have been applied uniformly across countries (in terms of a country’s own GDP) to ensure multilateral consistency. Thus, the cross-country sum of the CA norm levels, when measured in U.S. dollars, matches the sum of the actual 2016 CA levels of all 49 EBA countries. The second table breaks down the policy gap contributions by the five policies covered in the EBA CA analysis. For each policy gap, the reported estimates include both the total contribution and the subcomponent that is “domestic” (i.e., arising from a country’s own policies). The five subsequent tables show further detail on the derivation of the policy gap contributions. The abbreviation “wo” is used to denote the world average counterparts of the variables (in all cases, world averages are obtained as GDP-weighted averages of the relevant variables). The final table of this section shows the derivation of the cyclical component of the CA.

Actual
2016 CA
Cyclical
Contributions
(incl. ToT) 1/
Cyclically
Adjusted
2016 CA
Cyclically
Adjusted
CA Norm 2/
Contribution of
Identified
Policy Gaps
Unexplained
Residual
Total Gap,
including
Residual
Australia -2.6% -0.7% -2.0% -1.5% 0.3% -0.8% -0.5%
Belgium -0.4% 0.1% -0.5% 2.6% -0.7% -2.5% -3.2%
Brazil -1.3% 0.8% -2.1% -2.5% -1.0% 1.5% 0.5%
Canada -3.3% -0.8% -2.5% 0.6% 0.5% -3.7% -3.1%
China 1.7% 0.0% 1.8% 0.2% -0.4% 1.9% 1.5%
France -1.0% 0.7% -1.7% 1.2% -0.2% -2.6% -2.9%
Germany 8.3% -0.2% 8.5% 4.5% 1.4% 2.6% 4.0%
India -0.7% 0.4% -1.1% -4.2% 1.1% 2.0% 3.1%
Indonesia -1.8% -0.9% -0.9% -0.9% 2.0% -2.0% 0.0%
Italy 2.6% 1.0% 1.5% 4.0% 0.4% -2.8% -2.5%
Japan 3.8% 0.7% 3.1% 3.4% -1.0% 0.6% -0.3%
Korea 7.0% 1.0% 6.0% 1.7% 2.5% 1.7% 4.3%
Malaysia 2.4% -1.2% 3.6% 1.1% 1.3% 1.2% 2.5%
Mexico -2.7% -0.7% -2.0% -1.9% 0.9% -1.0% -0.1%
Netherlands 8.4% -0.1% 8.5% 5.3% 1.4% 1.8% 3.2%
Poland -0.3% -0.2% -0.1% -0.7% 0.9% -0.3% 0.6%
Russia 1.9% -2.3% 4.2% 6.3% -1.1% -0.9% -2.0%
South Africa -3.3% -0.2% -3.1% -0.7% 0.3% -2.7% -2.4%
Spain 2.0% 0.8% 1.1% 1.8% -1.3% 0.6% -0.7%
Sweden 4.5% -0.5% 5.0% -1.4% 1.0% 5.4% 6.4%
Switzerland 10.7% 0.2% 10.5% 7.5% 1.0% 2.0% 3.0%
Thailand 11.5% 0.3% 11.2% 1.2% 2.3% 7.7% 10.0%
Turkey -3.8% -0.1% -3.7% -0.6% 0.9% -4.0% -3.0%
United Kingdom -4.4% -0.3% -4.1% 0.0% -0.5% -3.5% -4.0%
United States -2.4% -0.1% -2.3% -1.3% -0.4% -0.6% -1.0%
Euro Area 3/ 3.3% 0.4% 2.9% 3.1% 0.4% -0.6% -0.2%
1/ Sum of estimated contributions of output cycle and commodity terms of trade cycle.
2/ Current account norm determined by regression evaluated at observed fundamentals and desirable policy
settings (and zero cyclical contributions).
3/ Euro area norm level and policy gap contributions are calculated as GDP-weighted averages of values for the 11 largest Euro area economies. Actual
CA is the “corrected for reporting discrepancies in intra-area transactions” and CA of the entire Euro area is about ½ % of GDP less than sum of the
individual 11 countries' CA balances (for which no such correction is available).
Table 1. EBA Regression Analysis of 2016 Current Accounts
(In percent of GDP, includes multilateral consistency adjustments)

Total Dom. Total Dom. Total Dom. Total Dom. Total Dom. Total Dom.
Australia 0.3% -0.6% -0.1% -1.0% 0.2% 0.4% 0.1% 0.0% 0.1% 0.0% -0.1% 0.0%
Belgium -0.7% -1.6% -0.6% -1.5% -0.2% -0.1% 0.1% 0.0% 0.1% 0.0% -0.1% 0.0%
Brazil -1.0% -1.9% -1.4% -2.3% 0.1% 0.3% 0.2% 0.1% 0.1% 0.0% 0.0% 0.1%
Canada 0.5% -0.3% 0.8% -0.1% -0.1% 0.0% 0.1% 0.0% -0.1% -0.2% -0.1% 0.0%
China -0.4% -1.3% -0.5% -1.4% 0.9% 1.0% -0.8% -0.9% -0.5% -0.6% 0.4% 0.6%
France -0.2% -1.1% -0.2% -1.1% -0.1% 0.0% 0.1% 0.0% 0.1% 0.0% -0.1% 0.0%
Germany 1.4% 0.6% 1.5% 0.6% -0.1% 0.0% 0.1% 0.0% 0.1% 0.0% -0.1% 0.0%
India 1.1% 0.3% 0.2% -0.7% -0.1% 0.1% 0.3% 0.2% 0.1% -0.1% 0.6% 0.8%
Indonesia 2.0% 1.1% 0.9% 0.0% 0.4% 0.5% 0.3% 0.2% 0.1% 0.0% 0.2% 0.4%
Italy 0.4% -0.5% 0.4% -0.5% -0.1% 0.0% 0.1% 0.0% 0.1% 0.0% -0.1% 0.0%
Japan -1.0% -1.9% -1.0% -1.9% -0.1% 0.0% 0.1% 0.0% 0.1% 0.0% -0.1% 0.0%
Korea 2.5% 1.7% 1.9% 1.0% 0.4% 0.6% 0.2% 0.1% 0.1% 0.0% -0.1% 0.0%
Malaysia 1.3% 0.4% 0.3% -0.6% 0.8% 0.9% 0.2% 0.1% 0.0% -0.1% 0.0% 0.1%
Mexico 0.9% 0.0% 0.2% -0.7% 0.3% 0.5% 0.1% 0.0% 0.1% 0.0% 0.1% 0.2%
Netherlands 1.4% 0.6% 1.5% 0.6% -0.1% 0.0% 0.1% 0.0% 0.1% 0.0% -0.1% 0.0%
Poland 0.9% 0.0% 0.2% -0.7% 0.1% 0.3% 0.4% 0.3% 0.2% 0.1% -0.1% 0.0%
Russia -1.1% -1.9% -1.6% -2.5% 0.5% 0.6% 0.1% 0.0% 0.1% 0.0% -0.1% 0.0%
South Africa 0.3% -0.5% 0.2% -0.7% -0.1% 0.0% 0.1% 0.0% 0.1% 0.0% 0.0% 0.1%
Spain -1.3% -2.1% -0.6% -1.5% -0.1% 0.0% 0.1% 0.0% -0.5% -0.6% -0.1% 0.0%
Sweden 1.0% 0.1% 1.1% 0.2% -0.1% 0.1% 0.1% 0.0% 0.0% -0.2% -0.1% 0.0%
Switzerland 1.0% 0.1% 1.0% 0.1% -0.1% 0.0% 0.1% 0.0% 0.1% 0.0% -0.1% 0.0%
Thailand 2.3% 1.5% 1.7% 0.8% 0.0% 0.1% 0.5% 0.4% 0.2% 0.0% 0.0% 0.1%
Turkey 0.9% 0.1% 1.0% 0.1% -0.1% 0.0% 0.1% 0.0% 0.1% -0.1% -0.1% 0.1%
United Kingdom -0.5% -1.4% -0.5% -1.4% -0.1% 0.0% 0.1% 0.0% 0.1% 0.0% -0.1% 0.0%
United States -0.4% -1.2% 0.0% -0.9% -0.5% -0.3% 0.1% 0.0% 0.1% 0.0% -0.1% 0.0%
Euro Area (agg) 1/ 0.5% -0.4% 0.6% -0.3% -0.2% 0.0% 0.1% 0.0% 0.1% -0.1% -0.1% 0.0%
1/ Euro area policy gap contributions are GDP-weighted averages of the 11 largest Euro area economies.
Credit K-Controls
Table 2. EBA-Estimated Policy Gap Contributions to 2016 Current Accounts
All (sum) Fiscal Balance Health Exp. ∆ Reserves

Overall
ContributionBeta Policy Gap 1/ (P-P*) P P* P_wo P*_wo
Australia -0.1% 0.47 -0.2% -2.1% -2.1% 0.0% -3.1% -1.2%
Belgium -0.6% 0.47 -1.2% -3.2% -2.4% 0.8% -3.1% -1.2%
Brazil -1.4% 0.47 -3.0% -5.0% -8.0% -3.0% -3.1% -1.2%
Canada 0.8% 0.47 1.7% -0.3% -1.5% -1.2% -3.1% -1.2%
China -0.5% 0.47 -1.0% -2.9% -3.6% -0.7% -3.1% -1.2%
France -0.2% 0.47 -0.4% -2.3% -2.3% 0.0% -3.1% -1.2%
Germany 1.5% 0.47 3.1% 1.2% 0.7% -0.5% -3.1% -1.2%
India 0.2% 0.47 0.4% -1.5% -6.5% -5.0% -3.1% -1.2%
Indonesia 0.9% 0.47 1.9% 0.0% -2.5% -2.5% -3.1% -1.2%
Italy 0.4% 0.47 0.8% -1.1% -1.1% 0.0% -3.1% -1.2%
Japan -1.0% 0.47 -2.0% -4.0% -3.9% 0.1% -3.1% -1.2%
Korea 1.9% 0.47 4.1% 2.2% 2.1% -0.1% -3.1% -1.2%
Malaysia 0.3% 0.47 0.7% -1.2% -3.2% -2.0% -3.1% -1.2%
Mexico 0.2% 0.47 0.4% -1.5% -4.0% -2.5% -3.1% -1.2%
Netherlands 1.5% 0.47 3.2% 1.2% 0.7% -0.5% -3.1% -1.2%
Poland 0.2% 0.47 0.5% -1.5% -2.5% -1.0% -3.1% -1.2%
Russia -1.6% 0.47 -3.5% -5.4% -2.9% 2.5% -3.1% -1.2%
South Africa 0.2% 0.47 0.5% -1.5% -3.6% -2.1% -3.1% -1.2%
Spain -0.6% 0.47 -1.4% -3.3% -3.3% 0.0% -3.1% -1.2%
Sweden 1.1% 0.47 2.4% 0.5% 0.8% 0.3% -3.1% -1.2%
Switzerland 1.0% 0.47 2.2% 0.2% 0.2% 0.0% -3.1% -1.2%
Thailand 1.7% 0.47 3.6% 1.7% 0.7% -1.0% -3.1% -1.2%
Turkey 1.0% 0.47 2.2% 0.3% -2.3% -2.6% -3.1% -1.2%
United Kingdom -0.5% 0.47 -1.1% -3.0% -3.0% 0.0% -3.1% -1.2%
United States 0.0% 0.47 0.1% -1.9% -3.9% -2.0% -3.1% -1.2%
Euro Area (agg) 0.6% 0.47 1.3% -0.7% -0.9% -0.2% -3.1% -1.2%
Table 3. Breakdown of 2016 Policy Gap Contribution: Fiscal Balance/GDP
1/ (P-P_wo) - (P*-P*_wo).

Overall
ContributionBeta Policy Gap 2/ (P-P*) P P* P_wo P*_wo
P* Bench-
mark from
Regression 3/
Australia 0.2% -0.50 -0.5% -0.8% 6.0% 6.8% 6.0% 6.2% 6.9%
Belgium -0.2% -0.50 0.4% 0.1% 8.2% 8.1% 6.0% 6.2% 6.7%
Brazil 0.1% -0.50 -0.3% -0.6% 4.1% 4.7% 6.0% 6.2% 4.0%
Canada -0.1% -0.50 0.3% 0.0% 7.6% 7.6% 6.0% 6.2% 6.8%
China 0.9% -0.50 -1.8% -2.1% 1.7% 3.8% 6.0% 6.2% 3.8%
France -0.2% -0.50 0.3% 0.0% 8.9% 8.9% 6.0% 6.2% 7.6%
Germany -0.1% -0.50 0.3% 0.0% 8.7% 8.7% 6.0% 6.2% 8.0%
India -0.1% -0.50 0.2% -0.1% 1.4% 1.5% 6.0% 6.2% 2.1%
Indonesia 0.4% -0.50 -0.7% -1.0% 1.4% 2.4% 6.0% 6.2% 3.0%
Italy -0.1% -0.50 0.3% 0.0% 7.1% 7.1% 6.0% 6.2% 7.6%
Japan -0.1% -0.50 0.3% 0.0% 8.4% 8.4% 6.0% 6.2% 8.2%
Korea 0.4% -0.50 -0.9% -1.2% 4.1% 5.3% 6.0% 6.2% 5.3%
Malaysia 0.8% -0.50 -1.5% -1.8% 2.0% 3.8% 6.0% 6.2% 4.8%
Mexico 0.3% -0.50 -0.7% -1.0% 3.1% 4.1% 6.0% 6.2% 4.0%
Netherlands -0.1% -0.50 0.3% 0.0% 9.5% 9.5% 6.0% 6.2% 7.2%
Poland 0.1% -0.50 -0.2% -0.5% 4.7% 5.2% 6.0% 6.2% 5.5%
Russia 0.5% -0.50 -0.9% -1.2% 4.1% 5.3% 6.0% 6.2% 5.7%
South Africa -0.1% -0.50 0.3% 0.0% 4.0% 4.0% 6.0% 6.2% 4.0%
Spain -0.1% -0.50 0.3% 0.0% 7.1% 7.1% 6.0% 6.2% 6.5%
Sweden -0.1% -0.50 0.1% -0.2% 7.9% 8.0% 6.0% 6.2% 8.2%
Switzerland -0.1% -0.50 0.3% 0.0% 7.5% 7.5% 6.0% 6.2% 7.4%
Thailand 0.0% -0.50 0.0% -0.3% 3.0% 3.3% 6.0% 6.2% 4.2%
Turkey -0.1% -0.50 0.3% 0.0% 3.6% 3.6% 6.0% 6.2% 4.4%
United Kingdom -0.1% -0.50 0.3% 0.0% 7.8% 7.8% 6.0% 6.2% 7.3%
United States -0.5% -0.50 1.0% 0.7% 8.0% 7.4% 6.0% 6.2% 7.3%
Euro Area (agg) -0.2% -0.50 0.4% 0.1% 8.1% 8.0% 6.0% 6.2% 7.5%
1/ This variable is lagged in estimation, thus 2015 values are shown ; before small M.C. adjustment.
2/ (P-P_wo) - (P*-P*_wo).
3/ Fitted value from cross-country regression of public health expenditure on relative per capita income, old age dependency,
and income inequality (Gini coefficient). For reference; desk value may differ.
Table 4. Breakdown of 2016 Policy Gap Contribution: Public Expenditure on Health/GDP 1/

P P* KC KC*
Australia 0.1% 0.45 0.3% 0.0% 0.1% 0.0% -0.3% 0.0% 0.6% 0.2% 0.13 0.13
Belgium 0.1% 0.45 0.3% 0.0% 0.0% 0.0% -0.3% 0.0% -0.2% -0.2% 0.00 0.00
Brazil 0.2% 0.45 0.4% 0.1% 0.1% 0.0% -0.3% 0.0% 0.5% 0.0% 0.25 0.16
Canada 0.1% 0.45 0.3% 0.0% 0.0% 0.0% -0.3% 0.0% 0.4% 0.0% 0.00 0.00
China -0.8% 0.45 -1.7% -2.0% -2.0% 0.0% -0.3% 0.0% -3.9% 0.0% 0.50 0.16
France 0.1% 0.45 0.3% 0.0% 0.0% 0.0% -0.3% 0.0% 0.1% 0.0% 0.00 0.00
Germany 0.1% 0.45 0.3% 0.0% 0.0% 0.0% -0.3% 0.0% 0.1% 0.0% 0.00 0.00
India 0.3% 0.45 0.8% 0.5% 0.5% 0.0% -0.3% 0.0% 1.0% 0.0% 0.50 0.16
Indonesia 0.3% 0.45 0.8% 0.5% 0.5% 0.0% -0.3% 0.0% 1.3% 0.0% 0.38 0.16
Italy 0.1% 0.45 0.3% 0.0% 0.0% 0.0% -0.3% 0.0% -0.1% 0.0% 0.00 0.00
Japan 0.1% 0.45 0.3% 0.0% 0.0% 0.0% -0.3% 0.0% -0.1% 0.2% 0.00 0.00
Korea 0.2% 0.45 0.4% 0.1% 0.1% -0.1% -0.3% 0.0% 0.5% -0.7% 0.13 0.13
Malaysia 0.2% 0.45 0.5% 0.2% 0.5% 0.3% -0.3% 0.0% 1.2% 1.6% 0.38 0.16
Mexico 0.1% 0.45 0.3% 0.0% 0.0% 0.0% -0.3% 0.0% 0.0% 0.0% 0.38 0.16
Netherlands 0.1% 0.45 0.3% 0.0% 0.0% 0.0% -0.3% 0.0% -0.4% 0.1% 0.00 0.00
Poland 0.4% 0.45 1.0% 0.7% 1.2% 0.5% -0.3% 0.0% 4.8% 3.1% 0.25 0.16
Russia 0.1% 0.45 0.3% 0.0% 0.1% 0.1% -0.3% 0.0% 0.6% 0.6% 0.13 0.13
South Africa 0.1% 0.45 0.3% 0.0% 0.2% 0.2% -0.3% 0.0% 0.9% 1.5% 0.25 0.16
Spain 0.1% 0.45 0.3% 0.0% 0.0% 0.0% -0.3% 0.0% 0.7% 0.0% 0.00 0.00
Sweden 0.1% 0.45 0.3% 0.0% 0.0% 0.0% -0.3% 0.0% 0.8% 0.0% 0.00 0.00
Switzerland 0.1% 0.45 0.3% 0.0% 0.0% 0.0% -0.3% 0.0% 0.8% 3.5% 0.00 0.00
Thailand 0.5% 0.45 1.1% 0.8% 0.8% 0.0% -0.3% 0.0% 3.2% 0.0% 0.25 0.16
Turkey 0.1% 0.45 0.2% -0.1% 0.0% 0.1% -0.3% 0.0% 0.1% 0.6% 0.25 0.16
United Kingdom 0.1% 0.45 0.3% 0.0% 0.0% 0.0% -0.3% 0.0% 0.3% 0.5% 0.00 0.00
United States 0.1% 0.45 0.3% 0.0% 0.0% 0.0% -0.3% 0.0% 0.0% 0.0% 0.00 0.00
Euro Area (agg) 0.1% 0.45 0.3% 0.0% 0.0% 0.0% -0.3% 0.0% 0.1% 0.0% 0.01 0.01
1/ Before small Multilateral Consistency adjustment.
2/ [(P_KC)-(P_KC)_wo] - [(P_KC)*-(P_KC)*_wo].
Table 5. Breakdown of 2016 Policy Gap Contribution: (Change in FX Reserves)/GDP 1/
ComponentsPolicy Gap
2/ Beta
(P_KC)-
(P_KC)*
(P_KC) (P_KC)* (P_KC)
_wo
(P_KC)*
_wo
Overall
Contri-
bution

Overall
ContributionBeta Policy Gap 2/ (P-P*) P P* P_wo P*_wo
Australia 0.1% -0.021 -5.8% 0.0% 51.2% 51.2% 29.9% 24.0%
Belgium 0.1% -0.021 -5.8% 0.0% 25.8% 25.8% 29.9% 24.0%
Brazil 0.1% -0.021 -5.8% 0.0% 26.7% 26.7% 29.9% 24.0%
Canada -0.1% -0.021 4.2% 10.0% 53.0% 43.0% 29.9% 24.0%
China -0.5% -0.021 24.2% 30.0% 56.2% 26.2% 29.9% 24.0%
France 0.1% -0.021 -5.8% 0.0% 10.3% 10.3% 29.9% 24.0%
Germany 0.1% -0.021 -5.8% 0.0% -5.4% -5.4% 29.9% 24.0%
India 0.1% -0.021 -3.2% 2.6% 17.6% 15.0% 29.9% 24.0%
Indonesia 0.1% -0.021 -6.7% -0.8% 2.1% 2.9% 29.9% 24.0%
Italy 0.1% -0.021 -5.8% 0.0% 45.0% 45.0% 29.9% 24.0%
Japan 0.1% -0.021 -5.9% -0.1% 6.2% 6.2% 29.9% 24.0%
Korea 0.1% -0.021 -5.8% 0.0% 31.0% 31.0% 29.9% 24.0%
Malaysia 0.0% -0.021 0.2% 6.0% 13.7% 7.7% 29.9% 24.0%
Mexico 0.1% -0.021 -5.8% 0.0% 12.8% 12.8% 29.9% 24.0%
Netherlands 0.1% -0.021 -5.8% 0.0% 79.0% 79.0% 29.9% 24.0%
Poland 0.2% -0.021 -10.4% -4.5% 27.5% 32.0% 29.9% 24.0%
Russia 0.1% -0.021 -5.8% 0.0% 8.6% 8.6% 29.9% 24.0%
South Africa 0.1% -0.021 -5.8% 0.0% 34.5% 34.5% 29.9% 24.0%
Spain -0.5% -0.021 22.3% 28.1% 60.1% 32.0% 29.9% 24.0%
Sweden 0.0% -0.021 1.4% 7.2% 76.7% 69.5% 29.9% 24.0%
Switzerland 0.1% -0.021 -5.8% 0.0% 31.9% 31.9% 29.9% 24.0%
Thailand 0.2% -0.021 -7.7% -1.9% 40.1% 42.0% 29.9% 24.0%
Turkey 0.1% -0.021 -2.6% 3.2% 43.2% 40.0% 29.9% 24.0%
United Kingdom 0.1% -0.021 -5.8% 0.0% 21.8% 21.8% 29.9% 24.0%
United States 0.1% -0.021 -5.6% 0.2% 29.4% 29.2% 29.9% 24.0%
Euro Area (agg) 0.1% -0.021 -2.7% 3.1% 22.4% 19.3% 29.9% 24.0%
1/ Private Credit/GDP after removing country mean.
2/ (P-P_wo) - (P*-P*_wo).
Table 6. Breakdown of 2016 Policy Gap Contribution: Private Credit/GDP 1/

Contri-
butionbeta (P-P*) P P*
PPP
GDP 2/
Contri-
butionbeta (P-P*) P P*
Contri-
butionbeta (P-P*) P P*
Australia 0.0% 0.0% 0.05 0.0% 33.8% 33.8% 38.6% 0.0% 0.04 0.0% -4.1% -4.1% 0.0% -0.09 0.0% 0.0% 0.0%
Belgium 0.0% 0.0% 0.05 0.0% 33.3% 33.3% 33.3% 0.0% 0.04 0.0% -4.6% -4.6% 0.0% -0.09 0.0% -1.0% -1.0%
Brazil 0.1% 0.1% 0.05 2.5% -20.9% -23.4% -27.8% 0.0% 0.04 0.4% -3.5% -3.9% 0.0% -0.09 0.0% 0.0% 0.0%
Canada 0.0% 0.0% 0.05 0.0% 32.2% 32.2% 32.2% 0.0% 0.04 0.0% -4.6% -4.6% 0.0% -0.09 0.0% 0.0% 0.0%
China 0.6% 0.5% 0.05 10.9% -16.1% -27.0% -32.1% 0.1% 0.04 1.6% -2.3% -3.9% 0.0% -0.09 0.0% 0.0% 0.0%
France 0.0% 0.0% 0.05 0.0% 31.0% 31.0% 31.0% 0.0% 0.04 0.0% -4.6% -4.6% 0.0% -0.09 0.0% -1.0% -1.0%
Germany 0.0% 0.0% 0.05 0.0% 38.1% 38.1% 38.1% 0.0% 0.04 0.0% -4.6% -4.6% 0.0% -0.09 0.0% -1.0% -1.0%
India 0.8% 0.7% 0.05 15.5% -22.8% -38.3% -45.7% 0.1% 0.04 1.6% -2.3% -3.9% 0.0% -0.09 0.0% 0.0% 0.0%
Indonesia 0.4% 0.4% 0.05 7.7% -22.6% -30.3% -36.1% 0.0% 0.04 1.0% -2.9% -3.9% 0.0% -0.09 0.0% 0.0% 0.0%
Italy 0.0% 0.0% 0.05 0.0% 17.3% 17.3% 17.3% 0.0% 0.04 0.0% -4.6% -4.6% 0.0% -0.09 0.0% -1.0% -1.0%
Japan 0.0% 0.0% 0.05 0.0% 30.7% 30.7% 30.7% 0.0% 0.04 0.0% -4.6% -4.6% 0.0% -0.09 0.0% -0.2% -0.2%
Korea 0.0% 0.0% 0.05 0.0% 7.7% 7.7% 8.8% 0.0% 0.04 0.0% -4.1% -4.1% 0.0% -0.09 0.0% 0.0% 0.0%
Malaysia 0.1% 0.1% 0.05 1.7% -4.9% -6.5% -7.8% 0.0% 0.04 1.0% -2.9% -3.9% 0.0% -0.09 0.0% 0.0% 0.0%
Mexico 0.2% 0.2% 0.05 4.4% -13.0% -17.4% -20.8% 0.0% 0.04 1.0% -2.9% -3.9% 0.0% -0.09 0.0% 0.0% 0.0%
Netherlands 0.0% 0.0% 0.05 0.0% 43.9% 43.9% 43.9% 0.0% 0.04 0.0% -4.6% -4.6% 0.0% -0.09 0.0% -1.0% -1.0%
Poland 0.0% 0.0% 0.05 0.6% -5.2% -5.8% -6.9% 0.0% 0.04 0.4% -3.5% -3.9% 0.0% -0.09 0.0% 0.0% 0.0%
Russia 0.0% 0.0% 0.05 0.0% -7.0% -7.0% -8.0% 0.0% 0.04 0.0% -4.1% -4.1% 0.0% -0.09 0.0% 0.0% 0.0%
South Africa 0.1% 0.1% 0.05 2.8% -23.5% -26.3% -31.4% 0.0% 0.04 0.4% -3.5% -3.9% 0.0% -0.09 0.0% 0.0% 0.0%
Spain 0.0% 0.0% 0.05 0.0% 12.1% 12.1% 12.1% 0.0% 0.04 0.0% -4.6% -4.6% 0.0% -0.09 0.0% -1.0% -1.0%
Sweden 0.0% 0.0% 0.05 0.0% 45.2% 45.2% 45.2% 0.0% 0.04 0.0% -4.6% -4.6% 0.0% -0.09 0.0% 0.0% 0.0%
Switzerland 0.0% 0.0% 0.05 0.0% 59.1% 59.1% 59.1% 0.0% 0.04 0.0% -4.6% -4.6% 0.0% -0.09 0.0% 0.0% 0.0%
Thailand 0.1% 0.1% 0.05 2.5% -21.1% -23.6% -28.2% 0.0% 0.04 0.4% -3.5% -3.9% 0.0% -0.09 0.0% 0.0% 0.0%
Turkey 0.1% 0.0% 0.05 0.9% -7.2% -8.1% -9.6% 0.0% 0.04 0.4% -3.5% -3.9% 0.0% -0.09 0.0% 0.0% 0.0%
United Kingdom 0.0% 0.0% 0.05 0.0% 28.2% 28.2% 28.2% 0.0% 0.04 0.0% -4.6% -4.6% 0.0% -0.09 0.0% -0.2% -0.2%
United States 0.0% 0.0% 0.05 0.0% 55.7% 55.7% 55.7% 0.0% 0.04 0.0% -4.6% -4.6% 0.0% -0.09 0.0% -3.1% -3.1%
Euro Area (agg) 0.0% 0.0% 0.05 0.0% 29.9% 29.9% 30.0% 0.0% 0.04 0.0% -4.6% -4.6% 0.0% -0.09 0.0% -1.0% -1.0%
1/ Before small Multilateral Consistency adjustment.
2/ Lagged PPP GDP per working population(15-64) relative to average of (US+Japan+Germany), demeaned of overall sample mean.
Table 7. Breakdown of 2016 Policy Gap Contribution: Capital Controls 1/
Overall
Contri-
bution
Lagged [ demeaned PPP GDP per working pop.
relative to (US+JPN+DEU)*(1- Capital Control)]Lagged [VIX * (1-Capital Control)]
Lagged [VIX * (1-Capital Control) *
share of own currency in world reserve]
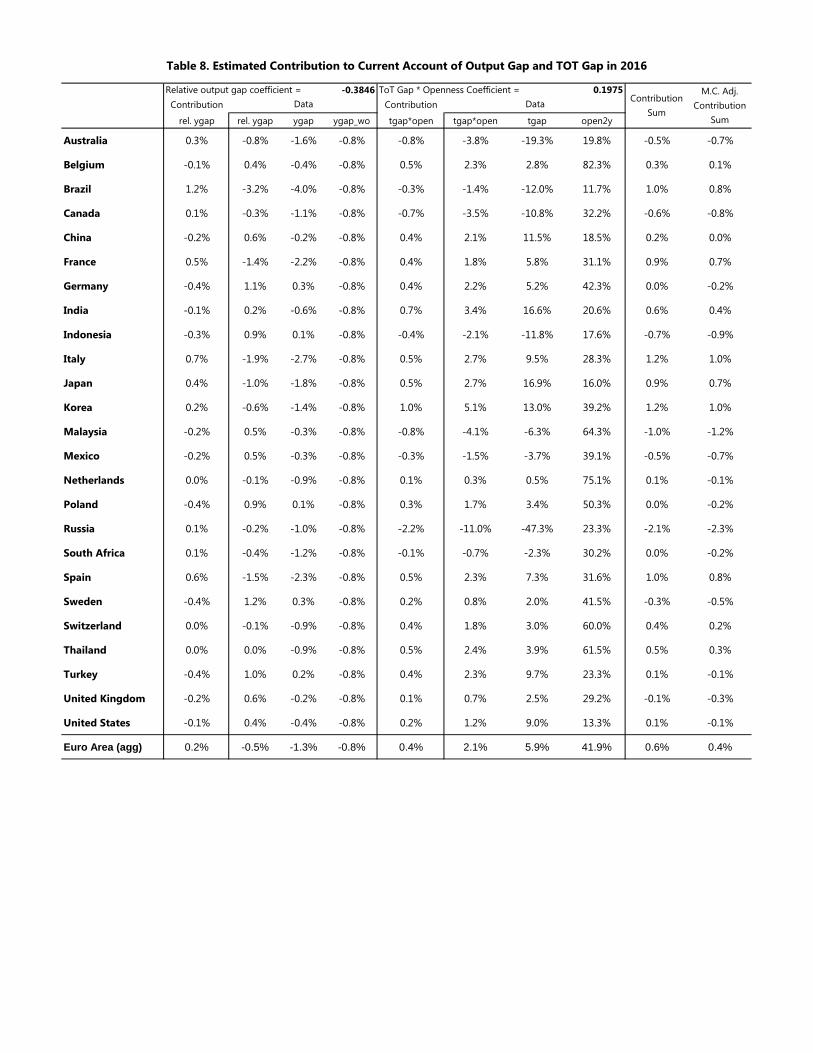
Relative output gap coefficient = -0.3846 ToT Gap * Openness Coefficient = 0.1975
Contribution Contribution
rel. ygap rel. ygap ygap ygap_wo tgap*open tgap*open tgap open2y
Australia 0.3% -0.8% -1.6% -0.8% -0.8% -3.8% -19.3% 19.8% -0.5% -0.7%
Belgium -0.1% 0.4% -0.4% -0.8% 0.5% 2.3% 2.8% 82.3% 0.3% 0.1%
Brazil 1.2% -3.2% -4.0% -0.8% -0.3% -1.4% -12.0% 11.7% 1.0% 0.8%
Canada 0.1% -0.3% -1.1% -0.8% -0.7% -3.5% -10.8% 32.2% -0.6% -0.8%
China -0.2% 0.6% -0.2% -0.8% 0.4% 2.1% 11.5% 18.5% 0.2% 0.0%
France 0.5% -1.4% -2.2% -0.8% 0.4% 1.8% 5.8% 31.1% 0.9% 0.7%
Germany -0.4% 1.1% 0.3% -0.8% 0.4% 2.2% 5.2% 42.3% 0.0% -0.2%
India -0.1% 0.2% -0.6% -0.8% 0.7% 3.4% 16.6% 20.6% 0.6% 0.4%
Indonesia -0.3% 0.9% 0.1% -0.8% -0.4% -2.1% -11.8% 17.6% -0.7% -0.9%
Italy 0.7% -1.9% -2.7% -0.8% 0.5% 2.7% 9.5% 28.3% 1.2% 1.0%
Japan 0.4% -1.0% -1.8% -0.8% 0.5% 2.7% 16.9% 16.0% 0.9% 0.7%
Korea 0.2% -0.6% -1.4% -0.8% 1.0% 5.1% 13.0% 39.2% 1.2% 1.0%
Malaysia -0.2% 0.5% -0.3% -0.8% -0.8% -4.1% -6.3% 64.3% -1.0% -1.2%
Mexico -0.2% 0.5% -0.3% -0.8% -0.3% -1.5% -3.7% 39.1% -0.5% -0.7%
Netherlands 0.0% -0.1% -0.9% -0.8% 0.1% 0.3% 0.5% 75.1% 0.1% -0.1%
Poland -0.4% 0.9% 0.1% -0.8% 0.3% 1.7% 3.4% 50.3% 0.0% -0.2%
Russia 0.1% -0.2% -1.0% -0.8% -2.2% -11.0% -47.3% 23.3% -2.1% -2.3%
South Africa 0.1% -0.4% -1.2% -0.8% -0.1% -0.7% -2.3% 30.2% 0.0% -0.2%
Spain 0.6% -1.5% -2.3% -0.8% 0.5% 2.3% 7.3% 31.6% 1.0% 0.8%
Sweden -0.4% 1.2% 0.3% -0.8% 0.2% 0.8% 2.0% 41.5% -0.3% -0.5%
Switzerland 0.0% -0.1% -0.9% -0.8% 0.4% 1.8% 3.0% 60.0% 0.4% 0.2%
Thailand 0.0% 0.0% -0.9% -0.8% 0.5% 2.4% 3.9% 61.5% 0.5% 0.3%
Turkey -0.4% 1.0% 0.2% -0.8% 0.4% 2.3% 9.7% 23.3% 0.1% -0.1%
United Kingdom -0.2% 0.6% -0.2% -0.8% 0.1% 0.7% 2.5% 29.2% -0.1% -0.3%
United States -0.1% 0.4% -0.4% -0.8% 0.2% 1.2% 9.0% 13.3% 0.1% -0.1%
Euro Area (agg) 0.2% -0.5% -1.3% -0.8% 0.4% 2.1% 5.9% 41.9% 0.6% 0.4%
Table 8. Estimated Contribution to Current Account of Output Gap and TOT Gap in 2016
Contribution
Sum
M.C. Adj.
Contribution
Sum
Data Data

VARIABLESSpecification
(1986-2013)
L. NFA/Y 0.015**
(0.016)
L. NFA/Y*(dummy if NFA/Y < -60%) -0.009
(0.493)
Financial Center Dummy 0.027***
(0.000)
L.Output per worker, relative to top 3 economies 0.033
(0.143)
L.Relative output per worker*K openness 0.046**
(0.043)
Oil and Natural Gas Trade Balance * resource temporariness # 0.410***
(0.000)
Dependency Ratio # -0.057
(0.312)
Population Growth # -0.565
(0.168)
GDP growth, forecast in 5 years # -0.425***
(0.000)
L.Public Health Spending/GDP # -0.503***
(0.000)
L.demeaned VIX*K openness 0.040**
(0.011)
L.demeaned VIX*K openness*share in world reserves -0.093
(0.177)
Own currency’s share in world reserves -0.041***
(0.000)
Output Gap # -0.385***
(0.000)
Commodity ToTgap*Trade Openness 0.197***
(0.000)
Safer Institutional/Political Environment (index) # -0.109***
(0.000)
Demeaned Private Credit/GDP # -0.021***
(0.005)
Cyclically adjusted Fiscal Balance, instrumented # 0.470***
(0.000)
(∆Reserves)/GDP* K controls, instrumented # 0.449**
(0.024)
rel. Dependency Ratio*Aging Speed 0.130***
(0.000)
rel. Aging Speed * Dependency Ratio 0.088**
(0.039)
Constant -0.014***
(0.000)
Observations 1,197
Number of countries 49
Root MSE 0.032
P-values of Het-corrected z-statistics in brackets
* significant at 10%; ** significant at 5%; *** significant at 1% "L." denotes one year lag.
Note: variables denoted with #are constructed relative to a (GDP-weighted) country sample average, in each year.
Table 9. EBA Analysis of 2016 CA: Coefficients

SECTION II—REER REGRESSION-BASED ANALYSIS: INDEX REER
This section contains results from the EBA analysis of 2016 (year average) REER index values. The summary table identifies a Total (Index) REER Gap as the sum of two parts: a gap that arises from the estimated contributions of policy gaps, and a gap that is the regression residual. Here the contributions of policy gaps refer to 5 types of policies, the contributions of which are also shown separately. The contributions of each policy gap are calculated analogously to the procedure used for the CA analysis, as described in the previous section. The REER gap estimates are adjusted for multilateral consistency. The second table breaks down the policy gap contributions into the 5 types of policies covered by EBA’s REER regression-based analysis. As with the CA tables, for each policy gap, the reported estimates show both the total contribution but also the subcomponent that is “domestic”. The tables on the subsequent pages give details of each of the estimated policy gap contributions to REER.

SumHealth
Exp.
Capital
ControlReserves
Private
Credit
Real
Interest
Rate
Memo:
June'17 REER,
% dev. from
2016 avg. REER
(GDS)
Australia 4.1% -1.8% -0.7% 0.0% -0.3% -0.6% -0.2% 5.9% 0.9%
Belgium 5.2% -0.8% 0.3% 0.0% -0.1% -0.4% -0.6% 6.0% 1.7%
Brazil -10.7% -3.0% -0.5% -1.3% -0.4% -0.4% -0.3% -7.7% 13.6%
Canada -9.5% 0.5% -0.2% 0.0% -0.2% 1.0% -0.2% -9.9% -2.0%
China -2.7% -1.1% -2.5% -5.8% 3.5% 3.9% -0.2% -1.6% -2.2%
France -2.4% 0.3% 0.1% 0.0% -0.2% -0.6% 0.9% -2.7% 0.7%
Germany 4.0% -0.1% 0.1% 0.0% -0.2% -0.5% 0.5% 4.1% 0.0%
India 7.2% -9.5% 0.2% -8.1% -0.8% -0.3% -0.6% 16.7% 11.3%
Indonesia -1.1% -7.0% -0.8% -4.1% -1.1% -0.7% -0.3% 5.9% 1.8%
Italy -0.2% -0.1% 0.1% 0.0% -0.2% -0.5% 0.4% -0.1% 0.4%
Japan -20.9% -1.3% 0.7% 0.0% -0.7% -1.1% -0.2% -19.6% -3.1%
Korea -1.5% -3.1% -0.8% 0.0% -1.1% -1.1% -0.1% 1.6% 2.5%
Malaysia -34.6% -3.9% -1.9% -1.1% -0.8% 0.1% -0.3% -30.7% -2.8%
Mexico -30.7% -4.8% -1.5% -2.5% -0.2% -0.3% -0.3% -25.9% 2.6%
Netherlands -3.0% 0.0% 0.1% 0.0% -0.1% -0.4% 0.4% -3.0% 0.1%
Poland -9.6% -3.9% -0.5% -0.4% -1.4% -1.0% -0.6% -5.8% 2.9%
Russia -23.6% -0.8% -1.2% 0.0% -0.3% -0.5% 1.2% -22.8% 26.5%
South Africa -28.8% -2.3% 0.3% -1.5% -0.2% -0.5% -0.3% -26.5% 18.1%
Spain 6.5% 3.9% 0.1% 0.0% -0.1% 3.5% 0.4% 2.7% 0.2%
Sweden -20.4% -0.8% -0.1% 0.0% -0.1% 0.6% -1.1% -19.6% -1.8%
Switzerland 12.6% 0.0% 0.1% 0.0% -0.1% -0.4% 0.4% 12.6% -0.1%
Thailand -6.3% -3.7% 0.1% -1.3% -1.8% -0.9% 0.2% -2.5% 1.7%
Turkey 0.5% -0.7% 0.3% -0.5% 0.0% 0.0% -0.4% 1.2% -9.0%
United Kingdom 3.2% -1.0% 0.1% 0.0% -0.2% -0.5% -0.5% 4.3% -5.7%
United States 15.8% 0.3% 1.5% 0.0% -0.4% -0.8% 0.0% 15.5% -0.6%
Euro Area 2.4% 0.4% 0.2% 0.0% -0.2% -0.1% 0.4% 2.0% -0.4%
/a For multilateral consistency, adjusted by the weighted average of the 2016 regression residuals (subtracting -2.7%).
Table 10. EBA Analysis of the 2016 REER
Total REER
Gap /a
Net Contributions of Policy Gaps
Residual /a

Total Dom. Total Dom. Total Dom. Total Dom. Total Dom. Total Dom.
Australia -1.8% -1.0% -0.7% -1.0% 0.0% 0.0% -0.3% -0.1% -0.6% 0.0% -0.2% 0.0%
Belgium -0.8% 0.1% 0.3% 0.2% 0.0% 0.0% -0.1% 0.0% -0.4% 0.0% -0.6% -0.1%
Brazil -3.0% -2.5% -0.5% -0.7% -1.3% -1.3% -0.4% -0.2% -0.4% 0.0% -0.3% -0.2%
Canada 0.5% 1.3% -0.2% 0.0% 0.0% 0.0% -0.2% 0.0% 1.0% 1.3% -0.2% 0.0%
China -1.1% -1.0% -2.5% -2.5% -5.8% -5.8% 3.5% 3.4% 3.9% 4.0% -0.2% 0.0%
France 0.3% 1.3% 0.1% 0.0% 0.0% 0.0% -0.2% 0.0% -0.6% 0.0% 0.9% 1.3%
Germany -0.1% 0.9% 0.1% 0.0% 0.0% 0.0% -0.2% 0.0% -0.5% 0.0% 0.5% 0.9%
India -9.5% -8.7% 0.2% -0.1% -8.1% -8.1% -0.8% -0.4% -0.3% 0.4% -0.6% -0.4%
Indonesia -7.0% -6.4% -0.8% -1.2% -4.1% -4.1% -1.1% -0.8% -0.7% -0.1% -0.3% -0.1%
Italy -0.1% 0.9% 0.1% 0.0% 0.0% 0.0% -0.2% 0.0% -0.5% 0.0% 0.4% 0.9%
Japan -1.3% 0.0% 0.7% 0.0% 0.0% 0.0% -0.7% 0.0% -1.1% 0.0% -0.2% 0.0%
Korea -3.1% -1.7% -0.8% -1.4% 0.0% 0.0% -1.1% -0.3% -1.1% 0.0% -0.1% 0.0%
Malaysia -3.9% -3.0% -1.9% -2.2% -1.1% -1.1% -0.8% -0.3% 0.1% 0.8% -0.3% -0.1%
Mexico -4.8% -3.9% -1.5% -1.2% -2.5% -2.5% -0.2% 0.0% -0.3% 0.0% -0.3% -0.2%
Netherlands 0.0% 0.9% 0.1% 0.0% 0.0% 0.0% -0.1% 0.0% -0.4% 0.0% 0.4% 0.9%
Poland -3.9% -3.0% -0.5% -0.7% -0.4% -0.4% -1.4% -1.2% -1.0% -0.6% -0.6% -0.1%
Russia -0.8% 0.0% -1.2% -1.5% 0.0% 0.0% -0.3% 0.0% -0.5% 0.0% 1.2% 1.5%
South Africa -2.3% -1.6% 0.3% 0.0% -1.5% -1.5% -0.2% 0.0% -0.5% 0.0% -0.3% -0.1%
Spain 3.9% 4.6% 0.1% 0.0% 0.0% 0.0% -0.1% 0.0% 3.5% 3.7% 0.4% 0.9%
Sweden -0.8% 0.1% -0.1% -0.2% 0.0% 0.0% -0.1% 0.0% 0.6% 1.0% -1.1% -0.7%
Switzerland 0.0% 0.9% 0.1% 0.0% 0.0% 0.0% -0.1% 0.0% -0.4% 0.0% 0.4% 0.9%
Thailand -3.7% -3.0% 0.1% -0.3% -1.3% -1.3% -1.8% -1.4% -0.9% -0.2% 0.2% 0.3%
Turkey -0.7% 0.0% 0.3% 0.0% -0.5% -0.5% 0.0% 0.1% 0.0% 0.4% -0.4% 0.0%
United Kingdom -1.0% 0.0% 0.1% 0.0% 0.0% 0.0% -0.2% 0.0% -0.5% 0.0% -0.5% 0.0%
United States 0.3% 1.0% 1.5% 0.9% 0.0% 0.0% -0.4% 0.0% -0.8% 0.0% 0.0% 0.1%
Table 11. EBA - Estimated Policy Gap Contributions to 2016 lndex REER
All (sum) Health Exp. Capital Controls ∆ in Reserves Private Credit Interest Rate

Overall
ContributionCoef.
Pol. Gap
(1)-(3) -
{(2)-(4)}
P - P*
(1) - (2)
P
(1)
P*
(2)
P (Trading
partners)
(3)
P* (Trading
partners)
(4)
P*
benchmark
from cross-
country
regression a/
Australia -0.7% 1.23 -0.6% -0.8% 6.0% 6.8% 6.3% 6.4% 6.9%
Belgium 0.3% 1.23 0.2% 0.1% 8.2% 8.1% 7.1% 7.2% 6.7%
Brazil -0.5% 1.23 -0.4% -0.6% 4.1% 4.7% 6.4% 6.6% 4.0%
Canada -0.2% 1.23 -0.2% 0.0% 7.6% 7.6% 7.0% 6.9% 6.8%
China -2.5% 1.23 -2.0% -2.1% 1.7% 3.8% 6.9% 6.9% 3.8%
France 0.1% 1.23 0.1% 0.0% 8.9% 8.9% 7.0% 7.1% 7.6%
Germany 0.1% 1.23 0.1% 0.0% 8.7% 8.7% 6.7% 6.8% 8.0%
India 0.2% 1.23 0.2% -0.1% 1.4% 1.5% 6.3% 6.6% 2.1%
Indonesia -0.8% 1.23 -0.7% -1.0% 1.4% 2.4% 6.0% 6.4% 3.0%
Italy 0.1% 1.23 0.1% 0.0% 7.1% 7.1% 7.1% 7.2% 7.6%
Japan 0.7% 1.23 0.6% 0.0% 8.4% 8.4% 5.2% 5.8% 8.2%
Korea -0.8% 1.23 -0.7% -1.2% 4.1% 5.3% 5.7% 6.2% 5.3%
Malaysia -1.9% 1.23 -1.5% -1.8% 2.0% 3.8% 6.0% 6.3% 4.8%
Mexico -1.5% 1.23 -1.2% -1.0% 3.1% 4.1% 7.2% 7.0% 4.0%
Netherlands 0.1% 1.23 0.1% 0.0% 9.5% 9.5% 7.1% 7.2% 7.2%
Poland -0.5% 1.23 -0.4% -0.5% 4.7% 5.2% 7.3% 7.4% 5.5%
Russia -1.2% 1.23 -1.0% -1.2% 4.1% 5.3% 6.5% 6.7% 5.7%
South Africa 0.3% 1.23 0.2% 0.0% 4.0% 4.0% 6.6% 6.8% 4.0%
Spain 0.1% 1.23 0.1% 0.0% 7.1% 7.1% 7.2% 7.2% 6.5%
Sweden -0.1% 1.23 -0.1% -0.2% 7.9% 8.0% 7.2% 7.2% 8.2%
Switzerland 0.1% 1.23 0.0% 0.0% 7.5% 7.5% 7.2% 7.3% 7.4%
Thailand 0.1% 1.23 0.1% -0.3% 3.0% 3.3% 6.1% 6.5% 4.2%
Turkey 0.3% 1.23 0.2% 0.0% 3.6% 3.6% 6.7% 6.9% 4.4%
United Kingdom 0.1% 1.23 0.1% 0.0% 7.8% 7.8% 7.0% 7.1% 7.3%
United States 1.5% 1.23 1.2% 0.7% 8.0% 7.3% 5.7% 6.2% 7.3%
Table 12. Breakdown of 2016 Policy Gap Contribution: Public Expenditure on Health / GDP
/a Fitted value from a cross-country regression of public health expenditure on relative per capita income, old age dependency, and income
inequality (Gini coefficient). For reference; desk value may differ.

Overall
Contribution
Contri-
butionCoef.
Policy Gap
(5)-(6)
P
(5)
P*
(6)
Demeaned
Lagged
GDPpw 2\
Contri-
butionCoef.
Policy Gap
(7)-(8)
P
(7)
P*
(8)
Contri-
butionCoef.
Policy Gap
(9)-(10)
P
(9)
P*
(10)
Australia 0.0% 0.0% -0.49 0.0% 33.8% 33.8% 0.39 0.0% -0.26 0.0% -4.1% -4.1% 0.0% 0.84 0.0% 0.0% 0.0%
Belgium 0.0% 0.0% -0.49 0.0% 33.3% 33.3% 0.33 0.0% -0.26 0.0% -4.7% -4.7% 0.0% 0.84 0.0% -1.0% -1.0%
Brazil -1.3% -1.2% -0.49 2.5% -20.9% -23.4% -0.28 -0.1% -0.26 0.4% -3.5% -4.0% 0.0% 0.84 0.0% 0.0% 0.0%
Canada 0.0% 0.0% -0.49 0.0% 32.2% 32.2% 0.32 0.0% -0.26 0.0% -4.7% -4.7% 0.0% 0.84 0.0% 0.0% 0.0%
China -5.8% -5.4% -0.49 10.9% -16.1% -27.0% -0.32 -0.4% -0.26 1.6% -2.4% -4.0% 0.0% 0.84 0.0% 0.0% 0.0%
France 0.0% 0.0% -0.49 0.0% 31.0% 31.0% 0.31 0.0% -0.26 0.0% -4.7% -4.7% 0.0% 0.84 0.0% -1.0% -1.0%
Germany 0.0% 0.0% -0.49 0.0% 38.1% 38.1% 0.38 0.0% -0.26 0.0% -4.7% -4.7% 0.0% 0.84 0.0% -1.0% -1.0%
India -8.1% -7.6% -0.49 15.5% -22.8% -38.3% -0.46 -0.4% -0.26 1.6% -2.4% -4.0% 0.0% 0.84 0.0% 0.0% 0.0%
Indonesia -4.1% -3.8% -0.49 7.7% -22.6% -30.3% -0.36 -0.3% -0.26 1.0% -3.0% -4.0% 0.0% 0.84 0.0% 0.0% 0.0%
Italy 0.0% 0.0% -0.49 0.0% 17.3% 17.3% 0.17 0.0% -0.26 0.0% -4.7% -4.7% 0.0% 0.84 0.0% -1.0% -1.0%
Japan 0.0% 0.0% -0.49 0.0% 30.7% 30.7% 0.31 0.0% -0.26 0.0% -4.7% -4.7% 0.0% 0.84 0.0% -0.2% -0.2%
Korea 0.0% 0.0% -0.49 0.0% 7.7% 7.7% 0.09 0.0% -0.26 0.0% -4.1% -4.1% 0.0% 0.84 0.0% 0.0% 0.0%
Malaysia -1.1% -0.8% -0.49 1.7% -4.9% -6.5% -0.08 -0.3% -0.26 1.0% -3.0% -4.0% 0.0% 0.84 0.0% 0.0% 0.0%
Mexico -2.5% -2.2% -0.49 4.4% -13.0% -17.4% -0.21 -0.3% -0.26 1.0% -3.0% -4.0% 0.0% 0.84 0.0% 0.0% 0.0%
Netherlands 0.0% 0.0% -0.49 0.0% 43.9% 43.9% 0.44 0.0% -0.26 0.0% -4.7% -4.7% 0.0% 0.84 0.0% -1.0% -1.0%
Poland -0.4% -0.3% -0.49 0.6% -5.2% -5.8% -0.07 -0.1% -0.26 0.4% -3.5% -4.0% 0.0% 0.84 0.0% 0.0% 0.0%
Russia 0.0% 0.0% -0.49 0.0% -7.0% -7.0% -0.08 0.0% -0.26 0.0% -4.1% -4.1% 0.0% 0.84 0.0% 0.0% 0.0%
South Africa -1.5% -1.4% -0.49 2.8% -23.5% -26.3% -0.31 -0.1% -0.26 0.4% -3.5% -4.0% 0.0% 0.84 0.0% 0.0% 0.0%
Spain 0.0% 0.0% -0.49 0.0% 12.1% 12.1% 0.12 0.0% -0.26 0.0% -4.7% -4.7% 0.0% 0.84 0.0% -1.0% -1.0%
Sweden 0.0% 0.0% -0.49 0.0% 45.2% 45.2% 0.45 0.0% -0.26 0.0% -4.7% -4.7% 0.0% 0.84 0.0% 0.0% 0.0%
Switzerland 0.0% 0.0% -0.49 0.0% 59.1% 59.1% 0.59 0.0% -0.26 0.0% -4.7% -4.7% 0.0% 0.84 0.0% 0.0% 0.0%
Thailand -1.3% -1.2% -0.49 2.5% -21.1% -23.6% -0.28 -0.1% -0.26 0.4% -3.5% -4.0% 0.0% 0.84 0.0% 0.0% 0.0%
Turkey -0.5% -0.4% -0.49 0.9% -7.2% -8.1% -0.10 -0.1% -0.26 0.4% -3.5% -4.0% 0.0% 0.84 0.0% 0.0% 0.0%
United Kingdom 0.0% 0.0% -0.49 0.0% 28.2% 28.2% 0.28 0.0% -0.26 0.0% -4.7% -4.7% 0.0% 0.84 0.0% -0.2% -0.2%
United States 0.0% 0.0% -0.49 0.0% 55.7% 55.7% 0.56 0.0% -0.26 0.0% -4.7% -4.7% 0.0% 0.84 0.0% -3.1% -3.1%
1/ Capital Account Openness defined as (1- Capital Account Controls)
2/ Lagged PPP GDP per working population(15-64) relative to average of (US+Japan+Germany), demeaned of overall sample mean
Table 13. Breakdown of 2016 Policy Gap Contribution: Capital Controls
P= Lagged [ demeaned PPP GDP per working pop. relative to
(US+JPN+DEU)*(Capital Account Openness)] 1\P= Lagged [VIX * (Capital account openness)] 1\
P= Lagged [VIX * Capital Account Openness * Share of
own currency in world reserve] 2\

Overall
ContributionCoef.
Pol. Gap (1)-
(3) -
{(2)-(4)}
P - P*
(1) - (2)
P /a
(1)
P*
(2)
P (Trading
partners)
(3)
P*
(Trading
partners)
(4)
Reserves
to GDP
(Reserves
to GDP)*
Capital
Controls
(Capital
Controls)*
Australia -0.3% -1.73 0.2% 0.0% 0.1% 0.0% -0.1% 0.0% 0.6% 0.2% 12.5% 12.5%
Belgium -0.1% -1.73 0.1% 0.0% 0.0% 0.0% -0.1% 0.0% -0.2% -0.2% 0.0% 0.0%
Brazil -0.4% -1.73 0.2% 0.1% 0.1% 0.0% 0.0% 0.1% 0.5% 0.0% 25.0% 16.1%
Canada -0.2% -1.73 0.1% 0.0% 0.0% 0.0% -0.1% 0.0% 0.4% 0.0% 0.0% 0.0%
China 3.5% -1.73 -2.0% -2.0% -2.0% 0.0% 0.1% 0.0% -3.9% 0.0% 50.0% 16.1%
France -0.2% -1.73 0.1% 0.0% 0.0% 0.0% -0.1% 0.0% 0.1% 0.0% 0.0% 0.0%
Germany -0.2% -1.73 0.1% 0.0% 0.0% 0.0% -0.1% 0.0% 0.1% 0.0% 0.0% 0.0%
India -0.8% -1.73 0.5% 0.3% 0.5% 0.2% -0.2% 0.0% 0.9% 1.2% 50.0% 16.1%
Indonesia -1.1% -1.73 0.7% 0.5% 0.5% 0.0% -0.1% 0.0% 1.3% 0.0% 37.5% 16.1%
Italy -0.2% -1.73 0.1% 0.0% 0.0% 0.0% -0.1% 0.0% -0.1% 0.0% 0.0% 0.0%
Japan -0.7% -1.73 0.4% 0.0% 0.0% 0.0% -0.4% 0.0% -0.1% 0.2% 0.0% 0.0%
Korea -1.1% -1.73 0.6% 0.1% 0.1% -0.1% -0.4% 0.0% 0.5% -0.7% 12.5% 12.5%
Malaysia -0.8% -1.73 0.4% 0.2% 0.5% 0.3% -0.2% 0.0% 1.2% 1.6% 37.5% 16.1%
Mexico -0.2% -1.73 0.1% 0.0% 0.0% 0.0% -0.1% 0.0% 0.0% 0.0% 37.5% 16.1%
Netherlands -0.1% -1.73 0.1% 0.0% 0.0% 0.0% -0.1% 0.0% -0.4% 0.1% 0.0% 0.0%
Poland -1.4% -1.73 0.8% 0.7% 1.2% 0.5% -0.1% 0.0% 4.8% 3.1% 25.0% 16.1%
Russia -0.3% -1.73 0.2% 0.0% 0.1% 0.1% -0.1% 0.0% 0.6% 0.6% 12.5% 12.5%
South Africa -0.2% -1.73 0.1% 0.0% 0.2% 0.2% -0.1% 0.0% 0.9% 1.5% 25.0% 16.1%
Spain -0.1% -1.73 0.1% 0.0% 0.0% 0.0% 0.0% 0.0% 0.7% 0.0% 0.0% 0.0%
Sweden -0.1% -1.73 0.1% 0.0% 0.0% 0.0% -0.1% 0.0% 0.8% 0.0% 0.0% 0.0%
Switzerland -0.1% -1.73 0.1% 0.0% 0.0% 0.0% -0.1% 0.0% 0.8% 3.5% 0.0% 0.0%
Thailand -1.8% -1.73 1.0% 0.8% 0.8% 0.0% -0.2% 0.0% 3.2% 0.0% 25.0% 16.1%
Turkey 0.0% -1.73 0.0% -0.1% 0.0% 0.1% -0.1% 0.0% 0.1% 0.6% 25.0% 16.1%
United Kingdom -0.2% -1.73 0.1% 0.0% 0.0% 0.0% -0.1% 0.0% 0.3% 0.5% 0.0% 0.0%
United States -0.4% -1.73 0.2% 0.0% 0.0% 0.0% -0.2% 0.0% 0.0% 0.0% 0.0% 0.0%
/a For multilateral consistency, adjusted by the weighted average of the 2016 regression residuals (subtracting -9%).
Table 14. Breakdown of 2016 Policy Gap Contribution: Change in FX Reserves / GDP
Components

Overall
ContributionCoef.
Pol. Gap (1)-
(3) -
{(2)-(4)}
P - P*
(1) - (2)
P /a
(1)
P*
(2)
P (Trading
partners)
(3)
P* (Trading
partners)
(4)
Australia -0.6% 0.13 -4.3% 0.0% 51.2% 51.2% 29.7% 25.4%
Belgium -0.4% 0.13 -3.1% 0.0% 25.8% 25.8% 24.6% 21.5%
Brazil -0.4% 0.13 -3.4% 0.0% 26.7% 26.7% 27.2% 23.8%
Canada 1.0% 0.13 7.6% 10.0% 53.0% 43.0% 28.4% 26.0%
China 3.9% 0.13 29.1% 30.0% 56.2% 26.2% 22.1% 21.3%
France -0.6% 0.13 -4.3% 0.0% 10.3% 10.3% 27.5% 23.3%
Germany -0.5% 0.13 -3.7% 0.0% -5.4% -5.4% 31.0% 27.3%
India -0.3% 0.13 -2.0% 2.6% 17.6% 15.0% 28.6% 24.0%
Indonesia -0.7% 0.13 -5.5% -0.8% 2.1% 2.9% 28.3% 23.6%
Italy -0.5% 0.13 -3.6% 0.0% 45.0% 45.0% 23.6% 20.0%
Japan -1.1% 0.13 -8.0% 0.0% 6.2% 6.2% 33.4% 25.4%
Korea -1.1% 0.13 -8.2% 0.0% 31.0% 31.0% 29.6% 21.4%
Malaysia 0.1% 0.13 0.8% 6.0% 13.7% 7.7% 28.7% 23.5%
Mexico -0.3% 0.13 -2.6% 0.0% 12.8% 12.8% 29.4% 26.8%
Netherlands -0.4% 0.13 -3.1% 0.0% 78.9% 78.9% 21.9% 18.7%
Poland -1.0% 0.13 -7.2% -4.5% 27.5% 32.0% 22.4% 19.7%
Russia -0.5% 0.13 -4.1% 0.0% 8.6% 8.6% 28.3% 24.2%
South Africa -0.5% 0.13 -3.9% 0.0% 34.5% 34.5% 27.1% 23.2%
Spain 3.5% 0.13 26.3% 28.1% 60.1% 32.0% 24.0% 22.2%
Sweden 0.6% 0.13 4.2% 7.2% 76.7% 69.5% 25.3% 22.4%
Switzerland -0.4% 0.13 -2.8% 0.0% 31.9% 31.9% 21.8% 19.0%
Thailand -0.9% 0.13 -7.0% -1.9% 40.1% 42.0% 25.9% 20.8%
Turkey 0.0% 0.13 0.0% 3.2% 43.2% 40.0% 25.7% 22.6%
United Kingdom -0.5% 0.13 -3.6% 0.0% 21.8% 21.8% 25.9% 22.3%
United States -0.8% 0.13 -6.0% 0.2% 29.4% 29.2% 28.6% 22.4%
/a For multilateral consistency, adjusted by the weighted average of the 2016 regression residuals (subtracting -9%).
Table 15. Breakdown of 2016 Policy Gap Contribution: Private Credit / GDP (after removing country mean)

Overall
ContributionCoef.
Pol. Gap (1)-
(3) -
{(2)-(4)}
P - P*
(1) - (2)
P /a
(1)
P*
(2)
P (Trading
partners)
(3)
P*
(Trading
partners)
(4)
Reserves
to GDP
(Reserves
to GDP)*
Capital
Controls
(Capital
Controls)*
Australia -0.2% 0.66 -0.3% 0.0% 0.4% 0.4% 0.1% -0.2% 0.4% 0.4% 12.5% 12.5%
Belgium -0.6% 0.66 -0.9% -0.1% -2.4% -2.3% -0.1% -0.8% -2.4% -2.3% 0.0% 0.0%
Brazil -0.3% 0.66 -0.5% -0.4% 3.2% 3.5% 0.0% -0.1% 4.2% 4.2% 25.0% 16.1%
Canada -0.2% 0.66 -0.3% 0.0% -1.1% -1.1% 0.2% 0.0% -1.1% -1.1% 0.0% 0.0%
China -0.2% 0.66 -0.3% -0.1% -0.2% -0.2% 0.0% -0.2% -0.5% -0.2% 50.0% 16.1%
France 0.9% 0.66 1.3% 1.9% 0.0% -2.0% -0.3% -0.9% 0.0% -2.0% 0.0% 0.0%
Germany 0.5% 0.66 0.7% 1.3% -0.7% -2.0% -0.1% -0.6% -0.7% -2.0% 0.0% 0.0%
India -0.6% 0.66 -1.0% -0.7% 1.0% 1.7% 0.0% -0.3% 2.0% 2.0% 50.0% 16.1%
Indonesia -0.3% 0.66 -0.4% -0.2% 1.4% 1.6% 0.0% -0.2% 2.2% 1.9% 37.5% 16.1%
Italy 0.4% 0.66 0.6% 1.3% -0.2% -1.5% -0.2% -0.9% -0.2% -1.5% 0.0% 0.0%
Japan -0.2% 0.66 -0.3% 0.0% -0.5% -0.5% 0.1% -0.2% -0.5% -0.5% 0.0% 0.0%
Korea -0.1% 0.66 -0.2% 0.0% 0.3% 0.3% 0.0% -0.2% 0.4% 0.4% 12.5% 12.5%
Malaysia -0.3% 0.66 -0.4% -0.2% 0.6% 0.9% 0.0% -0.2% 1.0% 1.0% 37.5% 16.1%
Mexico -0.3% 0.66 -0.5% -0.3% 1.0% 1.3% 0.1% 0.0% 1.6% 1.6% 37.5% 16.1%
Netherlands 0.4% 0.66 0.6% 1.3% -0.4% -1.7% -0.2% -0.9% -0.4% -1.7% 0.0% 0.0%
Poland -0.6% 0.66 -0.9% -0.2% 1.6% 1.8% -0.2% -0.9% 2.1% 2.1% 25.0% 16.1%
Russia 1.2% 0.66 1.8% 2.2% 3.5% 1.3% -0.1% -0.5% 4.1% 1.5% 12.5% 12.5%
South Africa -0.3% 0.66 -0.4% -0.1% 0.7% 0.8% -0.1% -0.4% 0.9% 0.9% 25.0% 16.1%
Spain 0.4% 0.66 0.6% 1.3% 0.1% -1.2% -0.2% -1.0% 0.1% -1.2% 0.0% 0.0%
Sweden -1.1% 0.66 -1.6% -1.0% -1.5% -0.5% -0.2% -0.8% -1.5% -0.5% 0.0% 0.0%
Switzerland 0.4% 0.66 0.7% 1.4% -0.6% -2.0% -0.2% -1.0% -0.6% -2.0% 0.0% 0.0%
Thailand 0.2% 0.66 0.3% 0.4% 0.0% -0.5% 0.0% -0.2% -0.1% -0.6% 25.0% 16.1%
Turkey -0.4% 0.66 -0.6% 0.0% 2.5% 2.5% -0.1% -0.6% 3.3% 3.0% 25.0% 16.1%
United Kingdom -0.5% 0.66 -0.7% 0.0% -0.3% -0.3% -0.2% -0.9% -0.3% -0.3% 0.0% 0.0%
United States 0.0% 0.66 0.0% 0.2% 0.4% 0.2% -0.1% -0.3% 0.4% 0.2% 0.0% 0.0%
/a For multilateral consistency, adjusted by the weighted average of the 2016 regression residuals (subtracting -9%).
Table 16. Breakdown of 2016 Policy Gap Contribution: Real Short Term Interest Rates
Components

VARIABLES Specification
Change in reserves to GDP * cap controls (rel to TRD PRT) -1.73***
(0.00)
Lag of health expenditure to GDP (rel to TRD PRT) 1.23
(0.11)
Real interest rate differential interacted with K openness (rel to TRD PRT) 0.66***
(0.00)
Private credit/GDP (rel to TRD PRT) 0.13***
(0.00)
Lag of Demeaned GDPpw/Top3GDPpw (PPP) 0.70***
(0.00)
Lag of Demeaned GDPpw/Top3GDPpw (PPP)]* capital openness -0.49***
(0.00)
Lag of VIX * capital account openness -0.26***
(0.00)
Lag of VIX * capital account openness *share of own currency in global reserve 0.84**
(0.02)
Share of the country's currency held as FX reserve by central banks worldwide 0.04
(0.54)
Lagged financial home bias (share of domestic debt owned by residents, rel to TR 0.37***
(0.00)
Log commodity Terms Of Trade 0.09*
(0.06)
Lag of Trade Openness (avg. of exports and imports to GDP) (rel to TRD PRT) -0.30***
(0.00)
Expected GDP growth of medium-term(5 years out), WEO project (rel to TRD PRT) 1.86***
(0.00)
Population Growth (rel to TRD PRT) 0.86
(0.61)
Share of administered prices -2.12***
(0.00)
Dummy south africa apartheid (pre-1994) 0.31***
(0.00)
Constant 4.33***
(0.00)
Observations 882
R-squared 0.61
RMSE 0.08271
Robust pval in parentheses
*** p<0.01, ** p<0.05, * p<0.1
Table 17. EBA Analysis of 2016 Index REER: Coefficients

SECTION III— REER REGRESSION-BASED ANALYSIS: LEVEL REER
This section contains results from the EBA analysis of 2016 (year average) levels of the REER. In comparison to Section III, the key difference is that the regression analysis uses as a dependent variable a measure of the level of the country’s real exchange rate (rather than a REER index), which contains no information about the relative prices across economies. The independent variables in the Level REER regression are similar, though not identical, to those used in the Index REER analysis. The structure and presentation of the tables is similar to that of Section II.

SumHealth
Exp.
Capital
ControlReserves
Private
Credit
Real
Interest
Rate
Australia 16.0% -2.3% -1.0% 0.0% -0.4% -0.6% -0.3% 18.3%
Belgium 6.0% -1.0% 0.4% 0.0% -0.2% -0.4% -0.8% 7.0%
Brazil 8.5% -2.5% -0.7% -0.1% -0.6% -0.4% -0.6% 11.0%
Canada -19.9% 0.1% -0.3% 0.0% -0.2% 0.9% -0.3% -20.0%
China 6.3% 3.4% -3.5% -0.5% 4.2% 3.5% -0.3% 2.9%
France 6.8% 0.6% 0.1% 0.0% -0.2% -0.5% 1.1% 6.3%
Germany -18.3% 0.1% 0.1% 0.0% -0.2% -0.5% 0.6% -18.4%
India 12.6% -2.4% 0.3% -0.5% -1.0% -0.3% -0.9% 15.0%
Indonesia 3.7% -3.9% -1.1% -0.3% -1.4% -0.7% -0.4% 7.6%
Italy -3.7% 0.0% 0.2% 0.0% -0.2% -0.5% 0.5% -3.7%
Japan -11.3% -1.2% 1.0% 0.0% -0.9% -1.0% -0.3% -10.2%
Korea -16.6% -3.7% -1.2% 0.0% -1.3% -1.0% -0.2% -12.9%
Malaysia -26.4% -4.2% -2.6% -0.3% -0.9% 0.1% -0.4% -22.2%
Mexico -16.9% -3.4% -2.1% -0.3% -0.2% -0.3% -0.5% -13.5%
Netherlands -13.2% 0.1% 0.1% 0.0% -0.2% -0.4% 0.5% -13.3%
Poland -18.2% -4.3% -0.8% -0.1% -1.7% -0.9% -0.8% -14.0%
Russia -18.1% -1.0% -1.7% 0.0% -0.4% -0.5% 1.6% -17.1%
South Africa -12.6% -1.0% 0.3% -0.1% -0.3% -0.5% -0.4% -11.6%
Spain -0.4% 3.6% 0.2% 0.0% -0.2% 3.1% 0.4% -3.9%
Sweden -18.3% -1.3% -0.2% 0.0% -0.2% 0.5% -1.5% -17.0%
Switzerland 15.5% 0.1% 0.0% 0.0% -0.2% -0.3% 0.5% 15.4%
Thailand -16.5% -2.8% 0.2% -0.1% -2.2% -0.9% 0.2% -13.7%
Turkey 2.6% -0.5% 0.3% -0.1% 0.0% -0.1% -0.6% 3.1%
United Kingdom 2.8% -1.2% 0.1% 0.0% -0.2% -0.4% -0.6% 4.0%
United States 25.0% 0.8% 2.1% 0.0% -0.5% -0.7% 0.0% 24.2%
Euro Area -4.5% 0.6% 0.3% 0.0% -0.2% -0.1% 0.5% -5.1%
/a For multilateral consistency, adjusted by the weighted average of the 2016 regression residuals (subtracting -9%).
Table 18. EBA Analysis of the 2016 Level of the REER
Total REER
Gap /a
Net Contributions of Policy Gaps
Residual /a

Total Dom. Total Dom. Total Dom. Total Dom. Total Dom. Total Dom.
Australia -2.3% -1.4% -1.0% -1.3% 0.0% 0.0% -0.4% -0.1% -0.6% 0.0% -0.3% 0.0%
Belgium -1.0% 0.1% 0.4% 0.2% 0.0% 0.0% -0.2% 0.0% -0.4% 0.0% -0.8% -0.1%
Brazil -2.5% -1.7% -0.7% -1.0% -0.1% -0.1% -0.6% -0.3% -0.4% 0.0% -0.6% -0.3%
Canada 0.1% 1.2% -0.3% 0.0% 0.0% 0.0% -0.2% 0.0% 0.9% 1.2% -0.3% 0.0%
China 3.4% 3.6% -3.5% -3.6% -0.5% -0.5% 4.2% 4.1% 3.5% 3.6% -0.3% 0.0%
France 0.6% 1.8% 0.1% 0.0% 0.0% 0.0% -0.2% 0.0% -0.5% 0.0% 1.1% 1.7%
Germany 0.1% 1.2% 0.1% 0.0% 0.0% 0.0% -0.2% 0.0% -0.5% 0.0% 0.6% 1.2%
India -2.4% -1.5% 0.3% -0.2% -0.5% -0.5% -1.0% -0.5% -0.3% 0.3% -0.9% -0.6%
Indonesia -3.9% -3.4% -1.1% -1.7% -0.3% -0.3% -1.4% -1.0% -0.7% -0.1% -0.4% -0.2%
Italy 0.0% 1.2% 0.2% 0.0% 0.0% 0.0% -0.2% 0.0% -0.5% 0.0% 0.5% 1.2%
Japan -1.2% 0.0% 1.0% 0.0% 0.0% 0.0% -0.9% 0.0% -1.0% 0.0% -0.3% 0.0%
Korea -3.7% -2.4% -1.2% -2.0% 0.0% 0.0% -1.3% -0.3% -1.0% 0.0% -0.2% 0.0%
Malaysia -4.2% -3.3% -2.6% -3.1% -0.3% -0.3% -0.9% -0.4% 0.1% 0.7% -0.4% -0.2%
Mexico -3.4% -2.3% -2.1% -1.7% -0.3% -0.3% -0.2% 0.0% -0.3% 0.0% -0.5% -0.3%
Netherlands 0.1% 1.2% 0.1% 0.0% 0.0% 0.0% -0.2% 0.0% -0.4% 0.0% 0.5% 1.2%
Poland -4.3% -3.3% -0.8% -0.9% -0.1% -0.1% -1.7% -1.5% -0.9% -0.5% -0.8% -0.2%
Russia -1.0% -0.1% -1.7% -2.1% 0.0% 0.0% -0.4% 0.0% -0.5% 0.0% 1.6% 2.0%
South Africa -1.0% -0.3% 0.3% -0.1% -0.1% -0.1% -0.3% 0.0% -0.5% 0.0% -0.4% -0.1%
Spain 3.6% 4.5% 0.2% 0.0% 0.0% 0.0% -0.2% 0.0% 3.1% 3.4% 0.4% 1.2%
Sweden -1.3% -0.3% -0.2% -0.3% 0.0% 0.0% -0.2% 0.0% 0.5% 0.9% -1.5% -0.9%
Switzerland 0.1% 1.2% 0.0% 0.0% 0.0% 0.0% -0.2% 0.0% -0.3% 0.0% 0.5% 1.2%
Thailand -2.8% -2.1% 0.2% -0.5% -0.1% -0.1% -2.2% -1.7% -0.9% -0.2% 0.2% 0.4%
Turkey -0.5% 0.4% 0.3% 0.0% -0.1% -0.1% 0.0% 0.1% -0.1% 0.4% -0.6% 0.0%
United Kingdom -1.2% 0.0% 0.1% 0.0% 0.0% 0.0% -0.2% 0.0% -0.4% 0.0% -0.6% 0.0%
United States 0.8% 1.4% 2.1% 1.2% 0.0% 0.0% -0.5% 0.0% -0.7% 0.0% 0.0% 0.2%
Table 19. EBA - Estimated Policy Gap Contributions to 2016 level of the REER
All (sum) Health Exp. Capital Controls ∆ in Reserves Private Credit Interest Rate

Overall
ContributionCoef.
Pol. Gap
(1)-(3) -
{(2)-(4)}
P - P*
(1) - (2)
P
(1)
P*
(2)
P (Trading
partners)
(3)
P* (Trading
partners)
(4)
P*
benchmark
from cross-
country
regression a
Australia -1.0% 1.74 -0.6% -0.8% 6.0% 6.8% 6.4% 6.5% 6.9%
Belgium 0.4% 1.74 0.2% 0.1% 8.2% 8.1% 7.2% 7.3% 6.7%
Brazil -0.7% 1.74 -0.4% -0.6% 4.1% 4.7% 6.5% 6.7% 4.0%
Canada -0.3% 1.74 -0.2% 0.0% 7.6% 7.6% 7.1% 6.9% 6.8%
China -3.5% 1.74 -2.0% -2.1% 1.7% 3.8% 6.9% 7.0% 3.8%
France 0.1% 1.74 0.1% 0.0% 8.9% 8.9% 7.1% 7.2% 7.6%
Germany 0.1% 1.74 0.1% 0.0% 8.7% 8.7% 6.8% 6.9% 8.0%
India 0.3% 1.74 0.2% -0.1% 1.4% 1.5% 6.4% 6.7% 2.1%
Indonesia -1.1% 1.74 -0.7% -1.0% 1.4% 2.4% 6.1% 6.4% 3.0%
Italy 0.2% 1.74 0.1% 0.0% 7.1% 7.1% 7.1% 7.2% 7.6%
Japan 1.0% 1.74 0.5% 0.0% 8.4% 8.4% 5.3% 5.8% 8.2%
Korea -1.2% 1.74 -0.7% -1.2% 4.1% 5.3% 5.8% 6.3% 5.3%
Malaysia -2.6% 1.74 -1.5% -1.8% 2.0% 3.8% 6.0% 6.3% 4.8%
Mexico -2.1% 1.74 -1.2% -1.0% 3.1% 4.1% 7.3% 7.0% 4.0%
Netherlands 0.1% 1.74 0.1% 0.0% 9.5% 9.5% 7.1% 7.2% 7.2%
Poland -0.8% 1.74 -0.5% -0.5% 4.7% 5.2% 7.3% 7.4% 5.5%
Russia -1.7% 1.74 -1.0% -1.2% 4.1% 5.3% 6.5% 6.8% 5.7%
South Africa 0.3% 1.74 0.2% 0.0% 4.0% 4.0% 6.6% 6.8% 4.0%
Spain 0.2% 1.74 0.1% 0.0% 7.1% 7.1% 7.3% 7.4% 6.5%
Sweden -0.2% 1.74 -0.1% -0.2% 7.9% 8.0% 7.2% 7.2% 8.2%
Switzerland 0.0% 1.74 0.0% 0.0% 7.5% 7.5% 7.3% 7.3% 7.4%
Thailand 0.2% 1.74 0.1% -0.3% 3.0% 3.3% 6.1% 6.5% 4.2%
Turkey 0.3% 1.74 0.2% 0.0% 3.6% 3.6% 7.0% 7.1% 4.4%
United Kingdom 0.1% 1.74 0.1% 0.0% 7.8% 7.8% 7.1% 7.1% 7.3%
United States 2.1% 1.74 1.2% 0.7% 8.0% 7.3% 5.8% 6.3% 7.3%
Table 20. Breakdown of 2016 Policy Gap Contribution: Public Expenditure on Health / GDP

Overall
Contribution
Contri-
butionCoef.
Policy Gap
(7)-(8)
P
(7)
P*
(8)
Contri-
butionCoef.
Policy Gap
(9)-(10)
P
(9)
P*
(10)
Australia 0.0% 0.0% -0.32 0.0% -4.1% -4.1% 0.0% 1.01 0.0% 0.0% 0.0%
Belgium 0.0% 0.0% -0.32 0.0% -4.7% -4.7% 0.0% 1.01 0.0% -1.0% -1.0%
Brazil -0.1% -0.1% -0.32 0.4% -3.5% -4.0% 0.0% 1.01 0.0% 0.0% 0.0%
Canada 0.0% 0.0% -0.32 0.0% -4.7% -4.7% 0.0% 1.01 0.0% 0.0% 0.0%
China -0.5% -0.5% -0.32 1.6% -2.4% -4.0% 0.0% 1.01 0.0% 0.0% 0.0%
France 0.0% 0.0% -0.32 0.0% -4.7% -4.7% 0.0% 1.01 0.0% -1.0% -1.0%
Germany 0.0% 0.0% -0.32 0.0% -4.7% -4.7% 0.0% 1.01 0.0% -1.0% -1.0%
India -0.5% -0.5% -0.32 1.6% -2.4% -4.0% 0.0% 1.01 0.0% 0.0% 0.0%
Indonesia -0.3% -0.3% -0.32 1.0% -3.0% -4.0% 0.0% 1.01 0.0% 0.0% 0.0%
Italy 0.0% 0.0% -0.32 0.0% -4.7% -4.7% 0.0% 1.01 0.0% -1.0% -1.0%
Japan 0.0% 0.0% -0.32 0.0% -4.7% -4.7% 0.0% 1.01 0.0% -0.2% -0.2%
Korea 0.0% 0.0% -0.32 0.0% -4.1% -4.1% 0.0% 1.01 0.0% 0.0% 0.0%
Malaysia -0.3% -0.3% -0.32 1.0% -3.0% -4.0% 0.0% 1.01 0.0% 0.0% 0.0%
Mexico -0.3% -0.3% -0.32 1.0% -3.0% -4.0% 0.0% 1.01 0.0% 0.0% 0.0%
Netherlands 0.0% 0.0% -0.32 0.0% -4.7% -4.7% 0.0% 1.01 0.0% -1.0% -1.0%
Poland -0.1% -0.1% -0.32 0.4% -3.5% -4.0% 0.0% 1.01 0.0% 0.0% 0.0%
Russia 0.0% 0.0% -0.32 0.0% -4.1% -4.1% 0.0% 1.01 0.0% 0.0% 0.0%
South Africa -0.1% -0.1% -0.32 0.4% -3.5% -4.0% 0.0% 1.01 0.0% 0.0% 0.0%
Spain 0.0% 0.0% -0.32 0.0% -4.7% -4.7% 0.0% 1.01 0.0% -1.0% -1.0%
Sweden 0.0% 0.0% -0.32 0.0% -4.7% -4.7% 0.0% 1.01 0.0% 0.0% 0.0%
Switzerland 0.0% 0.0% -0.32 0.0% -4.7% -4.7% 0.0% 1.01 0.0% 0.0% 0.0%
Thailand -0.1% -0.1% -0.32 0.4% -3.5% -4.0% 0.0% 1.01 0.0% 0.0% 0.0%
Turkey -0.1% -0.1% -0.32 0.4% -3.5% -4.0% 0.0% 1.01 0.0% 0.0% 0.0%
United Kingdom 0.0% 0.0% -0.32 0.0% -4.7% -4.7% 0.0% 1.01 0.0% -0.2% -0.2%
United States 0.0% 0.0% -0.32 0.0% -4.7% -4.7% 0.0% 1.01 0.0% -3.1% -3.1%
1/ Capital Account Openness defined as (1- Capital Account Controls)
2/ Lagged PPP GDP per working population(15-64) relative to average of (US+Japan+Germany), demeaned of overall sample mean
Table 21. Breakdown of 2016 Policy Gap Contribution: Capital Controls
P= Lagged [VIX * (Capital account openness)] 1\ P= Lagged [VIX * Capital Account Openness * Share of
own currency in world reserve] 2\

Overall
ContributionCoef.
Pol. Gap (1)-
(3) -
{(2)-(4)}
P - P*
(1) - (2)
P /a
(1)
P*
(2)
P (Trading
partners)
(3)
P*
(Trading
partners)
(4)
Reserves
to GDP
(Reserves
to GDP)*
Capital
Controls
(Capital
Controls)*
Australia -0.4% -2.10 0.2% 0.0% 0.1% 0.0% -0.1% 0.0% 0.6% 0.2% 12.5% 12.5%
Belgium -0.2% -2.10 0.1% 0.0% 0.0% 0.0% -0.1% 0.0% -0.2% -0.2% 0.0% 0.0%
Brazil -0.6% -2.10 0.3% 0.1% 0.1% 0.0% -0.1% 0.0% 0.5% 0.0% 25.0% 16.1%
Canada -0.2% -2.10 0.1% 0.0% 0.0% 0.0% -0.1% 0.0% 0.4% 0.0% 0.0% 0.0%
China 4.2% -2.10 -2.0% -2.0% -2.0% 0.0% 0.1% 0.0% -3.9% 0.0% 50.0% 16.1%
France -0.2% -2.10 0.1% 0.0% 0.0% 0.0% -0.1% 0.0% 0.1% 0.0% 0.0% 0.0%
Germany -0.2% -2.10 0.1% 0.0% 0.0% 0.0% -0.1% 0.0% 0.1% 0.0% 0.0% 0.0%
India -1.0% -2.10 0.5% 0.3% 0.5% 0.2% -0.2% 0.0% 0.9% 1.2% 50.0% 16.1%
Indonesia -1.4% -2.10 0.7% 0.5% 0.5% 0.0% -0.2% 0.0% 1.3% 0.0% 37.5% 16.1%
Italy -0.2% -2.10 0.1% 0.0% 0.0% 0.0% -0.1% 0.0% -0.1% 0.0% 0.0% 0.0%
Japan -0.9% -2.10 0.4% 0.0% 0.0% 0.0% -0.4% 0.0% -0.1% 0.2% 0.0% 0.0%
Korea -1.3% -2.10 0.6% 0.1% 0.1% -0.1% -0.5% 0.0% 0.5% -0.7% 12.5% 12.5%
Malaysia -0.9% -2.10 0.4% 0.2% 0.5% 0.3% -0.2% 0.0% 1.2% 1.6% 37.5% 16.1%
Mexico -0.2% -2.10 0.1% 0.0% 0.0% 0.0% -0.1% 0.0% 0.0% 0.0% 37.5% 16.1%
Netherlands -0.2% -2.10 0.1% 0.0% 0.0% 0.0% -0.1% 0.0% -0.4% 0.1% 0.0% 0.0%
Poland -1.7% -2.10 0.8% 0.7% 1.2% 0.5% -0.1% 0.0% 4.8% 3.1% 25.0% 16.1%
Russia -0.4% -2.10 0.2% 0.0% 0.1% 0.1% -0.1% 0.0% 0.6% 0.6% 12.5% 12.5%
South Africa -0.3% -2.10 0.1% 0.0% 0.2% 0.2% -0.1% 0.0% 0.9% 1.5% 25.0% 16.1%
Spain -0.2% -2.10 0.1% 0.0% 0.0% 0.0% -0.1% 0.0% 0.7% 0.0% 0.0% 0.0%
Sweden -0.2% -2.10 0.1% 0.0% 0.0% 0.0% -0.1% 0.0% 0.8% 0.0% 0.0% 0.0%
Switzerland -0.2% -2.10 0.1% 0.0% 0.0% 0.0% -0.1% 0.0% 0.8% 3.5% 0.0% 0.0%
Thailand -2.2% -2.10 1.0% 0.8% 0.8% 0.0% -0.2% 0.0% 3.2% 0.0% 25.0% 16.1%
Turkey 0.0% -2.10 0.0% -0.1% 0.0% 0.1% -0.1% 0.0% 0.1% 0.6% 25.0% 16.1%
United Kingdom -0.2% -2.10 0.1% 0.0% 0.0% 0.0% -0.1% 0.0% 0.3% 0.5% 0.0% 0.0%
United States -0.5% -2.10 0.2% 0.0% 0.0% 0.0% -0.2% 0.0% 0.0% 0.0% 0.0% 0.0%
/a For multilateral consistency, adjusted by the weighted average of the 2016 regression residuals (subtracting -9%).
Table 22. Breakdown of 2016 Policy Gap Contribution: Change in FX Reserves / GDP
Components

Overall
ContributionCoef.
Pol. Gap (1)-
(3) -
{(2)-(4)}
P - P*
(1) - (2)
P /a
(1)
P*
(2)
P (Trading
partners)
(3)
P* (Trading
partners)
(4)
Australia -0.6% 0.12 -4.6% 0.0% 51.2% 51.2% 30.5% 25.9%
Belgium -0.4% 0.12 -3.2% 0.0% 25.8% 25.8% 24.9% 21.8%
Brazil -0.4% 0.12 -3.8% 0.0% 26.7% 26.7% 29.7% 25.9%
Canada 0.9% 0.12 7.5% 10.0% 53.0% 43.0% 28.7% 26.2%
China 3.5% 0.12 29.1% 30.0% 56.2% 26.2% 22.4% 21.5%
France -0.5% 0.12 -4.4% 0.0% 10.3% 10.3% 27.9% 23.5%
Germany -0.5% 0.12 -3.8% 0.0% -5.4% -5.4% 31.4% 27.6%
India -0.3% 0.12 -2.3% 2.6% 17.6% 15.0% 29.4% 24.5%
Indonesia -0.7% 0.12 -5.7% -0.8% 2.1% 2.9% 29.0% 24.1%
Italy -0.5% 0.12 -3.8% 0.0% 45.0% 45.0% 24.0% 20.2%
Japan -1.0% 0.12 -8.2% 0.0% 6.2% 6.2% 33.7% 25.6%
Korea -1.0% 0.12 -8.3% 0.0% 31.0% 31.0% 29.9% 21.6%
Malaysia 0.1% 0.12 0.7% 6.0% 13.7% 7.7% 29.1% 23.8%
Mexico -0.3% 0.12 -2.7% 0.0% 12.8% 12.8% 29.8% 27.2%
Netherlands -0.4% 0.12 -3.2% 0.0% 78.9% 78.9% 22.1% 18.9%
Poland -0.9% 0.12 -7.3% -4.5% 27.5% 32.0% 22.5% 19.8%
Russia -0.5% 0.12 -4.2% 0.0% 8.6% 8.6% 28.8% 24.5%
South Africa -0.5% 0.12 -4.0% 0.0% 34.5% 34.5% 27.5% 23.5%
Spain 3.1% 0.12 26.1% 28.1% 60.1% 32.0% 24.4% 22.4%
Sweden 0.5% 0.12 4.2% 7.2% 76.7% 69.5% 25.6% 22.6%
Switzerland -0.3% 0.12 -2.8% 0.0% 31.9% 31.9% 22.0% 19.1%
Thailand -0.9% 0.12 -7.1% -1.9% 40.1% 42.0% 26.3% 21.1%
Turkey -0.1% 0.12 -0.5% 3.2% 43.2% 40.0% 26.9% 23.2%
United Kingdom -0.4% 0.12 -3.7% 0.0% 21.8% 21.8% 26.2% 22.5%
United States -0.7% 0.12 -6.2% 0.2% 29.4% 29.2% 29.2% 22.8%
/a For multilateral consistency, adjusted by the weighted average of the 2016 regression residuals (subtracting -9%).
Table 23. Breakdown of 2016 Policy Gap Contribution: Private Credit / GDP (after removing country mean)

Overall
ContributionCoef.
Pol. Gap (1)-
(3) -
{(2)-(4)}
P - P*
(1) - (2)
P /a
(1)
P*
(2)
P (Trading
partners)
(3)
P*
(Trading
partners)
(4)
Reserves
to GDP
(Reserves
to GDP)*
Capital
Controls
(Capital
Controls)*
Australia -0.3% 0.89 -0.3% 0.0% 0.4% 0.4% 0.1% -0.3% 0.4% 0.4% 12.5% 12.5%
Belgium -0.8% 0.89 -0.9% -0.1% -2.4% -2.3% -0.1% -0.9% -2.4% -2.3% 0.0% 0.0%
Brazil -0.6% 0.89 -0.7% -0.4% 3.2% 3.5% 0.0% -0.4% 4.2% 4.2% 25.0% 16.1%
Canada -0.3% 0.89 -0.3% 0.0% -1.1% -1.1% 0.2% -0.1% -1.1% -1.1% 0.0% 0.0%
China -0.3% 0.89 -0.3% -0.1% -0.2% -0.2% 0.0% -0.3% -0.5% -0.2% 50.0% 16.1%
France 1.1% 0.89 1.3% 1.9% 0.0% -2.0% -0.3% -0.9% 0.0% -2.0% 0.0% 0.0%
Germany 0.6% 0.89 0.7% 1.3% -0.7% -2.0% -0.1% -0.7% -0.7% -2.0% 0.0% 0.0%
India -0.9% 0.89 -1.0% -0.7% 1.0% 1.7% 0.0% -0.4% 2.0% 2.0% 50.0% 16.1%
Indonesia -0.4% 0.89 -0.5% -0.2% 1.4% 1.6% 0.0% -0.3% 2.2% 1.9% 37.5% 16.1%
Italy 0.5% 0.89 0.6% 1.3% -0.2% -1.5% -0.2% -0.9% -0.2% -1.5% 0.0% 0.0%
Japan -0.3% 0.89 -0.3% 0.0% -0.5% -0.5% 0.1% -0.2% -0.5% -0.5% 0.0% 0.0%
Korea -0.2% 0.89 -0.2% 0.0% 0.3% 0.3% 0.0% -0.2% 0.4% 0.4% 12.5% 12.5%
Malaysia -0.4% 0.89 -0.4% -0.2% 0.6% 0.9% 0.0% -0.2% 1.0% 1.0% 37.5% 16.1%
Mexico -0.5% 0.89 -0.5% -0.3% 1.0% 1.3% 0.1% -0.1% 1.6% 1.6% 37.5% 16.1%
Netherlands 0.5% 0.89 0.6% 1.3% -0.4% -1.7% -0.2% -0.9% -0.4% -1.7% 0.0% 0.0%
Poland -0.8% 0.89 -0.9% -0.2% 1.6% 1.8% -0.2% -0.9% 2.1% 2.1% 25.0% 16.1%
Russia 1.6% 0.89 1.8% 2.2% 3.5% 1.3% -0.1% -0.6% 4.1% 1.5% 12.5% 12.5%
South Africa -0.4% 0.89 -0.5% -0.1% 0.7% 0.8% -0.1% -0.5% 0.9% 0.9% 25.0% 16.1%
Spain 0.4% 0.89 0.5% 1.3% 0.1% -1.2% -0.2% -1.1% 0.1% -1.2% 0.0% 0.0%
Sweden -1.5% 0.89 -1.6% -1.0% -1.5% -0.5% -0.2% -0.9% -1.5% -0.5% 0.0% 0.0%
Switzerland 0.5% 0.89 0.6% 1.4% -0.6% -2.0% -0.2% -1.0% -0.6% -2.0% 0.0% 0.0%
Thailand 0.2% 0.89 0.2% 0.4% 0.0% -0.5% 0.0% -0.2% -0.1% -0.6% 25.0% 16.1%
Turkey -0.6% 0.89 -0.7% 0.0% 2.5% 2.5% -0.1% -0.7% 3.3% 3.0% 25.0% 16.1%
United Kingdom -0.6% 0.89 -0.7% 0.0% -0.3% -0.3% -0.2% -0.9% -0.3% -0.3% 0.0% 0.0%
United States 0.0% 0.89 -0.1% 0.2% 0.4% 0.2% -0.1% -0.4% 0.4% 0.2% 0.0% 0.0%
/a For multilateral consistency, adjusted by the weighted average of the 2016 regression residuals (subtracting -9%).
Table 24. Breakdown of 2016 Policy Gap Contribution: Real Short Term Interest Rates
Components

VARIABLES Specification
Change in reserves to GDP * cap controls (rel to TRD PRT) -2.16*
(0.08)
Lag of health expenditure to GDP (rel to TRD PRT) 1.79**
(0.04)
Private credit/GDP (rel to TRD PRT) 0.12***
(0.01)
Lag Demeaned PPPGDP/Top3(PPP)] 0.16***
(0.00)
Lag of VIX * capital account openness -0.33**
(0.02)
Lag of VIX * capital account openness *share of own currency in global reserve 0.98
(0.12)
Share of the country's currency held as FX reserve by central banks worldwide -0.33***
(0.00)
Lag of Trade Openness (avg. of exports and imports to GDP) (rel to TRD PRT) -0.31***
(0.00)
Expected GDP growth of medium-term(5 years out), WEO project (rel to TRD PRT) 1.83**
(0.05)
Population Growth (rel to TRD PRT) 5.59**
(0.02)
Aging Speed (rel to TRD PRT) 0.68***
(0.01)
Dependency Ratio (rel to TRD PRT) 0.89***
(0.00)
ICRG political risk variable (rel to TRD PRT) 0.44***
(0.00)
NFA/GDP 0.11***
(0.00)
Lag Capital stock per emplyed person at current PPPs (2005US$) (rel to TRD PRT) 0.08***
(0.00)
Lag Ratio Traded/Non Traded relative to trd part (in logs) 0.23***
(0.00)
VAT Revenue, % of GDP (rel to TRD PRT) 1.21**
(0.03)
Log Commodity ToT (43) levels in 2011 vs trading partner 0.06***
(0.00)
Real interest rate differential demeaned interacted with K openness (rel to TRD 0.94**
(0.02)
Share of administered prices in CPI -2.62***
(0.00)
Constant 0.19***
(0.00)
Observations 838
R-squared 0.91
RMSE 0.1409
Number of Countries 39
Robust pval in parentheses
*** p<0.01, ** p<0.05, * p<0.1
Table 25. EBA Analysis of 2016 Level REER: Coefficients
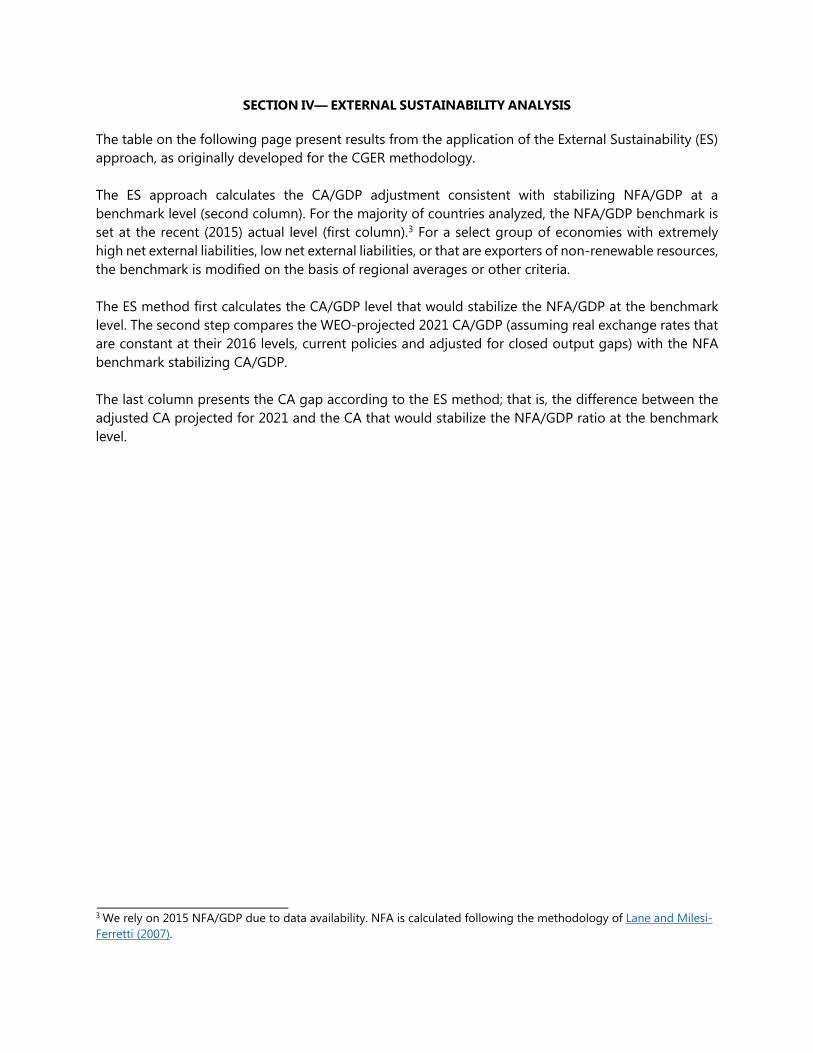
SECTION IV— EXTERNAL SUSTAINABILITY ANALYSIS
The table on the following page present results from the application of the External Sustainability (ES) approach, as originally developed for the CGER methodology. The ES approach calculates the CA/GDP adjustment consistent with stabilizing NFA/GDP at a benchmark level (second column). For the majority of countries analyzed, the NFA/GDP benchmark is set at the recent (2015) actual level (first column).3 For a select group of economies with extremely high net external liabilities, low net external liabilities, or that are exporters of non-renewable resources, the benchmark is modified on the basis of regional averages or other criteria. The ES method first calculates the CA/GDP level that would stabilize the NFA/GDP at the benchmark level. The second step compares the WEO-projected 2021 CA/GDP (assuming real exchange rates that are constant at their 2016 levels, current policies and adjusted for closed output gaps) with the NFA benchmark stabilizing CA/GDP. The last column presents the CA gap according to the ES method; that is, the difference between the adjusted CA projected for 2021 and the CA that would stabilize the NFA/GDP ratio at the benchmark level.
3 We rely on 2015 NFA/GDP due to data availability. NFA is calculated following the methodology of Lane and Milesi-Ferretti (2007).

2 3 4 5 6 7
2015 NFA/GDPBenchmark
NFA/GDP
Unadjusted
medium-term
CA/GDP 2/
Adjusted
medium-term
CA/GDP
CA/GDP
Stabilizing NFA at
Benchmark
CA/GDP
Gap
(A) (B) (C ) (D) (E) (D) - (E)
Australia -61.1% -61.1% -2.3% -3.3% -2.8% -0.6%
Belgium 59.8% 59.8% 0.8% 1.9% 2.1% -0.3%
Brazil -32.4% -32.4% -1.9% -1.8% -1.2% -0.6%
Canada 22.4% 22.4% -2.5% -2.1% 0.9% -2.9%
China 14.1% 14.1% 0.7% 1.1% 1.6% -0.5%
France -19.9% -19.9% 0.6% 0.5% -0.7% 1.2%
Germany 45.4% 45.4% 7.7% 7.4% 1.6% 5.9%
India -28.4% -28.4% -1.7% -1.7% -2.7% 0.9%
Indonesia -44.5% -44.5% -1.8% -2.0% -3.2% 1.2%
Italy -28.4% -28.4% 1.0% 1.2% -0.8% 1.9%
Japan 66.1% 66.1% 4.4% 4.5% 2.8% 1.7%
Korea 14.7% 14.7% 5.9% 6.1% 0.7% 5.4%
Malaysia 9.3% 9.3% 1.8% 1.9% 0.6% 1.2%
Mexico -49.8% -49.8% -2.4% -2.4% -2.3% -0.1%
Netherlands 64.3% 64.3% 7.8% 8.6% 2.4% 6.2%
Poland -63.9% -63.9% -2.2% -1.9% -3.1% 1.1%
Russia 28.2% 28.2% 3.9% 4.2% 1.0% 3.2%
South Africa 14.4% -35.0% -3.8% -3.5% -1.3% -2.2%
Spain -91.3% -45.6% 2.2% 2.3% -1.7% 4.0%
Sweden 2.5% 2.5% 3.9% 3.6% 0.1% 3.5%
Switzerland 90.2% 90.2% 7.4% 7.4% 8.9% -1.5%
Thailand -12.9% -12.9% 3.7% 3.7% -0.6% 4.3%
Turkey -34.7% -42.0% -4.0% -3.4% -2.3% -1.1%
United Kingdom -5.0% -5.0% -2.8% -2.3% -0.2% -2.1%
United States -42.1% -42.1% -2.8% -3.3% -1.3% -2.0%
1/ Based on the CGER "ES" methodology ; CA includes capital account in addition to current account.
2/ Based on WEO database as of June 2017.
Table 26. External Sustainability Approach: NFA-stabilizing Current Accounts 1/