Embed Size (px)
Citation preview
EBRD Extractive Mining Industries Strategy
2018-2022
PUBLIC
As approved by the Board of Directors on 13 December 2017
Abbreviations
18 December, 2017 PUBLIC 2
1. ABI – annual business investment
2. ADB – Asian Development Bank
3. AIIB - Asian Infrastructure Investment Bank
4. BAT – best available technology
5. BGR - Bureau of Governmental Research
6. CEE – central and eastern Europe
7. CIT – corporate income tax
8. CIS - Commonwealth of Independent States
9. CO2 – carbon dioxide
10. COOs – countries of operations
11. CSR – corporate social responsibility
12. DFID - Department for International Development
13. DREA – Atlantic Research Centre (part of DRDC)
14. EBRD – European Bank for Reconstruction and Development
15. EC – European Commission
16. EHS&S – environment, health, safety and security
17. EIB – European Investment Bank
18. EITI – Extractive Industries Transparency Initiative
19. ESP – Environmental and Social Policy
20. EU – European Union
21. EVD – Evaluation Department
22. FDI – foreign direct investment
23. IBRD – International Bank for Reconstruction and Development
24. ICMI - International Conference on Machine Intelligence
25. ICT – Information and Communications Technology
26. IFC – International Finance Corporation
27. IFI – international financial institution
28. KfW - Kreditanstalt für Wiederaufbau (German development
bank)
29. KIGAM - Korea Institute of Geoscience and Mineral Resources
30. MIGA - Multilateral Investment Guarantee Agency
31. O&M - operations and management
32. OECD - Organisation for Economic Co-operation and
Development
33. OEM - original equipment manufacturer/manufacturing
34. R&D – research and development
35. RMI – Raw Materials Initiative
36. SDG – Sustainable Development Goals
37. SME – small and medium-sized enterprise
38. SOE – state-owned enterprises
39. TA – technology assessment
40. TIMS – Transition Impact Monitoring System
41. USAID - United States Agency for International Development
42. WC – working capital
18 December, 2017 PUBLIC 3
Executive Summary
Mining is a global industry which can create jobs, spur innovation and bring large-scale investment and infrastructure over longer time
horizons. The Mining Industry is a large contributor to economic growth and social development in a number of the EBRD's resource-rich
countries of operations (COOs), such as the Kyrgyzstan, Mongolia, Kazakhstan, Russia and Ukraine. Local communities also frequently
benefit significantly from mining activities.
However, if managed poorly, mining operations can also lead to challenges including environmental degradation, displaced populations,
inequality and increased conflict. Over the last two decades we have seen major improvements in the global understanding of how mining
operations can be run more responsibly and with more attention paid to sustainability issues. Good practices to address environmental,
health, safety and social (EHS&S) issues have made significant advances and continue to evolve. Good governance, stable and
constructive institutional relations and good economic management have also been recognised as key issues that responsible companies
should address. In particular, the importance of adhering to the highest standards of transparency and reporting in extractive industries
(including mining) as enshrined in the principles of the Extractive Industries Transparency Initiative (EITI) is highlighted.
The Mining Strategy takes stock of these developments in the sector and identifies the remaining transition challenges in the COOs
through the six transition qualities. It also sets out the Bank's operational response and approach to environmental, health, safety, social
and gender inclusion issues. The Mining Strategy clarifies the rationale for the Bank’s continued involvement in the sector and reaffirms
the importance of mining in fostering transition. As such, the key cornerstones of the Mining Strategy are to: (i) Support competitiveness of
the mining sector by helping mining companies to increase operational efficiency and become more competitive; (ii) Support good
governance in the mining sector by promoting greater transparency and regulatory reform where necessary; (iii) Support sustainability of
the mining sector by promoting environmentally friendly mining methods and resource efficiency; (iv) Promote inclusiveness in mining
operations by supporting both the local servicing sector and the participation of women, young people and other inclusion target groups in
the workforce, thereby maximising the multiplier effect on local economies.
The Bank recognises the macroeconomic impact of mining, in particular in smaller economies. The Bank intends to reflect this in the
comprehensive approach that is developed through relevant Country Diagnostics and Country Strategies.
Table of Contents
18 December, 2017 PUBLIC 4
Scope and structure of the new strategy………………………………………………………………………………………..…….5
The Mining Strategy works in conjunction with all of the Bank’s governance policies…………………….………..6
Rationale for the Bank’s involvement in mining………………………………………………………….…....………..………….7
1.1 EBRD mining operations 2012 – YTD 2017…………………………………………………………………………………..…8
1.2 Lessons learned in the last five years……………………………………………………………………………………….……..9
2.1 Impact of mining on the Sustainable Development Goals……………………………………………….………………10
2.2 Current market trends in the mining industry…………………………………………………………………….…………..11
2.3 Importance of mining in the economies of the EBRD countries of operations……………………….………..12
2.4 Challenges in the mining industry through the six transition qualities…………………………………………....13
2.5 EBRD mining projects and the six transition qualities……………………………………………………….………….…14
3.1 EBRD approach to mining activities……………………………………………………………………………….…..………….15
3.2 EBRD policy engagement in the mining sector……………………………………………………………….………………16
3.3 EBRD financial support for mining companies……………………………………………………………….……..……….17
3.4 EBRD financial support for value chain companies………………………………………………………….…………..…18
3.5 Address the investment gap facing exploration and development…………………………………….…………….19
3.6 Conclusion: what will the Bank do? (Performance Monitoring Framework)………………………………20-21
3.7 Working with other IFIs …………………………………………………………………………………………………….….……....22
EU Critical raw materials, Project/Policy Examples, Licenses/ESP, Public Consultation……………………24-29
Mining country snapshots………………………………………………………………………………………………….……….…30-46
Introduction
Section 1:
Reflection on the
previous strategy
Section 2:
Mining sector
context
Section 3: EBRD
approach and
areas of
engagement
ANNEXES
5
5
Scope and structure of the new strategy
Section 1
Mining sector context
(remaining and new
transition challenges)
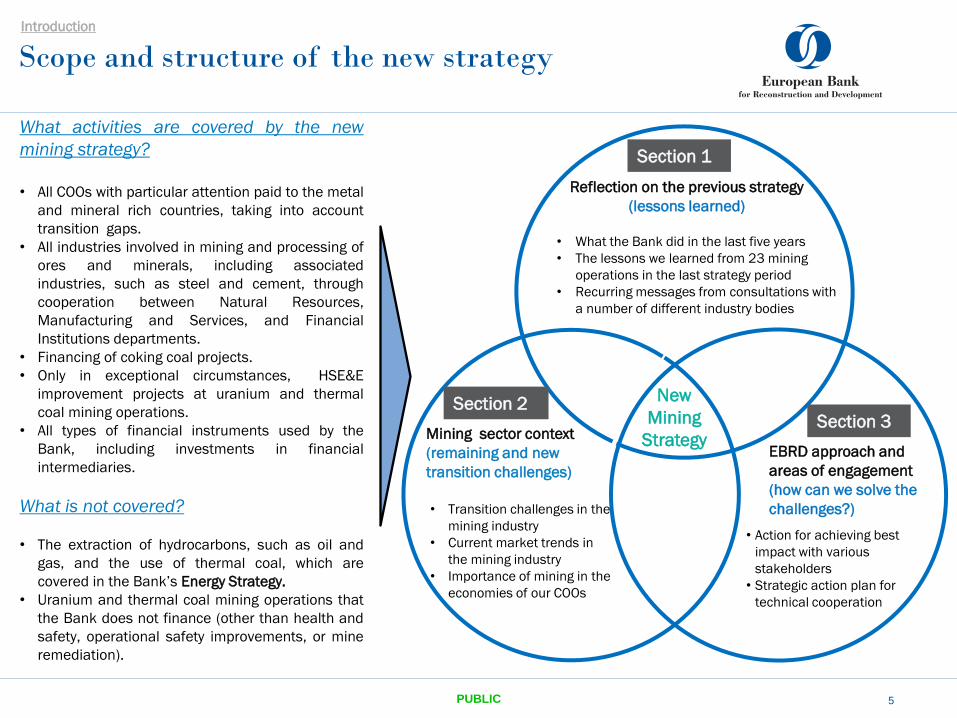
• What the Bank did in the last five years
• The lessons we learned from 23 mining
operations in the last strategy period
• Recurring messages from consultations with
a number of different industry bodies
• Transition challenges in the
mining industry
• Current market trends in
the mining industry
• Importance of mining in the
economies of our COOs
New
Mining
Strategy
• Action for achieving best
impact with various
stakeholders
• Strategic action plan for
technical cooperation
Section 2 Section 3
Reflection on the previous strategy
(lessons learned)
EBRD approach and
areas of engagement
(how can we solve the
challenges?)
5 PUBLIC
What activities are covered by the new
mining strategy?
• All COOs with particular attention paid to the metal
and mineral rich countries, taking into account
transition gaps.
• All industries involved in mining and processing of
ores and minerals, including associated
industries, such as steel and cement, through
cooperation between Natural Resources,
Manufacturing and Services, and Financial
Institutions departments.
• Financing of coking coal projects.
• Only in exceptional circumstances, HSE&E
improvement projects at uranium and thermal
coal mining operations.
• All types of financial instruments used by the
Bank, including investments in financial
intermediaries.
What is not covered?
• The extraction of hydrocarbons, such as oil and
gas, and the use of thermal coal, which are
covered in the Bank’s Energy Strategy.
• Uranium and thermal coal mining operations that
the Bank does not finance (other than health and
safety, operational safety improvements, or mine
remediation).
Introduction
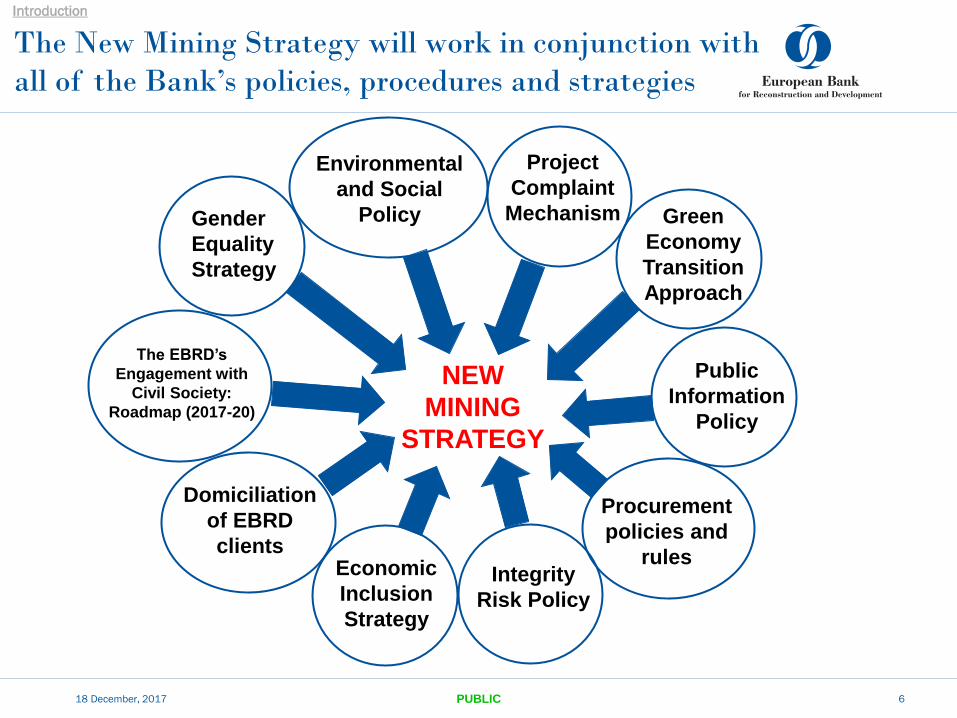
The New Mining Strategy will work in conjunction with
all of the Bank’s policies, procedures and strategies
PUBLIC 6
NEW
MINING
STRATEGY
Introduction
Gender
Equality
Strategy
Project
Complaint
Mechanism
Green
Economy
Transition
Approach
Environmental
and Social
Policy
Procurement
policies and
rules
Integrity
Risk Policy
Public
Information
Policy
Economic
Inclusion
Strategy
Domiciliation
of EBRD
clients
The EBRD’s
Engagement with
Civil Society:
Roadmap (2017-20)
18 December, 2017
Rationale for the Bank’s involvement in mining
PUBLIC 7
Introduction
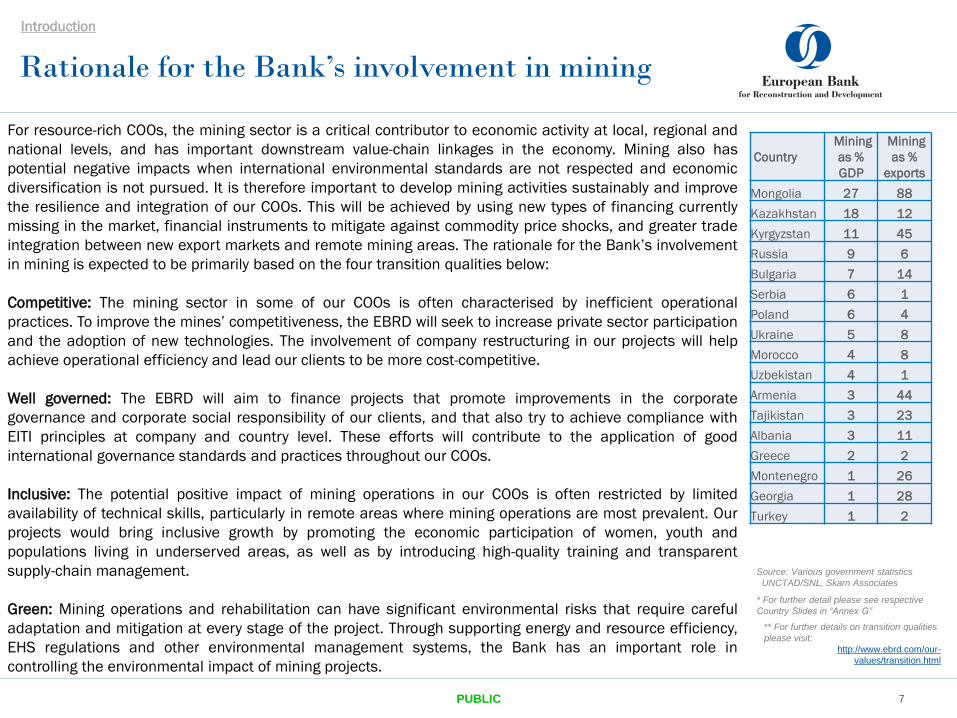
For resource-rich COOs, the mining sector is a critical contributor to economic activity at local, regional and
national levels, and has important downstream value-chain linkages in the economy. Mining also has
potential negative impacts when international environmental standards are not respected and economic
diversification is not pursued. It is therefore important to develop mining activities sustainably and improve
the resilience and integration of our COOs. This will be achieved by using new types of financing currently
missing in the market, financial instruments to mitigate against commodity price shocks, and greater trade
integration between new export markets and remote mining areas. The rationale for the Bank’s involvement
in mining is expected to be primarily based on the four transition qualities below:
Competitive: The mining sector in some of our COOs is often characterised by inefficient operational
practices. To improve the mines’ competitiveness, the EBRD will seek to increase private sector participation
and the adoption of new technologies. The involvement of company restructuring in our projects will help
achieve operational efficiency and lead our clients to be more cost-competitive.
Well governed: The EBRD will aim to finance projects that promote improvements in the corporate
governance and corporate social responsibility of our clients, and that also try to achieve compliance with
EITI principles at company and country level. These efforts will contribute to the application of good
international governance standards and practices throughout our COOs.
Inclusive: The potential positive impact of mining operations in our COOs is often restricted by limited
availability of technical skills, particularly in remote areas where mining operations are most prevalent. Our
projects would bring inclusive growth by promoting the economic participation of women, youth and
populations living in underserved areas, as well as by introducing high-quality training and transparent
supply-chain management.
Green: Mining operations and rehabilitation can have significant environmental risks that require careful
adaptation and mitigation at every stage of the project. Through supporting energy and resource efficiency,
EHS regulations and other environmental management systems, the Bank has an important role in
controlling the environmental impact of mining projects.
Country
Mining
as %
GDP
Mining
as %
exports
Mongolia 27 88
Kazakhstan 18 12
Kyrgyzstan 11 45
Russia 9 6
Bulgaria 7 14
Serbia 6 1
Poland 6 4
Ukraine 5 8
Morocco 4 8
Uzbekistan 4 1
Armenia 3 44
Tajikistan 3 23
Albania 3 11
Greece 2 2
Montenegro 1 26
Georgia 1 28
Turkey 1 2
Source: Various government statistics
UNCTAD/SNL, Skarn Associates
* For further detail please see respective
Country Slides in “Annex G”
** For further details on transition qualities
please visit:
http://www.ebrd.com/our-
values/transition.html
Historical Investment
Breakdown Per Mineral/Metal
(1999 – Sept 2017)
Gold 47%
Copper 21%
Coal 9%
Chromium 5%
Zinc 4%
Limestone 3%
Iron ore 3%
Aggregate 3%
Potash 2%
Mining services 1%
Aluminium 1%
Silver < 1%
Silicate < 1%
EBRD mining operations 2012 – YTD 2017
PUBLIC
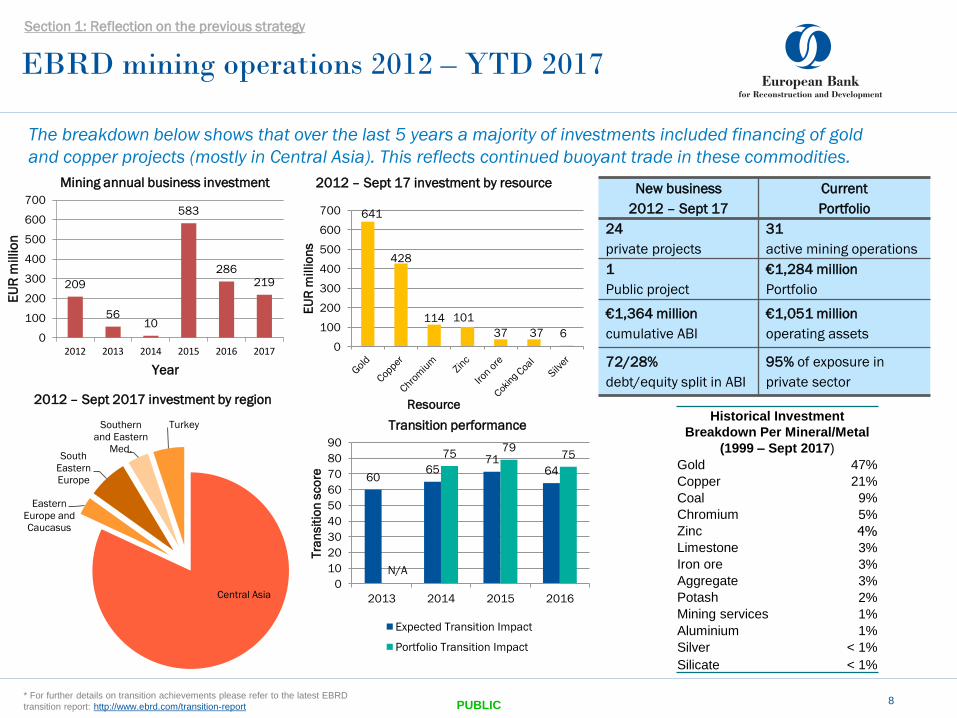
60 65
71 64
N/A
75 79
75
0
10
20
30
40
50
60
70
80
90
2013 2014 2015 2016
Tra
nsit
ion
sco
re
Transition performance
Expected Transition Impact
Portfolio Transition Impact
8
The breakdown below shows that over the last 5 years a majority of investments included financing of gold
and copper projects (mostly in Central Asia). This reflects continued buoyant trade in these commodities.
Section 1: Reflection on the previous strategy
209
56 10
583
286 219
0
100
200
300
400
500
600
700
2012 2013 2014 2015 2016 2017
EU
R m
illio
n
Year
Mining annual business investment
641
428
114 101
37 37 6
0
100
200
300
400
500
600
700
EU
R m
illio
ns
Resource
2012 – Sept 17 investment by resource
Central Asia
Eastern
Europe and
Caucasus
South
Eastern
Europe
Southern
and Eastern
Med.
Turkey
2012 – Sept 2017 investment by region
New business
2012 – Sept 17
Current
Portfolio
24
private projects
31
active mining operations
1
Public project
€1,284 million
Portfolio
€1,364 million
cumulative ABI
€1,051 million
operating assets
72/28%
debt/equity split in ABI
95% of exposure in
private sector
* For further details on transition achievements please refer to the latest EBRD
transition report: http://www.ebrd.com/transition-report
Lessons learned in the last five years
9
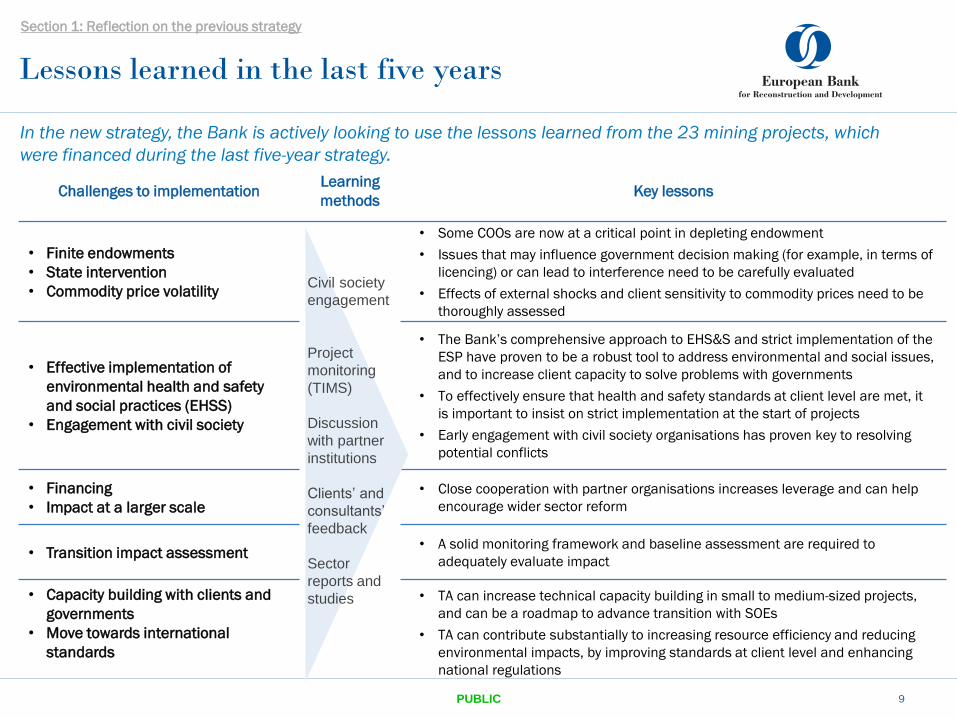
Challenges to implementation Learning
methods Key lessons
• Finite endowments
• State intervention
• Commodity price volatility
• Some COOs are now at a critical point in depleting endowment
• Issues that may influence government decision making (for example, in terms of
licencing) or can lead to interference need to be carefully evaluated
• Effects of external shocks and client sensitivity to commodity prices need to be
thoroughly assessed
• Effective implementation of
environmental health and safety
and social practices (EHSS)
• Engagement with civil society
• The Bank’s comprehensive approach to EHS&S and strict implementation of the
ESP have proven to be a robust tool to address environmental and social issues,
and to increase client capacity to solve problems with governments
• To effectively ensure that health and safety standards at client level are met, it
is important to insist on strict implementation at the start of projects
• Early engagement with civil society organisations has proven key to resolving
potential conflicts
• Financing
• Impact at a larger scale
• Close cooperation with partner organisations increases leverage and can help
encourage wider sector reform
• Transition impact assessment
• A solid monitoring framework and baseline assessment are required to
adequately evaluate impact
• Capacity building with clients and
governments
• Move towards international
standards
• TA can increase technical capacity building in small to medium-sized projects,
and can be a roadmap to advance transition with SOEs
• TA can contribute substantially to increasing resource efficiency and reducing
environmental impacts, by improving standards at client level and enhancing
national regulations
Civil society
engagement
Project
monitoring
(TIMS)
Discussion
with partner
institutions
Clients’ and
consultants’
feedback
Sector
reports and
studies
PUBLIC
Section 1: Reflection on the previous strategy
In the new strategy, the Bank is actively looking to use the lessons learned from the 23 mining projects, which
were financed during the last five-year strategy.
Impact of mining on the Sustainable
Development Goals
18 December, 2017 PUBLIC 10
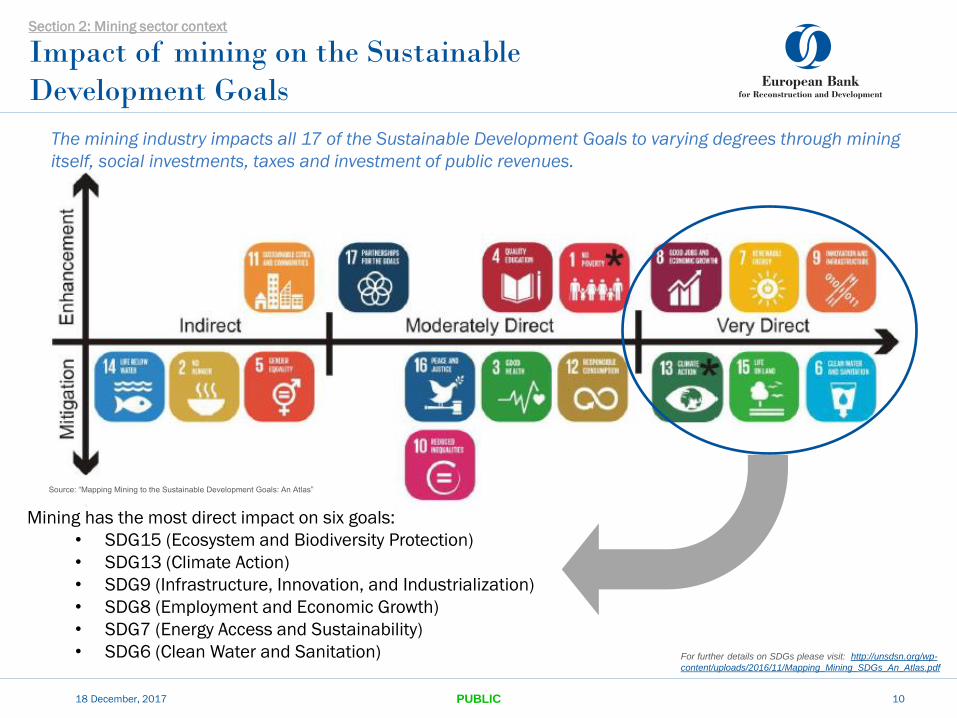
The mining industry impacts all 17 of the Sustainable Development Goals to varying degrees through mining
itself, social investments, taxes and investment of public revenues.
Mining has the most direct impact on six goals:
• SDG15 (Ecosystem and Biodiversity Protection)
• SDG13 (Climate Action)
• SDG9 (Infrastructure, Innovation, and Industrialization)
• SDG8 (Employment and Economic Growth)
• SDG7 (Energy Access and Sustainability)
• SDG6 (Clean Water and Sanitation)
Source: “Mapping Mining to the Sustainable Development Goals: An Atlas”
Section 2: Mining sector context
For further details on SDGs please visit: http://unsdsn.org/wp-
content/uploads/2016/11/Mapping_Mining_SDGs_An_Atlas.pdf
Current market trends in the mining industry
18 December, 2017 PUBLIC
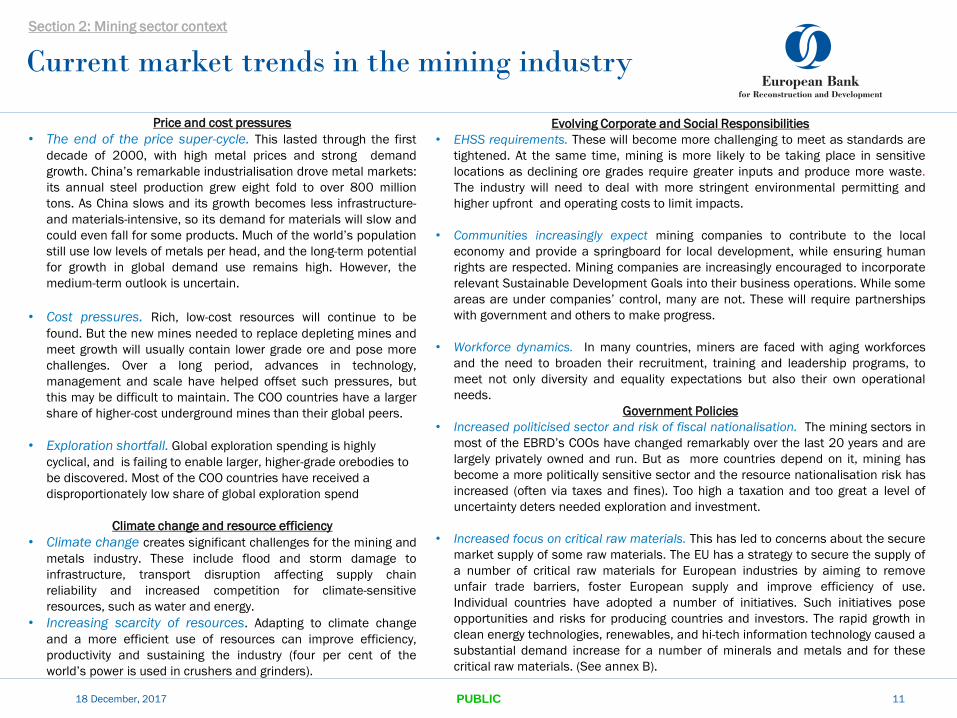
Evolving Corporate and Social Responsibilities
• EHSS requirements. These will become more challenging to meet as standards are
tightened. At the same time, mining is more likely to be taking place in sensitive
locations as declining ore grades require greater inputs and produce more waste.
The industry will need to deal with more stringent environmental permitting and
higher upfront and operating costs to limit impacts.
• Communities increasingly expect mining companies to contribute to the local
economy and provide a springboard for local development, while ensuring human
rights are respected. Mining companies are increasingly encouraged to incorporate
relevant Sustainable Development Goals into their business operations. While some
areas are under companies’ control, many are not. These will require partnerships
with government and others to make progress.
• Workforce dynamics. In many countries, miners are faced with aging workforces
and the need to broaden their recruitment, training and leadership programs, to
meet not only diversity and equality expectations but also their own operational
needs.
Government Policies
• Increased politicised sector and risk of fiscal nationalisation. The mining sectors in
most of the EBRD’s COOs have changed remarkably over the last 20 years and are
largely privately owned and run. But as more countries depend on it, mining has
become a more politically sensitive sector and the resource nationalisation risk has
increased (often via taxes and fines). Too high a taxation and too great a level of
uncertainty deters needed exploration and investment.
• Increased focus on critical raw materials. This has led to concerns about the secure
market supply of some raw materials. The EU has a strategy to secure the supply of
a number of critical raw materials for European industries by aiming to remove
unfair trade barriers, foster European supply and improve efficiency of use.
Individual countries have adopted a number of initiatives. Such initiatives pose
opportunities and risks for producing countries and investors. The rapid growth in
clean energy technologies, renewables, and hi-tech information technology caused a
substantial demand increase for a number of minerals and metals and for these
critical raw materials. (See annex B).
11
Price and cost pressures
• The end of the price super-cycle. This lasted through the first
decade of 2000, with high metal prices and strong demand
growth. China’s remarkable industrialisation drove metal markets:
its annual steel production grew eight fold to over 800 million
tons. As China slows and its growth becomes less infrastructure-
and materials-intensive, so its demand for materials will slow and
could even fall for some products. Much of the world’s population
still use low levels of metals per head, and the long-term potential
for growth in global demand use remains high. However, the
medium-term outlook is uncertain.
• Cost pressures. Rich, low-cost resources will continue to be
found. But the new mines needed to replace depleting mines and
meet growth will usually contain lower grade ore and pose more
challenges. Over a long period, advances in technology,
management and scale have helped offset such pressures, but
this may be difficult to maintain. The COO countries have a larger
share of higher-cost underground mines than their global peers.
• Exploration shortfall. Global exploration spending is highly
cyclical, and is failing to enable larger, higher-grade orebodies to
be discovered. Most of the COO countries have received a
disproportionately low share of global exploration spend
Climate change and resource efficiency
• Climate change creates significant challenges for the mining and
metals industry. These include flood and storm damage to
infrastructure, transport disruption affecting supply chain
reliability and increased competition for climate-sensitive
resources, such as water and energy.
• Increasing scarcity of resources. Adapting to climate change
and a more efficient use of resources can improve efficiency,
productivity and sustaining the industry (four per cent of the
world’s power is used in crushers and grinders).
Section 2: Mining sector context
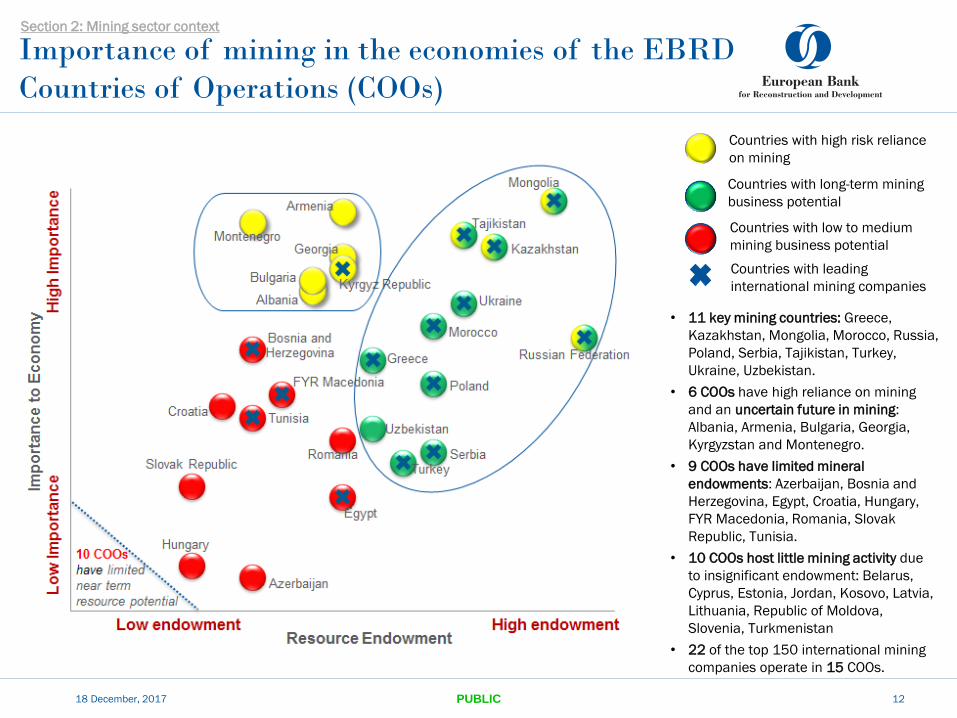
Importance of mining in the economies of the EBRD
Countries of Operations (COOs)
18 December, 2017
• 11 key mining countries: Greece,
Kazakhstan, Mongolia, Morocco, Russia,
Poland, Serbia, Tajikistan, Turkey,
Ukraine, Uzbekistan.
• 6 COOs have high reliance on mining
and an uncertain future in mining:
Albania, Armenia, Bulgaria, Georgia,
Kyrgyzstan and Montenegro.
• 9 COOs have limited mineral
endowments: Azerbaijan, Bosnia and
Herzegovina, Egypt, Croatia, Hungary,
FYR Macedonia, Romania, Slovak
Republic, Tunisia.
• 10 COOs host little mining activity due
to insignificant endowment: Belarus,
Cyprus, Estonia, Jordan, Kosovo, Latvia,
Lithuania, Republic of Moldova,
Slovenia, Turkmenistan
• 22 of the top 150 international mining
companies operate in 15 COOs.
PUBLIC
Countries with high risk reliance
on mining
Countries with long-term mining
business potential
Countries with low to medium
mining business potential
Countries with leading
international mining companies
12
Section 2: Mining sector context
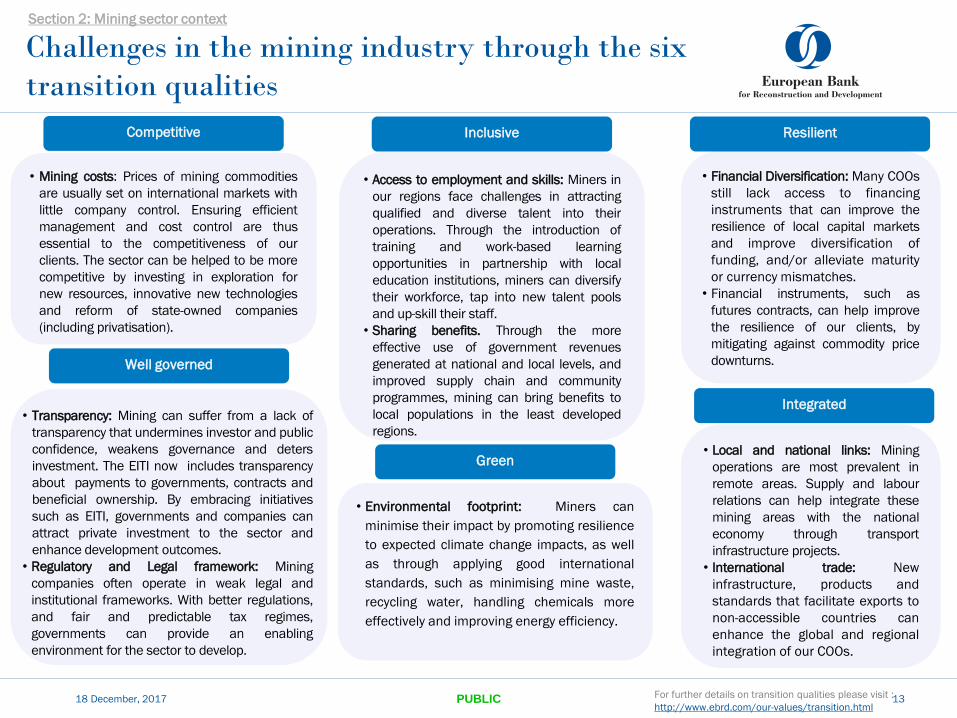
• Access to employment and skills: Miners in
our regions face challenges in attracting
qualified and diverse talent into their
operations. Through the introduction of
training and work-based learning
opportunities in partnership with local
education institutions, miners can diversify
their workforce, tap into new talent pools
and up-skill their staff.
• Sharing benefits. Through the more
effective use of government revenues
generated at national and local levels, and
improved supply chain and community
programmes, mining can bring benefits to
local populations in the least developed
regions.
Challenges in the mining industry through the six
transition qualities
18 December, 2017 PUBLIC 13
• Mining costs: Prices of mining commodities
are usually set on international markets with
little company control. Ensuring efficient
management and cost control are thus
essential to the competitiveness of our
clients. The sector can be helped to be more
competitive by investing in exploration for
new resources, innovative new technologies
and reform of state-owned companies
(including privatisation).
• Environmental footprint: Miners can
minimise their impact by promoting resilience
to expected climate change impacts, as well
as through applying good international
standards, such as minimising mine waste,
recycling water, handling chemicals more
effectively and improving energy efficiency.
Competitive
Well governed
Green
Inclusive
• Financial Diversification: Many COOs
still lack access to financing
instruments that can improve the
resilience of local capital markets
and improve diversification of
funding, and/or alleviate maturity
or currency mismatches.
• Financial instruments, such as
futures contracts, can help improve
the resilience of our clients, by
mitigating against commodity price
downturns.
Resilient
Integrated
• Local and national links: Mining
operations are most prevalent in
remote areas. Supply and labour
relations can help integrate these
mining areas with the national
economy through transport
infrastructure projects.
• International trade: New
infrastructure, products and
standards that facilitate exports to
non-accessible countries can
enhance the global and regional
integration of our COOs.
Section 2: Mining sector context
For further details on transition qualities please visit :
http://www.ebrd.com/our-values/transition.html
• Transparency: Mining can suffer from a lack of
transparency that undermines investor and public
confidence, weakens governance and deters
investment. The EITI now includes transparency
about payments to governments, contracts and
beneficial ownership. By embracing initiatives
such as EITI, governments and companies can
attract private investment to the sector and
enhance development outcomes.
• Regulatory and Legal framework: Mining
companies often operate in weak legal and
institutional frameworks. With better regulations,
and fair and predictable tax regimes,
governments can provide an enabling
environment for the sector to develop.
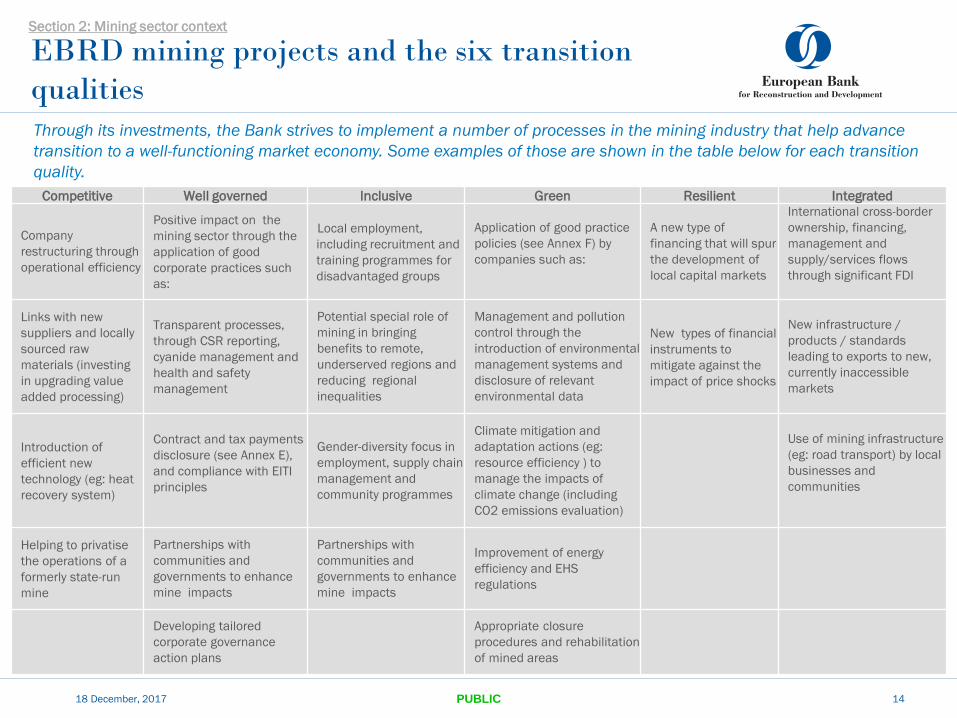
EBRD mining projects and the six transition
qualities
18 December, 2017 PUBLIC 14
Competitive Well governed Inclusive Green Resilient Integrated
Company
restructuring through
operational efficiency
Positive impact on the
mining sector through the
application of good
corporate practices such
as:
Local employment,
including recruitment and
training programmes for
disadvantaged groups
Application of good practice
policies (see Annex F) by
companies such as:
A new type of
financing that will spur
the development of
local capital markets
International cross-border
ownership, financing,
management and
supply/services flows
through significant FDI
Links with new
suppliers and locally
sourced raw
materials (investing
in upgrading value
added processing)
Transparent processes,
through CSR reporting,
cyanide management and
health and safety
management
Potential special role of
mining in bringing
benefits to remote,
underserved regions and
reducing regional
inequalities
Management and pollution
control through the
introduction of environmental
management systems and
disclosure of relevant
environmental data
New types of financial
instruments to
mitigate against the
impact of price shocks
New infrastructure /
products / standards
leading to exports to new,
currently inaccessible
markets
Introduction of
efficient new
technology (eg: heat
recovery system)
Contract and tax payments
disclosure (see Annex E),
and compliance with EITI
principles
Gender-diversity focus in
employment, supply chain
management and
community programmes
Climate mitigation and
adaptation actions (eg:
resource efficiency ) to
manage the impacts of
climate change (including
CO2 emissions evaluation)
Use of mining infrastructure
(eg: road transport) by local
businesses and
communities
Helping to privatise
the operations of a
formerly state-run
mine
Partnerships with
communities and
governments to enhance
mine impacts
Partnerships with
communities and
governments to enhance
mine impacts
Improvement of energy
efficiency and EHS
regulations
Developing tailored
corporate governance
action plans
Appropriate closure
procedures and rehabilitation
of mined areas
Section 2: Mining sector context
Through its investments, the Bank strives to implement a number of processes in the mining industry that help advance
transition to a well-functioning market economy. Some examples of those are shown in the table below for each transition
quality.
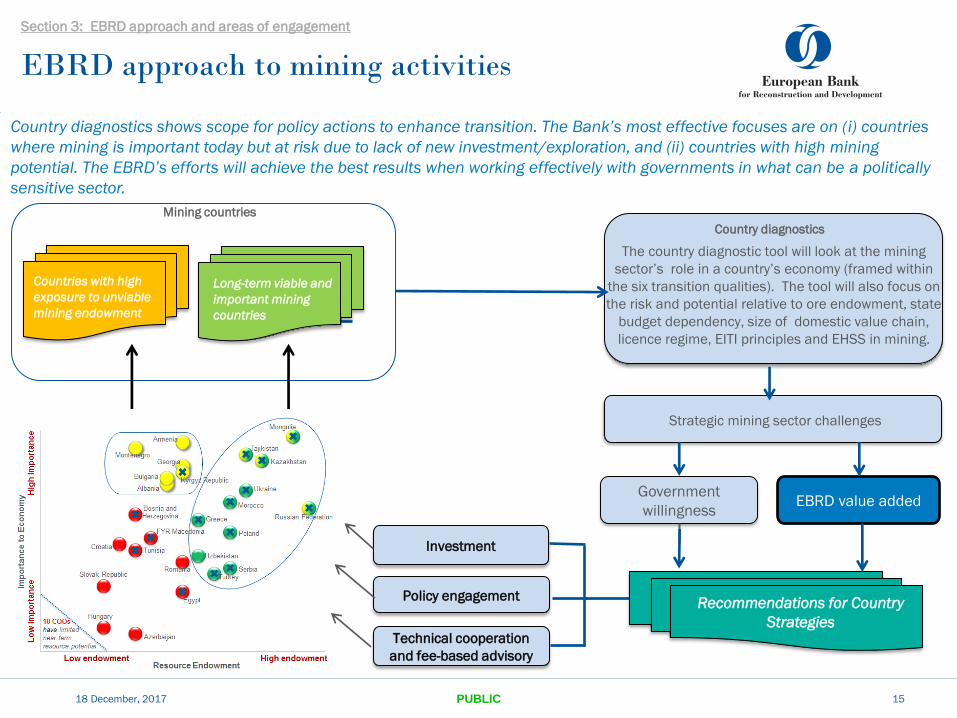
18 December, 2017 PUBLIC 15
Investment
Policy engagement
Government
willingness EBRD value added
The country diagnostic tool will look at the mining
sector’s role in a country’s economy (framed within
the six transition qualities). The tool will also focus on
the risk and potential relative to ore endowment, state
budget dependency, size of domestic value chain,
licence regime, EITI principles and EHSS in mining.
Strategic mining sector challenges
Mining countries
Countries with high
exposure to unviable
mining endowment
Recommendations for Country
Strategies
Long-term viable and
important mining
countries
Country diagnostics shows scope for policy actions to enhance transition. The Bank’s most effective focuses are on (i) countries
where mining is important today but at risk due to lack of new investment/exploration, and (ii) countries with high mining
potential. The EBRD’s efforts will achieve the best results when working effectively with governments in what can be a politically
sensitive sector.
EBRD approach to mining activities
Country diagnostics
Section 3: EBRD approach and areas of engagement
Technical cooperation
and fee-based advisory

EBRD policy engagement in the mining sector
18 December, 2017 PUBLIC 16
Business Environment
Re
so
urc
e P
ote
nti
al
Weaker Stronger
Hig
he
r
Serbia
Kazakhstan,
Mongolia, Russia.
Ukraine,
Uzbekistan,
Tajikistan,
Morocco,
Greece, Poland,
Turkey,
Armenia,
Egypt,
Kyrgyzstan
Albania, Bulgaria,
Georgia, FYR
Macedonia,
Montenegro, Tunisia,
Jordan
Lo
we
r Belarus, Moldova,
Turkmenistan
Azerbaijan, Bosnia &
Herzegovina, Kosovo,
Romania
Croatia, Cyprus,
Estonia, Hungary,
Latvia. Lithuania,
Slovenia, Slovakia
Countries with a good business environment, fair mining potential and willingness to address barriers to new
exploration and development are likely to be good opportunities for EBRD technical assistance. To maximise the
impact of these opportunities, EBRD helps induce or reignite reforms through 3 different types of policy engagement:
Section 3: EBRD approach and areas of engagement
Type I: Policy advice is provided by or under
the leadership of EBRD experts on policies
and legal/regulatory frameworks, based on
further analytical work. The EBRD offers policy
options to authorities who are committed to
reform in the mining industry and who have
requested such services from the Bank.
Type II: Capacity-building technical
assistance to institutional counterparts so as
to support policy reform implementation.
Type III: Reform advocacy aims to further
general or particular reform agenda points. It
provides analytical evidence of problems,
shares knowledge on good practices and
'nudge thinking' and gauges reform appetite
and commitment.
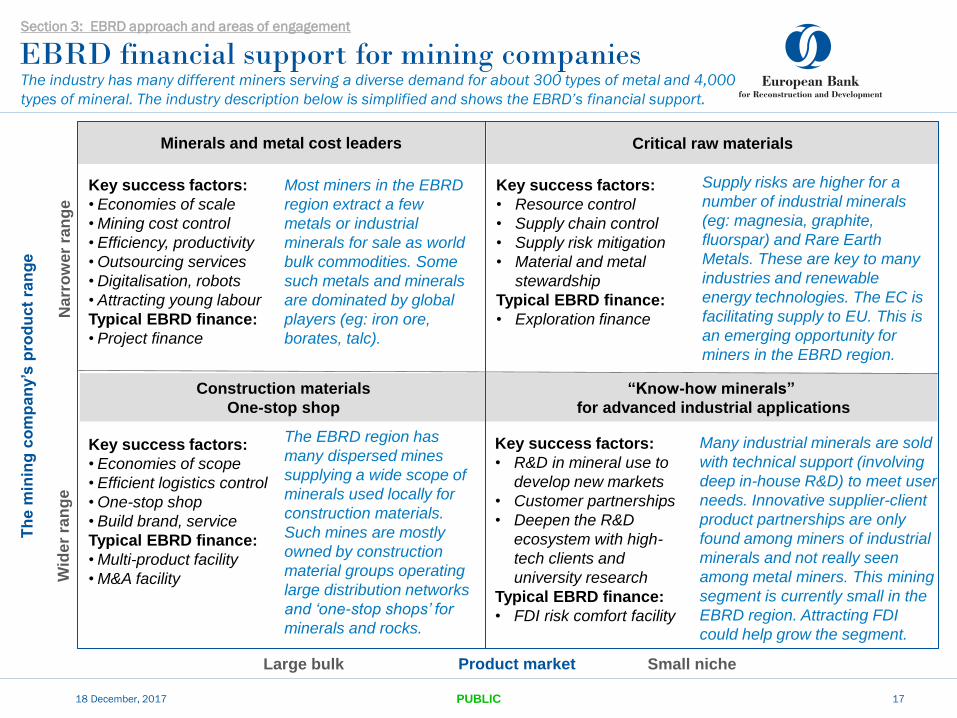
Construction materials
One-stop shop
Critical raw materials
Minerals and metal cost leaders
“Know-how minerals”
for advanced industrial applications
EBRD financial support for mining companies
18 December, 2017 PUBLIC
Th
e m
inin
g c
om
pa
ny’s
pro
du
ct
ran
ge
Narr
ow
er
ran
ge
W
ide
r ra
ng
e
Key success factors:
• Economies of scale
• Mining cost control
• Efficiency, productivity
• Outsourcing services
• Digitalisation, robots
• Attracting young labour
Typical EBRD finance:
• Project finance
Key success factors:
• Resource control
• Supply chain control
• Supply risk mitigation
• Material and metal
stewardship
Typical EBRD finance:
• Exploration finance
Key success factors:
• Economies of scope
• Efficient logistics control
• One-stop shop
• Build brand, service
Typical EBRD finance:
• Multi-product facility
• M&A facility
Key success factors:
• R&D in mineral use to
develop new markets
• Customer partnerships
• Deepen the R&D
ecosystem with high-
tech clients and
university research
Typical EBRD finance:
• FDI risk comfort facility
Large bulk Small niche Product market
Many industrial minerals are sold
with technical support (involving
deep in-house R&D) to meet user
needs. Innovative supplier-client
product partnerships are only
found among miners of industrial
minerals and not really seen
among metal miners. This mining
segment is currently small in the
EBRD region. Attracting FDI
could help grow the segment.
Most miners in the EBRD
region extract a few
metals or industrial
minerals for sale as world
bulk commodities. Some
such metals and minerals
are dominated by global
players (eg: iron ore,
borates, talc).
The EBRD region has
many dispersed mines
supplying a wide scope of
minerals used locally for
construction materials.
Such mines are mostly
owned by construction
material groups operating
large distribution networks
and ‘one-stop shops’ for
minerals and rocks.
Supply risks are higher for a
number of industrial minerals
(eg: magnesia, graphite,
fluorspar) and Rare Earth
Metals. These are key to many
industries and renewable
energy technologies. The EC is
facilitating supply to EU. This is
an emerging opportunity for
miners in the EBRD region.
17
Section 3: EBRD approach and areas of engagement
The industry has many different miners serving a diverse demand for about 300 types of metal and 4,000
types of mineral. The industry description below is simplified and shows the EBRD’s financial support.
18 December, 2017 PUBLIC
Su
pp
lie
r’s
ta
rge
t m
inin
g a
cti
vit
ies
Eq
uip
me
nt
Se
rvic
es
Universal works are mostly
provided by integrated
companies providing
construction services to
various industries,
including mining. Local
SMEs are very often
subcontracted and add
local impact to projects.
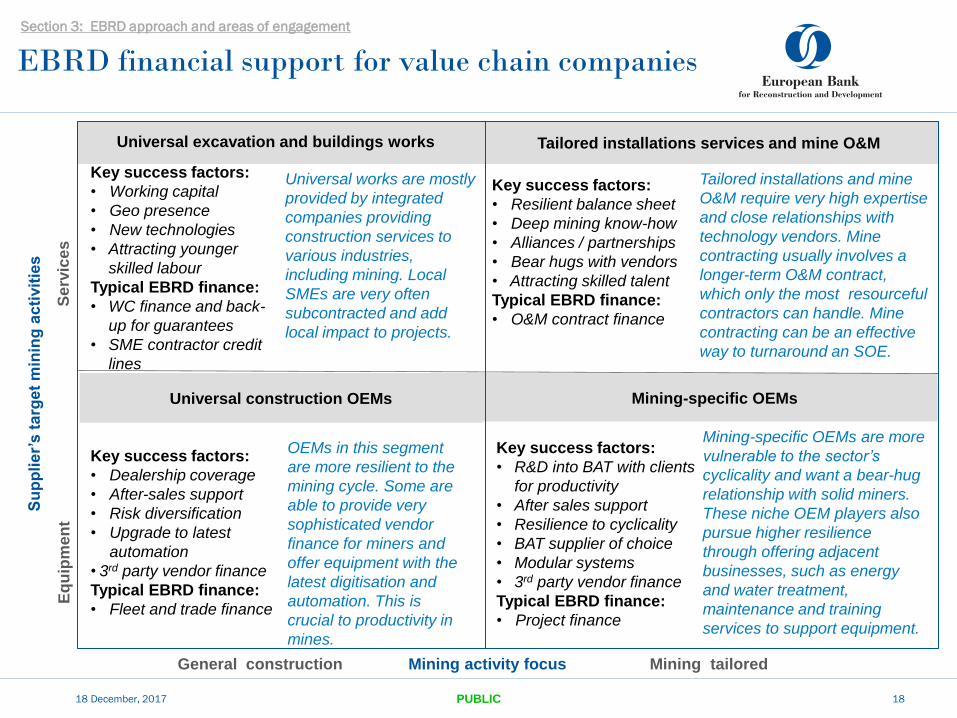
EBRD financial support for value chain companies
Key success factors:
• Working capital
• Geo presence
• New technologies
• Attracting younger
skilled labour
Typical EBRD finance:
• WC finance and back-
up for guarantees
• SME contractor credit
lines
Universal excavation and buildings works Tailored installations services and mine O&M
Key success factors:
• Resilient balance sheet
• Deep mining know-how
• Alliances / partnerships
• Bear hugs with vendors
• Attracting skilled talent
Typical EBRD finance:
• O&M contract finance
Tailored installations and mine
O&M require very high expertise
and close relationships with
technology vendors. Mine
contracting usually involves a
longer-term O&M contract,
which only the most resourceful
contractors can handle. Mine
contracting can be an effective
way to turnaround an SOE.
Mining-specific OEMs are more
vulnerable to the sector’s
cyclicality and want a bear-hug
relationship with solid miners.
These niche OEM players also
pursue higher resilience
through offering adjacent
businesses, such as energy
and water treatment,
maintenance and training
services to support equipment.
Key success factors:
• R&D into BAT with clients
for productivity
• After sales support
• Resilience to cyclicality
• BAT supplier of choice
• Modular systems
• 3rd party vendor finance
Typical EBRD finance:
• Project finance
Mining-specific OEMs
Key success factors:
• Dealership coverage
• After-sales support
• Risk diversification
• Upgrade to latest
automation
• 3rd party vendor finance
Typical EBRD finance:
• Fleet and trade finance
OEMs in this segment
are more resilient to the
mining cycle. Some are
able to provide very
sophisticated vendor
finance for miners and
offer equipment with the
latest digitisation and
automation. This is
crucial to productivity in
mines.
Universal construction OEMs
General construction Mining tailored Mining activity focus
18
Section 3: EBRD approach and areas of engagement
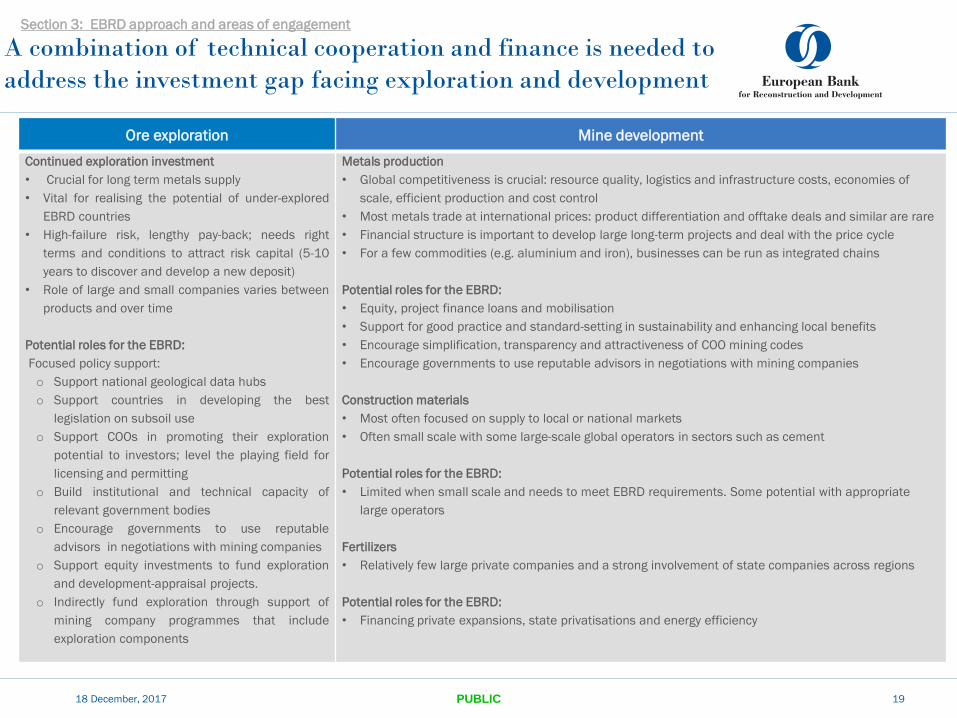
A combination of technical cooperation and finance is needed to
address the investment gap facing exploration and development
Ore exploration Mine development
Continued exploration investment
• Crucial for long term metals supply
• Vital for realising the potential of under-explored
EBRD countries
• High-failure risk, lengthy pay-back; needs right
terms and conditions to attract risk capital (5-10
years to discover and develop a new deposit)
• Role of large and small companies varies between
products and over time
Potential roles for the EBRD:
Focused policy support:
o Support national geological data hubs
o Support countries in developing the best
legislation on subsoil use
o Support COOs in promoting their exploration
potential to investors; level the playing field for
licensing and permitting
o Build institutional and technical capacity of
relevant government bodies
o Encourage governments to use reputable
advisors in negotiations with mining companies
o Support equity investments to fund exploration
and development-appraisal projects.
o Indirectly fund exploration through support of
mining company programmes that include
exploration components
Metals production
• Global competitiveness is crucial: resource quality, logistics and infrastructure costs, economies of
scale, efficient production and cost control
• Most metals trade at international prices: product differentiation and offtake deals and similar are rare
• Financial structure is important to develop large long-term projects and deal with the price cycle
• For a few commodities (e.g. aluminium and iron), businesses can be run as integrated chains
Potential roles for the EBRD:
• Equity, project finance loans and mobilisation
• Support for good practice and standard-setting in sustainability and enhancing local benefits
• Encourage simplification, transparency and attractiveness of COO mining codes
• Encourage governments to use reputable advisors in negotiations with mining companies
Construction materials
• Most often focused on supply to local or national markets
• Often small scale with some large-scale global operators in sectors such as cement
Potential roles for the EBRD:
• Limited when small scale and needs to meet EBRD requirements. Some potential with appropriate
large operators
Fertilizers
• Relatively few large private companies and a strong involvement of state companies across regions
Potential roles for the EBRD:
• Financing private expansions, state privatisations and energy efficiency
18 December, 2017 PUBLIC 19
Section 3: EBRD approach and areas of engagement
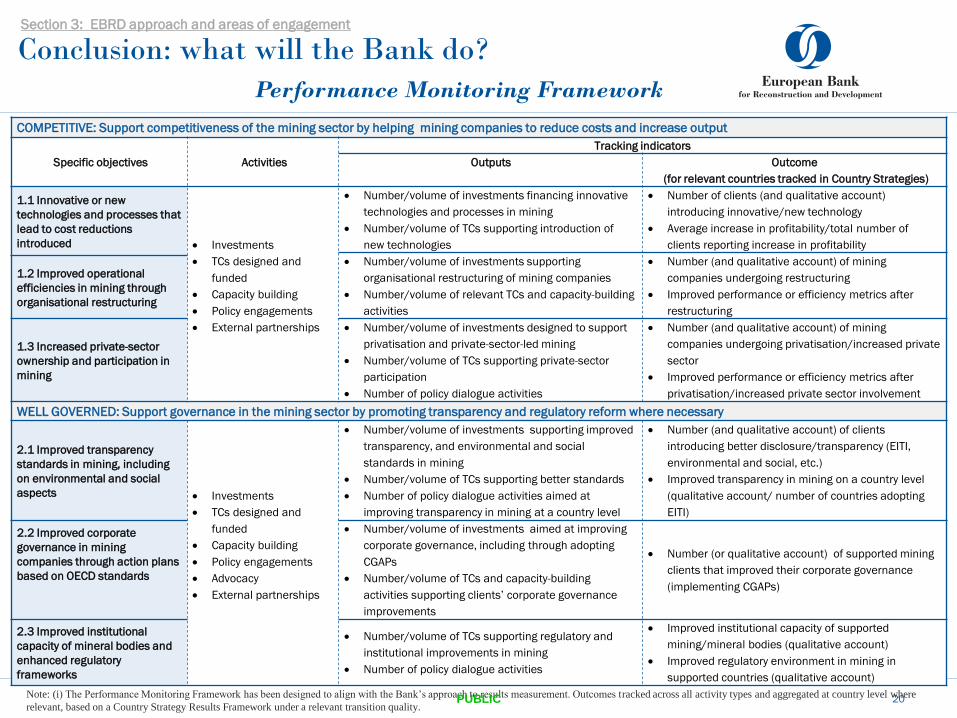
Conclusion: what will the Bank do?
20
Note: (i) The Performance Monitoring Framework has been designed to align with the Bank’s approach to results measurement. Outcomes tracked across all activity types and aggregated at country level where
relevant, based on a Country Strategy Results Framework under a relevant transition quality.
COMPETITIVE: Support competitiveness of the mining sector by helping mining companies to reduce costs and increase output
Specific objectives Activities
Tracking indicators
Outputs Outcome
(for relevant countries tracked in Country Strategies)
1.1 Innovative or new
technologies and processes that
lead to cost reductions
introduced Investments
TCs designed and
funded
Capacity building
Policy engagements
External partnerships
Number/volume of investments financing innovative
technologies and processes in mining
Number/volume of TCs supporting introduction of
new technologies
Number of clients (and qualitative account)
introducing innovative/new technology
Average increase in profitability/total number of
clients reporting increase in profitability
Number/volume of investments supporting
organisational restructuring of mining companies
Number/volume of relevant TCs and capacity-building
activities
Number (and qualitative account) of mining
companies undergoing restructuring
Improved performance or efficiency metrics after
restructuring
1.2 Improved operational
efficiencies in mining through
organisational restructuring
1.3 Increased private-sector
ownership and participation in
mining
Number/volume of investments designed to support
privatisation and private-sector-led mining
Number/volume of TCs supporting private-sector
participation
Number of policy dialogue activities
Number (and qualitative account) of mining
companies undergoing privatisation/increased private
sector
Improved performance or efficiency metrics after
privatisation/increased private sector involvement
WELL GOVERNED: Support governance in the mining sector by promoting transparency and regulatory reform where necessary
2.1 Improved transparency
standards in mining, including
on environmental and social
aspects Investments
TCs designed and
funded
Capacity building
Policy engagements
Advocacy
External partnerships
Number/volume of investments supporting improved
transparency, and environmental and social
standards in mining
Number/volume of TCs supporting better standards
Number of policy dialogue activities aimed at
improving transparency in mining at a country level
Number (and qualitative account) of clients
introducing better disclosure/transparency (EITI,
environmental and social, etc.)
Improved transparency in mining on a country level
(qualitative account/ number of countries adopting
EITI)
2.2 Improved corporate
governance in mining
companies through action plans
based on OECD standards
Number/volume of investments aimed at improving
corporate governance, including through adopting
CGAPs
Number/volume of TCs and capacity-building
activities supporting clients’ corporate governance
improvements
Number (or qualitative account) of supported mining
clients that improved their corporate governance
(implementing CGAPs)
2.3 Improved institutional
capacity of mineral bodies and
enhanced regulatory
frameworks
Number/volume of TCs supporting regulatory and
institutional improvements in mining
Number of policy dialogue activities
Improved institutional capacity of supported
mining/mineral bodies (qualitative account)
Improved regulatory environment in mining in
supported countries (qualitative account)
Section 3: EBRD approach and areas of engagement
Performance Monitoring Framework
PUBLIC
21
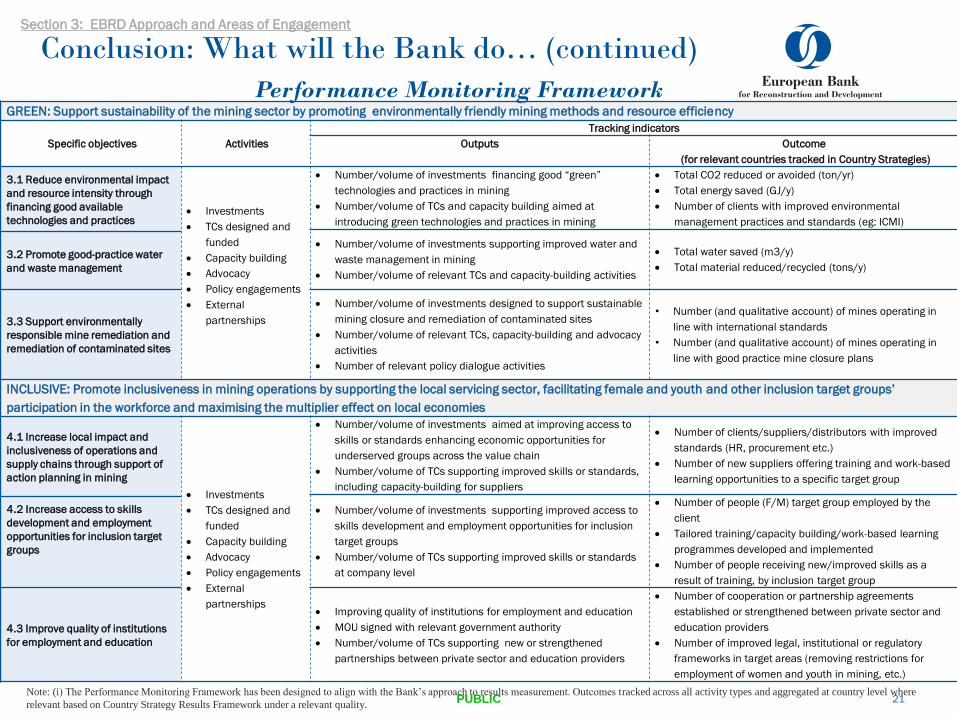
Note: (i) The Performance Monitoring Framework has been designed to align with the Bank’s approach to results measurement. Outcomes tracked across all activity types and aggregated at country level where
relevant based on Country Strategy Results Framework under a relevant quality.
GREEN: Support sustainability of the mining sector by promoting environmentally friendly mining methods and resource efficiency
Specific objectives Activities
Tracking indicators
Outputs Outcome
(for relevant countries tracked in Country Strategies)
3.1 Reduce environmental impact
and resource intensity through
financing good available
technologies and practices Investments
TCs designed and
funded
Capacity building
Advocacy
Policy engagements
External
partnerships
Number/volume of investments financing good “green”
technologies and practices in mining
Number/volume of TCs and capacity building aimed at
introducing green technologies and practices in mining
Total CO2 reduced or avoided (ton/yr)
Total energy saved (GJ/y)
Number of clients with improved environmental
management practices and standards (eg: ICMI)
Number/volume of investments supporting improved water and
waste management in mining
Number/volume of relevant TCs and capacity-building activities
Total water saved (m3/y)
Total material reduced/recycled (tons/y)
3.2 Promote good-practice water
and waste management
3.3 Support environmentally
responsible mine remediation and
remediation of contaminated sites
Number/volume of investments designed to support sustainable
mining closure and remediation of contaminated sites
Number/volume of relevant TCs, capacity-building and advocacy
activities
Number of relevant policy dialogue activities
• Number (and qualitative account) of mines operating in
line with international standards
• Number (and qualitative account) of mines operating in
line with good practice mine closure plans
INCLUSIVE: Promote inclusiveness in mining operations by supporting the local servicing sector, facilitating female and youth and other inclusion target groups’
participation in the workforce and maximising the multiplier effect on local economies
4.1 Increase local impact and
inclusiveness of operations and
supply chains through support of
action planning in mining
Investments
TCs designed and
funded
Capacity building
Advocacy
Policy engagements
External
partnerships
Number/volume of investments aimed at improving access to
skills or standards enhancing economic opportunities for
underserved groups across the value chain
Number/volume of TCs supporting improved skills or standards,
including capacity-building for suppliers
Number of clients/suppliers/distributors with improved
standards (HR, procurement etc.)
Number of new suppliers offering training and work-based
learning opportunities to a specific target group
Number/volume of investments supporting improved access to
skills development and employment opportunities for inclusion
target groups
Number/volume of TCs supporting improved skills or standards
at company level
Number of people (F/M) target group employed by the
client
Tailored training/capacity building/work-based learning
programmes developed and implemented
Number of people receiving new/improved skills as a
result of training, by inclusion target group
4.2 Increase access to skills
development and employment
opportunities for inclusion target
groups
4.3 Improve quality of institutions
for employment and education
Improving quality of institutions for employment and education
MOU signed with relevant government authority
Number/volume of TCs supporting new or strengthened
partnerships between private sector and education providers
Number of cooperation or partnership agreements
established or strengthened between private sector and
education providers
Number of improved legal, institutional or regulatory
frameworks in target areas (removing restrictions for
employment of women and youth in mining, etc.)
Section 3: EBRD Approach and Areas of Engagement
Conclusion: What will the Bank do… (continued)
Performance Monitoring Framework
PUBLIC

• In Mongolia, the World Bank (IFC, MIGA, IBRD)
participated in financing Oyu Tolgoi. ADB and the World
Bank are also active in financing regional infrastructure
for mining, and extensive policy dialogue on
transparency, licencing and regional inclusion. Active
bilateral agencies are from countries including
Germany (GIZ, BGR, KfW), Korea (KIGAM), Canada,
Australia and Czech Republic.
• In the Kyrgyzstan, the Bank is working closely with
USAID, DFID and the World Bank on EITI
implementation assistance.
• In Kazakhstan, apart from the EBRD there are no other
IFIs currently involved in financing mining projects or
engaged in policy dialogue with the government.
• In SEMED, IFC is active in financing junior mining
projects in Morocco. AfDB has financed OCP in
Morocco and is engaged in policy dialogue on
governance through the African Legal Support Facility.
• In Central and Eastern Europe, the rest of the CIS and
Turkey, IFC and the EBRD have been the only IFIs
financing projects. Policy dialogue is limited.
• AIIB and EIB have no outstanding financing for mine
development in EBRD countries of operations.
Working With Other IFIs
Partners Geography Policy
Kyr
gyz
sta
n
Ka
zak
hsta
n
Ca
uca
su
s
Oth
er
CIS
Mo
ngo
lia
Tu
rke
y
CE
E
SE
ME
D
EU
Co
un
trie
s
Co
mp
eti
tive
ne
ss
Go
ve
rna
nce
Gre
en
Inclu
sio
n
Re
silie
nce
Inte
gra
tio
n
ADB
World Bank
IFC
AfDB
Bilaterals*
EBRD €P
€P
*Including: USAID, DFID, FMO, KfW, DEG, BGR, Australian AID, CESO, Government of
Canada, GIZ, Government of Finland, Swiss Agency for Development and Cooperation,
KIGAM, Czech Republic, BGR, Eurasian Development Bank.
€
P Area of significant
policy dialogue
Area of significant
investment Focus mostly
on private sector
Focus mostly on
public sector
PUBLIC
P
€
€P
€P P
P
P
P P P P
P
P
P
P P
€ € €
€P € € €
€P
P
€
P
€ €P €P
P
€
€
€
€P
€
22
Section 3: EBRD Approach and Areas of Engagement
Annexes
18 December, 2017 PUBLIC 23
Annex A: General messages from public consultations
Annex B: Critical raw materials for the EU
Annex C: Two examples of past EBRD projects
Annex D: An example of policy dialogue: economic and gender inclusion in natural resources (Kazakhstan)
Annex E: Subsoil contracts and licenses
Annex F: The Environmental and Social Policy and The Extractive Mining Industries Strategy
Annex G: Mining snapshot country slides:
1. Albania
2. Armenia
3. Bulgaria
4. Georgia
5. Greece
6. Kazakhstan
7. Kyrgyzstan
8. Mongolia
10. Montenegro
11. Morocco
12. Poland
13. Russia
14. Serbia
15. Tajikistan
16. Turkey
17. Ukraine
18. Uzbekistan
General messages from Public Consultations
18 December, 2017 PUBLIC 24
• There is a growing importance of climate change to the industry, which pose threats and opportunities.
• The industry must focus more to align outcomes with sustainable development goals (SDGs).
• Miners should work together to advance reforms in in the fields of trade, education and infrastructure.
• Transparency requirements from IFIs, EITI and Stock Exchanges have important impacts, albeit uneven.
It is particularly important to advance disclosure on-line, which are easy to find and review.
• EBRD should:
o Support private infrastructure with mines as anchor tenants operated as open access.
o Robustly support transparency, human rights and local civil society.
o Recognize progress made by countries to encourage reformers.
o Take account of climate change and encourage governments to take a long term strategic approach.
o Require good cost benefit analysis by governments while EBRD should include use of carbon shadow
costs, full mine life analysis and account for cumulative impacts from multiple developments.
o Work with smaller companies less able to manage complex and competing issues.
o Account for water issues including catchment area impacts, conflict avoidance and bio-diversity loss.
o Take a broad approach to gender issues in mining including management and entrepreneurship.
Feedback from discussions with civil society groups, industry bodies, mining companies and general public
can be summarised as follows:
Annex A
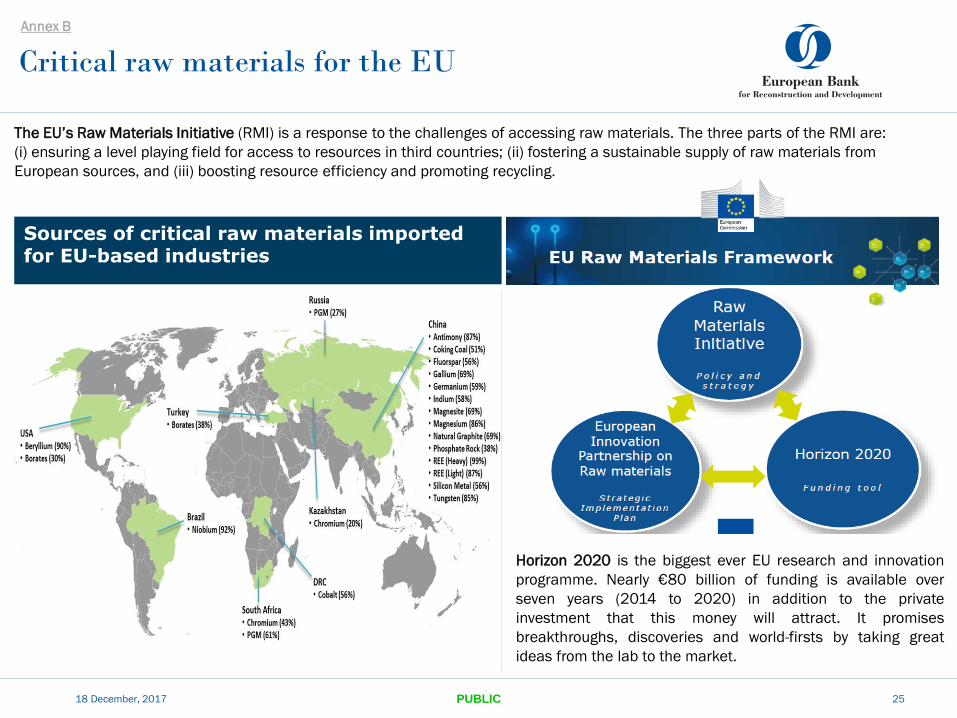
Critical raw materials for the EU
18 December, 2017 PUBLIC 25
Sources of critical raw materials imported for EU-based industries
Horizon 2020 is the biggest ever EU research and innovation
programme. Nearly €80 billion of funding is available over
seven years (2014 to 2020) in addition to the private
investment that this money will attract. It promises
breakthroughs, discoveries and world-firsts by taking great
ideas from the lab to the market.
The EU’s Raw Materials Initiative (RMI) is a response to the challenges of accessing raw materials. The three parts of the RMI are:
(i) ensuring a level playing field for access to resources in third countries; (ii) fostering a sustainable supply of raw materials from
European sources, and (iii) boosting resource efficiency and promoting recycling.
Annex B
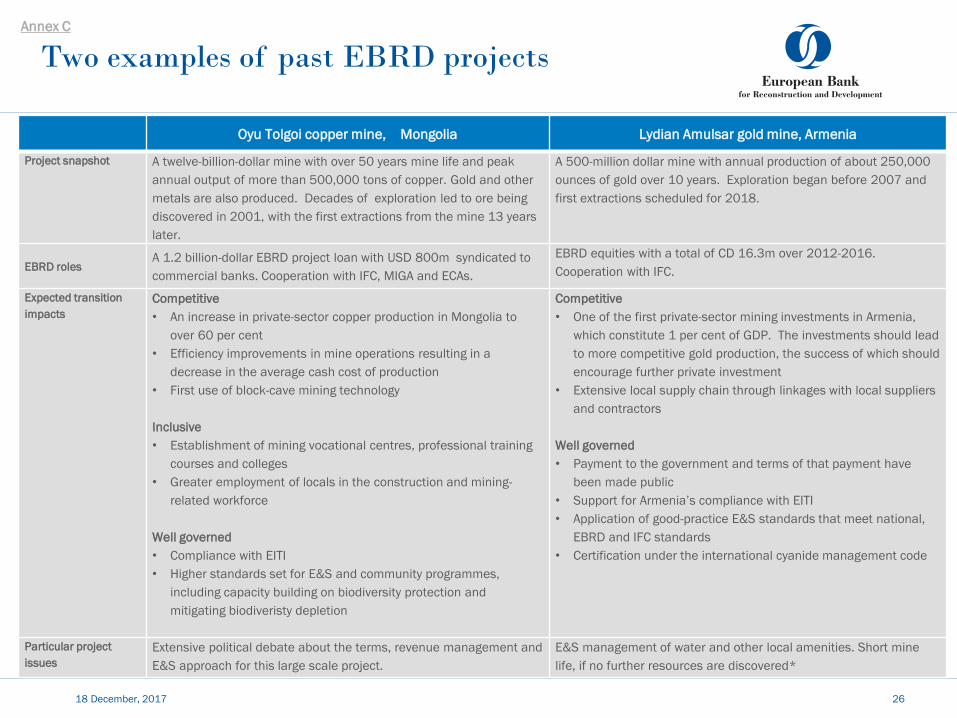
Two examples of past EBRD projects
Oyu Tolgoi copper mine, Mongolia Lydian Amulsar gold mine, Armenia
Project snapshot A twelve-billion-dollar mine with over 50 years mine life and peak
annual output of more than 500,000 tons of copper. Gold and other
metals are also produced. Decades of exploration led to ore being
discovered in 2001, with the first extractions from the mine 13 years
later.
A 500-million dollar mine with annual production of about 250,000
ounces of gold over 10 years. Exploration began before 2007 and
first extractions scheduled for 2018.
EBRD roles A 1.2 billion-dollar EBRD project loan with USD 800m syndicated to
commercial banks. Cooperation with IFC, MIGA and ECAs.
EBRD equities with a total of CD 16.3m over 2012-2016.
Cooperation with IFC.
Expected transition
impacts
Competitive
• An increase in private-sector copper production in Mongolia to
over 60 per cent
• Efficiency improvements in mine operations resulting in a
decrease in the average cash cost of production
• First use of block-cave mining technology
Inclusive
• Establishment of mining vocational centres, professional training
courses and colleges
• Greater employment of locals in the construction and mining-
related workforce
Well governed
• Compliance with EITI
• Higher standards set for E&S and community programmes,
including capacity building on biodiversity protection and
mitigating biodiveristy depletion
Competitive
• One of the first private-sector mining investments in Armenia,
which constitute 1 per cent of GDP. The investments should lead
to more competitive gold production, the success of which should
encourage further private investment
• Extensive local supply chain through linkages with local suppliers
and contractors
Well governed
• Payment to the government and terms of that payment have
been made public
• Support for Armenia’s compliance with EITI
• Application of good-practice E&S standards that meet national,
EBRD and IFC standards
• Certification under the international cyanide management code
Particular project
issues
Extensive political debate about the terms, revenue management and
E&S approach for this large scale project.
E&S management of water and other local amenities. Short mine
life, if no further resources are discovered*
18 December, 2017
PUBLIC
26
Annex C
An example of policy dialogue: economic and gender
inclusion in natural resources (Kazakhstan)
18 December, 2017 PUBLIC 27
Business problem
• Despite its natural resources endowment, Kazakhstan’s
exploration and processing activities have lagged behind. This has
constrained regional economic development, particularly in remote
areas. The main reasons for this are a lack of new technologies
and skilled personnel, and to the challenges of retaining,
developing and engaging the country’s best talent.
• Additionally, women do not enjoy equal access to mining-related
employment opportunities. Article 16, section 27 of the 2016
Kazakhstan Employment and Labour Code still bars women from
287 roles mainly concentrated in the mining, metallurgy,
hydrocarbon-processing, construction and transport sectors.
• EBRD mining clients sought the Bank’s support to address a skills
mismatch, overcome a heavy male bias in staffing, and realise the
benefits of a truly diverse workforce, where opportunities are not
restricted by age, gender or region.
Solution
• In 2017, the EBRD launched its Integrated Approach to Economic
Inclusion in Natural Resources through a set of measurable and
achievable project- and policy-level inclusion transition goals in
the sectors of natural resources, and power and energy.
• The background for this approach is an indicative set of projects
amounting to one billion US dollars of EBRD investments across
10 projects that are currently in the pipeline.
Expected outcomes
• An enhanced local provision of quality vocational training through
partnerships between vocational schools and employers;
• An improvement in the quality and accessibility of local work-
based learning opportunities, including internships, traineeships
and apprenticeships;
• Establishing national skills standards as part of developing
Kazakhstan’s National Qualifications Framework in disciplines
relevant to the sectors of natural resources, and power and
energy;
• The removal of legal barriers to allow women to work freely across
high-value sectors. This could be achieved by working with the
government and leveraging the Bank’s private-sector clients.
Achievements to date
• The EBRD’s policy dialogue and representation on behalf of its
mining clients was reflected in the goals and action plan of
Kazakhstan’s Concept on Gender and Family in Kazakhstan to
2030. This is a national strategy launched in 2017, and the first of
its kind to tap into the private sector’s potential to intensify efforts
to promote gender equality.
• The Minister of labour and social protection committed to submit,
by the end of 2017 ‘concrete proposals’ to ‘optimize the list’ of
jobs that prohibit women’s employment.
• The EBRD continues to work with clients and the State Secretary
to identify priority jobs that can be removed from prohibited list.
Annex D
Subsoil contracts and licenses
18 December, 2017 PUBLIC 28
Transparency over the award of, and payments under, subsoil contracts and licenses, which include host-government
agreements and production-sharing contracts, is a useful tool for a country's civil society. It can be used to hold a
government accountable for the way in which national extractive assets are attributed and in which the revenues
generated are spent.
The Bank will encourage its clients to make public the subsoil contracts and licences of the project. One year from
the date of the approval of this strategy, the Bank will also require that, in the case of mining projects which it
finances, the principal contract or licence with government should be made public. The principal contract or licence
sets out the key terms and conditions under which a resource will be exploited, and any significant amendments to
that contract or licence. The Bank will allow the redaction of commercially proprietary information that is not
essential to understand the terms and conditions under which the resource is to be developed and that would not
create a competitive disadvantage for the client.
The Bank may accept, in lieu of disclosure, that the client publishes a summary of the key terms and conditions
under which the mining resource is to be developed. This summary shall include the life of the contract or licence;
any material payments due to government under the contract or licence; other material fiscal terms and conditions;
and a summary of any significant stabilisation clauses. In cases where the Bank provides financing for multiple
corporate purposes rather than for one specific project, the requirement for contract or license disclosure shall only
apply to the principal investment for which funds are to be used.
Annex E
Environmental and Social Policy and Extractive
Mining Industries Strategy
18 December, 2017 PUBLIC 29
The Environmental and Social Policy (2014) and associated Performance Requirements (PRs) establish the
criteria for any EBRD financing.
The PRs are applied practically on a risk basis. As mining is generally considered “high risk” , the PRs are strictly
applied to all mining sector projects. The PRs set the minimum environmental and social requirements for
financing. The Bank may seek performance that exceeds the Performance Requirements.
The issues typically faced on mining projects include overall environmental and social management; labour and
working conditions; pollution prevention; water management; waste management; the health and safety of
workers and communities; compensation for economic and/or physical displacement; impacts on biodiversity
caused by land take and/or habitat fragmentation; the preservation of cultural resources; and the provision of
meaningful consultation with local communities to ensure that they are aware of site activities and operations,
and to ensure that communities understand how to seek additional information and how to file a grievance.
Details of the Environmental and Social Policy can be found at:
http://www.ebrd.com/news/publications/policies/environmental-and-social-policy-esp.html
Annex F
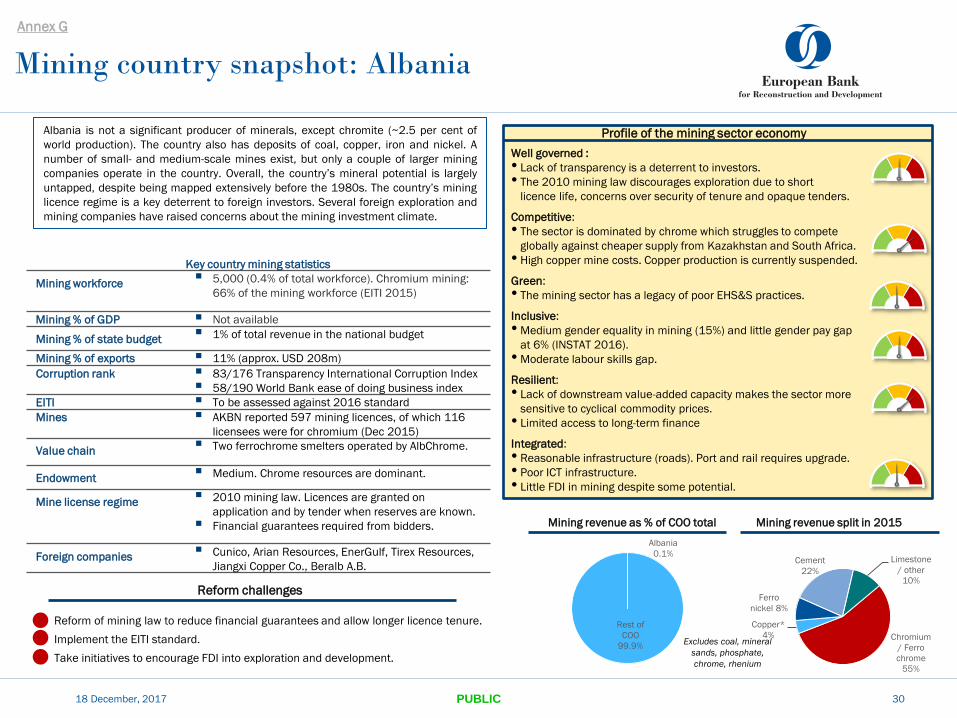
Reform of mining law to reduce financial guarantees and allow longer licence tenure.
Implement the EITI standard.
Take initiatives to encourage FDI into exploration and development.
Albania
0.1%
Rest of
COO
99.9%
Mining country snapshot: Albania
18 December, 2017 30
Reform challenges
Albania is not a significant producer of minerals, except chromite (~2.5 per cent of
world production). The country also has deposits of coal, copper, iron and nickel. A
number of small- and medium-scale mines exist, but only a couple of larger mining
companies operate in the country. Overall, the country’s mineral potential is largely
untapped, despite being mapped extensively before the 1980s. The country’s mining
licence regime is a key deterrent to foreign investors. Several foreign exploration and
mining companies have raised concerns about the mining investment climate.
Profile of the mining sector economy
Key country mining statistics
Mining workforce 5,000 (0.4% of total workforce). Chromium mining:
66% of the mining workforce (EITI 2015)
Mining % of GDP Not available
Mining % of state budget 1% of total revenue in the national budget
Mining % of exports 11% (approx. USD 208m)
Corruption rank 83/176 Transparency International Corruption Index
58/190 World Bank ease of doing business index
EITI To be assessed against 2016 standard
Mines AKBN reported 597 mining licences, of which 116
licensees were for chromium (Dec 2015)
Value chain Two ferrochrome smelters operated by AlbChrome.
Endowment Medium. Chrome resources are dominant.
Mine license regime 2010 mining law. Licences are granted on
application and by tender when reserves are known.
Financial guarantees required from bidders.
Foreign companies Cunico, Arian Resources, EnerGulf, Tirex Resources,
Jiangxi Copper Co., Beralb A.B.
Well governed :
• Lack of transparency is a deterrent to investors.
• The 2010 mining law discourages exploration due to short
licence life, concerns over security of tenure and opaque tenders.
Competitive:
• The sector is dominated by chrome which struggles to compete
globally against cheaper supply from Kazakhstan and South Africa.
• High copper mine costs. Copper production is currently suspended.
Green:
• The mining sector has a legacy of poor EHS&S practices.
Inclusive:
• Medium gender equality in mining (15%) and little gender pay gap
at 6% (INSTAT 2016).
• Moderate labour skills gap.
Resilient:
• Lack of downstream value-added capacity makes the sector more
sensitive to cyclical commodity prices.
• Limited access to long-term finance
Integrated:
• Reasonable infrastructure (roads). Port and rail requires upgrade.
• Poor ICT infrastructure.
• Little FDI in mining despite some potential.
Mining revenue split in 2015 Mining revenue as % of COO total
Chromium
/ Ferro
chrome
55%
Copper*
4%
Ferro
nickel 8%
Cement
22%
Limestone
/ other
10%
Annex G
Excludes coal, mineral
sands, phosphate,
chrome, rhenium
PUBLIC

• Proactively encourage transparent FDI into exploration and development.
• Implement EITI and increase transparency of private companies.
Review sustainable options for value chain (smelter) upgrade.
Copper 61%
Molybdenum
13%
Gold 18% Silver 7%
Zinc 1%
Mining country snapshot: Armenia
18 December, 2017 31
Armenia sits within the Tethyan tectonic belt, which is highly prospective for large
copper and gold orebodies. The country has significant deposits of gold, copper and
molybdenum, with smaller deposits of zinc, lead, iron, rhenium and silver. Mining
constitutes about 50 per cent of GDP, driven in part by new mine developments
such as the Vallex’s Teghut copper mine. Copper concentrate and gold provide half
of the country’s exports. Domestic copper smelting capacity can handle less than 10
per cent of requirements in 2017. Mining is a key sector for the government.
Profile of the mining sector economy
Key country mining statistics
Mining workforce 9,300 or 0.9% of workforce (Armstat)
Mining % of GDP 3.4% (Armstat)
Mining % of state budget Not available
Mining % of exports 44% (World Bank 2015)
Corruption rank 113 /176 TI Corruption index
38/219 World Bank ease of doing business index
EITI Joined in March 2017, yet to be assessed
Mines More than 400 out of 850 known deposits are
being exploited by 474 companies. 30 metal
deposits
Value chain The Alaverdi copper smelter requires an upgrade.
Endowment Medium. Mainly copper-molybdenum, gold and
zinc.
Mine license regime Relatively progressive mining code (2012)
Foreign companies Polymetal, Cronimet, Lydian, Orogen Gold,
GeoProMining
Well governed:
• Revenue and production reporting should improve with
EITI membership.
• Corruption perception has fallen since 2014 (Transparency Int.)
• Positive new mining laws enacted in 2012 in collaboration with IFIs.
Competitive:
• Relatively low-grade copper ore deposits.
• Mining costs of existing operations appear average-to-high.
• Reasonable electricity prices.
• Copper mines at disadvantage due to low product (concentrate) grade.
Increased local smelting capacity would help.
Green:
• Weak reporting by miners on sustainability programmes.
• Value chain requires upgrade to meet environmental standards.
• Strict environmental standards for new mining projects are needed
Inclusive:
• Female share of employment in mining is 13% (ILO).
• Large skills gap in mining labour force.
Resilient:
• Reasonably successful in diversifying risks in the mining sector.
• Limited access to long-term finance
Integrated:
• Good infrastructure, but landlocked.
• No export restrictions on minerals, except EU export licence on gold.
Excludes coal, mineral
sands, phosphate,
chrome, rhenium
Mining revenue split Mining revenue as % of COO total
Armenia
1%
Rest of
COO
99%
PUBLIC
Reform challenges
Annex G
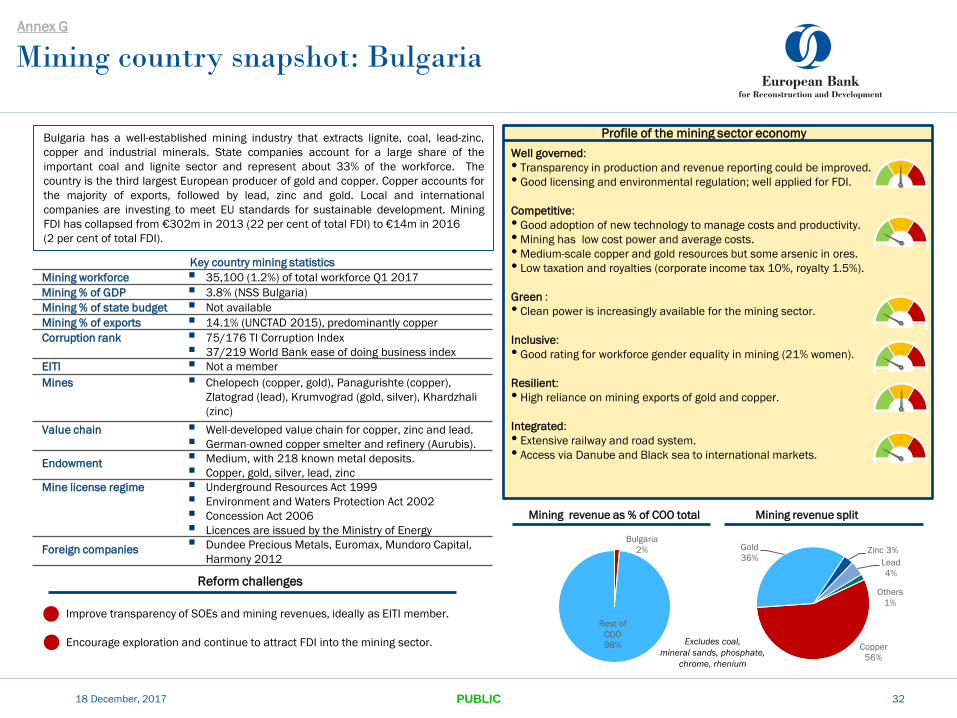
Improve transparency of SOEs and mining revenues, ideally as EITI member.
Encourage exploration and continue to attract FDI into the mining sector.
Mining country snapshot: Bulgaria
18 December, 2017 32
Mining revenue split Mining revenue as % of COO total
Copper
56%
Gold
36% Zinc 3%
Lead
4%
Others
1%
Bulgaria has a well-established mining industry that extracts lignite, coal, lead-zinc,
copper and industrial minerals. State companies account for a large share of the
important coal and lignite sector and represent about 33% of the workforce. The
country is the third largest European producer of gold and copper. Copper accounts for
the majority of exports, followed by lead, zinc and gold. Local and international
companies are investing to meet EU standards for sustainable development. Mining
FDI has collapsed from €302m in 2013 (22 per cent of total FDI) to €14m in 2016
(2 per cent of total FDI).
Bulgaria
2%
Rest of
COO
98%
Profile of the mining sector economy
Well governed:
• Transparency in production and revenue reporting could be improved.
• Good licensing and environmental regulation; well applied for FDI.
Competitive:
• Good adoption of new technology to manage costs and productivity.
• Mining has low cost power and average costs.
• Medium-scale copper and gold resources but some arsenic in ores.
• Low taxation and royalties (corporate income tax 10%, royalty 1.5%).
Green :
• Clean power is increasingly available for the mining sector.
Inclusive:
• Good rating for workforce gender equality in mining (21% women).
Resilient:
• High reliance on mining exports of gold and copper.
Integrated:
• Extensive railway and road system.
• Access via Danube and Black sea to international markets.
Key country mining statistics
Mining workforce 35,100 (1.2%) of total workforce Q1 2017
Mining % of GDP 3.8% (NSS Bulgaria)
Mining % of state budget Not available
Mining % of exports 14.1% (UNCTAD 2015), predominantly copper
Corruption rank 75/176 TI Corruption Index
37/219 World Bank ease of doing business index
EITI Not a member
Mines Chelopech (copper, gold), Panagurishte (copper),
Zlatograd (lead), Krumvograd (gold, silver), Khardzhali
(zinc)
Value chain Well-developed value chain for copper, zinc and lead.
German-owned copper smelter and refinery (Aurubis).
Endowment Medium, with 218 known metal deposits.
Copper, gold, silver, lead, zinc
Mine license regime Underground Resources Act 1999
Environment and Waters Protection Act 2002
Concession Act 2006
Licences are issued by the Ministry of Energy
Foreign companies Dundee Precious Metals, Euromax, Mundoro Capital,
Harmony 2012
Excludes coal,
mineral sands, phosphate,
chrome, rhenium
PUBLIC
Reform challenges
Annex G
Mining country snapshot: Georgia
18 December, 2017 33
Mining revenue as % of COO total
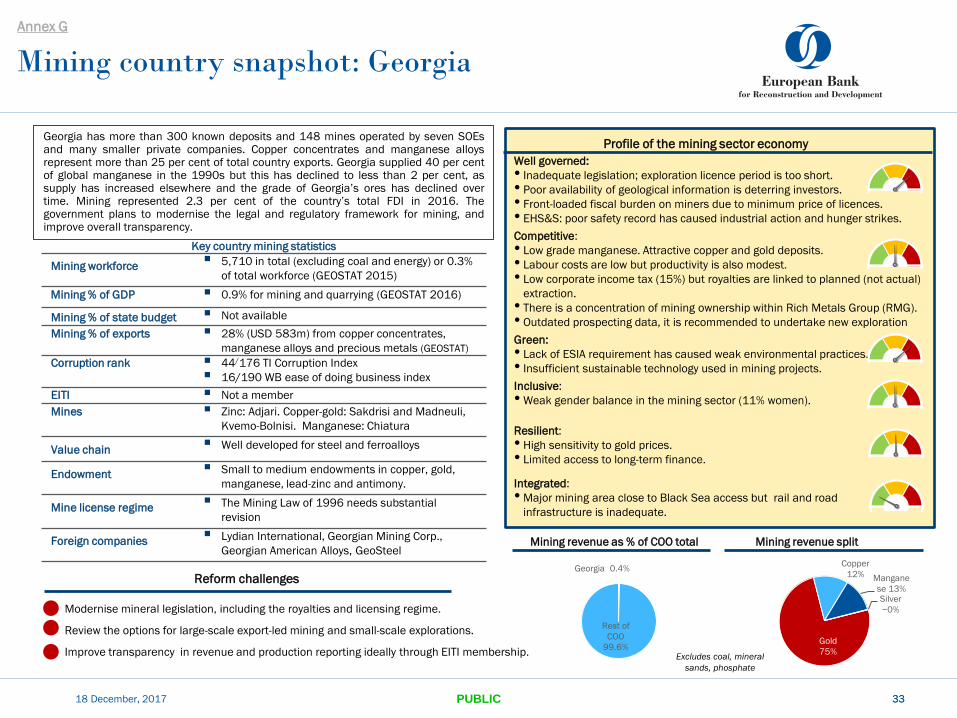
Georgia has more than 300 known deposits and 148 mines operated by seven SOEs and many smaller private companies. Copper concentrates and manganese alloys represent more than 25 per cent of total country exports. Georgia supplied 40 per cent of global manganese in the 1990s but this has declined to less than 2 per cent, as supply has increased elsewhere and the grade of Georgia’s ores has declined over time. Mining represented 2.3 per cent of the country’s total FDI in 2016. The government plans to modernise the legal and regulatory framework for mining, and improve overall transparency.
•Modernise mineral legislation, including the royalties and licensing regime.
•Review the options for large-scale export-led mining and small-scale explorations.
•Improve transparency in revenue and production reporting ideally through EITI membership.
Profile of the mining sector economy
Well governed:
• Inadequate legislation; exploration licence period is too short.
• Poor availability of geological information is deterring investors.
• Front-loaded fiscal burden on miners due to minimum price of licences.
• EHS&S: poor safety record has caused industrial action and hunger strikes.
Competitive:
• Low grade manganese. Attractive copper and gold deposits.
• Labour costs are low but productivity is also modest.
• Low corporate income tax (15%) but royalties are linked to planned (not actual)
extraction.
• There is a concentration of mining ownership within Rich Metals Group (RMG).
• Outdated prospecting data, it is recommended to undertake new exploration
Green:
• Lack of ESIA requirement has caused weak environmental practices.
• Insufficient sustainable technology used in mining projects.
Inclusive:
• Weak gender balance in the mining sector (11% women).
Resilient:
• High sensitivity to gold prices.
• Limited access to long-term finance.
Integrated:
• Major mining area close to Black Sea access but rail and road
infrastructure is inadequate.
Key country mining statistics
Mining workforce 5,710 in total (excluding coal and energy) or 0.3%
of total workforce (GEOSTAT 2015)
Mining % of GDP 0.9% for mining and quarrying (GEOSTAT 2016)
Mining % of state budget Not available
Mining % of exports 28% (USD 583m) from copper concentrates,
manganese alloys and precious metals (GEOSTAT)
Corruption rank 44/176 TI Corruption Index
16/190 WB ease of doing business index
EITI Not a member
Mines Zinc: Adjari. Copper-gold: Sakdrisi and Madneuli,
Kvemo-Bolnisi. Manganese: Chiatura
Value chain Well developed for steel and ferroalloys
Endowment Small to medium endowments in copper, gold,
manganese, lead-zinc and antimony.
Mine license regime The Mining Law of 1996 needs substantial
revision
Foreign companies Lydian International, Georgian Mining Corp.,
Georgian American Alloys, GeoSteel
33
Mining revenue split
Gold
75%
Copper
12% Mangane
se 13% Silver
~0%
Rest of
COO
99.6% Excludes coal, mineral
sands, phosphate
Georgia 0.4%
PUBLIC
Reform challenges
Annex G
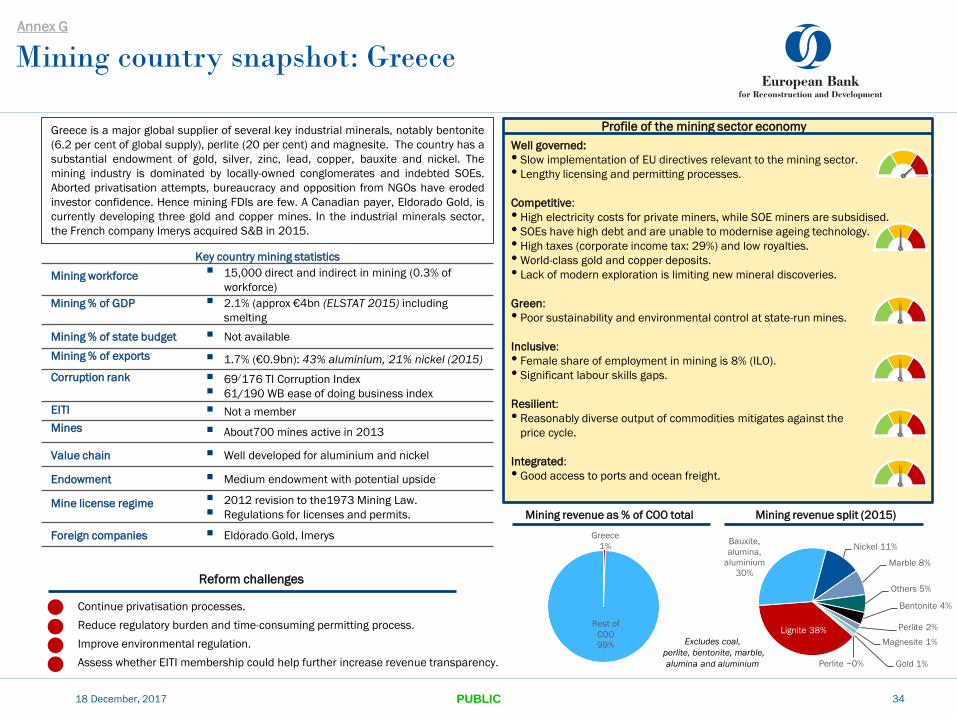
Lignite 38%
Bauxite,
alumina,
aluminium
30%
Nickel 11%
Marble 8%
Others 5%
Bentonite 4%
Perlite 2%
Magnesite 1%
Gold 1% Perlite ~0%
Mining country snapshot: Greece
18 December, 2017 34
Mining revenue split (2015) Mining revenue as % of COO total
Greece is a major global supplier of several key industrial minerals, notably bentonite
(6.2 per cent of global supply), perlite (20 per cent) and magnesite. The country has a
substantial endowment of gold, silver, zinc, lead, copper, bauxite and nickel. The
mining industry is dominated by locally-owned conglomerates and indebted SOEs.
Aborted privatisation attempts, bureaucracy and opposition from NGOs have eroded
investor confidence. Hence mining FDIs are few. A Canadian payer, Eldorado Gold, is
currently developing three gold and copper mines. In the industrial minerals sector,
the French company Imerys acquired S&B in 2015.
•Continue privatisation processes.
•Reduce regulatory burden and time-consuming permitting process.
•Improve environmental regulation.
•Assess whether EITI membership could help further increase revenue transparency.
Profile of the mining sector economy
Well governed:
• Slow implementation of EU directives relevant to the mining sector.
• Lengthy licensing and permitting processes.
Competitive:
• High electricity costs for private miners, while SOE miners are subsidised.
• SOEs have high debt and are unable to modernise ageing technology.
• High taxes (corporate income tax: 29%) and low royalties.
• World-class gold and copper deposits.
• Lack of modern exploration is limiting new mineral discoveries.
Green:
• Poor sustainability and environmental control at state-run mines.
Inclusive:
• Female share of employment in mining is 8% (ILO).
• Significant labour skills gaps.
Resilient:
• Reasonably diverse output of commodities mitigates against the
price cycle.
Integrated:
• Good access to ports and ocean freight.
Key country mining statistics
Mining workforce 15,000 direct and indirect in mining (0.3% of
workforce)
Mining % of GDP 2.1% (approx €4bn (ELSTAT 2015) including
smelting
Mining % of state budget Not available
Mining % of exports 1.7% (€0.9bn): 43% aluminium, 21% nickel (2015)
Corruption rank 69/176 TI Corruption Index
61/190 WB ease of doing business index
EITI Not a member
Mines About700 mines active in 2013
Value chain Well developed for aluminium and nickel
Endowment Medium endowment with potential upside
Mine license regime 2012 revision to the1973 Mining Law.
Regulations for licenses and permits.
Foreign companies Eldorado Gold, Imerys
Excludes coal,
perlite, bentonite, marble,
alumina and aluminium
Greece
1%
Rest of
COO
99%
PUBLIC
Reform challenges
Annex G

Kazakhstan
13%
Rest of COO
87%
Mining country snapshot: Kazakhstan
18 December, 2017 35
Mining revenue split Mining revenue as % of COO total
Kazakhstan has world-class reserves and a world-leading supply position in chromite, zinc, copper, gold, titanium sponge, rhenium and manganese. The country is also a global leader in uranium supply. A number of SOEs remain, but the government is seeking further privatisations. Corruption issues around the Eurasian Natural Resources Corporation continue to impact investor perception of the country. Adopting a new mining code (modelled on a watered-down version of Western Australia’s mining code) has been delayed until January 2018.
Profile of the mining sector economy
Well governed:
• New legislation is needed to improve access to geological data,
streamline resource evaluation and simplify licensing processes.
• EHS&S needs to improve and reduce fatalities.
• The national welfare fund Samruk-Kazyna dominates the entire
value chain for natural resources.
Competitive:
• Cheap electricity, relatively low cost of mining.
• Large natural resources but often low grade in copper.
• High tax take if Mineral Extraction Tax is included.
Green:
• Aging processing plants and smelters; legacy environmental issues.
Inclusive:
• Female share of employment in mining is 19% (ILO). Pervasive legal
and regulatory barriers to women wishing to compete for mining jobs.
• Significant labour skills gaps.
Resilient:
• Limited access to long-term finance leads to weak capitalisation
and an inability to withstand the industry’s price volatility.
Integrated:
• Geographical distances create logistics challenges.
• Poor and aging infrastructure, although rail network is reasonable.
• Landlocked, limited access to Europe.
Key country mining statistics
Mining workforce 80,000 in metals and ore.
0.9% of work force (EITI 2015)
Mining % of GDP 18% (UNCTAD)
Mining % of state budget 3% (2015 EITI)
Mining % of exports 12% (UNCTAD 2014/15)
Corruption rank 131/176 TI Corruption Index
35/190 WB ease of doing business index
EITI To be assessed against 2016 standard
Mines About 3,000 mines including coal, copper, zinc, gold,
iron ore, chrome and uranium
Value chain Well developed for copper, zinc and steel
Endowment Large resource endowment: uranium, chrome,
titanium, zinc
Mine license regime Subsurface Use Law 2010.
A new Subsoil Use Code is planned for approval by
Parliament by the end of 2017.
Competitive tender for licences.
Foreign companies Glencore, Rio Tinto, Iluka Resources, Central Asia
Metals, Areva Sa, ArcelorMittal, Russian Copper,
Polymetal and Rusal
Excludes coal, mineral
sands, phosphate, chrome
Gold
27%
Copper
25%
Uranium
22%
Iron Ore
10%
Others
17%
Implement the government’s plans to decrease SOEs’ share of mining.
Improve transparency in mining operation and ownership.
Encourage investment in modernisation of aging mining equipment.
Improve and fully implement safety standards.
Improve cumbersome approval and permission processes for mining projects.
PUBLIC
Reform challenges
Annex G
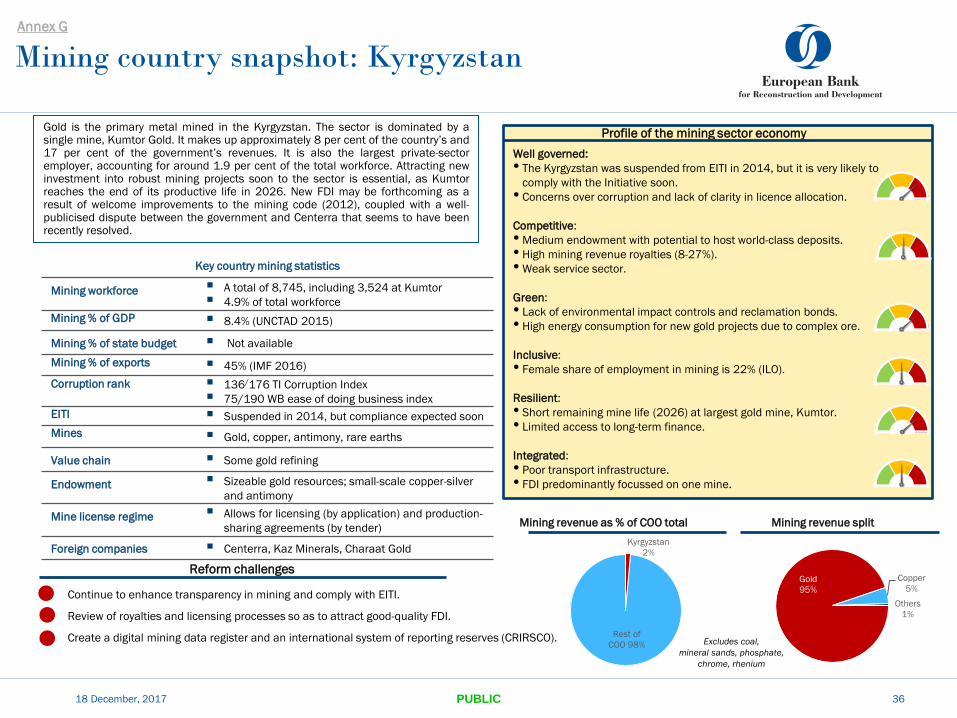
Kyrgyzstan
2%
Rest of
COO 98%
Mining country snapshot: Kyrgyzstan
18 December, 2017 36
Gold is the primary metal mined in the Kyrgyzstan. The sector is dominated by a single mine, Kumtor Gold. It makes up approximately 8 per cent of the country’s and 17 per cent of the government’s revenues. It is also the largest private-sector employer, accounting for around 1.9 per cent of the total workforce. Attracting new investment into robust mining projects soon to the sector is essential, as Kumtor reaches the end of its productive life in 2026. New FDI may be forthcoming as a result of welcome improvements to the mining code (2012), coupled with a well-publicised dispute between the government and Centerra that seems to have been recently resolved.
•Continue to enhance transparency in mining and comply with EITI.
•Review of royalties and licensing processes so as to attract good-quality FDI.
•Create a digital mining data register and an international system of reporting reserves (CRIRSCO).
Key country mining statistics
Mining workforce A total of 8,745, including 3,524 at Kumtor
4.9% of total workforce
Mining % of GDP 8.4% (UNCTAD 2015)
Mining % of state budget Not available
Mining % of exports 45% (IMF 2016)
Corruption rank 136/176 TI Corruption Index
75/190 WB ease of doing business index
EITI Suspended in 2014, but compliance expected soon
Mines Gold, copper, antimony, rare earths
Value chain Some gold refining
Endowment Sizeable gold resources; small-scale copper-silver
and antimony
Mine license regime Allows for licensing (by application) and production-
sharing agreements (by tender)
Foreign companies Centerra, Kaz Minerals, Charaat Gold
Profile of the mining sector economy
Well governed:
• The Kyrgyzstan was suspended from EITI in 2014, but it is very likely to
comply with the Initiative soon.
• Concerns over corruption and lack of clarity in licence allocation.
Competitive:
• Medium endowment with potential to host world-class deposits.
• High mining revenue royalties (8-27%).
• Weak service sector.
Green:
• Lack of environmental impact controls and reclamation bonds.
• High energy consumption for new gold projects due to complex ore.
Inclusive:
• Female share of employment in mining is 22% (ILO).
Resilient:
• Short remaining mine life (2026) at largest gold mine, Kumtor.
• Limited access to long-term finance.
Integrated:
• Poor transport infrastructure.
• FDI predominantly focussed on one mine.
Excludes coal,
mineral sands, phosphate,
chrome, rhenium
Mining revenue split Mining revenue as % of COO total
Gold
95%
Copper
5%
Others
1%
PUBLIC
Reform challenges
Annex G
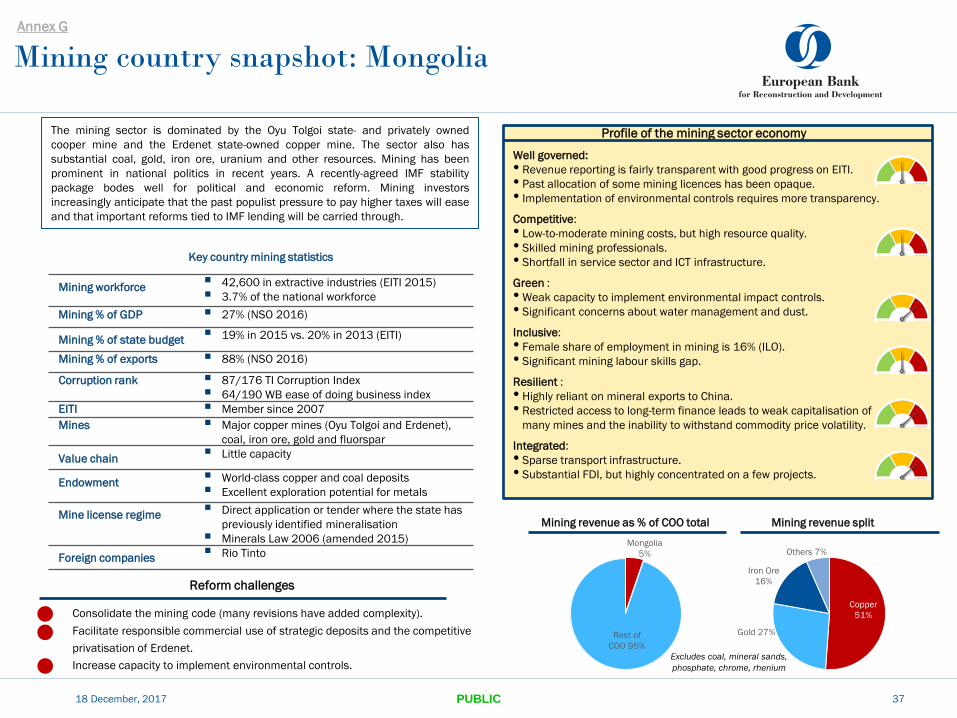
Mining country snapshot: Mongolia
18 December, 2017 37
The mining sector is dominated by the Oyu Tolgoi state- and privately owned
cooper mine and the Erdenet state-owned copper mine. The sector also has
substantial coal, gold, iron ore, uranium and other resources. Mining has been
prominent in national politics in recent years. A recently-agreed IMF stability
package bodes well for political and economic reform. Mining investors
increasingly anticipate that the past populist pressure to pay higher taxes will ease
and that important reforms tied to IMF lending will be carried through.
• Consolidate the mining code (many revisions have added complexity).
• Facilitate responsible commercial use of strategic deposits and the competitive
privatisation of Erdenet.
• Increase capacity to implement environmental controls.
Profile of the mining sector economy
Key country mining statistics
Mining workforce 42,600 in extractive industries (EITI 2015)
3.7% of the national workforce
Mining % of GDP 27% (NSO 2016)
Mining % of state budget 19% in 2015 vs. 20% in 2013 (EITI)
Mining % of exports 88% (NSO 2016)
Corruption rank 87/176 TI Corruption Index
64/190 WB ease of doing business index
EITI Member since 2007
Mines Major copper mines (Oyu Tolgoi and Erdenet),
coal, iron ore, gold and fluorspar
Value chain Little capacity
Endowment World-class copper and coal deposits
Excellent exploration potential for metals
Mine license regime Direct application or tender where the state has
previously identified mineralisation
Minerals Law 2006 (amended 2015)
Foreign companies Rio Tinto
Well governed:
• Revenue reporting is fairly transparent with good progress on EITI.
• Past allocation of some mining licences has been opaque.
• Implementation of environmental controls requires more transparency.
Competitive:
• Low-to-moderate mining costs, but high resource quality.
• Skilled mining professionals.
• Shortfall in service sector and ICT infrastructure.
Green :
• Weak capacity to implement environmental impact controls.
• Significant concerns about water management and dust.
Inclusive:
• Female share of employment in mining is 16% (ILO).
• Significant mining labour skills gap.
Resilient :
• Highly reliant on mineral exports to China.
• Restricted access to long-term finance leads to weak capitalisation of
many mines and the inability to withstand commodity price volatility.
Integrated:
• Sparse transport infrastructure.
• Substantial FDI, but highly concentrated on a few projects.
Mining revenue split Mining revenue as % of COO total
Copper
51%
Gold 27%
Iron Ore
16%
Others 7% Mongolia
5%
Rest of
COO 95%
Excludes coal, mineral sands,
phosphate, chrome, rhenium
PUBLIC
Reform challenges
Annex G
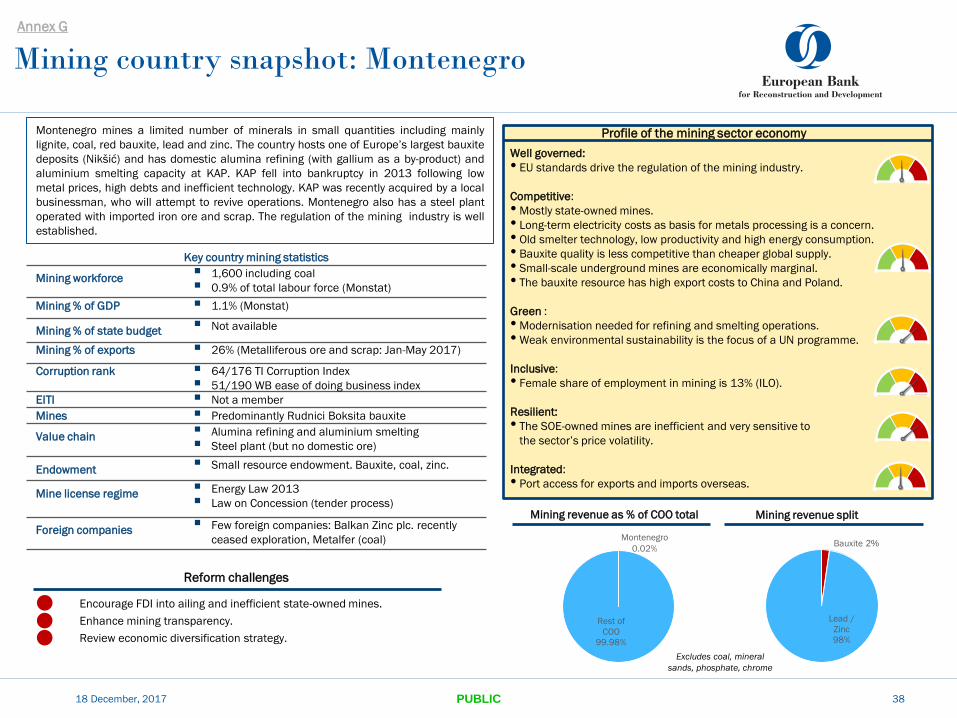
Mining country snapshot: Montenegro
18 December, 2017 38
Mining revenue split Mining revenue as % of COO total
Montenegro mines a limited number of minerals in small quantities including mainly
lignite, coal, red bauxite, lead and zinc. The country hosts one of Europe’s largest bauxite
deposits (Nikšić) and has domestic alumina refining (with gallium as a by-product) and
aluminium smelting capacity at KAP. KAP fell into bankruptcy in 2013 following low
metal prices, high debts and inefficient technology. KAP was recently acquired by a local
businessman, who will attempt to revive operations. Montenegro also has a steel plant
operated with imported iron ore and scrap. The regulation of the mining industry is well
established.
• Encourage FDI into ailing and inefficient state-owned mines.
• Enhance mining transparency.
• Review economic diversification strategy.
Profile of the mining sector economy
Well governed:
• EU standards drive the regulation of the mining industry.
Competitive:
• Mostly state-owned mines.
• Long-term electricity costs as basis for metals processing is a concern.
• Old smelter technology, low productivity and high energy consumption.
• Bauxite quality is less competitive than cheaper global supply.
• Small-scale underground mines are economically marginal.
• The bauxite resource has high export costs to China and Poland.
Green :
• Modernisation needed for refining and smelting operations.
• Weak environmental sustainability is the focus of a UN programme.
Inclusive:
• Female share of employment in mining is 13% (ILO).
Resilient:
• The SOE-owned mines are inefficient and very sensitive to
the sector’s price volatility.
Integrated:
• Port access for exports and imports overseas.
Key country mining statistics
Mining workforce 1,600 including coal
0.9% of total labour force (Monstat)
Mining % of GDP 1.1% (Monstat)
Mining % of state budget Not available
Mining % of exports 26% (Metalliferous ore and scrap: Jan-May 2017)
Corruption rank 64/176 TI Corruption Index
51/190 WB ease of doing business index
EITI Not a member
Mines Predominantly Rudnici Boksita bauxite
Value chain Alumina refining and aluminium smelting
Steel plant (but no domestic ore)
Endowment Small resource endowment. Bauxite, coal, zinc.
Mine license regime Energy Law 2013
Law on Concession (tender process)
Foreign companies Few foreign companies: Balkan Zinc plc. recently
ceased exploration, Metalfer (coal)
Lead /
Zinc
98%
Rest of
COO
99.98%
Excludes coal, mineral
sands, phosphate, chrome
Bauxite 2% Montenegro
0.02%
PUBLIC
Reform challenges
Annex G

Mining country snapshot: Morocco
18 December, 2017 39
Phosphates account for over 90 per cent of Morocco’s mining revenues. The country
hosts about 70 per cent of global phosphate reserves (USGS) and produces 12 per
cent of the global supply. The state-owned OCP has the sole right to phosphate
production. The government aims to rebalance the mining economy through tripling
non-phosphate mining revenues by 2025. Managem is the other leading local
mining company; it produces silver, copper, zinc and cobalt. There is a lack of basic
geological data for more than 60 per cent of the country, which discourages
investors into exploration.
• Expand availability and quality of basic geological data.
• Increase transparency, including through EITI membership.
• Pursue opportunities to reduce skills gaps and gender inequality.
• Increase private sector cooperation with state-owned mines.
Profile of the mining sector economy
Key country mining statistics
Mining workforce 40,000 or 0.3% of the workforce (2015, ONHYM)
Mining % of GDP 4.3% (UNCTAD)
Mining % of state budget Not available
Mining % of exports 8.3% (UNCTAD 2014/15)
Corruption rank 90/176 TI Corruption Index
68/190 WB ease of doing business index
EITI Not a member
Mines Khouribga, Gantour and Boucraâ (phosphate),
Imiter (silver), Bou Azzer (cobalt), Akka (gold)
Value chain Production of fertilizers and phosphoric acid
Endowment Medium resource endowment : potential for large
precious and base metals deposits
Mine license regime New progressive mining law adopted in 2015
Foreign companies Kasbah (tin exploration), Maya Gold and Silver
Well governed:
• Revenue reporting is not fully transparent.
• Corruption is a significant concern among investors.
• The mining licensing regime is fairly supportive of private investment.
Competitive:
• Significant resource endowment with potential for major
metal deposits; but the country has not been sufficiently explored.
• Moderate mining costs, but poor water and power access in remote areas.
• Fairly well developed mining service sector and good ICT capacity.
Green:
• Gaps in environmental controls, water and waste recycling.
• Relatively little provision for environmental control in issuing permits.
Inclusive:
• High level of workforce gender inequality.
• Significant skills gaps.
Resilient:
• Restricted access to long-term finance leads to weak capitalisation of
many mines and the inability to withstand commodity price volatility.
Integrated:
• Infrastructure gaps with need for more power, roads, railways and ports.
• Although the mining code is supportive and tax rates moderate,
FDI is limited, partly due to the industry slowdown and lack of
geological data.
Mining revenue split Mining revenue as % of COO total
Silver 4%
Lead / Zinc 3%
Cobalt 1%
Copper 1%
Phosphates 91%
Morocco
8%
Rest of
COO 92%
Excludes coal, mineral
sands, chrome
PUBLIC
Reform challenges
Annex G
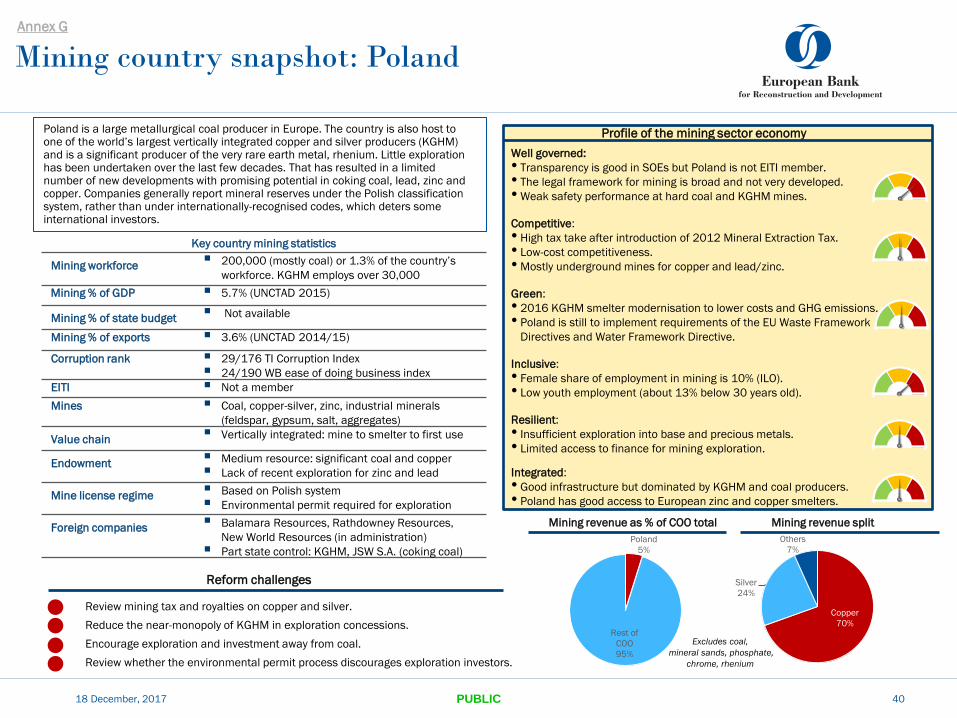
Poland
5%
Rest of
COO
95%
Mining country snapshot: Poland
18 December, 2017 40
Poland is a large metallurgical coal producer in Europe. The country is also host to one of the world’s largest vertically integrated copper and silver producers (KGHM) and is a significant producer of the very rare earth metal, rhenium. Little exploration has been undertaken over the last few decades. That has resulted in a limited number of new developments with promising potential in coking coal, lead, zinc and copper. Companies generally report mineral reserves under the Polish classification system, rather than under internationally-recognised codes, which deters some international investors.
•Review mining tax and royalties on copper and silver.
•Reduce the near-monopoly of KGHM in exploration concessions.
•Encourage exploration and investment away from coal.
•Review whether the environmental permit process discourages exploration investors.
Profile of the mining sector economy
Well governed:
• Transparency is good in SOEs but Poland is not EITI member.
• The legal framework for mining is broad and not very developed.
• Weak safety performance at hard coal and KGHM mines.
Competitive:
• High tax take after introduction of 2012 Mineral Extraction Tax.
• Low-cost competitiveness.
• Mostly underground mines for copper and lead/zinc.
Green:
• 2016 KGHM smelter modernisation to lower costs and GHG emissions.
• Poland is still to implement requirements of the EU Waste Framework
Directives and Water Framework Directive.
Inclusive:
• Female share of employment in mining is 10% (ILO).
• Low youth employment (about 13% below 30 years old).
Resilient:
• Insufficient exploration into base and precious metals.
• Limited access to finance for mining exploration.
Integrated:
• Good infrastructure but dominated by KGHM and coal producers.
• Poland has good access to European zinc and copper smelters.
Key country mining statistics
Mining workforce 200,000 (mostly coal) or 1.3% of the country’s
workforce. KGHM employs over 30,000
Mining % of GDP 5.7% (UNCTAD 2015)
Mining % of state budget Not available
Mining % of exports 3.6% (UNCTAD 2014/15)
Corruption rank 29/176 TI Corruption Index
24/190 WB ease of doing business index
EITI Not a member
Mines Coal, copper-silver, zinc, industrial minerals
(feldspar, gypsum, salt, aggregates)
Value chain Vertically integrated: mine to smelter to first use
Endowment Medium resource: significant coal and copper
Lack of recent exploration for zinc and lead
Mine license regime Based on Polish system
Environmental permit required for exploration
Foreign companies Balamara Resources, Rathdowney Resources,
New World Resources (in administration)
Part state control: KGHM, JSW S.A. (coking coal)
Excludes coal,
mineral sands, phosphate,
chrome, rhenium
Mining revenue split Mining revenue as % of COO total
Copper
70%
Silver
24%
Others
7%
PUBLIC
Reform challenges
Annex G
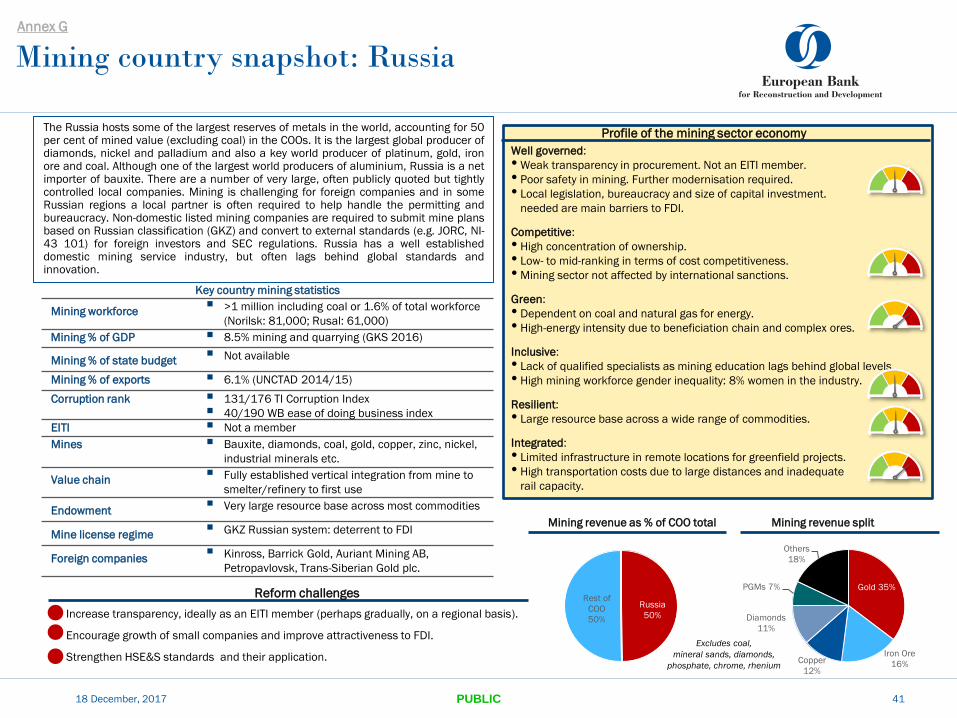
Russia
50%
Rest of
COO
50%
Mining country snapshot: Russia
18 December, 2017 41
The Russia hosts some of the largest reserves of metals in the world, accounting for 50 per cent of mined value (excluding coal) in the COOs. It is the largest global producer of diamonds, nickel and palladium and also a key world producer of platinum, gold, iron ore and coal. Although one of the largest world producers of aluminium, Russia is a net importer of bauxite. There are a number of very large, often publicly quoted but tightly controlled local companies. Mining is challenging for foreign companies and in some Russian regions a local partner is often required to help handle the permitting and bureaucracy. Non-domestic listed mining companies are required to submit mine plans based on Russian classification (GKZ) and convert to external standards (e.g. JORC, NI-43 101) for foreign investors and SEC regulations. Russia has a well established domestic mining service industry, but often lags behind global standards and innovation.
Increase transparency, ideally as an EITI member (perhaps gradually, on a regional basis).
Encourage growth of small companies and improve attractiveness to FDI.
Strengthen HSE&S standards and their application.
Profile of the mining sector economy
Well governed:
• Weak transparency in procurement. Not an EITI member.
• Poor safety in mining. Further modernisation required.
• Local legislation, bureaucracy and size of capital investment.
needed are main barriers to FDI.
Competitive:
• High concentration of ownership.
• Low- to mid-ranking in terms of cost competitiveness.
• Mining sector not affected by international sanctions.
Green:
• Dependent on coal and natural gas for energy.
• High-energy intensity due to beneficiation chain and complex ores.
Inclusive:
• Lack of qualified specialists as mining education lags behind global levels.
• High mining workforce gender inequality: 8% women in the industry.
Resilient:
• Large resource base across a wide range of commodities.
Integrated:
• Limited infrastructure in remote locations for greenfield projects.
• High transportation costs due to large distances and inadequate
rail capacity.
Key country mining statistics
Mining workforce >1 million including coal or 1.6% of total workforce
(Norilsk: 81,000; Rusal: 61,000)
Mining % of GDP 8.5% mining and quarrying (GKS 2016)
Mining % of state budget Not available
Mining % of exports 6.1% (UNCTAD 2014/15)
Corruption rank 131/176 TI Corruption Index
40/190 WB ease of doing business index
EITI Not a member
Mines Bauxite, diamonds, coal, gold, copper, zinc, nickel,
industrial minerals etc.
Value chain Fully established vertical integration from mine to
smelter/refinery to first use
Endowment Very large resource base across most commodities
Mine license regime GKZ Russian system: deterrent to FDI
Foreign companies Kinross, Barrick Gold, Auriant Mining AB,
Petropavlovsk, Trans-Siberian Gold plc.
Excludes coal,
mineral sands, diamonds,
phosphate, chrome, rhenium
Mining revenue split Mining revenue as % of COO total
Gold 35%
Iron Ore
16% Copper
12%
Diamonds
11%
PGMs 7%
Others
18%
PUBLIC
Reform challenges
Annex G
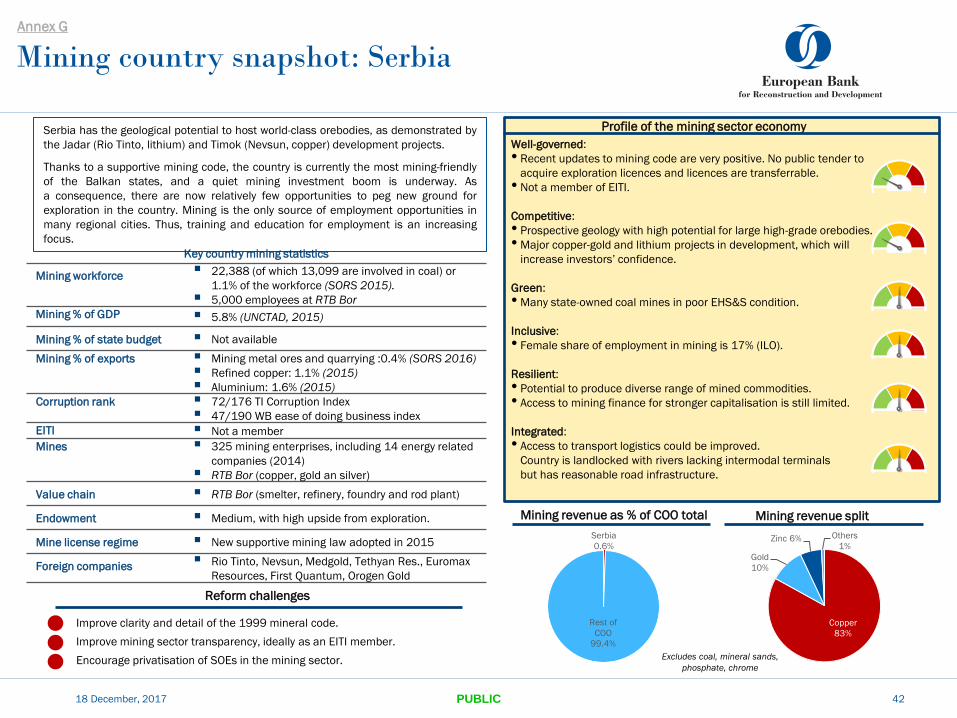
Mining country snapshot: Serbia
18 December, 2017 42
Mining revenue split Mining revenue as % of COO total
Serbia has the geological potential to host world-class orebodies, as demonstrated by
the Jadar (Rio Tinto, lithium) and Timok (Nevsun, copper) development projects.
Thanks to a supportive mining code, the country is currently the most mining-friendly
of the Balkan states, and a quiet mining investment boom is underway. As
a consequence, there are now relatively few opportunities to peg new ground for
exploration in the country. Mining is the only source of employment opportunities in
many regional cities. Thus, training and education for employment is an increasing
focus.
•Improve clarity and detail of the 1999 mineral code.
•Improve mining sector transparency, ideally as an EITI member.
•Encourage privatisation of SOEs in the mining sector.
Profile of the mining sector economy
Well-governed:
• Recent updates to mining code are very positive. No public tender to
acquire exploration licences and licences are transferrable.
• Not a member of EITI.
Competitive:
• Prospective geology with high potential for large high-grade orebodies.
• Major copper-gold and lithium projects in development, which will
increase investors’ confidence.
Green:
• Many state-owned coal mines in poor EHS&S condition.
Inclusive:
• Female share of employment in mining is 17% (ILO).
Resilient:
• Potential to produce diverse range of mined commodities.
• Access to mining finance for stronger capitalisation is still limited.
Integrated:
• Access to transport logistics could be improved.
Country is landlocked with rivers lacking intermodal terminals
but has reasonable road infrastructure.
Key country mining statistics
Mining workforce 22,388 (of which 13,099 are involved in coal) or
1.1% of the workforce (SORS 2015).
5,000 employees at RTB Bor
Mining % of GDP 5.8% (UNCTAD, 2015)
Mining % of state budget Not available
Mining % of exports Mining metal ores and quarrying :0.4% (SORS 2016)
Refined copper: 1.1% (2015)
Aluminium: 1.6% (2015)
Corruption rank 72/176 TI Corruption Index
47/190 WB ease of doing business index
EITI Not a member
Mines 325 mining enterprises, including 14 energy related
companies (2014)
RTB Bor (copper, gold an silver)
Value chain RTB Bor (smelter, refinery, foundry and rod plant)
Endowment Medium, with high upside from exploration.
Mine license regime New supportive mining law adopted in 2015
Foreign companies Rio Tinto, Nevsun, Medgold, Tethyan Res., Euromax
Resources, First Quantum, Orogen Gold
Copper
83%
Gold
10%
Zinc 6% Others
1%
Serbia
0.6%
Rest of
COO
99.4%
Excludes coal, mineral sands,
phosphate, chrome
PUBLIC
Reform challenges
Annex G
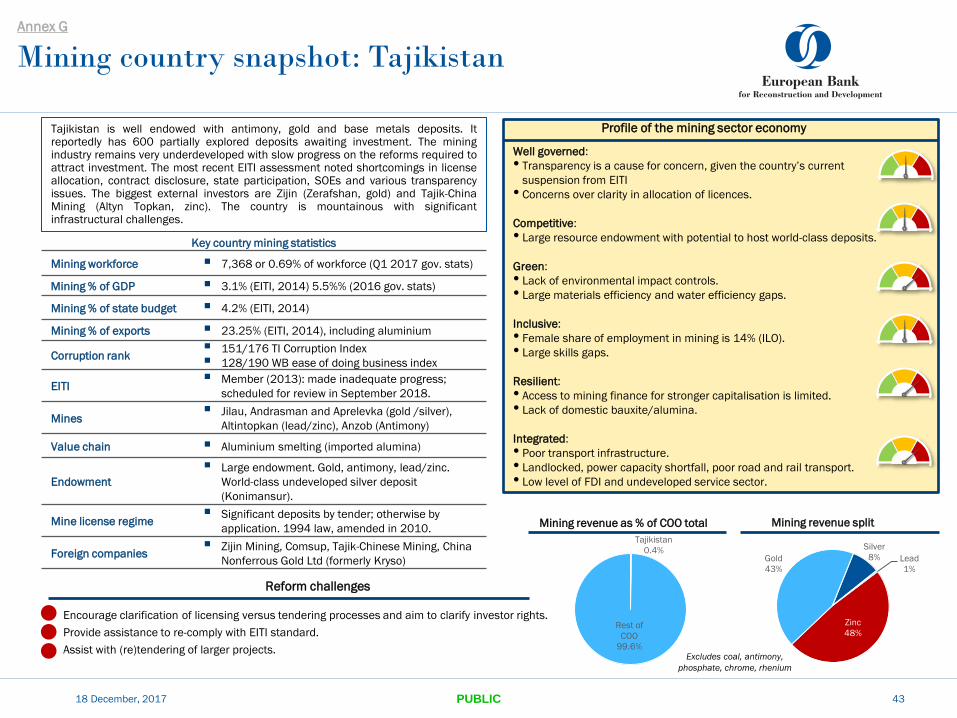
Tajikistan
0.4%
Rest of
COO
99.6%
Mining country snapshot: Tajikistan
18 December, 2017 43
Tajikistan is well endowed with antimony, gold and base metals deposits. It reportedly has 600 partially explored deposits awaiting investment. The mining industry remains very underdeveloped with slow progress on the reforms required to attract investment. The most recent EITI assessment noted shortcomings in license allocation, contract disclosure, state participation, SOEs and various transparency issues. The biggest external investors are Zijin (Zerafshan, gold) and Tajik-China Mining (Altyn Topkan, zinc). The country is mountainous with significant infrastructural challenges.
Encourage clarification of licensing versus tendering processes and aim to clarify investor rights.
Provide assistance to re-comply with EITI standard.
Assist with (re)tendering of larger projects.
Key country mining statistics
Mining workforce 7,368 or 0.69% of workforce (Q1 2017 gov. stats)
Mining % of GDP 3.1% (EITI, 2014) 5.5%% (2016 gov. stats)
Mining % of state budget 4.2% (EITI, 2014)
Mining % of exports 23.25% (EITI, 2014), including aluminium
Corruption rank 151/176 TI Corruption Index
128/190 WB ease of doing business index
EITI Member (2013): made inadequate progress;
scheduled for review in September 2018.
Mines Jilau, Andrasman and Aprelevka (gold /silver),
Altintopkan (lead/zinc), Anzob (Antimony)
Value chain Aluminium smelting (imported alumina)
Endowment
Large endowment. Gold, antimony, lead/zinc.
World-class undeveloped silver deposit
(Konimansur).
Mine license regime Significant deposits by tender; otherwise by
application. 1994 law, amended in 2010.
Foreign companies Zijin Mining, Comsup, Tajik-Chinese Mining, China
Nonferrous Gold Ltd (formerly Kryso)
Profile of the mining sector economy
Well governed:
• Transparency is a cause for concern, given the country’s current
suspension from EITI
• Concerns over clarity in allocation of licences.
Competitive:
• Large resource endowment with potential to host world-class deposits.
Green:
• Lack of environmental impact controls.
• Large materials efficiency and water efficiency gaps.
Inclusive:
• Female share of employment in mining is 14% (ILO).
• Large skills gaps.
Resilient:
• Access to mining finance for stronger capitalisation is limited.
• Lack of domestic bauxite/alumina.
Integrated:
• Poor transport infrastructure.
• Landlocked, power capacity shortfall, poor road and rail transport.
• Low level of FDI and undeveloped service sector.
Excludes coal, antimony,
phosphate, chrome, rhenium
Zinc
48%
Gold
43%
Silver
8% Lead
1%
Mining revenue split Mining revenue as % of COO total
PUBLIC
Reform challenges
Annex G
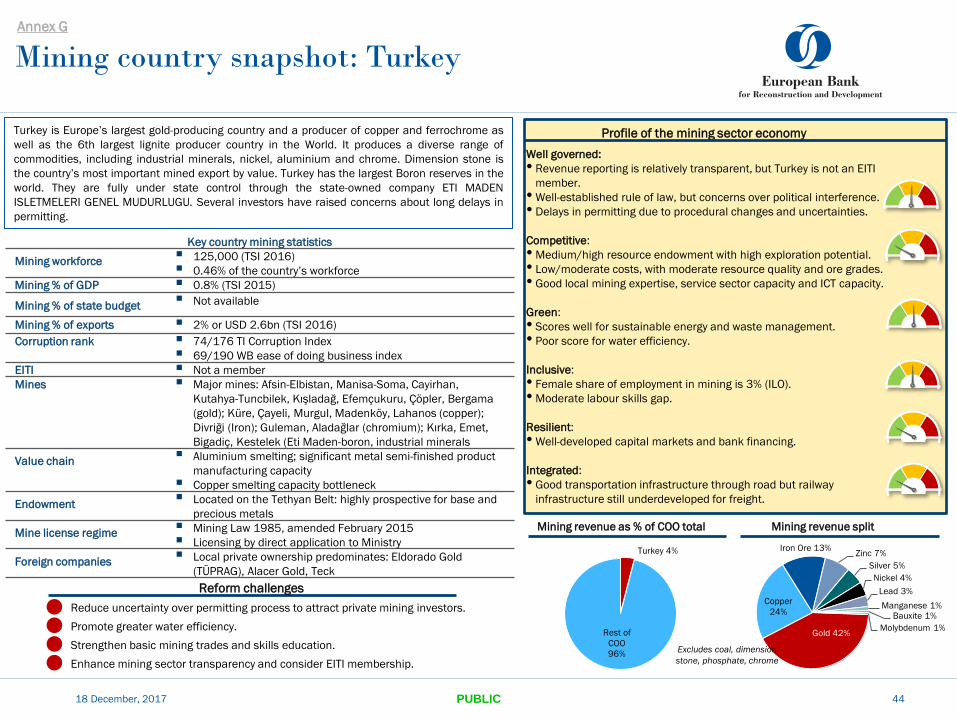
Gold 42%
Copper
24%
Iron Ore 13% Zinc 7%
Silver 5%
Nickel 4%
Lead 3%
Manganese 1% Bauxite 1%
Molybdenum 1% Rest of
COO
96%
Turkey 4%
Mining country snapshot: Turkey
18 December, 2017 44
Turkey is Europe’s largest gold-producing country and a producer of copper and ferrochrome as
well as the 6th largest lignite producer country in the World. It produces a diverse range of
commodities, including industrial minerals, nickel, aluminium and chrome. Dimension stone is
the country’s most important mined export by value. Turkey has the largest Boron reserves in the
world. They are fully under state control through the state-owned company ETI MADEN
ISLETMELERI GENEL MUDURLUGU. Several investors have raised concerns about long delays in
permitting.
• Reduce uncertainty over permitting process to attract private mining investors.
• Promote greater water efficiency.
• Strengthen basic mining trades and skills education.
• Enhance mining sector transparency and consider EITI membership.
Profile of the mining sector economy
Key country mining statistics
Mining workforce 125,000 (TSI 2016)
0.46% of the country’s workforce
Mining % of GDP 0.8% (TSI 2015)
Mining % of state budget Not available
Mining % of exports 2% or USD 2.6bn (TSI 2016)
Corruption rank 74/176 TI Corruption Index
69/190 WB ease of doing business index
EITI Not a member
Mines Major mines: Afsin-Elbistan, Manisa-Soma, Cayirhan,
Kutahya-Tuncbilek, Kışladağ, Efemçukuru, Çöpler, Bergama
(gold); Küre, Çayeli, Murgul, Madenköy, Lahanos (copper);
Divriği (Iron); Guleman, Aladağlar (chromium); Kırka, Emet,
Bigadiç, Kestelek (Eti Maden-boron, industrial minerals
Value chain Aluminium smelting; significant metal semi-finished product
manufacturing capacity
Copper smelting capacity bottleneck
Endowment Located on the Tethyan Belt: highly prospective for base and
precious metals
Mine license regime Mining Law 1985, amended February 2015
Licensing by direct application to Ministry
Foreign companies Local private ownership predominates: Eldorado Gold
(TÜPRAG), Alacer Gold, Teck
Well governed:
• Revenue reporting is relatively transparent, but Turkey is not an EITI
member.
• Well-established rule of law, but concerns over political interference.
• Delays in permitting due to procedural changes and uncertainties.
Competitive:
• Medium/high resource endowment with high exploration potential.
• Low/moderate costs, with moderate resource quality and ore grades.
• Good local mining expertise, service sector capacity and ICT capacity.
Green:
• Scores well for sustainable energy and waste management.
• Poor score for water efficiency.
Inclusive:
• Female share of employment in mining is 3% (ILO).
• Moderate labour skills gap.
Resilient:
• Well-developed capital markets and bank financing.
Integrated:
• Good transportation infrastructure through road but railway
infrastructure still underdeveloped for freight.
Excludes coal, dimension
stone, phosphate, chrome
Mining revenue split Mining revenue as % of COO total
PUBLIC
Reform challenges
Annex G
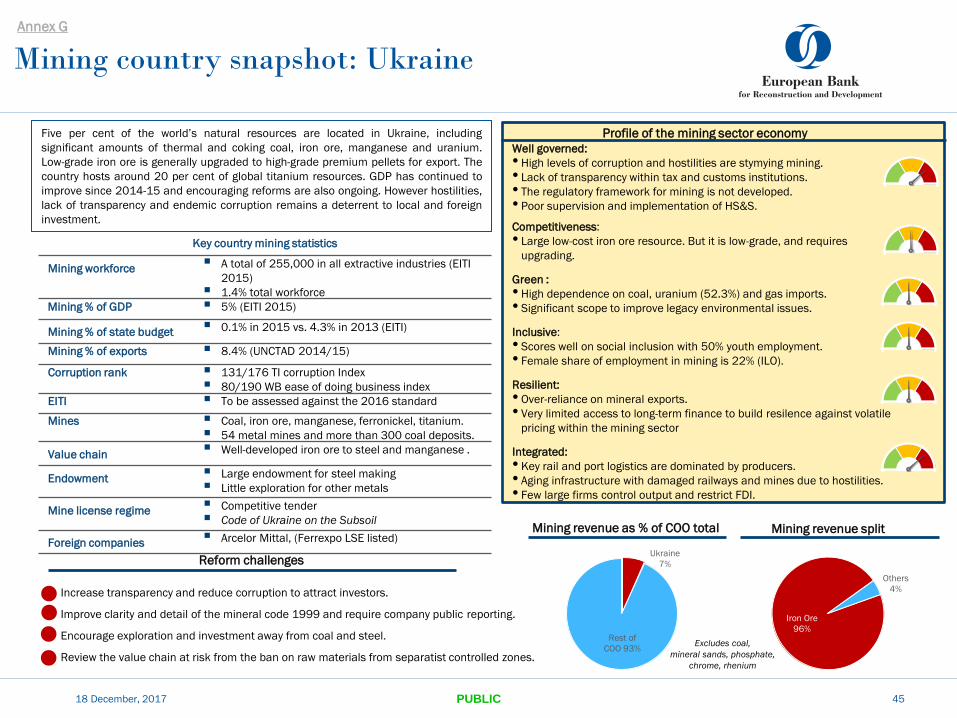
Ukraine
7%
Rest of
COO 93%
Mining country snapshot: Ukraine
18 December, 2017 45
Five per cent of the world’s natural resources are located in Ukraine, including
significant amounts of thermal and coking coal, iron ore, manganese and uranium.
Low-grade iron ore is generally upgraded to high-grade premium pellets for export. The
country hosts around 20 per cent of global titanium resources. GDP has continued to
improve since 2014-15 and encouraging reforms are also ongoing. However hostilities,
lack of transparency and endemic corruption remains a deterrent to local and foreign
investment.
Increase transparency and reduce corruption to attract investors.
Improve clarity and detail of the mineral code 1999 and require company public reporting.
Encourage exploration and investment away from coal and steel.
Review the value chain at risk from the ban on raw materials from separatist controlled zones.
Key country mining statistics
Mining workforce A total of 255,000 in all extractive industries (EITI
2015)
1.4% total workforce
Mining % of GDP 5% (EITI 2015)
Mining % of state budget 0.1% in 2015 vs. 4.3% in 2013 (EITI)
Mining % of exports 8.4% (UNCTAD 2014/15)
Corruption rank 131/176 TI corruption Index
80/190 WB ease of doing business index
EITI To be assessed against the 2016 standard
Mines Coal, iron ore, manganese, ferronickel, titanium.
54 metal mines and more than 300 coal deposits.
Value chain Well-developed iron ore to steel and manganese .
Endowment Large endowment for steel making
Little exploration for other metals
Mine license regime Competitive tender
Code of Ukraine on the Subsoil
Foreign companies Arcelor Mittal, (Ferrexpo LSE listed)
Excludes coal,
mineral sands, phosphate,
chrome, rhenium
Mining revenue split Mining revenue as % of COO total
Iron Ore
96%
Others
4%
Profile of the mining sector economy
Well governed:
• High levels of corruption and hostilities are stymying mining.
• Lack of transparency within tax and customs institutions.
• The regulatory framework for mining is not developed.
• Poor supervision and implementation of HS&S.
Competitiveness:
• Large low-cost iron ore resource. But it is low-grade, and requires
upgrading.
Green :
• High dependence on coal, uranium (52.3%) and gas imports.
• Significant scope to improve legacy environmental issues.
Inclusive:
• Scores well on social inclusion with 50% youth employment.
• Female share of employment in mining is 22% (ILO).
Resilient:
• Over-reliance on mineral exports.
• Very limited access to long-term finance to build resilence against volatile
pricing within the mining sector
Integrated:
• Key rail and port logistics are dominated by producers.
• Aging infrastructure with damaged railways and mines due to hostilities.
• Few large firms control output and restrict FDI.
PUBLIC
Reform challenges
Annex G
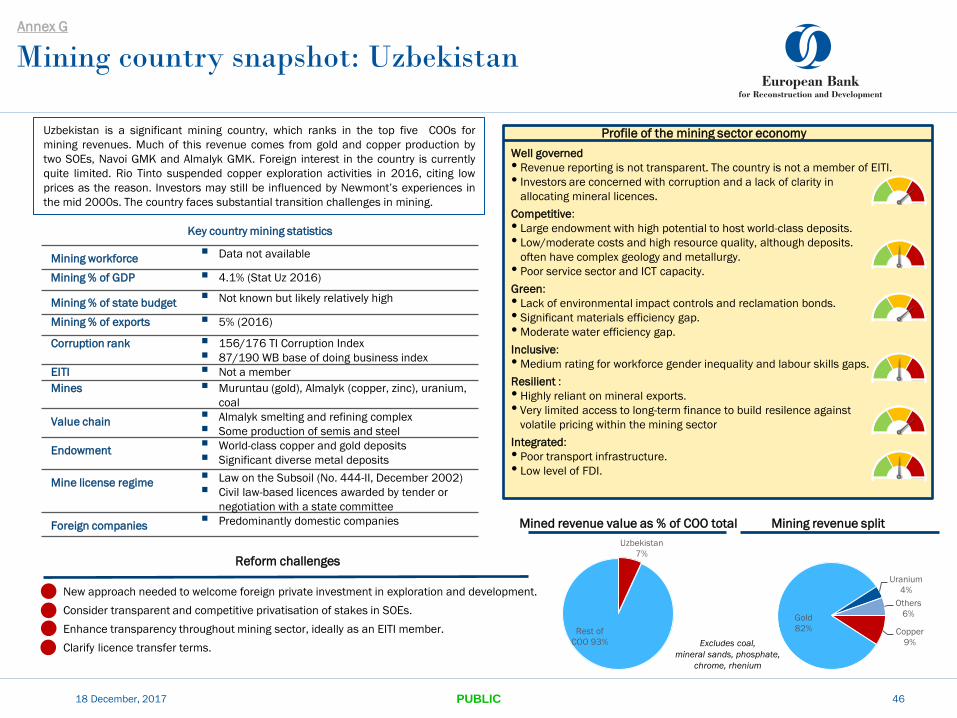
Uzbekistan
7%
Rest of
COO 93%
Mining country snapshot: Uzbekistan
18 December, 2017 46
Uzbekistan is a significant mining country, which ranks in the top five COOs for
mining revenues. Much of this revenue comes from gold and copper production by
two SOEs, Navoi GMK and Almalyk GMK. Foreign interest in the country is currently
quite limited. Rio Tinto suspended copper exploration activities in 2016, citing low
prices as the reason. Investors may still be influenced by Newmont’s experiences in
the mid 2000s. The country faces substantial transition challenges in mining.
New approach needed to welcome foreign private investment in exploration and development.
Consider transparent and competitive privatisation of stakes in SOEs.
Enhance transparency throughout mining sector, ideally as an EITI member.
Clarify licence transfer terms.
Profile of the mining sector economy
Key country mining statistics
Mining workforce Data not available
Mining % of GDP 4.1% (Stat Uz 2016)
Mining % of state budget Not known but likely relatively high
Mining % of exports 5% (2016)
Corruption rank 156/176 TI Corruption Index
87/190 WB base of doing business index
EITI Not a member
Mines Muruntau (gold), Almalyk (copper, zinc), uranium,
coal
Value chain Almalyk smelting and refining complex
Some production of semis and steel
Endowment World-class copper and gold deposits
Significant diverse metal deposits
Mine license regime Law on the Subsoil (No. 444-II, December 2002)
Civil law-based licences awarded by tender or
negotiation with a state committee
Foreign companies Predominantly domestic companies
Well governed
• Revenue reporting is not transparent. The country is not a member of EITI.
• Investors are concerned with corruption and a lack of clarity in
allocating mineral licences.
Competitive:
• Large endowment with high potential to host world-class deposits.
• Low/moderate costs and high resource quality, although deposits.
often have complex geology and metallurgy.
• Poor service sector and ICT capacity.
Green:
• Lack of environmental impact controls and reclamation bonds.
• Significant materials efficiency gap.
• Moderate water efficiency gap.
Inclusive:
• Medium rating for workforce gender inequality and labour skills gaps.
Resilient :
• Highly reliant on mineral exports.
• Very limited access to long-term finance to build resilence against
volatile pricing within the mining sector
Integrated:
• Poor transport infrastructure.
• Low level of FDI.
Mining revenue split Mined revenue value as % of COO total
Excludes coal,
mineral sands, phosphate,
chrome, rhenium
Copper
9%
Gold
82%
Uranium
4%
Others
6%
PUBLIC
Reform challenges
Annex G


![A Survey on Consensus Mechanisms and Mining Strategy ... · arXiv:1805.02707v4 [cs.CR] 19 Feb 2019 1 A Survey on Consensus Mechanisms and Mining Strategy Management in Blockchain](https://img.pdfslide.net/doc/110x75/5ec653f132b52a2d1c7c3614/a-survey-on-consensus-mechanisms-and-mining-strategy-arxiv180502707v4-cscr.jpg)