Embed Size (px)
Citation preview

A research report from the EBRI Education and Research Fund © 2018 Employee Benefit Research Institute
September 2010 • No. 346 November 29, 2018 • No. 466
EBRI would like to thank our Financial Wellbeing Research Center Partners for their support on this
survey: Financial Finesse, HealthEquity, International Foundation of Employee Benefit Plans, J.P.
Morgan, Mercer, MetLife, Principal, Prudential, T. Rowe Price, and Voya Financial.
EBRI’s 2018 Employer Financial Wellbeing Survey
By Lori Lucas, CFA, Employee Benefit Research Institute
A T A G L A N C E
Employers have offered wellness programs for decades in order to promote healthier habits among workers. Their foray
into financial wellness is newer. The Bureau of Consumer Financial Protection (BCFP) began exploring financial
wellbeing as a goal of financial education in 2014 with a report documenting nearly 60 hours of open-ended interviews
by its research team with adult consumers and financial practitioners. Their research suggested that financial wellbeing
can be defined as a state of being wherein one:
Has control over day-to-day, month-to-month finances;
Has the capacity to absorb a financial shock;
Is on track to meet financial goals; and
Has the financial freedom to make the choices that allows one to enjoy life.
In its report, the BCFP concluded, “We need to develop innovative programs and interventions and specifically test
them (and our implementation strategies) in terms of their efficacy — their efficacy in supporting the development of
the key factors we have identified that may lead to and underlie financial well-being, and their efficacy in improving
financial well-being itself.”
The Employee Benefit Research Institute (EBRI) began its exploration of employers’ interest in offering financial
wellness initiatives in the spring of 2018. It began with a series of focus groups that asked:
How are employers defining financial wellbeing for their workers?
What are employers doing and not doing in this area?
Why is addressing financial wellbeing on employers’ agendas?
How are employers defining “success” in this area?
While there was little consensus around the definition of financial wellness, many employers in the focus groups agreed
in general with the BCFP’s definition: Financial wellbeing is a state of being wherein a person can fully meet current and
ongoing financial obligations, can feel secure in their financial future, and is able to make choices that allow them to
enjoy life.
Specifically, employers identified with the notion that it is important for employees to balance current and future
financial needs and that future financial security should not come at the expense of financial stability today. For
example, employers wanted to know that, when they were automatically enrolling workers into a 401(k) plan, these
workers could afford to save for retirement and were not putting themselves into a financially fragile position by doing
so.

ebri.org Issue Brief • November 29, 2018 • No. 466 2
About EBRI’s Financial Wellbeing Employer Survey
Information for this report was collected from a 15-minute online survey with 250 full-time benefits
decision makers conducted in July 2018. All respondents worked at companies with at least 500
employees that were at least interested in offering financial wellness programs. A total of 25 percent
of respondents dropped out of the survey as a result of their company’s lack of interest in offering
financial wellness programs.
Respondents were required to have at least moderate influence on their company’s employee benefits
program and financial wellness offerings. Additionally, they were required to hold an executive, officer,
or manager position in human resources, compensation, or finance.
Note that percentages in the tables and charts may not total to 100 due to rounding and/or missing
categories.
Figure 1Demographics of Responding Firms
1
Total Number of U.S. Employees (n=250)
500 to 749 employees 17%
750 to 999 employees 14
1,000 to 2,499 employees 27
2,500 to 4,999 employees 15
5,000 to 9,999 employees 12
10,000 to 24,999 employees 4
25,000 or more employees 12
Industry (n=250)
Health care and social assistance 15%
Manufacturing 13
Educational services 11
Finance and insurance 10
Government: state, local or federal 12
Net: all other 39
The focus groups also revealed that financial wellness programs were about more than just increasing workers’
productivity. While some employers were concerned about absenteeism due to financial stress, for example, many were
also generally interested in promoting workplace satisfaction.
The clear message from these focus groups was that, while financial wellbeing was of great interest to employers, the
programs were typically in their initial stages. Many had engaged only in pilot financial wellness programs for select
groups of their worker population. Oft-times, these programs involved one-on-one counseling and were difficult to scale
for broader rollout. In terms of measuring the success of these initiatives, the most common measure was utilization
(e.g., were all available slots in a workshop taken) or defined contribution (DC) plan benchmarks (participation rates,
average balances increase, and investment mix). Success was also measured by surveys that evaluated the program
itself — content, understandability to the participants, and engagement of the presentation/material — not whether the
individual made a change in their behavior.
EBRI’s 2018 Financial Wellbeing Employer Survey built on these results with online interviews of 250 larger employers.
As with the focus groups, these were employers with an expressed interest in financial wellness initiatives for
employees. Those with no interest were screened out of the sample. While employers with as few as 500 workers were
included in the sample, the vast majority (79 percent) had 1,000 or more employees in their workforce. A wide range of
industries is represented in the survey, with the heaviest concentrations in health care and social assistance (15
percent), manufacturing (13 percent), educational services (11 percent), finance and insurance (10 percent), and
government (12 percent) (Figure 1).

ebri.org Issue Brief • November 29, 2018 • No. 466 3
The findings paint an interesting picture of employers who — like those in the focus groups — define both financial
wellbeing and the programs that could facilitate wellbeing quite broadly. They face many challenges in implementing
these programs, grapple with how to measure the success of the programs, and ultimately grapple with how to make a
successful business case for broader implementation of these initiatives.
Specifically, the survey found that:
The largest firms are most likely to offer financial wellness programs: Of companies that were at
least interested in providing employees with financial wellness initiatives, 54 percent were offering them to
their employees at the time, 12 percent were actively implementing, and 34 percent were interested in
financial wellness initiatives. Three-quarters of firms with 10,000 or more employees offered financial wellness
initiatives at the time, compared with 49 percent of smaller firms. Those with the highest level of concern
about employees’ financial wellbeing were also most likely to offer a program (73 percent).
Financial wellness initiatives tend to be in their infancy: 38 percent of firms considered their initiatives
to be in the pilot phase. Another 34 percent described their efforts as periodic campaigns or ad hoc programs.
There are mixed approaches and costs associated with the initiatives: There is little consensus on the
approach to financial wellness initiatives. A mix of methods was the most common provider of initiatives. Firms
were most likely to be paying for these programs themselves, but costs per employee varied significantly.
Firms offer a mixture of financial wellness offerings: On average, firms offered 4.7 financial wellbeing
or debt assistance benefits to their employees. The most common initiatives were employee discount
programs, tuition reimbursement, and financial planning education.
Delivery of offerings is often high-touch: When it comes to delivering these benefits, in-person group
sessions, email communications, and in-person individual sessions were the most common methods. In-person
individual sessions were the most likely method for both personalized financial counseling and credit and debt
counseling programs, while in-person group sessions were utilized most often for financial education and
incentivization programs.
Human resources professionals are the main motivators: Human resources professionals are the main
motivators for these programs. Thirty-nine percent of firms relied on communications from HR to encourage
their employees to use the financial wellness initiatives. Additionally, 4 in 5 said that HR will be the champions
for implementing financial wellness initiatives.
Employers face a number of challenges in offering financial wellness initiatives: Cost to employer
(50 percent), interest among employees (46 percent), and value proposition to employees (40 percent) ranked
as the top three considerations that employers stated they use to determine whether to offer financial wellness
benefits to their employees.
Success measures range widely: Measures used to evaluate the success of financial wellness initiatives
range from specific (improved employee retention) to quite broad (improved overall worker satisfaction).
However, with few using metrics or assessments, it may be difficult for employers to accurately evaluate their
initiatives.
ebri.org Issue Brief • November 29, 2018 • No. 466 4
Lori Lucas, CFA, is the president and CEO of the Employee Benefit Research Institute (EBRI). This Issue Brief was
written with assistance from the Institute’s research and editorial staffs. Any views expressed in this report are
those of the authors and should not be ascribed to the officers, trustees, or other sponsors of EBRI, Employee
Benefit Research Institute-Education and Research Fund (EBRI-ERF), or their staffs. Neither EBRI nor EBRI-ERF
lobbies or takes positions on specific policy proposals. EBRI invites comment on this research.
Suggested Citation: Lori Lucas. “EBRI’s 2018 Employer Financial Wellbeing Survey.” EBRI Issue Brief, no. 466
(Employee Benefit Research Institute, November 29, 2018).
Copyright Information: This report is copyrighted by the Employee Benefit Research Institute (EBRI). It may be
used without permission but citation of the source is required.
Report Availability: This report is available on the internet at www.ebri.org
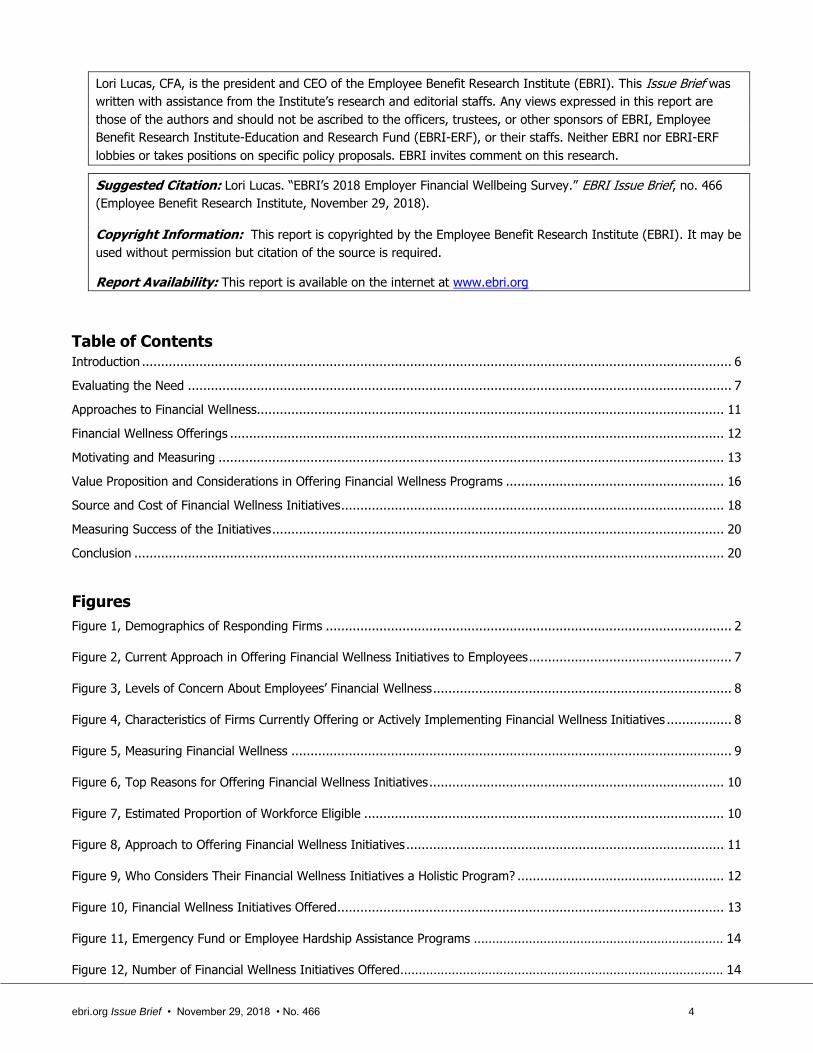
Table of Contents Introduction .......................................................................................................................................................... 6
Evaluating the Need .............................................................................................................................................. 7
Approaches to Financial Wellness.......................................................................................................................... 11
Financial Wellness Offerings ................................................................................................................................. 12
Motivating and Measuring .................................................................................................................................... 13
Value Proposition and Considerations in Offering Financial Wellness Programs ......................................................... 16
Source and Cost of Financial Wellness Initiatives .................................................................................................... 18
Measuring Success of the Initiatives ...................................................................................................................... 20
Conclusion .......................................................................................................................................................... 20
Figures
Figure 1, Demographics of Responding Firms .......................................................................................................... 2
Figure 2, Current Approach in Offering Financial Wellness Initiatives to Employees ..................................................... 7
Figure 3, Levels of Concern About Employees’ Financial Wellness .............................................................................. 8
Figure 4, Characteristics of Firms Currently Offering or Actively Implementing Financial Wellness Initiatives ................. 8
Figure 5, Measuring Financial Wellness ................................................................................................................... 9
Figure 6, Top Reasons for Offering Financial Wellness Initiatives ............................................................................. 10
Figure 7, Estimated Proportion of Workforce Eligible .............................................................................................. 10
Figure 8, Approach to Offering Financial Wellness Initiatives ................................................................................... 11
Figure 9, Who Considers Their Financial Wellness Initiatives a Holistic Program? ...................................................... 12
Figure 10, Financial Wellness Initiatives Offered ..................................................................................................... 13
Figure 11, Emergency Fund or Employee Hardship Assistance Programs .................................................................... 14
Figure 12, Number of Financial Wellness Initiatives Offered........................................................................................ 14

ebri.org Issue Brief • November 29, 2018 • No. 466 5
Figure 13, How Financial Wellness Programs Are Delivered ..................................................................................... 15
Figure 14, Encouraging Employees to Use Financial Wellness Initiatives................................................................... 15
Figure 15, Internal Champion for Financial Wellness Initiatives ............................................................................... 16
Figure 16, Top Considerations Used to Determine Whether to Offer ........................................................................ 17
Figure 17, Value Proposition and Challenges .......................................................................................................... 17
Figure 18, Challenges in Offering Financial Wellness Benefits .................................................................................. 18
Figure 19, Source of the Financial Wellness Initiative ............................................................................................. 19
Figure 20, Who Pays or Might Pay for the Initiatives .............................................................................................. 19
Figure 21, Cost of Financial Wellness Initiatives ..................................................................................................... 20
Figure 22, Top Factors in Measuring Financial Wellness Initiatives .............................................................................. 21
Figure 23, Measuring Success of Financial Wellness Initiatives, by Industry ................................................................ 22

ebri.org Issue Brief • November 29, 2018 • No. 466 6
Definition of Financial Wellness Initiatives by the Bureau of Consumer Financial Protection:
Financial wellness initiatives were defined in the survey as including student debt reduction programs,
help with managing credit card loans, budgeting tools, and financial counseling to help employees
better manage their money.
EBRI’s 2018 Employer Financial Wellbeing Survey
By Lori Lucas, CFA, Employee Benefit Research Institute
Introduction
Employers have offered wellness programs intended to promote healthy habits among workers for decades. In a 1993
report prepared by the Office of Disease Prevention and Health Promotion, McGinnis, former Deputy Assistant Secretary
of Health, documented the experience of 61 employers, large and small, public and private, that were providing
worksite health promotion programs aimed at improving the health and wellbeing of their employees and reducing
health care, workers’ compensation, and disability costs.1 The report concluded: “Worksite health promotion has taken
on increasing importance as a contributor to improved health for many Americans. . .With the expanded activity comes
an interest and obligation to assess the results of such programs to ensure that we have a clearer notion of what works
best in various settings.”
Employers’ foray into financial wellness is more recent. The Bureau of Consumer Financial Protection (BCFP) began
exploring financial wellbeing as a goal of financial education in 2014 with a report documenting nearly 60 hours of
open-ended interviews by its research team with adult consumers and financial practitioners. Their research suggested
that financial wellbeing can be defined as a state of being wherein you:
Have control over day-to-day, month-to-month finances;
Have the capacity to absorb a financial shock;
Are on track to meet your financial goals; and
Have the financial freedom to make the choices that allow you to enjoy life.
In its report, the BCFP concluded, “We need to develop innovative programs and interventions and specifically test
them (and our implementation strategies) in terms of their efficacy — their efficacy in supporting the development of
the key factors we have identified that may lead to and underlie financial well-being, and their efficacy in improving
financial well-being itself.”
The goal of EBRI’s Financial Wellbeing Employer Survey is to determine what the key factors are that employers seek to
address with their financial wellbeing programs and how the efficacy of these programs is being measured. To do so,
EBRI developed an online survey that was administered to 250 full-time benefits decision makers. All respondents
worked at companies with at least 500 employees that were at least interested in offering financial wellness programs.
More than half of those surveyed (54 percent) said they currently offer financial wellness initiatives, with a third noting
that they were only “interested” in financial wellness initiatives and were not actively offering them (Figure 2).
1 Ron Z. Goetzel1 and Ronald J. Ozminkowski. 2008. “The Health and Cost Benefits of Work Site Health-Promotion Programs.” Annu. Rev. Public Health 29: 303–23.

ebri.org Issue Brief • November 29, 2018 • No. 466 7
Related Benefits
Nearly two-thirds (63 percent) of respondents reported tying their health benefits to a health and
wellness program, such as for health screenings or incentives for taking healthy actions. Ninety-four
percent offered a defined contribution plan, with 97 percent offering some type of employer
contribution. Just 1 percent of respondents offered no retirement benefits to employees.
54%
12%
34%
We currently offer financial wellness initiatives
We are actively implementing financial wellness initiatives
We are interested in financial wellness initiatives
Figure 2Current Approach in Offering Financial Wellness Initiatives to
Employees
Which statement most accurately reflects your company’s current approach in offering financial wellness initiatives to employees? (n=250)
Evaluating the Need
How do employers determine whether they should offer these programs? The survey started by asking employers to
rank on a scale of 1–10 their level of concern about their employees’ financial wellbeing (Figure 3). Those scoring 1–6
were rated as having a low level of concern. Those scoring 9–10 were rated as having a high level of concern. Among
firms with any level of interest in financial wellbeing programs, about one-quarter (26 percent) were rated as being
highly concerned about their employees’ financial wellbeing. Another quarter (28 percent) were rated as having a low
level of concern. The rest (46 percent) were rated as being moderately concerned (scoring 7–8). Not surprisingly, firms
with high concern were more likely to be offering financial wellness initiatives (73 percent). Those with low to moderate
concern levels were about equally likely to offer the initiatives (46 percent and 47 percent, respectively). However,
moderately concerned employers were more likely to be actively implementing such initiatives (18 percent) compared
with those with low levels of concern (6 percent).
Beyond level of concern, other factors associated with actually offering or actively implementing financial wellness
initiatives — vs. merely expressing an interest in them — included (Figure 4):

ebri.org Issue Brief • November 29, 2018 • No. 466 8
Figure 3Levels of Concern About Employees’ Financial Wellness
28% 46% 26%
Low Concern (1–6) Moderate concern (7–8) High concern (9–10)
47%
18%
35%
Moderate concern
Currently offer Actively implementing Interested in
46%
6%
48%
Low concern
73%
9%
18%
High concern
Which statement most accurately reflects your company’s current approach in offering financial wellness initiatives to employees?
(Low concern, n=165; Moderate concern, n=115, High concern, n=66)
Please rate your company’s level of concern about employees’ financial wellbeing. (n=250)
Firm Demographics
76% 10,000 or more employees(vs. 49% less than 10,000)
59% Level of concern about employees’ financial wellbeing
ranked 8–10(vs. 34% interested)
51% Describe work-life balance as very good or excellent
(vs. 32% interested)
65% Describe employees as very or extremely satisfied with
benefits(vs. 45% interested)
Figure 4Characteristics of Firms Currently Offering or Actively
Implementing Financial Wellness Initiatives
Firms currently offering or actively implementing financial wellness initiatives are more likely than those interested in financial wellness initiatives to be…
Health Benefits Offered
65% High-deductible health plan with HSA
(vs. 47% interested)
70% Have health benefits tied to health and wellness program
(vs. 49% interested)
All percentages shown are statistically significant.
Benefits Offered
71% Supplemental life(vs. 55% interested)
42% Legal services(vs. 19% interested)
20% College savings account(vs. 9% interested)
73% Paid maternity/paternity leave
(vs. 56% interested)
22% Adoption assistance/reimbursement
(vs. 11% interested)

ebri.org Issue Brief • November 29, 2018 • No. 466 9
Figure 5Measuring Financial Wellness
What steps has your company taken or does it plan to take to understand your employees’ financial wellness needs? (n=250)
•Note: “Other” category not included.
Steps Taken to Understand Employees’ Financial Wellness Needs
48%
36%
36%
26%
14%
16%
21%
18%
17%
23%
22%
18%
24%
37%
40%
41%
55%
6%
9%
6%
10%
10%
Examined existing employee benefit/retirement plandata
Surveyed employees
Analyzed other quantitative employee data
Held employee focus groups
Conducted a financial wellness needs assessment
Created a financial wellbeing score or metric
Has taken Plan to take Not planning to take Not sure
63% 4%
Larger employee base: 76% of employers with 10,000 or more employees were offering financial wellness
initiatives at the time, compared with 49 percent of those with fewer than 10,000 employees.
Higher likelihood of offering health benefits tied to health and wellness programs (70 percent).
Offering other benefits such as supplemental life insurance (71 percent), paid maternity/paternity leave (73
percent), or legal services (42 percent).
How do employers know whether to be concerned about employees’ financial wellbeing? To understand this, we asked
employers the steps they have taken to gauge employees’ financial wellness needs (Figure 5). The most common
approach reported was examining existing employee benefit/retirement plan data such as deferral rates, average
balances, and loan frequency/amount. Nearly two-thirds of respondents (63 percent) had taken this step. Surveying
employees came in second, with nearly half (48 percent) saying they have taken this step. Creating a financial
wellbeing score or metric was the least common approach (14 percent) overall. However, among employers with
10,000 or more employees, greater than a quarter (27 percent) said they have done so, and another 37 percent
planned to take this step. Further, those who were highly concerned about their employees’ financial wellbeing (29
percent) were significantly more likely than those with moderate (12 percent) or low concern (1 percent) to say they
have created a financial wellbeing score or metric.
As shown in Figure 6, the top reasons given for offering financial wellness initiatives were: improved overall worker
satisfaction (54 percent), reduced employee financial stress (48 percent), and improved employee retention (e.g., lower
workforce turnover), 47 percent. Midsized employers — those with 2,500 to 9,999 employees — were the most likely to
say they offer initiatives to improve their workers’ overall satisfaction (67 percent). In contrast, large employers
(>10,000 employees) were most likely to cite increased employee productivity (37 percent) and being a differentiator
from their competitors (27 percent).

ebri.org Issue Brief • November 29, 2018 • No. 466 10
54%
48%
47%
34%
32%
22%
21%
16%
15%
7%
3%
1%
Improved overall worker satisfaction
Reduced employee financial stress
Improved employee retention (e.g., lower workforce turnover)
Improved employee use of existing benefits (such as higher contributionsto the 401(k) plan/lower loans or withdrawals)
Increased employee productivity
Improved employee recruitment
Improved workforce management for retirement
Reduced employee absenteeism
Differentiator from our competitors
Realization of the company’s commitment to community service
Required as part of union agreement
Other
What are or would be your top 3 reasons for offering financial wellness initiatives to employees? (n=250)
Figure 6Top Reasons for Offering Financial Wellness Initiatives
Figure 7Estimated Proportion of Workforce Eligible
Approximately what percentage of employees in your company do you estimate are eligible for financial wellness benefits and have or would likely make use of these
benefits? (n=250)
9%
19%
22%
43%
7%
Fewer than 10% 11% to 25% 26% to 50% 51% or higher Not sure

ebri.org Issue Brief • November 29, 2018 • No. 466 11
Figure 8Approach to Offering Financial Wellness Initiatives
How do you or might you offer your financial wellness initiatives? (n=250)
38%
46%
38%
27%
30%
52%
32%
26%
36%
33%
34%
29%
16%
9%
15%
27%
21%
8%
12%
14%
10%
11%
15%
6%
4%
5%
All firms
Low (1–6)
Moderate (7–8)
High (9–10)
Offering or activelyimplementing
Interested in
Pilot program Periodic campaigns/ad hoc Holistic program One-time initiative Other
Company’s concern about employees’ financial wellbeing
Company’s current approach to offering financial wellness initiatives
Roughly four in ten (43 percent) employers believed that more than half of the employees in their company are eligible
for financial wellness benefits and had or would likely make use of these benefits. However, as shown in Figure 7, more
than a quarter believed that 25 percent or fewer employees are eligible or have or would use them. Nearly half of
those already offering or actively implementing financial wellness benefits estimated more than 50 percent of their
employees are eligible and would make use of these benefits, significantly higher than the 34 percent of those only
interested in these benefits.
Approaches to Financial Wellness
Approaches to financial wellness programs vary widely, according to survey respondents, ranging from third-party
emergency assistance programs to one-on-one sessions. However, a key feature of the majority of financial wellness
initiatives is that few are currently considered “holistic” programs. Instead, the majority of employers characterized
these programs as pilot programs (38 percent) or periodic or ad hoc programs (32 percent). As Figure 8 shows, even
among employers with a high level of concern, only 27 percent characterized their financial wellness initiatives as
“holistic.”
Firms that describe their financial wellness initiatives as “holistic programs” are more focused on the value of the
programs to employees, are less cost conscious, and are making bigger investments in their financial wellness initiatives
(Figure 9). Nearly two-thirds (63 percent) stated that the value proposition to employees is their top consideration for
offering financial wellness initiatives (vs. 36 percent pilot; 38 percent periodic). Just over a quarter (27 percent) stated
cost as a main consideration (vs. 61 percent pilot; 43 percent periodic).
These firms also tended to have fewer than 10,000 workers: 22 percent of employers with 10,000 or more workers
described their approach as ad-hoc or periodic outreach vs. 9 percent of those with fewer than 10,000. Firms with
periodic initiatives were more likely to cite seminars, workshops, or group sessions (26 percent) and ad-hoc outreach
(22 percent).

ebri.org Issue Brief • November 29, 2018 • No. 466 12
Figure 9Who Considers Their Financial Wellness Initiatives a Holistic
Program?
Firms defining their financial wellness initiatives as holistic are more likely than those offering pilot or periodic initiatives to be…
Financial Wellness Offerings
5.9 Average count of financial wellness benefits, out of 15
(vs. 3.8 pilot; 5.0 periodic)
2.6 Average count of steps taken to understand employees’ needs
(vs. 1.9 pilot; 2.6 periodic)
All percentages shown are statistically significant.
Considerations
63% Value proposition to employees as top consideration
to offering financial wellness(vs. 36% pilot; 38% periodic)
Less likely to have cost as a main consideration: 27%
(vs. 61% pilot; 43% periodic)
21% Average annual cost per employee is more than $500
(vs. 2% pilot; 4% periodic)
Benefits Offered
80% Flexible work arrangements(vs. 54% pilot; 49% periodic)
56% Paid family/eldercare leave(vs. 35% pilot; 32% periodic)
Financial Wellness Offerings
Employee discount programs such as for cell phones, travel, and entertainment; tuition reimbursement; and financial
planning education, seminars, and webinars are the most common financial wellness benefits offered — rating
responses of 72 percent, 69 percent, and 60 percent, respectively (Figure 10). In contrast, only about one in ten of
those surveyed offer emergency savings vehicles or accounts, debt management services, or student loan repayment
subsidies or consolidation/refinancing services.
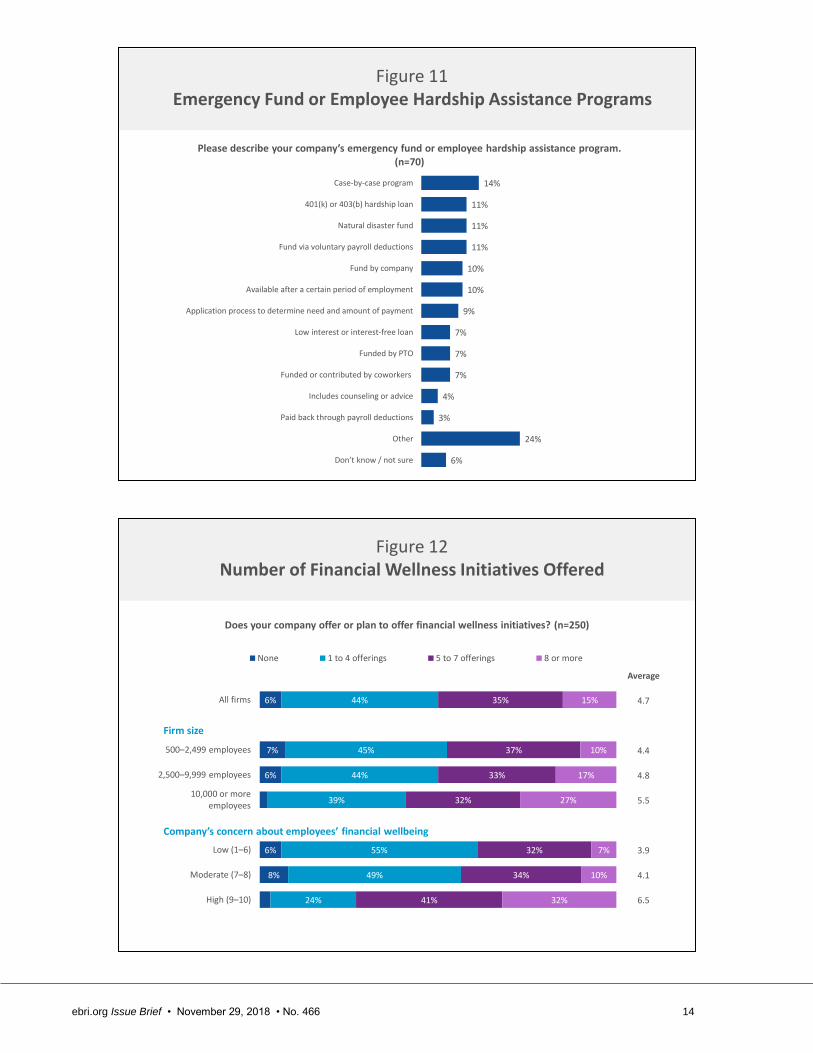
About a quarter (28 percent) of those surveyed said they offer emergency funds or employee hardship assistance.
However, these vary widely, including case-by-case programs (14 percent), natural disaster funds (11 percent),
hardship loans from defined contribution plans (11 percent), and funds from voluntary payroll deductions (11 percent).
The other category generally consisted of responses that emergency fund programs are available, but with no clear
approach given (Figure 11).
Despite the fact that relatively few organizations said they offer holistic financial wellbeing programs, many offered a
patchwork of numerous initiatives to assist employees with their financial wellbeing, debt, and other personal financial
challenges (Figure 12). On average, respondents offered 4.7 initiatives. Large employers offered more than small
employers (5.5 and 4.4 on average, respectively). Companies that scored high in terms of their level of concern about
employees’ financial wellbeing offered more than those with low levels of concern (6.5 and 3.9 on average,
respectively).
While 42 percent reported delivering their financial wellness programs via email, often these programs were delivered
in a high-touch way, such as in-person group sessions (48 percent) or in-person individual sessions (40 percent), as
shown in Figure 13. Despite the proliferation of fintech financial wellness solutions, mobile apps were not a common
delivery mechanism, with only 12 percent of respondents reporting this delivery approach. Not surprisingly, larger
employers were much more likely than smaller employers to favor email delivery (68 percent and 55 percent,

ebri.org Issue Brief • November 29, 2018 • No. 466 13
72%
69%
60%
47%
47%
37%
28%
25%
17%
12%
12%
11%
11%
11%
10%
11%
8%
20%
15%
18%
7%
10%
17%
14%
4%
6%
9%
7%
13%
7%
15%
19%
17%
33%
30%
51%
53%
50%
56%
78%
75%
73%
70%
68%
74%
4%
6%
5%
5%
8%
8%
14%
6%
7%
8%
12%
8%
8%
Employee discount programs/partnerships (e.g., cell phones, travel,entertainment)
Tuition reimbursement
Financial planning education, seminars or webinars
Personalized financial counseling, coaching, or planning
Basic money management tools, such as budgeting tools or calculators
Bank-at-work partnership with a bank or credit union
Emergency fund/Employee hardship assistance
Personalized credit or debt management counseling, coaching or planning
Incentives or gamification to encourage non-retirement savings andprudent financial actions taken
Payroll advance loans through the employer
Short-term loans through payroll deduction, through a third-party
Emergency savings vehicle/account through payroll deduction
Debt management services (e.g., negotiated debt repayment)
Student loan repayment subsidies (employer-paid)
Student loan debt consolidation/refinancing services
Offers Plans to offer Not planning to offer Not sure
Figure 10Financial Wellness Initiatives Offered
Which of the following does your company offer to help employees with personal financial challenges?
respectively). However, individual telephone sessions were the second most-favored delivery approach among large
employers (50 percent).
In-person individual sessions were the most likely method for both personalized financial counseling and credit and
debt counseling programs, while in-person group sessions were utilized most often for financial education and
incentivization programs.
Motivating and Measuring
Communication from human resource professionals was the number one way that employers encouraged employees to
use the financial wellness initiatives they made available (39 percent), as shown in Figure 14. The second most
common approach was monetary incentives, which may include discounts on insurance, small cash bonuses for signing
up, and free credit monitoring. This was noted by 19 percent of respondents. Internal champions and communication
from upper management tied for third place with 13 percent each. Those in the education industry (29 percent) or the
government (28 percent) were more likely than those in finance to offer monetary incentives or financial rewards (8
percent).
When it comes to championing the implementation of financial wellness initiatives, the most commonly cited primary
champion was human resources (55 percent), followed by a senior executive (21 percent), as shown in Figure 15.
Human resources was also cited as the most common secondary champion of these initiatives (26 percent). Ninety
percent of those with 10,000 or more employees cited HR as primary or secondary champions (vs. 78% of those with
fewer than 10,000 employees).
ebri.org Issue Brief • November 29, 2018 • No. 466 14
Figure 12Number of Financial Wellness Initiatives Offered
Does your company offer or plan to offer financial wellness initiatives? (n=250)
6%
7%
6%
6%
8%
44%
45%
44%
39%
55%
49%
24%
35%
37%
33%
32%
32%
34%
41%
15%
10%
17%
27%
7%
10%
32%
All firms
500–2,499 employees
2,500–9,999 employees
10,000 or moreemployees
Low (1–6)
Moderate (7–8)
High (9–10)
None 1 to 4 offerings 5 to 7 offerings 8 or more
Firm size
Company’s concern about employees’ financial wellbeing
Average
4.7
4.4
4.8
5.5
3.9
4.1
6.5
Figure 11Emergency Fund or Employee Hardship Assistance Programs
14%
11%
11%
11%
10%
10%
9%
7%
7%
7%
4%
3%
24%
6%
Case-by-case program
401(k) or 403(b) hardship loan
Natural disaster fund
Fund via voluntary payroll deductions
Fund by company
Available after a certain period of employment
Application process to determine need and amount of payment
Low interest or interest-free loan
Funded by PTO
Funded or contributed by coworkers
Includes counseling or advice
Paid back through payroll deductions
Other
Don’t know / not sure
Please describe your company’s emergency fund or employee hardship assistance program. (n=70)

ebri.org Issue Brief • November 29, 2018 • No. 466 15
Figure 13How Financial Wellness Programs Are Delivered
In which of the following ways are your financial wellness initiatives delivered?
(n=43)
48%
42%
40%
34%
32%
29%
28%
12%
7%
In-person group sessions
Email communication
In-person individual session
Online individual sessions
Paper-based materials or worksheets
Online group sessions
Individual telephone sessions
Through mobile apps
Text communication
Figure 14Encouraging Employees to Use Financial Wellness Initiatives
How do you or might you encourage employees to use your company’s financial wellness initiatives? (n=250)
39%
19%
13%
13%
7%
4%
2%
3%
Communication from HR
Monetary incentives/financial rewards (e.g., discounts on insurance,small cash bonuses for signing up, free credit monitoring)
Internal champions (such as local managers)
Communication from upper management
Peer-to-peer communication
Non-monetary incentives (e.g., points, badges, recognition)
Other
Not sure

ebri.org Issue Brief • November 29, 2018 • No. 466 16
Figure 15Internal Champion for Financial Wellness Initiatives
Who has been or who will be your primary and secondary champions for implementing financial wellness initiatives? (Primary n=250; Secondary n=245)
55%
21%
10%
6%
26%
19%
17%
16%
7%
5%
6%
80%
40%
26%
22%
9%
6%
5%
2%
8%
Human resources
A senior executive
An existing vendor made this availablethrough an existing platform
A department head
A union or other group of employees
A nonprofit or government agency soughtour partnership for a program
A board member, investor, or shareholder
Other
None of these/not surePrimary
Secondary
Value Proposition and Considerations in Offering Financial Wellness Programs
Cost to employer (50 percent), interest among employees (46 percent), and value proposition to employees (40
percent) ranked as the top three considerations that employers stated they use to determine whether to offer financial
wellness benefits to their employees. Value proposition to the company ranked fourth, with 27 percent stating that as a
top consideration (Figure 16). In drilling deeper, employers defined “value proposition” to employees or the company
as: employees valuing the benefits provided (30 percent); the company receiving some sort of return on investment,
including reduced absenteeism, or improved performance or productivity (25 percent); or a positive cost/benefit
analysis (16 percent) of the programs in question (Figure 17).
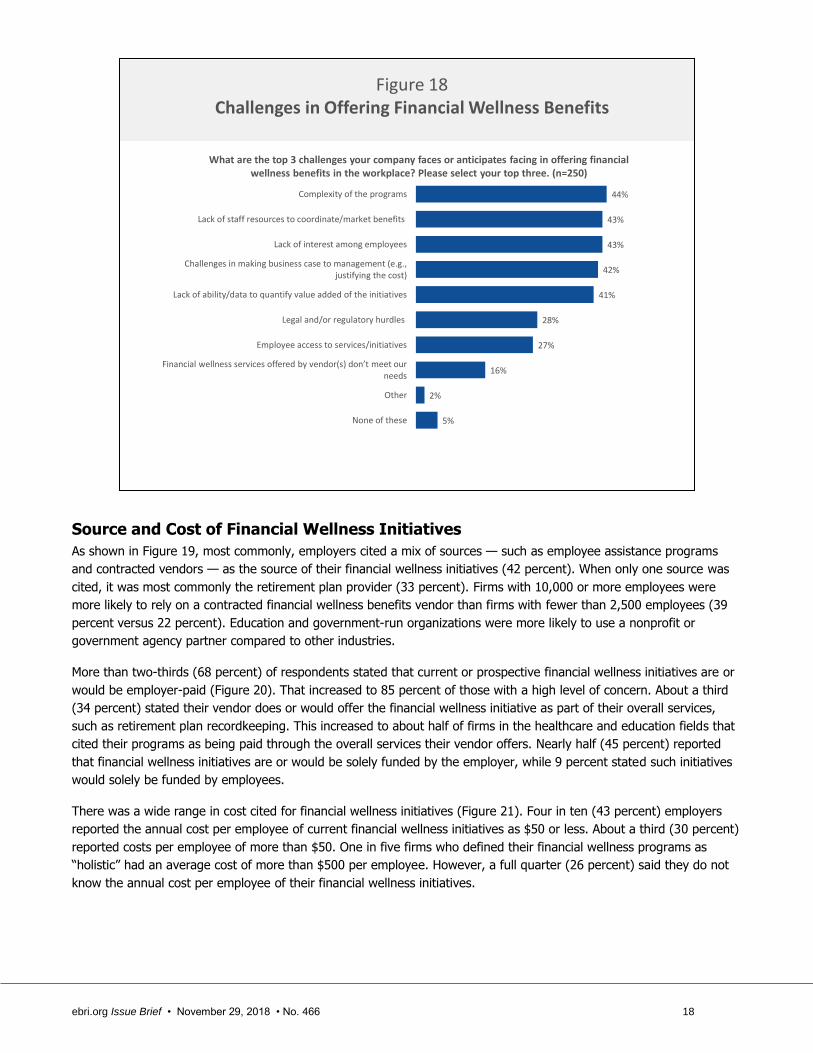
Employers noted that they face many challenges in offering financial wellness initiatives. These included complexity of
programs (44 percent), lack of staff resources to coordinate and/or market the benefits of the programs (43 percent),
lack of interest among employees receiving the initiatives (43 percent), challenges in making an effective business case
to management to justify the cost of the initiatives (42 percent), and lack of ability and/or data to quantify the value
added of the initiatives (41 percent), as shown in Figure 18. Only 5 percent cited no challenges faced in offering these
initiatives. Six in ten with low concern around financial wellbeing said lack of interest among employees is a challenge.

ebri.org Issue Brief • November 29, 2018 • No. 466 17
Figure 16Top Considerations Used to Determine Whether to Offer
What were or will be your top 3 considerations used to determine whether to offer financial wellness benefits to your employees? (n=250)
50%
46%
40%
27%
25%
24%
23%
20%
Cost to employer
Interest among employees
Value proposition to employees
Value proposition to the company
Cost to employee
Impact on employee productivity
Impact on employees’ retirement preparedness
Whether the program’s success can be measured
30%
25%
16%
15%
11%
9%
7%
4%
3%
1%
5%
7%
4%
Employees value benefits
Return on investment (including absenteeism, performance,productivity)
Cost/benefit analysis
Employees utilize and engage with the programs
Improve employee retention and recruitment
Employee satisfaction
In best interest of employees
Part of overall benefits
Make company an employer of choice and improve reputation
Management of human capital
Other
Don’t know / not sure
None / N/A
Figure 17Value Proposition and Challenges
Please explain what you mean when saying the “value proposition” to employees or the company was or will be among your top considerations. (n=141)
ebri.org Issue Brief • November 29, 2018 • No. 466 18
Figure 18Challenges in Offering Financial Wellness Benefits
44%
43%
43%
42%
41%
28%
27%
16%
2%
5%
Complexity of the programs
Lack of staff resources to coordinate/market benefits
Lack of interest among employees
Challenges in making business case to management (e.g.,justifying the cost)
Lack of ability/data to quantify value added of the initiatives
Legal and/or regulatory hurdles
Employee access to services/initiatives
Financial wellness services offered by vendor(s) don’t meet our needs
Other
None of these
What are the top 3 challenges your company faces or anticipates facing in offering financial wellness benefits in the workplace? Please select your top three. (n=250)
Source and Cost of Financial Wellness Initiatives
As shown in Figure 19, most commonly, employers cited a mix of sources — such as employee assistance programs
and contracted vendors — as the source of their financial wellness initiatives (42 percent). When only one source was
cited, it was most commonly the retirement plan provider (33 percent). Firms with 10,000 or more employees were
more likely to rely on a contracted financial wellness benefits vendor than firms with fewer than 2,500 employees (39
percent versus 22 percent). Education and government-run organizations were more likely to use a nonprofit or
government agency partner compared to other industries.
More than two-thirds (68 percent) of respondents stated that current or prospective financial wellness initiatives are or
would be employer-paid (Figure 20). That increased to 85 percent of those with a high level of concern. About a third
(34 percent) stated their vendor does or would offer the financial wellness initiative as part of their overall services,
such as retirement plan recordkeeping. This increased to about half of firms in the healthcare and education fields that
cited their programs as being paid through the overall services their vendor offers. Nearly half (45 percent) reported
that financial wellness initiatives are or would be solely funded by the employer, while 9 percent stated such initiatives
would solely be funded by employees.
There was a wide range in cost cited for financial wellness initiatives (Figure 21). Four in ten (43 percent) employers
reported the annual cost per employee of current financial wellness initiatives as $50 or less. About a third (30 percent)
reported costs per employee of more than $50. One in five firms who defined their financial wellness programs as
“holistic” had an average cost of more than $500 per employee. However, a full quarter (26 percent) said they do not
know the annual cost per employee of their financial wellness initiatives.

ebri.org Issue Brief • November 29, 2018 • No. 466 19
Figure 19Source of the Financial Wellness Initiative
Who is or might be the source or provider of financial wellness initiatives? Please select all that apply. (n=250)
42%
33%
26%
26%
24%
24%
9%
<0.5%
5%
A mix of methods (e.g., EAP, contracted vendor)
Retirement plan provider
A contracted financial wellness benefits vendor(s)
The company itself
A contracted employee assistance program (EAP)
Other third party provider
A nonprofit or government agency partner
Other
Not sure
Figure 20Who Pays or Might Pay for the Initiatives
Who pays or might pay for your financial wellness initiatives? Please select all that apply. (n=250)
68%
34%
20%
2%
5%
Employer-paid
Vendor offers as part of overall services (such as retirementplan recordkeeping)
Employee-paid
Other
Not sure

ebri.org Issue Brief • November 29, 2018 • No. 466 20
Figure 21Cost of Financial Wellness Initiatives
On average, what is the annual cost per employee for financial wellness initiatives? (n=134)
4%
10%
6%
9%
14%
8%7%
8%7%
26%
$0.00 $0.01 to $5.00 $5.01 to$10.00
$10.01 to$20.00
$20.01 to$50.00
$50.01 to$100.00
$100.01 to$250.00
$250.01 to$500.00
More than$500.00
Not sure
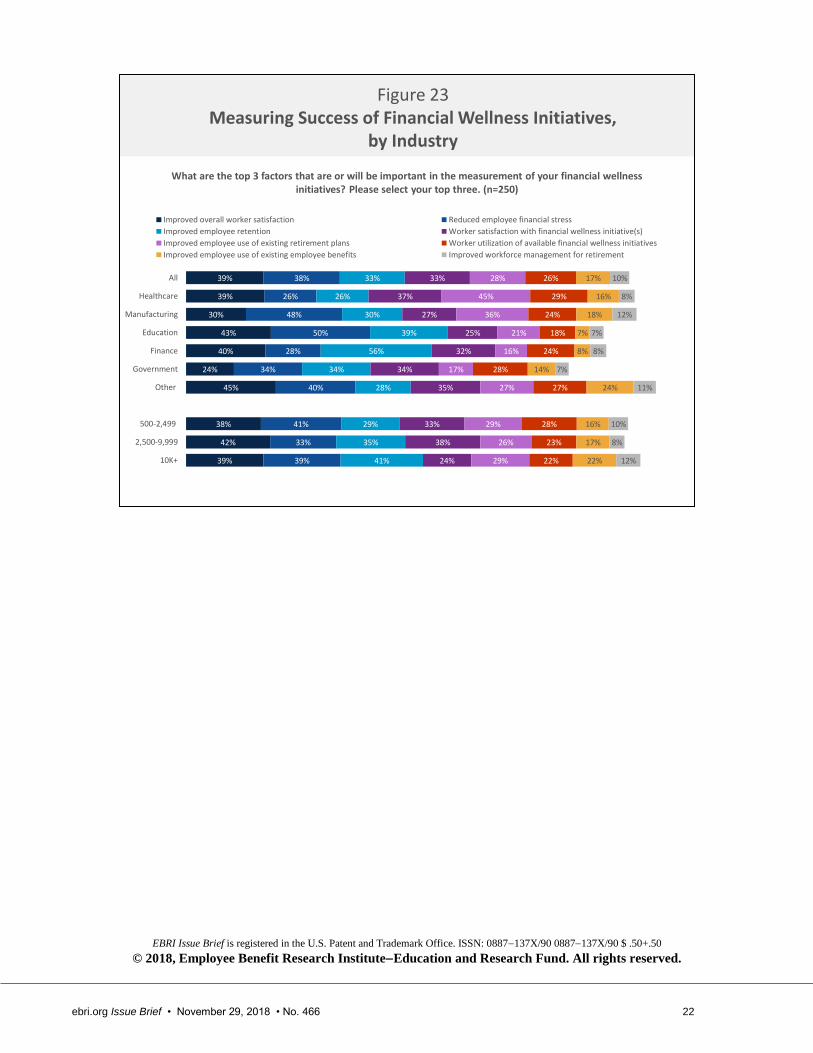
Measuring Success of the Initiatives
Measures used to evaluate the success of financial wellness initiatives ranged from specific (improved employee
retention) to quite broad (improved overall worker satisfaction). Improved overall worker satisfaction scored as the top
measure of financial wellness initiatives with 39 percent, closely followed by reduced employee financial stress (Figure
22). Worker satisfaction with the financial wellness initiatives and improved employee retention tied for third place with
33 percent each.
For health care companies, improved employee use of existing retirement plans scored the highest as the measure of
success of financial wellness initiatives. For education and manufacturing, reduced employee financial stress scored the
highest.
Conclusion
Financial wellbeing has become something of a hot-button issue in the workplace. Thirty percent of workers report
worrying about finances at work. And, many important factors were correlated with this worrying. For example, nearly
three quarters (71 percent) of those who said debt was a major problem worried about finances at work, compared
with just 9 percent of those who said debt was not a problem. More than half (55 percent) of those who were not
confident about living comfortably in retirement were worried about finances at work vs. just 7 percent of those who
were very confident.2 According to the Retirement Confidence Survey, nearly 2 in 3 workers called debt a major or
minor problem and more than 4 in 10 said it’s negatively impacting their ability to save for retirement.3 Moreover, when
2 Craig Copeland. “Perceived Helpfulness of Financial Well-being Programs: Results From the 2017 and 2018 Retirement Confidence Surveys.” EBRI Issue Brief, no. 457 (Employee Benefit Research Institute, Aug 20, 2018). 3 Employee Benefit Research Institute and Mathew Greenwald & Associates. 2018 Retirement Confidence Survey. Washington, DC: Employee Benefit Research Institute, 2018.

ebri.org Issue Brief • November 29, 2018 • No. 466 21
Figure 22Top Factors in Measuring Financial Wellness Initiatives
39%
38%
33%
33%
28%
26%
24%
18%
17%
14%
11%
10%
4%
Improved overall worker satisfaction
Reduced employee financial stress
Worker satisfaction with financial wellness initiative(s)
Improved employee retention
Improved employee use of existing retirement plans
Worker utilization of available financial wellness initiatives
Increased employee productivity
Improved employee recruitment
Improved employee use of existing employee benefits
Reduced employee absenteeism
Differentiator from our competitors
Improved workforce management for retirement
Realization of commitment to community service
•Note: “Other” category not included.
What are the top 3 factors that are or will be important in the measurement of your financial wellness initiatives? (n=250)
it comes to specific debt, the percentage of American families with student loan debt has increased from 10.5 percent
in 1992 to 22.3 percent in 2016. This debt was much higher for families with younger heads. For families with heads
ages less than 35, 44.8 percent had student loan debt in 2016, compared with 12.9 percent for families with heads
ages 55–64.4
It is therefore not surprising that employers are interested in initiatives intended to improve the financial wellbeing of
their workers. However, as the EBRI survey shows, even employers active in this area are clearly in the initial phases of
evaluating employees’ financial wellness, implementing financial wellness programs, and measuring their success. They
appear to be defining financial wellness fairly broadly, including the needs that should be addressed. They cite
numerous considerations, including challenges in making the business case to management of justifying the cost of the
initiatives — which is often borne by the employer. However, many — especially those currently offering such programs
— believe that the majority of their employees would be eligible or likely make use of these benefits.
Policymakers appear to have a role in this area as well. For example, the IRS recently issued a private letter ruling
responding to a plan sponsor's request to allow a defined contribution plan to receive tax-advantaged student loan
matching contributions. In Britain, the National Employment Savings Trust (NEST) (the UK’s nationwide, public-option,
auto-enrolled defined contribution plan) is testing out a “sidecar” savings account as a source of emergency cash that
would ride beside a worker’s retirement account.
In its recent reports, the BCFP concludes: “Financial well-being is a state of being wherein a person can fully meet
current and ongoing financial obligations, can feel secure in their financial future, and is able to make choices that allow
them to enjoy life.” By this definition, the measure of success of such initiatives is their ability to help workers find
balance between today’s financial needs and tomorrow’s financial goals.
4 Craig Copeland, “Student Loan Debt: Trends and Implications,” EBRI Issue Brief, no. 453 (Employee Benefit Research Institute, July 9, 2018).
ebri.org Issue Brief • November 29, 2018 • No. 466 22
39%
39%
30%
43%
40%
24%
45%
38%
42%
39%
38%
26%
48%
50%
28%
34%
40%
41%
33%
39%
33%
26%
30%
39%
56%
34%
28%
29%
35%
41%
33%
37%
27%
25%
32%
34%
35%
33%
38%
24%
28%
45%
36%
21%
16%
17%
27%
29%
26%
29%
26%
29%
24%
18%
24%
28%
27%
28%
23%
22%
17%
16%
18%
7%
8%
14%
24%
16%
17%
22%
10%
8%
12%
7%
8%
7%
11%
10%
8%
12%
All
Healthcare
Manufacturing
Education
Finance
Government
Other
500-2,499
2,500-9,999
10K+
Improved overall worker satisfaction Reduced employee financial stress
Improved employee retention Worker satisfaction with financial wellness initiative(s)
Improved employee use of existing retirement plans Worker utilization of available financial wellness initiatives
Improved employee use of existing employee benefits Improved workforce management for retirement
What are the top 3 factors that are or will be important in the measurement of your financial wellness initiatives? Please select your top three. (n=250)
Figure 23Measuring Success of Financial Wellness Initiatives,
by Industry
EBRI Issue Brief is registered in the U.S. Patent and Trademark Office. ISSN: 0887137X/90 0887137X/90 $ .50+.50
© 2018, Employee Benefit Research InstituteEducation and Research Fund. All rights reserved.