Embed Size (px)
Citation preview
1EBS DKM Affordability Index
March 2016
EBS DKM IRISH HOUSING AFFORDABILITY INDEX
The EBS DKM Affordability Index is a measure of the proportion of after tax income required to meet the first year’s mortgage payments for an ‘average’ first-time buyer (FTB) working couple, each on average earnings. It takes into account, not just property prices, but changes in mortgage rates, mortgage interest relief and disposable incomes for the average FTB working couple in Dublin and across the State.

3EBS DKM Affordability Index
KEY MESSAGES✓ The purpose of this publication is to track trends
in housing affordability for first-time buyers. The definition of affordability is the proportion of after tax income required to meet mortgage payments in the first year for an average FTB working couple each on average earnings. Thus the measure of affordability used refers to the potential buyer’s ability to fund a mortgage out of net income. It says nothing about the borrower’s ability to raise the mortgage in the first instance. However, over a year ago new lending regulations introduced by the Central Bank lessened the ability to raise a mortgage for most borrowers. The impact of the new rules has been the requirement to raise a significantly higher deposit than under the previous regime. As a result the assumption used regarding the loan to value (LTV) ratio when measuring affordability was lowered towards 80 per cent in the latter months of 2015 from 83 per cent used previously.
✓ Over the last two years, trends in national housing affordability show housing was least affordable for FTBs across the State in the latter half of 2014, reflecting a combination of relatively high mortgage rates, evidence of prime movers in the property market and the shortage of supply. As the Central Bank rules became bedded down during 2015, the lower LTV ratio of 80 per cent over the latter months of 2015, led to an improvement in affordability. The average FTB property price was estimated at €222,782 in January 2016 implying an average mortgage of €178,225, based on an 80 per cent LTV ratio. The corresponding affordability requirement was 19.1 per cent of net income compared with 19.5 per cent in January 2015.
✓ The corresponding trend in housing affordability for Dublin FTB working couples led to properties in Dublin being least affordable in October 2014, when mortgage payments accounted for 24.3 per cent of net income, their highest level since December 2008. Housing affordability improved during 2015 and by December 2015 mortgage payments had fallen to 21.7 per cent of net income. This improvement is attributed to the stability in Dublin house prices during 2015 but also the reduction in mortgage rates as well as the lower LTV ratio of 80 per cent from December 2015. The average Dublin FTB property price was estimated at €264,223 in January 2016 implying an average mortgage of €211,379, based on an 80 per cent LTV ratio. It is estimated that a further improvement materialised in January 2016, with mortgage payments fell to 21.3 per cent of net income.
✓ The recovery in property prices outside of Dublin lagged the upturn in Dublin prices with the result that property price inflation outside of Dublin did not return in year-on-year terms until January 2014. Average prices overall increased by 10.5 per cent outside Dublin in 2015, almost twice the corresponding rate in 2014. Housing affordability for FTBs outside of Dublin remained very stable over the past three years at around 15-16 per cent of net income. The current estimate is 16 per cent of net income based on an average property price of €187,368 implying an average mortgage of €149,895, assuming an 80 per cent LTV ratio.
✓ Affordability for single FTBs continues to be challenging and has consistently been at
4 EBS DKM Affordability Index
unsustainable levels, even throughout the recession period. Having peaked at around one-half of disposable income in late 2006, it fell to around 35 per cent of net income during 2013/early 2014. Affordability pressures got worse for single FTBs during 2014, reaching 41 per cent of net income, but by December 2015, lower mortgage rates, more stable house prices and the lower LTV ratio led to a modest improvement to 38.5 per cent of net income. Affordability for a single person on average earnings is currently estimated at 38.1 per cent of net income, based on the average FTB price of €222,782 and a corresponding mortgage of €178,225.
✓ A further measure of the challenge for potential single FTBs is evident from the price to income ratio, which reached 9.3 times the average disposable income at the peak. The corresponding ratio during the recession fell to 4.6 but had increased back to 7.7 times by January 2016. Historical trends would suggest that this ratio should be around 4 to 5 in a properly functioning housing market.
✓ While housing affordability trends have improved since October 2015, the most burdensome impact of the Central Bank regulations for FTBs has to be the requirement to have saved significant funds in advance of being considered for a mortgage. As a result, FTBs have looked to other sources to fund the required deposits, where other options are available. With the Central Bank rules due to
be reviewed over the summer - likely to remain unchanged or be relaxed (more restrictive rules are unlikely) - the likelihood is that mortgage demand would be higher than it otherwise would be, were the rules to be relaxed. Basic economics would suggest that this would lead to higher house prices, unless we see a substantial increase in the level of supply coming to the market later this year.
✓ An analysis of housing affordability by county shows that housing is currently more affordable in every county compared with 2014, with the exception of Laois and Cavan, and is unchanged in Limerick. Although median prices are higher in every county in 2015 compared with 2014, apart from Offaly, the lower average mortgage rate and the reduction in the LTV to 80 per cent from 83 per cent have positively impacted on the proportion of net income required to fund monthly mortgage payments.
✓ While many banks have focused on attracting new mortgage customers through very competitive new business rates, there are a number of mortgage providers who have also taken into consideration rate reductions for their existing mortgage customers. For example both EBS and AIB have reduced variable rates on three different occasions over the past 15 months for both new and existing customers while at the same time introducing market leading fixed rate mortgages across the Group demonstrating a customer centric approach to pricing for all of its customers.
KEY MESSAGES CONTINUED
5EBS DKM Affordability Index
HOUSING AFFORDABILITY HAS BECOME MORE ABOUT THE ABILITY TO RAISE THE DEPOSIT THAN THE ABILITY TO FUND MORTGAGE REPAYMENTS Since publication of the last EBS DKM Housing Affordability Index in May 2015, the housing market has continued to receive considerable attention. Housing supply remains below normal, with just over 8,000 units commenced last year, of which 3,100 were in Dublin. There were around 48,000 property transactions in total, one-half of which were bought for cash. The Central Bank new lending rules dominated the market during 2015 with much speculation now around what, if any changes, the Central Bank will make over the summer. However, their impacts were evident towards the end of the year as prices declined in Dublin in the last three months and slowed sharply across the country as a whole. In a market characterised by a lack of supply and pent-up demand, these price developments are unusual. Conversely, recent reports suggest that rents nationally and in the main cities are continuing their upward trend, rising by 9 per cent during 2015 with just 3,600 rental properties on the market across the country (Daft.ie).
The purpose of this publication is to track trends in housing affordability for first-time buyers (FTBs) on a monthly basis. The definition of affordability is the proportion of after tax income required to meet the mortgage payments in the first year for an average FTB working couple each on average earnings. Thus
the measure of affordability used refers to the potential buyer’s ability to fund a mortgage out of net income.
However, the measure says nothing about the borrower’s ability to raise the mortgage in the first instance. Over a year ago new lending regulations introduced by the Central Bank on 9th February 2015 lessened the ability to raise a mortgage for most borrowers. The most onerous impact of the new rules has been the requirement to raise a significantly higher deposit than under the previous regime. The related restriction on Loan to Income limits of 3.5 times gross income, with some exceptions, will have further dented the capacity to borrow for potential house buyers. The Central Bank has announced that it is to review the lending rules over the summer which will result in either the rules remaining unchanged or being relaxed; more restrictive rules are unlikely given current conditions in the market. While there is no point in speculating about the outcome of the review, the likelihood is that mortgage demand would be higher than it otherwise would be, were the rules to be relaxed. Basic economics would suggest that this would lead to higher house prices, unless we see a substantial increase in the level of supply coming to the market later this year.
EBS DKM Affordability Index
6 EBS DKM Affordability Index
AVERAGE LTV RATIO FOR FTBS CURRENTLY AROUND 80 PER CENT
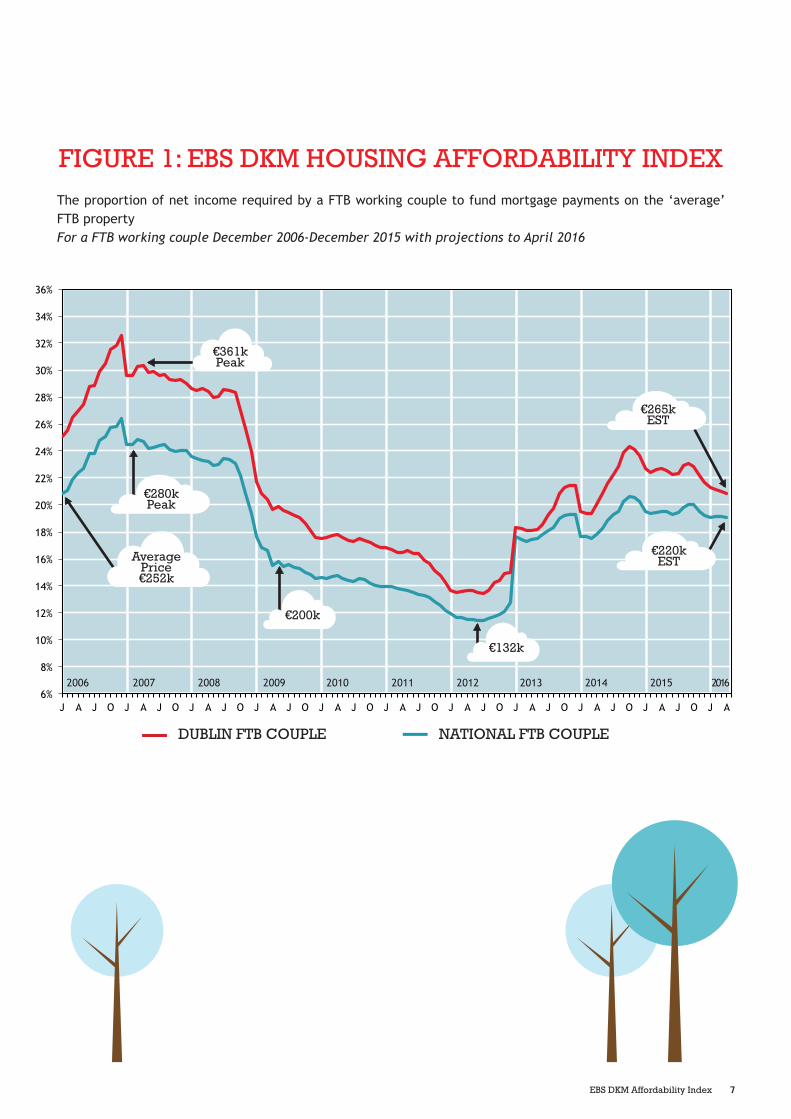
We return to the issue of the ability to raise a deposit later. Firstly trends in housing affordability for FTBs are examined. The Chart provides trends in the proportion of disposable income required to fund mortgage payments for FTBs over almost a decade. The influencing factors are mortgage rates, disposable incomes and property prices. However the Loan-to-Value (LTV) ratio is also important and was historically assumed at 90 per cent since commencement of the monthly Affordability Index in 2005. The experience of the property crash led to more rigorous lending behaviour by financial institutions, which resulted in the average LTV ratio being reduced to 83 per cent from January 2014. With the introduction of the Central Bank rules in February 2015, it is assumed that the significant pipeline of approvals, which fell outside of the new rules at the time, would have been
drawn down over the following six months. Thus the LTV ratio was reduced further from September 2015 towards 80 per cent from December 2015.
The trend in residential property prices is based on the CSO Residential Property Price Index which tracks prices for mortgage based transactions only. For a given house price, the impact of the lower LTV is to improve housing affordability, based on mortgage repayments as a percentage of disposable income. Hence the Chart below shows that affordability for FTB working couples across the country has improved since November 2015 and is currently around 19 per cent. A contributory factor has been the downward movement in mortgage rates since the second half of 2015, reflecting increased competition in the mortgage market.
7EBS DKM Affordability Index
FIGURE 1: EBS DKM HOUSING AFFORDABILITY INDEXThe proportion of net income required by a FTB working couple to fund mortgage payments on the ‘average’ FTB property For a FTB working couple December 2006-December 2015 with projections to April 2016
DUBLIN FTB COUPLE NATIONAL FTB COUPLE
6%
8%
10%
12%
14%
16%
18%
20%
22%
24%
26%
28%
30%
32%
34%
36%
J A J O J A J O J A J O J A J O J A J O J A J O J A J O J A J O J A J O J A J O J A
€361kPeak
€280kPeak
AveragePrice€252k
€200k
€132k
€265kEST
€220kEST
2006 2007 2008 2009 2010 2011 2012 2013 2014 2015 2016
8 EBS DKM Affordability Index
Dec07
Dec08
Dec09
Dec10
Dec11
Dec12
Dec13
Dec14
Dec15
Jan 16 (Estimate)
Apr 16 (Forecast)
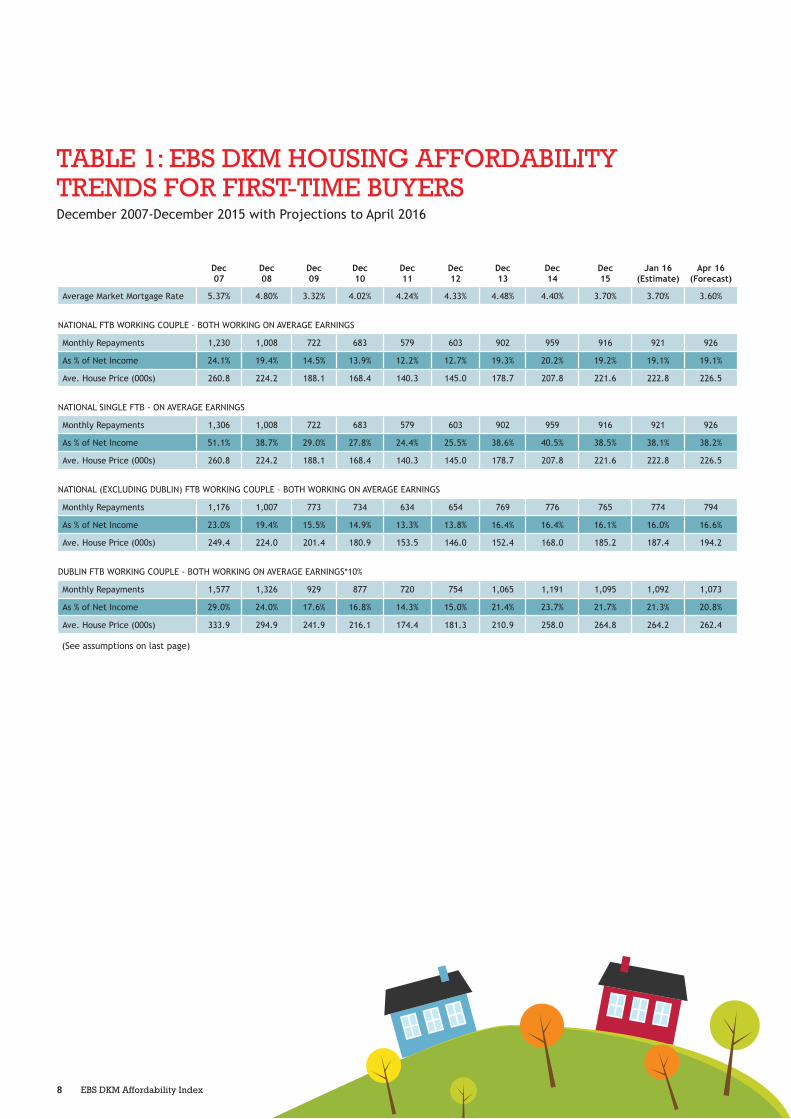
Average Market Mortgage Rate 5.37% 4.80% 3.32% 4.02% 4.24% 4.33% 4.48% 4.40% 3.70% 3.70% 3.60%
NATIONAL FTB WORKING COUPLE – BOTH WORKING ON AVERAGE EARNINGS
Monthly Repayments 1,230 1,008 722 683 579 603 902 959 916 921 926
As % of Net Income 24.1% 19.4% 14.5% 13.9% 12.2% 12.7% 19.3% 20.2% 19.2% 19.1% 19.1%
Ave. House Price (000s) 260.8 224.2 188.1 168.4 140.3 145.0 178.7 207.8 221.6 222.8 226.5
NATIONAL SINGLE FTB - ON AVERAGE EARNINGS
Monthly Repayments 1,306 1,008 722 683 579 603 902 959 916 921 926
As % of Net Income 51.1% 38.7% 29.0% 27.8% 24.4% 25.5% 38.6% 40.5% 38.5% 38.1% 38.2%
Ave. House Price (000s) 260.8 224.2 188.1 168.4 140.3 145.0 178.7 207.8 221.6 222.8 226.5
NATIONAL (EXCLUDING DUBLIN) FTB WORKING COUPLE – BOTH WORKING ON AVERAGE EARNINGS
Monthly Repayments 1,176 1,007 773 734 634 654 769 776 765 774 794
As % of Net Income 23.0% 19.4% 15.5% 14.9% 13.3% 13.8% 16.4% 16.4% 16.1% 16.0% 16.6%
Ave. House Price (000s) 249.4 224.0 201.4 180.9 153.5 146.0 152.4 168.0 185.2 187.4 194.2
DUBLIN FTB WORKING COUPLE - BOTH WORKING ON AVERAGE EARNINGS*10%
Monthly Repayments 1,577 1,326 929 877 720 754 1,065 1,191 1,095 1,092 1,073
As % of Net Income 29.0% 24.0% 17.6% 16.8% 14.3% 15.0% 21.4% 23.7% 21.7% 21.3% 20.8%
Ave. House Price (000s) 333.9 294.9 241.9 216.1 174.4 181.3 210.9 258.0 264.8 264.2 262.4
TABLE 1: EBS DKM HOUSING AFFORDABILITY TRENDS FOR FIRST-TIME BUYERSDecember 2007-December 2015 with Projections to April 2016
(See assumptions on last page)
9EBS DKM Affordability Index
The recovery in house prices commenced in earnest in 2014, with prices up on average by 13 per cent, following a modest pick-up in 2013 (+2%). Average prices were increasing at in excess of 2 per cent per month between May and August 2014 and increased by 4.6 per cent in the last four months of the year. The prospect of tighter lending rules in 2015 led to a slowdown in the rate of house price inflation towards the end of 2014, while prices actually declined in the opening months of 2015 by 1.4 per cent in January and 0.4 per cent in February. Relatively modest price growth returned in the following months until November 2015 when prices fell again by 0.5 per cent. The most recent data shows average house prices increased by 0.5 per cent in the month of December, resulting in an overall average growth in house prices nationally of 10.6 per cent in 2015.
Over the past two years, housing was least affordable in the latter half of 2014. The combination of
relatively high mortgage rates historically, evidence of prime movers in the property market and the shortage of supply led to affordability for FTB working couples reaching close to 21 per cent of disposable income in November 2014. Affordability was relatively stable throughout 2015. By January 2016, the reduction in the assumed LTV ratio to 80 per cent from 83 per cent in September 2015 further improved affordability to 19.1 per cent of net income, as the Central Bank rules began to have an impact.
The average FTB property price was estimated at €222,782 in January implying an average mortgage of €178,225, assuming an 80 per cent LTV ratio. The corresponding average monthly mortgage payments was €921 which compares with the average monthly rent across the country in Q4 2015 of €979 (DAFT.ie).
AFFORDABILITY FOR FTBs – NATIONAL TRENDS: 19.1% OF NET INCOME
EBS DKM Affordability Index
10 EBS DKM Affordability Index
The position for Dublin FTBs is arrived at using trends in Dublin property prices, which recovered much more strongly initially than across the country as a whole. Dublin property prices began to recover in the second half of 2013 and increased by 8.4 per cent overall in 2013. The rate of increase escalated rapidly from April 2014 to October that year. However the launch of the Central Bank’s consultation paper on the proposed lending rules led to increased uncertainty in the market, resulting in a sharp slowdown in Dublin prices, which were almost unchanged in December 2014 compared with October. However average Dublin prices were up strongly overall in 2014 by 21 per cent.
What ensued in the Dublin property market during 2015 was striking as the strong upward trend evident until October 2014 quickly came to a halt the following month. Average property prices hardly moved over the following eight months and apart from a one-off jump in the month of August (+2.8%), prices ended the year in December almost unchanged from August 2015. Average prices actually fell in each of the last two months of 2015 by 1.3 and 0.5 per cent respectively. As a result average property prices increased by 10.2 per cent overall in 2015, around half the rate of increase in 2014. One has to ask the question whether the sharp escalation in house prices which ensued in 2014 would have continued during 2015 without the Central Bank rules, bearing in mind
the serious shortage of supply which continues to characterise the market.
The corresponding trend in housing affordability for Dublin FTB working couples led to properties in Dublin being least affordable in October 2014, when mortgage payments accounted for 24.3 per cent of net income, their highest level since December 2008. Housing affordability improved during 2015 and by December 2015 mortgage payments had fallen to 21.7 per cent of net income. This improvement is attributed to the stability in Dublin house prices during 2015 but also the reduction in mortgage rates as well as the lower LTV ratio of 80 per cent which is assumed from December 2015. It is estimated that a further improvement materialised in January 2016, with mortgage payments fell to 21.3 per cent of net income.
The average Dublin FTB property price was estimated at €264,223 in January implying an average mortgage of €211,379, assuming an 80 per cent LTV ratio. The corresponding average monthly mortgage payment was €1,092 which compares with the average monthly rent in Dublin in Q3 2015 of €1,277 (PRTB) or between €1,178 and €1,604, depending on the area (Daft.ie).
AFFORDABILITY FOR DUBLIN FTBs: 21.3% OF NET INCOME
11EBS DKM Affordability Index
The recovery in property prices outside of Dublin lagged the upturn in Dublin prices with the result that property price inflation outside of Dublin did not return in year-on-year terms until January 2014. The annual rate of inflation remained in single digits until December 2014, generating an overall average rate of house price inflation of 5.9 per cent in 2014. Apart from a decline in the month of January 2015 (-0.9%), the rate of growth in property prices outside of Dublin remained relatively stable throughout 2015, reaching a year-on-year rate of 10.2 per cent in December.
Average prices overall increased by 10.5 per cent in 2015, almost twice the corresponding rate in 2014.
Housing affordability for FTBs outside of Dublin remained very stable over the past three years at around 15-16 per cent of net income. The current estimate is 16 per cent of net income based on an average property price of €187,368 implying an average mortgage of €149,895, assuming an 80 per cent LTV ratio.
AFFORDABILITY FOR NON-DUBLIN FTBs: 16% OF NET INCOME
Affordability for single FTBs continues to be challenging, particular for those earning the average income. It has consistently been at unsustainable levels, even throughout the recession period. Having peaked at around one-half of disposable income in late 2006, it fell to around 35 per cent of net income during 2013/early 2014. Mirroring the trend in property prices during 2014, affordability pressures got worse for single FTBs, reaching around 41 per cent of net income at the end of 2014. By December 2015, lower mortgage rates, more stable house prices and the lower LTVs led to an improvement to 38.5 per cent of net income. However this level is just at the margin of what is considered to be a sustainable mortgage for a single person, equivalent to around 38 per cent of net income (30% of gross income).
Affordability for a single person on average earnings is currently estimated at 38.1 per cent of net income, based on the average FTB price of €222,782 and a corresponding mortgage of €178,225.
A further measure of the challenge for potential single FTBs is evident from the price to income ratio, which reached 9.3 times the average disposable income at the peak. The corresponding ratio during the recession fell to 4.6 but had increased back to 7.7 times by January 2016. Historical trends would suggest that this ratio should be around 4 to 5 in a properly functioning housing market.
AFFORDABILITY FOR SINGLE FTBs – NATIONAL TRENDS: 38.1% OF NET INCOME
12 EBS DKM Affordability Index12 EBS DKM Affordability Index
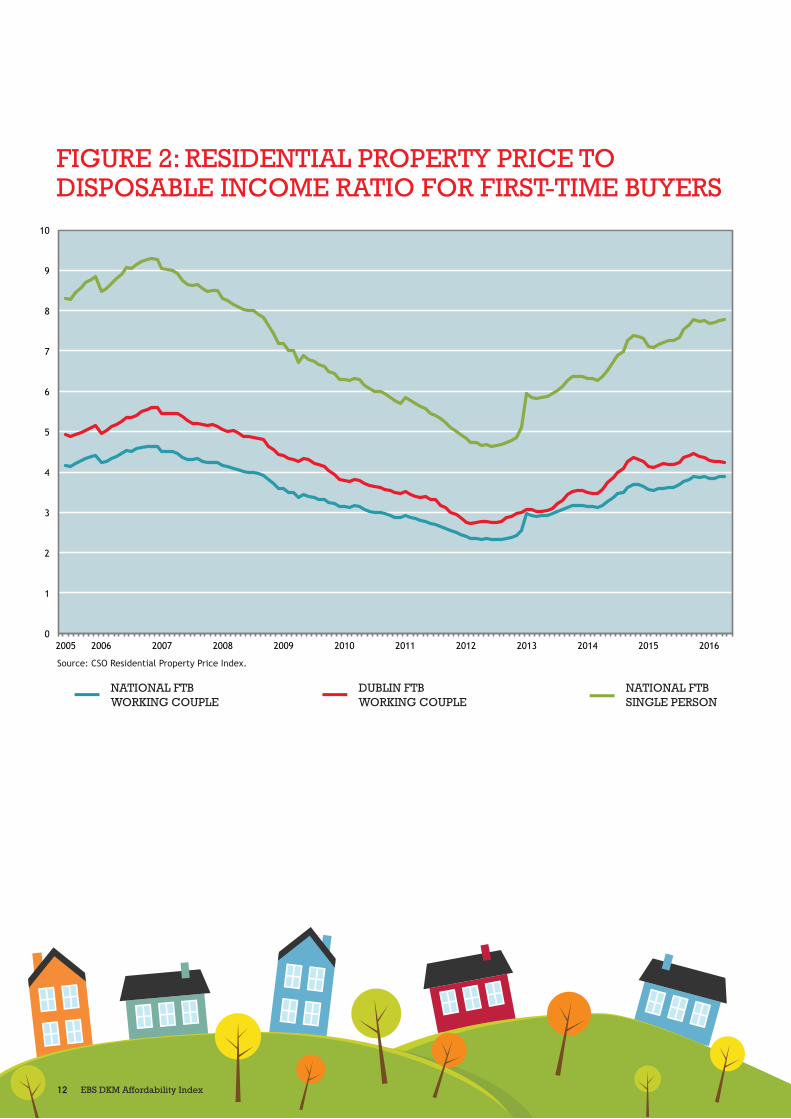
FIGURE 2: RESIDENTIAL PROPERTY PRICE TO DISPOSABLE INCOME RATIO FOR FIRST-TIME BUYERS
0
1
2
3
4
5
6
7
8
9
10
2005 2006 2007 2008 2009 2010 2011 2012 2013 2014 2015 2016
NATIONAL FTB SINGLE PERSON
DUBLIN FTB WORKING COUPLE
NATIONAL FTB WORKING COUPLE
Source: CSO Residential Property Price Index.
13EBS DKM Affordability Index
-30%
-20%
-10%
0%
10%
20%
30%
2006 2007 2008 2009 2010 2011 2012 2013 2014 2015 2016
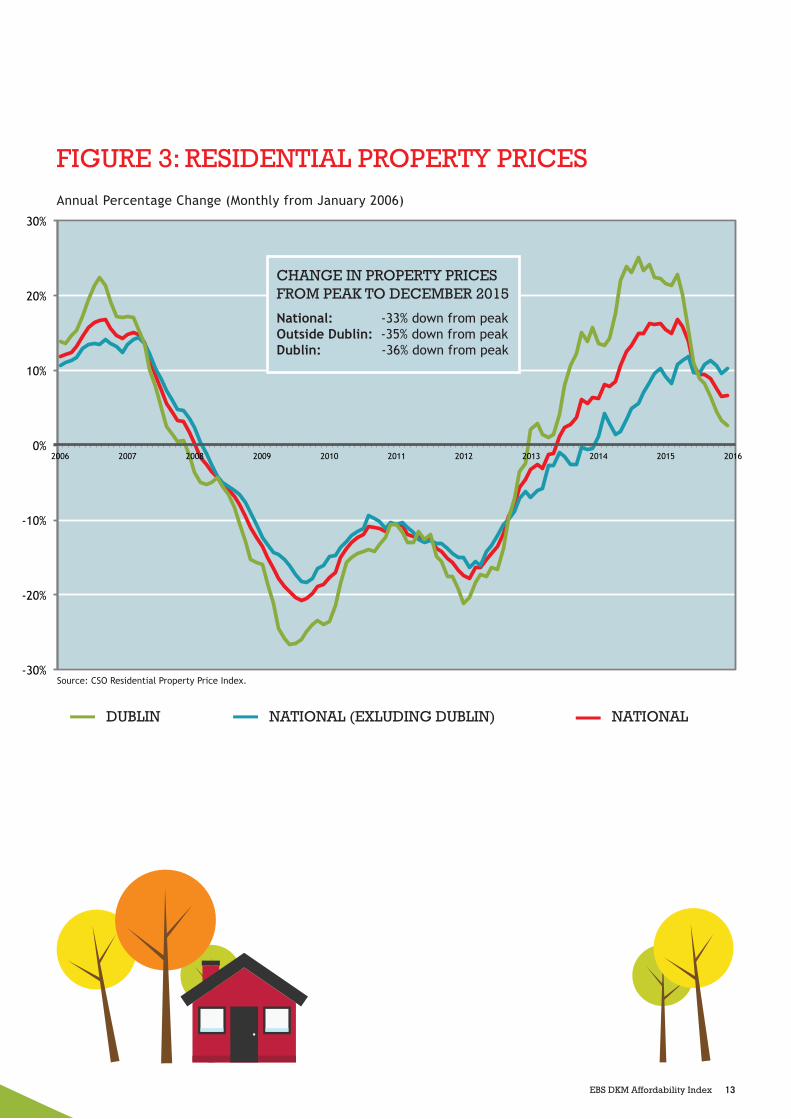
FIGURE 3: RESIDENTIAL PROPERTY PRICESAnnual Percentage Change (Monthly from January 2006)
CHANGE IN PROPERTY PRICES FROM PEAK TO DECEMBER 2015
National: -33% down from peak Outside Dublin: -35% down from peak Dublin: -36% down from peak
NATIONALNATIONAL (EXLUDING DUBLIN)DUBLIN
Source: CSO Residential Property Price Index.
14 EBS DKM Affordability Index
The current ECB interest rate, which provides the bulk of liquidity to the banking system, has been at 0.05 per cent since 10th October 2015. An analysis of FTB standard variable mortgage rates from the six main lending institutions generates an average mortgage rate currently of 3.7 per cent. More recently average mortgage rates have been on a downward trend while the recent entry of Pepper Australia to the Irish mortgage market may, in time, encourage other foreign institutions to enter the Irish market
and thus generate further reductions in the standard variable mortgage rate. For example, EBS and AIB have reduced their variable rates on three different occasions over the past 15 months for both new and existing customers, while at the same time introducing market-leading fixed rate mortgages across the Group. More competition can also result in more innovative product offerings from lending institutions which improve affordability for consumers.
MORTGAGE RATES: ON A DOWNWARD TREND OVER RECENT MONTHS, REACHING 3.7% IN JANUARY
CSO data relating to Earnings and Labour Costs shows that average weekly earnings across the economy increased by 2.7 per cent year-on-year in the third quarter of 2015 (latest data available) following an increase of 1.9 per cent in the second quarter. The overall rise in average earnings in the first nine months compared with the same period in the previous year was 1.9 per cent. The average weekly figure is equivalent to annual earnings of around €36,000 per worker. For the purposes of estimating affordability, the average FTB single person is assumed to be earning €36,000 while the working FTB couple is earning €72,000. This figure compares
with earnings of €70,000 which the national FTB working couple started out with in 2005. While earning increased in the early years, reaching almost €76,000 in 2007, the current income for our FTB working couple is 4.5 per cent below where it was at the peak. This has adversely impacted on FTBs ability to save for a deposit, particularly given that private sector rents have risen by 15 per cent in the past five years. Moreover the risk is that as employment and earnings recover over the next twelve months, property prices could begin to rise strongly again, unless the housing supply shortage is addressed.
INCOMES: AVERAGE WEEKLY EARNINGS UP 1.9% IN FIRST NINE MONTHS OF 2015
15EBS DKM Affordability Index
The Central Bank rules, introduced on 9th February 2015, provided for the following maximum mortgage:
✓ An amount equal to 90 per cent of the value of the principal home up to and including the amount of €220,000, and
✓ An amount equal to 80 per cent of the amount (if any) of the value of the principal home in excess of 220,000.
The total value of new lending for principal dwelling mortgages above these limits is no more than 15 per cent of the value of all mortgages drawn down in a year. Loan to Gross Income (LTI) limit of 3.5 times were also put in place, with 20 per cent of new lending to be allowed above this cap.
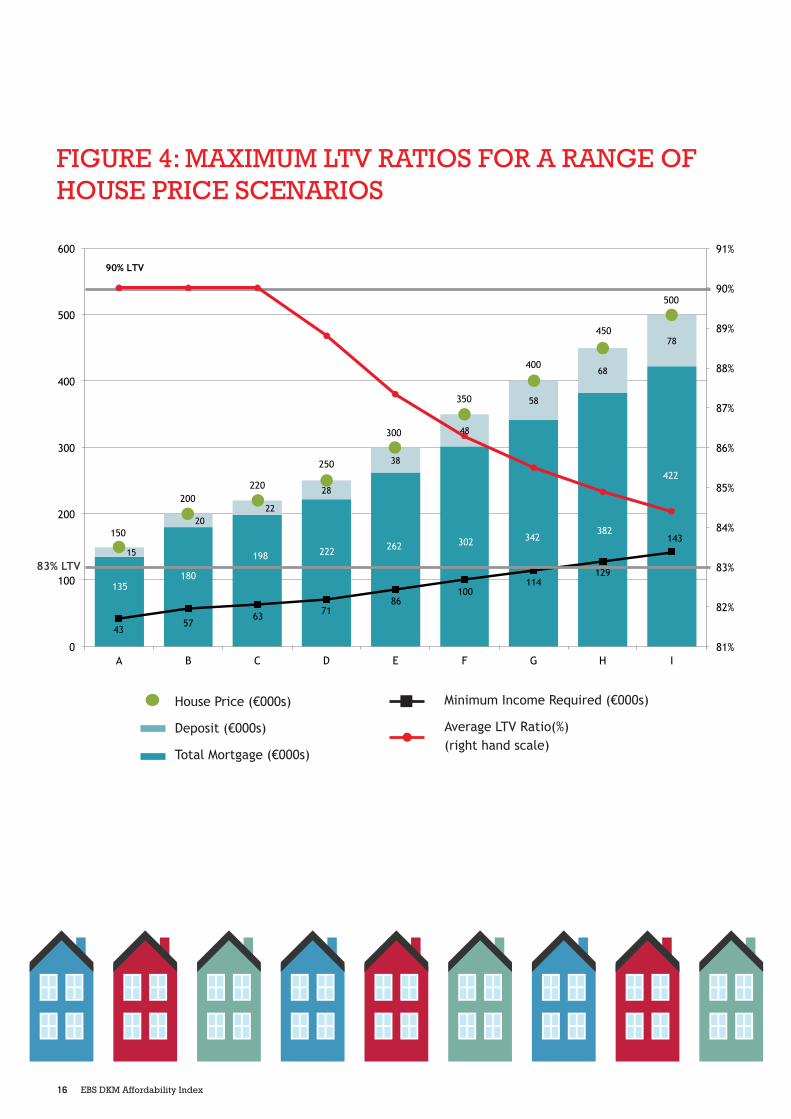
In an analysis of the consequences for mortgage borrowing, the May 2015 issue of the EBS DKM Affordability Index examined the maximum deposits and LTV ratios for a range of house price scenarios
following introduction of the rules. The following Chart and Table shows the deposits required by FTBs based on a range of house price scenarios between €150,000 and €500,000 and the level of income that would be required to purchase those properties, based on the new loan to income limits. The deposit required across the nine cases (A to I) ranges from €15,000 or 10 per cent of the house price to €78,000 or 15.6 per cent of the house price. Based on average FTB house price of around €250,000, a potential borrower would have to raise a deposit of €28,000, while the minimum gross income required would be €71,000. For properties priced in excess of this amount, the deposit rises substantially, to €48,000, for example, for a property worth €350,000, while the minimum gross income required is €100,000. These deposit levels are very onerous for single FTBs and households with children, who are having to rent for longer in advance of making a house purchase. However, FTBs are never required to raise a full deposit of 20 per cent, as is often reported, as this level of deposit would only arise on a property well in excess of the FTB price range.
RECAP ON IMPLICATIONS OF THE CENTRAL BANK RULES
16 EBS DKM Affordability Index
FIGURE 4: MAXIMUM LTV RATIOS FOR A RANGE OF HOUSE PRICE SCENARIOS
House Price (€000s)
Deposit (€000s)
Total Mortgage (€000s)
Minimum Income Required (€000s)
Average LTV Ratio(%) (right hand scale)
135 180
198 222 262 302 342 382
422
15
20 22
28
38
48
58
68
78
150
200 220
250
300
350
400
450
500
43 57
63 71 86
100 114
129
143
81%
82%
83%
84%
85%
86%
87%
88%
89%
90%
91%
0
100
200
300
400
500
600
A B C D E F G H I
90% LTV
83% LTV
17EBS DKM Affordability Index
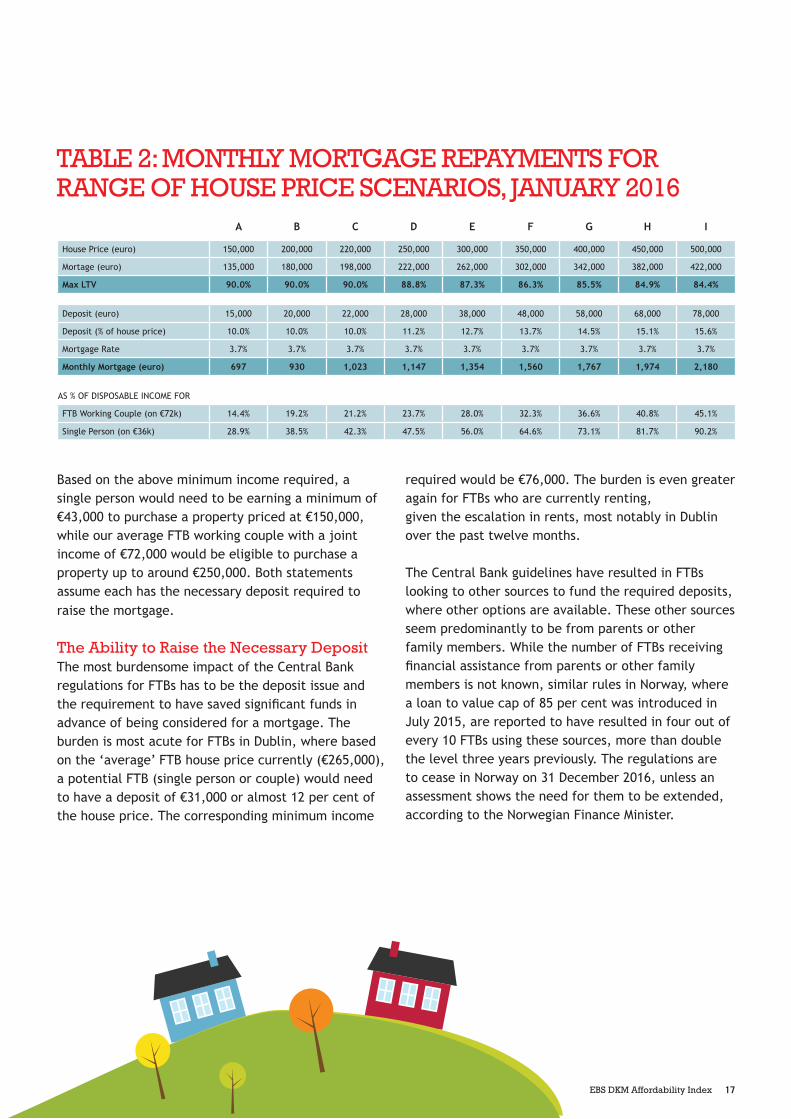
Based on the above minimum income required, a single person would need to be earning a minimum of €43,000 to purchase a property priced at €150,000, while our average FTB working couple with a joint income of €72,000 would be eligible to purchase a property up to around €250,000. Both statements assume each has the necessary deposit required to raise the mortgage.
The Ability to Raise the Necessary Deposit The most burdensome impact of the Central Bank regulations for FTBs has to be the deposit issue and the requirement to have saved significant funds in advance of being considered for a mortgage. The burden is most acute for FTBs in Dublin, where based on the ‘average’ FTB house price currently (€265,000), a potential FTB (single person or couple) would need to have a deposit of €31,000 or almost 12 per cent of the house price. The corresponding minimum income
required would be €76,000. The burden is even greater again for FTBs who are currently renting, given the escalation in rents, most notably in Dublin over the past twelve months.
The Central Bank guidelines have resulted in FTBs looking to other sources to fund the required deposits, where other options are available. These other sources seem predominantly to be from parents or other family members. While the number of FTBs receiving financial assistance from parents or other family members is not known, similar rules in Norway, where a loan to value cap of 85 per cent was introduced in July 2015, are reported to have resulted in four out of every 10 FTBs using these sources, more than double the level three years previously. The regulations are to cease in Norway on 31 December 2016, unless an assessment shows the need for them to be extended, according to the Norwegian Finance Minister.
TABLE 2: MONTHLY MORTGAGE REPAYMENTS FOR RANGE OF HOUSE PRICE SCENARIOS, JANUARY 2016
A B C D E F G H I
House Price (euro) 150,000 200,000 220,000 250,000 300,000 350,000 400,000 450,000 500,000
Mortage (euro) 135,000 180,000 198,000 222,000 262,000 302,000 342,000 382,000 422,000
Max LTV 90.0% 90.0% 90.0% 88.8% 87.3% 86.3% 85.5% 84.9% 84.4%
Deposit (euro) 15,000 20,000 22,000 28,000 38,000 48,000 58,000 68,000 78,000
Deposit (% of house price) 10.0% 10.0% 10.0% 11.2% 12.7% 13.7% 14.5% 15.1% 15.6%
Mortgage Rate 3.7% 3.7% 3.7% 3.7% 3.7% 3.7% 3.7% 3.7% 3.7%
Monthly Mortgage (euro) 697 930 1,023 1,147 1,354 1,560 1,767 1,974 2,180
AS % OF DISPOSABLE INCOME FOR
FTB Working Couple (on €72k) 14.4% 19.2% 21.2% 23.7% 28.0% 32.3% 36.6% 40.8% 45.1%
Single Person (on €36k) 28.9% 38.5% 42.3% 47.5% 56.0% 64.6% 73.1% 81.7% 90.2%
18 EBS DKM Affordability Index
The issue has received much attention over recent months with some of the consultations on the Central Bank rules suggesting that they have put home ownership out of the reach of FTBs, while others consulted have commented that the restrictions are necessary to avoid a return to the house price spirals of the boom years.
With housing one of the key issues in the forthcoming election, a number of parties are eager to win the votes of FTBs by proposing a range of help to buy initiatives. The Labour Party propose to give FTBs €6,000 towards mortgage deposits. Under the scheme, FTBs saving for a €36,000 deposit for a €290,000 home will be able to avail of the full €6,000 from the State. Fianna Fáil have proposed to establish a state top-up of 25 per cent for regular savers who are putting money aside for a deposit. Sinn Fein are non- committal in regard to any specific initiative, but propose to initiate a review of the socio-economic impact of the Central Banks’ mortgage rules, with a view to ensuring that the rules are working and not making home unaffordable. The Fine Gael focus is less
on incentives and more about making houses more affordable by addressing supply side issues.
Mortgage Lending In ascertaining the impact of the new lending rules to date, the trends in mortgage lending, from the Banking and Payments Federation of Ireland (BPFI), provide a useful indication of the success achieved in getting mortgage approval and ultimately drawing down a mortgage with a particular lending institution. A mortgage is defined as a “firm offer” to a customer of a credit facility secured on a specific residential property. A total of 26,028 mortgage approvals were granted for residential properties (excluding top-ups and re-mortgages) in 2015, up just 2.1 per cent on the 2014 total, which was almost 50 per cent up on the 2013 level. The corresponding value was €5 billion, up 6.4 per cent on the 2014 value, compared with an increase of 56 per cent in 2014. Thus the rate of growth in overall lending, measured in volume and value terms, slowed considerably in 2015 compared with 2014.
19EBS DKM Affordability Index
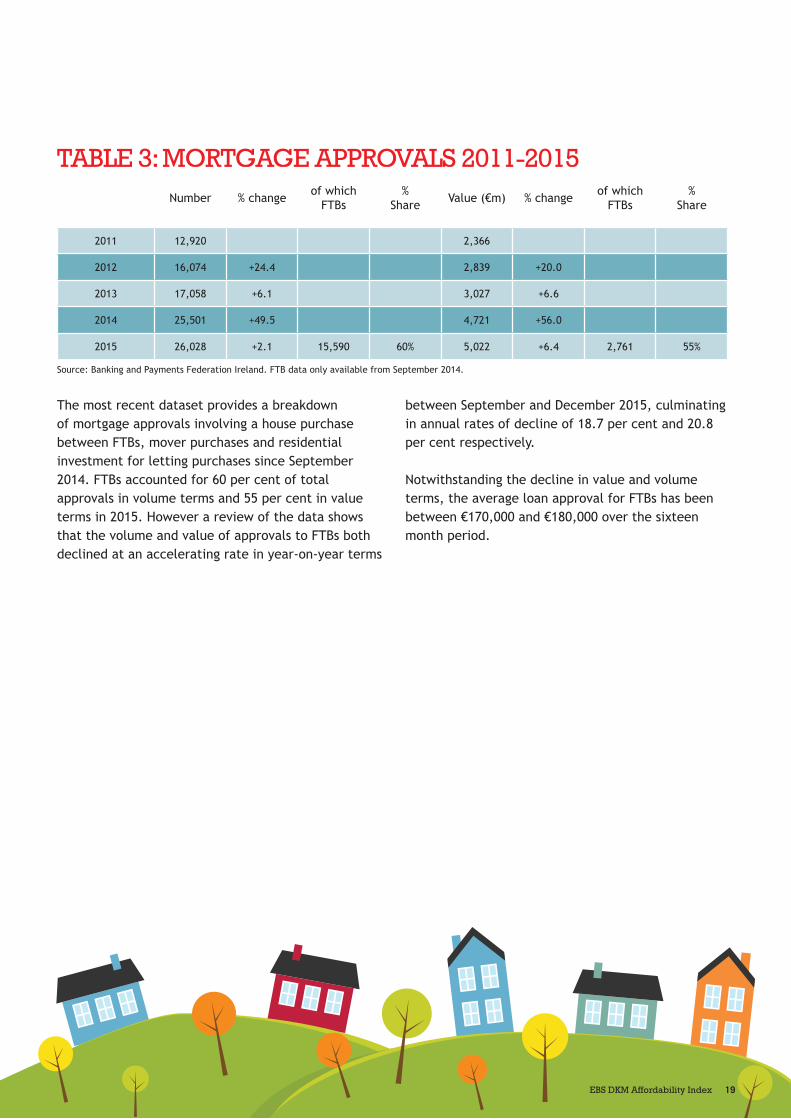
TABLE 3: MORTGAGE APPROVALS 2011-2015
The most recent dataset provides a breakdown of mortgage approvals involving a house purchase between FTBs, mover purchases and residential investment for letting purchases since September 2014. FTBs accounted for 60 per cent of total approvals in volume terms and 55 per cent in value terms in 2015. However a review of the data shows that the volume and value of approvals to FTBs both declined at an accelerating rate in year-on-year terms
between September and December 2015, culminating in annual rates of decline of 18.7 per cent and 20.8 per cent respectively.
Notwithstanding the decline in value and volume terms, the average loan approval for FTBs has been between €170,000 and €180,000 over the sixteen month period.
Source: Banking and Payments Federation Ireland. FTB data only available from September 2014.
Number % change of whichFTBs
%Share Value (€m) % change of which
FTBs%
Share
2011 12,920 2,366
2012 16,074 +24.4 2,839 +20.0
2013 17,058 +6.1 3,027 +6.6
2014 25,501 +49.5 4,721 +56.0
2015 26,028 +2.1 15,590 60% 5,022 +6.4 2,761 55%
20 EBS DKM Affordability Index
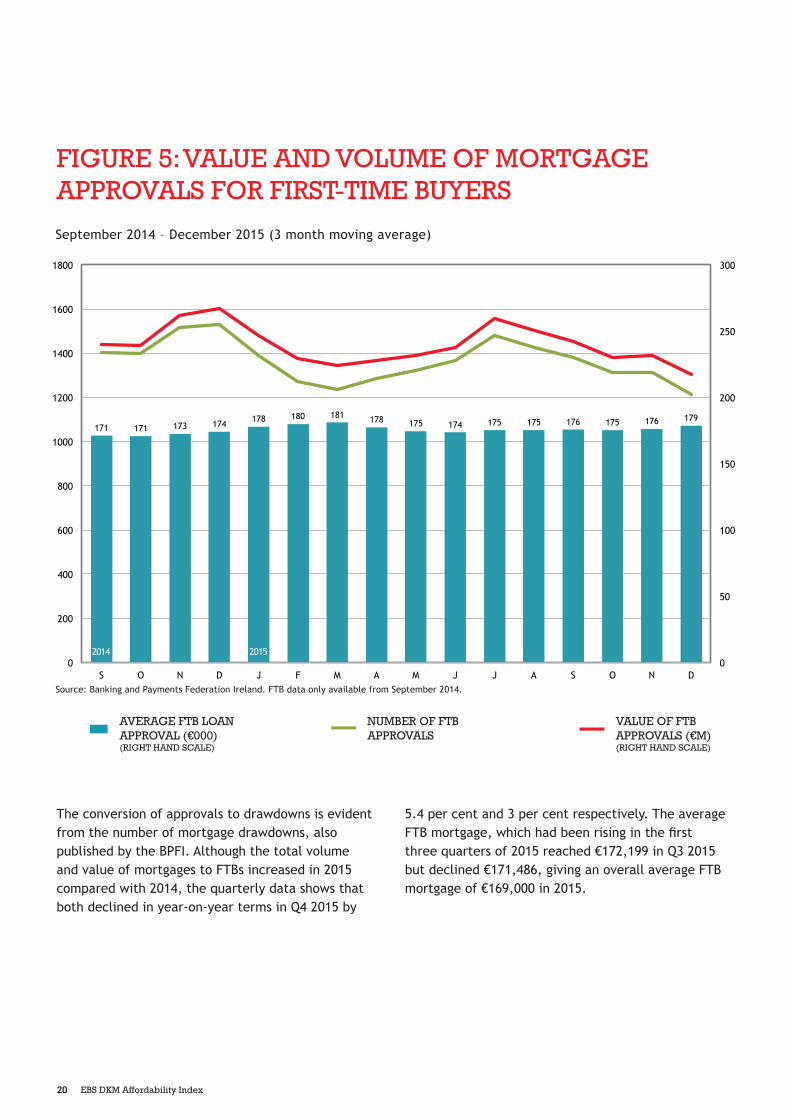
FIGURE 5: VALUE AND VOLUME OF MORTGAGE APPROVALS FOR FIRST-TIME BUYERS
September 2014 – December 2015 (3 month moving average)
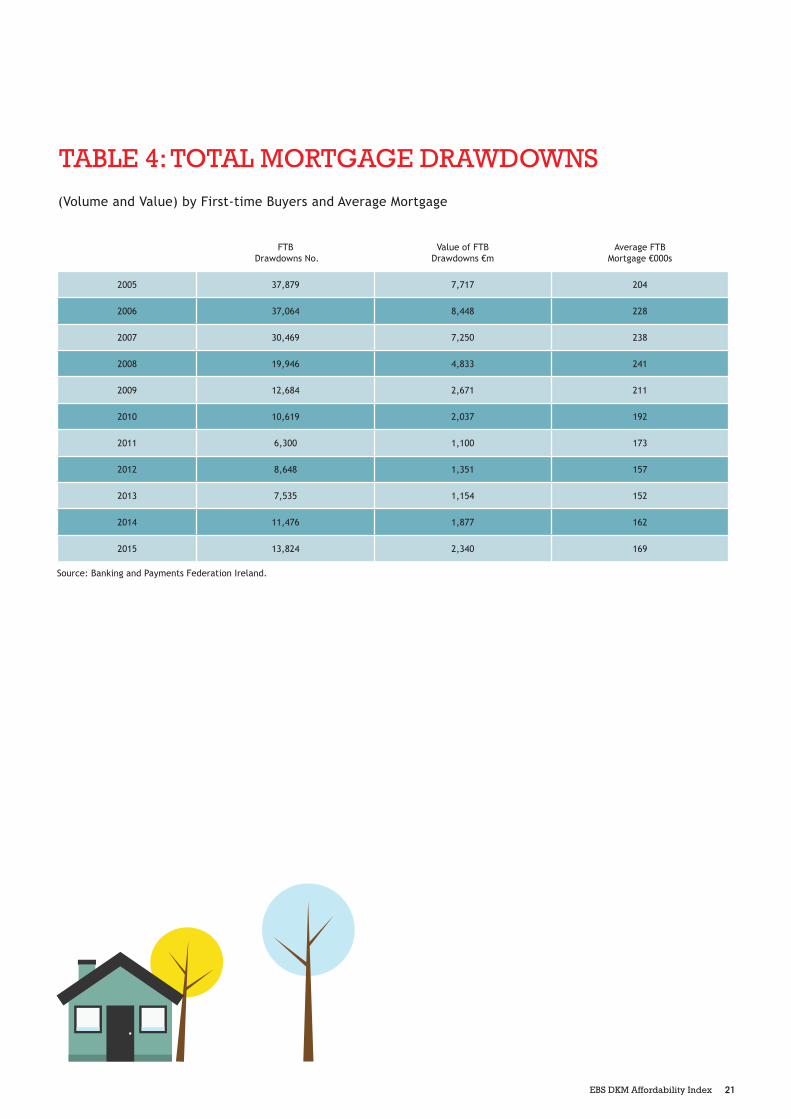
The conversion of approvals to drawdowns is evident from the number of mortgage drawdowns, also published by the BPFI. Although the total volume and value of mortgages to FTBs increased in 2015 compared with 2014, the quarterly data shows that both declined in year-on-year terms in Q4 2015 by
5.4 per cent and 3 per cent respectively. The average FTB mortgage, which had been rising in the first three quarters of 2015 reached €172,199 in Q3 2015 but declined €171,486, giving an overall average FTB mortgage of €169,000 in 2015.
Source: Banking and Payments Federation Ireland. FTB data only available from September 2014.
VALUE OF FTB APPROVALS (€M) (RIGHT HAND SCALE)
NUMBER OF FTB APPROVALS
AVERAGE FTB LOAN APPROVAL (€000) (RIGHT HAND SCALE)
171 171 173 174 178 180 181 178 175 174 175 175 176 175 176 179
0
50
100
150
200
250
300
0
200
400
600
800
1000
1200
1400
1600
1800
S O N D J F M A M J J A S O N D
2014 2015
21EBS DKM Affordability Index
TABLE 4: TOTAL MORTGAGE DRAWDOWNS
(Volume and Value) by First-time Buyers and Average Mortgage
Source: Banking and Payments Federation Ireland.
FTB Drawdowns No.
Value of FTB Drawdowns €m
Average FTB Mortgage €000s
2005 37,879 7,717 204
2006 37,064 8,448 228
2007 30,469 7,250 238
2008 19,946 4,833 241
2009 12,684 2,671 211
2010 10,619 2,037 192
2011 6,300 1,100 173
2012 8,648 1,351 157
2013 7,535 1,154 152
2014 11,476 1,877 162
2015 13,824 2,340 169
22 EBS DKM Affordability Index
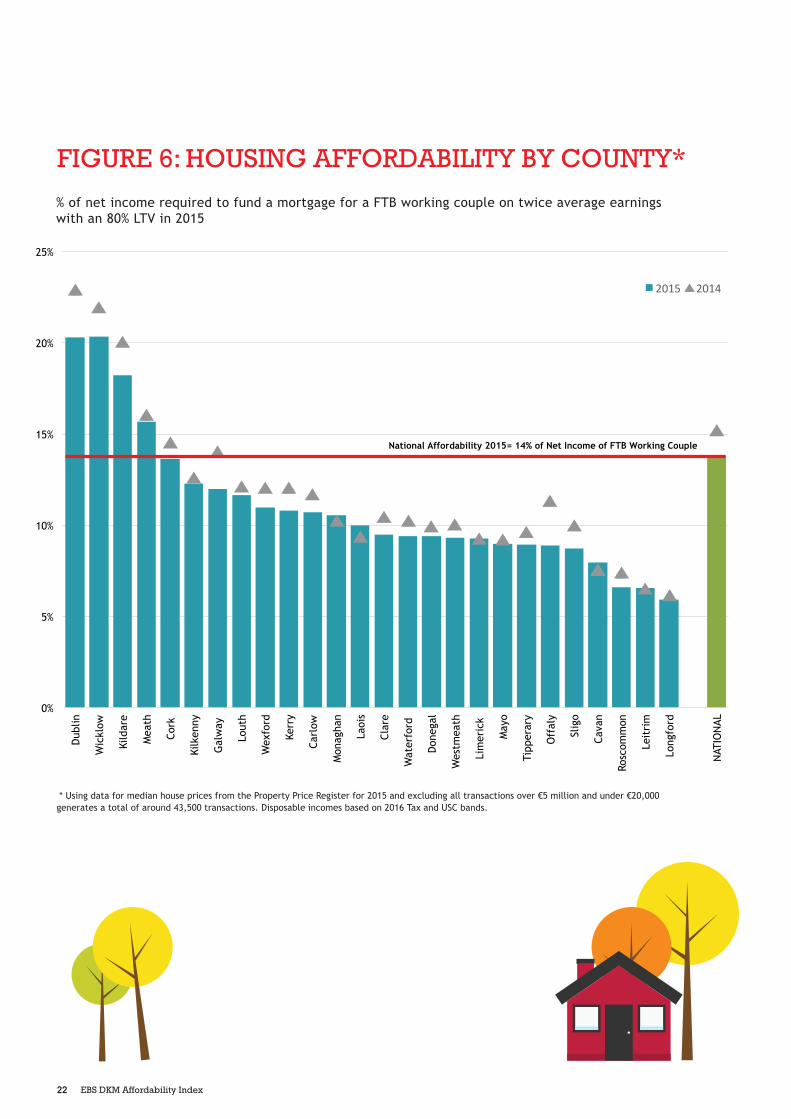
FIGURE 6: HOUSING AFFORDABILITY BY COUNTY*
% of net income required to fund a mortgage for a FTB working couple on twice average earnings with an 80% LTV in 2015
0%
5%
10%
15%
20%
25%
Dub
lin
Wic
klow
Kild
are
Mea
th
Cork
Kilk
enny
Gal
way
Lout
h
Wex
ford
Kerr
y
Carl
ow
Mon
agha
n
Laoi
s
Clar
e
Wat
erfo
rd
Don
egal
Wes
tmea
th
Lim
eric
k
May
o
Tipp
erar
y
Off
aly
Slig
o
Cava
n
Rosc
omm
on
Leit
rim
Long
ford
NAT
ION
AL
2015 2014
National Affordability 2015= 14% of Net Income of FTB Working Couple
* Using data for median house prices from the Property Price Register for 2015 and excluding all transactions over €5 million and under €20,000 generates a total of around 43,500 transactions. Disposable incomes based on 2016 Tax and USC bands.
23EBS DKM Affordability Index
% of net income required to fund a mortgage for a FTB working couple on twice average earnings with an 80% LTV in 2015
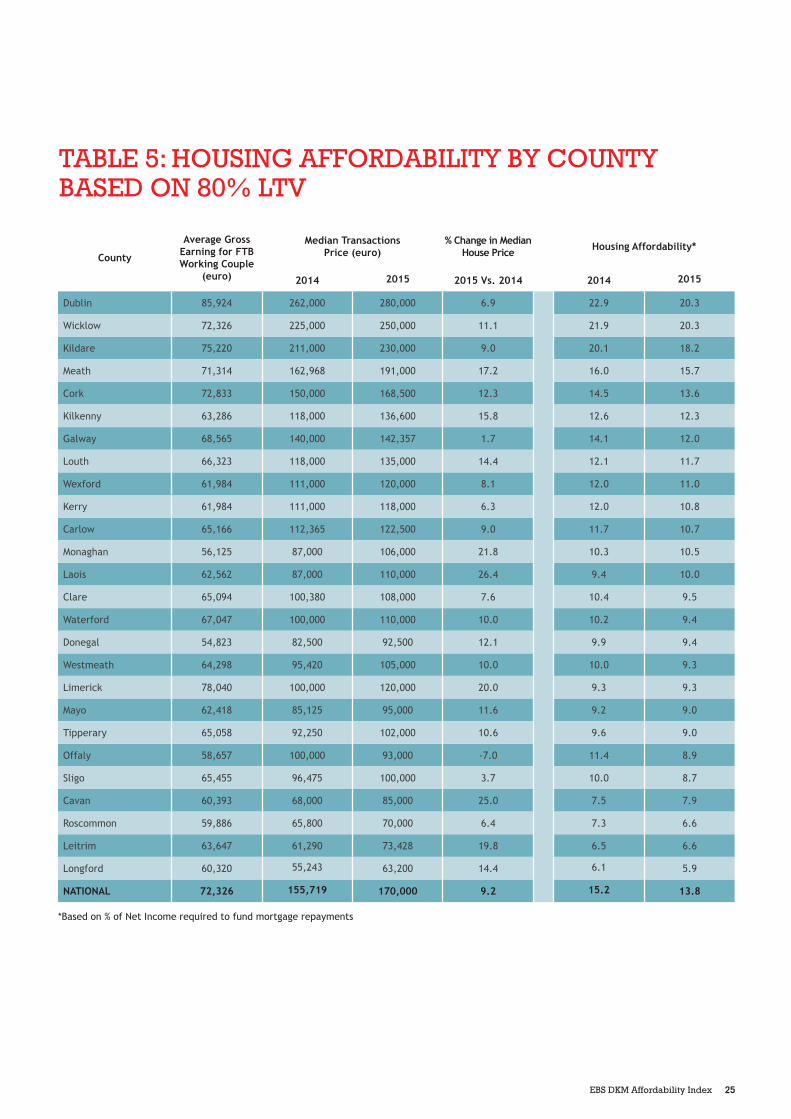
This issue presents an up to date analysis of housing affordability by county. The methodology employed uses the median transactions price from the Property Price Register (PPR) for a sample of 43,500 transactions in 2015 and an estimate for disposable income per working couple by county, to ascertain mortgage repayments as a percentage of net income for a FTB working couple. The corresponding figures for 2014 are shown for comparison, based on the analysis included in the May 2015 EBS DKM Housing Affordability Index. The main difference between both sets of data is the LTV ratios, which was assumed at 83 per cent in 2014 and 80 per cent in 2015.
The average annual earnings figure across the State, according to the CSO Earnings, Hours and Employment Costs Survey (EHECS), was €36,163 in the first nine months of 2015 or €72,236 for a FTB working couple, assuming each is on average earnings. Using the County Income data published by the CSO (2012 was the latest available at time of writing), the corresponding figure for each county is derived based on the published indices for Total Income per Person. The differential for each county relative to the State average is applied to ascertain the equivalent gross earnings for a working couple in each county. The 2012 relativities are assumed to remain unchanged up to 2015, although significant differentials are evident in the year between some counties and the national
average. In Dublin, for example, gross earnings are 18.8 per cent higher than the national average, with Limerick and Kildare ranking a distant second and third at 7.9 and 4 per cent higher respectively, compared with the national average. Conversely, average gross earnings in Donegal and Monaghan are 24.2 and 22.4 per cent respectively below the national average. Net disposable incomes are derived after deducting 2016 tax, Universal Social Charge and PRSI rates.
The median property price used is based on transactions in each county according to the PPR for 2015. Only properties for which the full market value is provided are included and VAT at 13.5% is added to those properties that are listed excluding VAT. Outliers covering properties priced above €5 million are excluded due to multiple properties being recorded in single transactions while, at the lower end, transactions below €20,000 are also excluded. It is stressed that this exercise is for illustration purposes only to provide an indication of the relative differences in housing affordability across the country. It is also noted that the volume of transactions can be substantially lower in some counties compared to others. In 2015 Dublin accounted for almost 32 per cent of the total transactions dataset used, while Cork and Galway ranked a distant second and third accounting for around 11 per cent and 6 per cent respectively.
24 EBS DKM Affordability Index
Key Trends in Affordability by County The results are set out in the following Table and Chart and show counties ranked from the least affordable to the most affordable. The estimates for housing affordability in 2015 are based on a LTV of 80 per cent and an average standard variable mortgage rate of 3.7 per cent. The comparative figures for 2014 are based on an LTV of 83 per cent and an average mortgage rate of 4.3 per cent. The main observations are as follows:
✓ Housing is more affordable in every county in 2015 compared with 2014, with the exception of Laois and Cavan, and is unchanged in Limerick.
✓ For the average FTB working couple earning €72,326 in 2015, it is estimated that their mortgage payment would be equivalent to 13.8 per cent of their joint disposable income. This figure is based on the median property price across the state of €170,000. It compares with the estimate derived above using the average property prices across the state of €222,782 which was associated with 19.1 per cent of net income.
✓ In Dublin, where gross incomes and median property prices from the PPR are 18.8 per cent and 65 per cent higher than the national average, affordability is at 20.3 per cent of net income for a FTB working couple.
✓ A comparison of the median prices derived (albeit not mix-adjusted) from the PPR in 2015 compared with 2014 shows that median property prices were up in all counties except Offaly, where prices declined by 7 per cent. Median prices rose by in excess of 20 per cent in Limerick, Monaghan, Cavan and Laois. Although prices were generally higher, mortgage rates and LTVs were lower, with the result that housing affordability improved in all counties,
except Laois and Cavan. It should be noted that this measure of affordability does not take the deposit requirement into account.
✓ Notwithstanding the general improvement in affordability, housing was least affordable for the average FTB working couple in Dublin and Wicklow (20.3% of net income), Kildare (18.2%) and Meath (15.7%). The Dublin figure of 20.3 per cent compares with an average affordability of 21.3 per cent in January 2016 using the EBS DKM Housing Affordability Model.
✓ Longford (5.9% of net income), Leitrim and Roscommon (6.6%) and Cavan (7.9%) were the most affordable counties in 2015.
✓ There remains a significant group of counties in the middle – 14 in total – where housing affordability is between 9 per cent and 12 per cent of net income, assuming an LTV of 80 per cent.
This assessment of affordability by county does not take into account the ability to raise the deposit. Although median prices are higher in every county in 2015 compared with 2014, apart from Offaly, the lower average mortgage rate and the reduction in the LTV to 80 per cent from 83 per cent have positively impacted on the proportion of net income required to fund monthly mortgage payments. However the deposit still has to be raised and in the context of the median prices in 2015, the deposit would be equivalent to 10 per cent of the median price in all counties except Dublin, Wicklow and Kildare where the deposit required would correspond to 12.1 per cent, 11.2 per cent and 10.4 per cent respectively.
25EBS DKM Affordability Index
TABLE 5: HOUSING AFFORDABILITY BY COUNTY BASED ON 80% LTV
County
Average Gross Earning for FTB Working Couple
(euro)
Median Transactions Price (euro)
% Change in Median House Price Housing Affordability*
2014 2015 2015 Vs. 2014 2014 2015
Dublin 85,924 262,000 280,000 6.9 22.9 20.3
Wicklow 72,326 225,000 250,000 11.1 21.9 20.3
Kildare 75,220 211,000 230,000 9.0 20.1 18.2
Meath 71,314 162,968 191,000 17.2 16.0 15.7
Cork 72,833 150,000 168,500 12.3 14.5 13.6
Kilkenny 63,286 118,000 136,600 15.8 12.6 12.3
Galway 68,565 140,000 142,357 1.7 14.1 12.0
Louth 66,323 118,000 135,000 14.4 12.1 11.7
Wexford 61,984 111,000 120,000 8.1 12.0 11.0
Kerry 61,984 111,000 118,000 6.3 12.0 10.8
Carlow 65,166 112,365 122,500 9.0 11.7 10.7
Monaghan 56,125 87,000 106,000 21.8 10.3 10.5
Laois 62,562 87,000 110,000 26.4 9.4 10.0
Clare 65,094 100,380 108,000 7.6 10.4 9.5
Waterford 67,047 100,000 110,000 10.0 10.2 9.4
Donegal 54,823 82,500 92,500 12.1 9.9 9.4
Westmeath 64,298 95,420 105,000 10.0 10.0 9.3
Limerick 78,040 100,000 120,000 20.0 9.3 9.3
Mayo 62,418 85,125 95,000 11.6 9.2 9.0
Tipperary 65,058 92,250 102,000 10.6 9.6 9.0
Offaly 58,657 100,000 93,000 -7.0 11.4 8.9
Sligo 65,455 96,475 100,000 3.7 10.0 8.7
Cavan 60,393 68,000 85,000 25.0 7.5 7.9
Roscommon 59,886 65,800 70,000 6.4 7.3 6.6
Leitrim 63,647 61,290 73,428 19.8 6.5 6.6
Longford 60,320 55,243 63,200 14.4 6.1 5.9
NATIONAL 72,326 155,719 170,000 9.2 15.2 13.8
*Based on % of Net Income required to fund mortgage repayments
26 EBS DKM Affordability Index
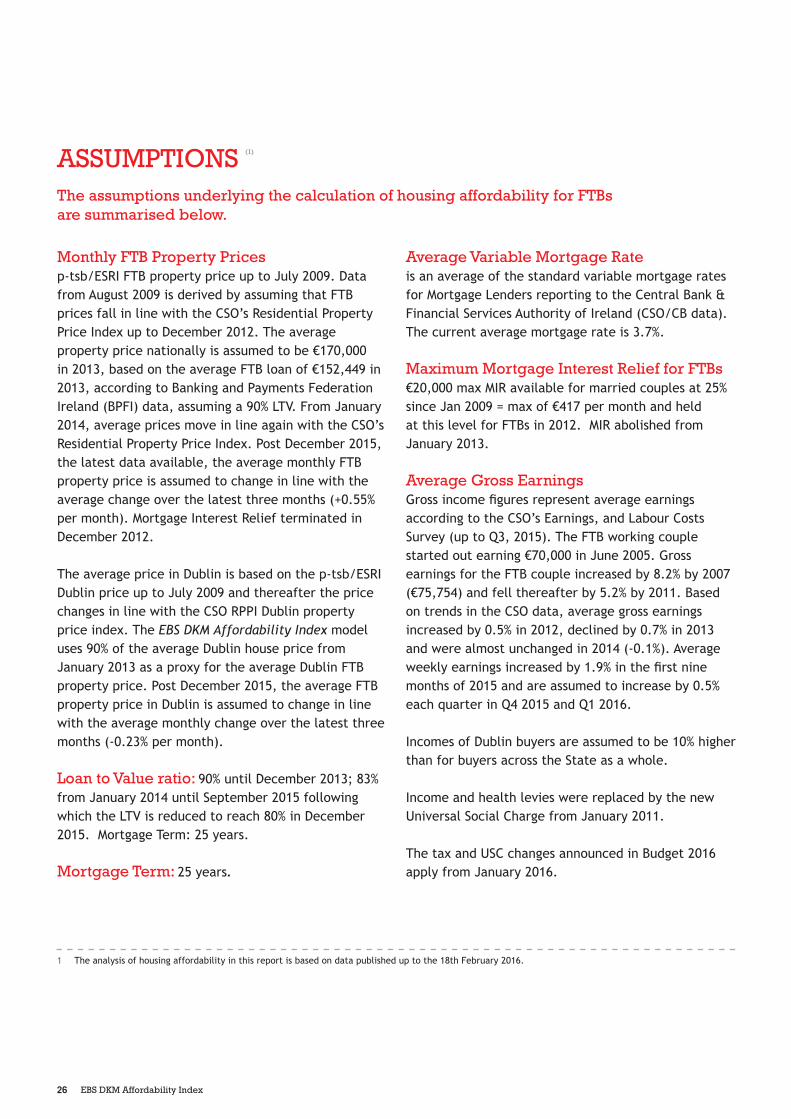
Monthly FTB Property Prices p-tsb/ESRI FTB property price up to July 2009. Data from August 2009 is derived by assuming that FTB prices fall in line with the CSO’s Residential Property Price Index up to December 2012. The average property price nationally is assumed to be €170,000 in 2013, based on the average FTB loan of €152,449 in 2013, according to Banking and Payments Federation Ireland (BPFI) data, assuming a 90% LTV. From January 2014, average prices move in line again with the CSO’s Residential Property Price Index. Post December 2015, the latest data available, the average monthly FTB property price is assumed to change in line with the average change over the latest three months (+0.55% per month). Mortgage Interest Relief terminated in December 2012.
The average price in Dublin is based on the p-tsb/ESRI Dublin price up to July 2009 and thereafter the price changes in line with the CSO RPPI Dublin property price index. The EBS DKM Affordability Index model uses 90% of the average Dublin house price from January 2013 as a proxy for the average Dublin FTB property price. Post December 2015, the average FTB property price in Dublin is assumed to change in line with the average monthly change over the latest three months (-0.23% per month).
Loan to Value ratio: 90% until December 2013; 83% from January 2014 until September 2015 following which the LTV is reduced to reach 80% in December 2015. Mortgage Term: 25 years.
Mortgage Term: 25 years.
Average Variable Mortgage Rate is an average of the standard variable mortgage rates for Mortgage Lenders reporting to the Central Bank & Financial Services Authority of Ireland (CSO/CB data). The current average mortgage rate is 3.7%.
Maximum Mortgage Interest Relief for FTBs €20,000 max MIR available for married couples at 25% since Jan 2009 = max of €417 per month and held at this level for FTBs in 2012. MIR abolished from January 2013.
Average Gross Earnings Gross income figures represent average earnings according to the CSO’s Earnings, and Labour Costs Survey (up to Q3, 2015). The FTB working couple started out earning €70,000 in June 2005. Gross earnings for the FTB couple increased by 8.2% by 2007 (€75,754) and fell thereafter by 5.2% by 2011. Based on trends in the CSO data, average gross earnings increased by 0.5% in 2012, declined by 0.7% in 2013 and were almost unchanged in 2014 (-0.1%). Average weekly earnings increased by 1.9% in the first nine months of 2015 and are assumed to increase by 0.5% each quarter in Q4 2015 and Q1 2016.
Incomes of Dublin buyers are assumed to be 10% higher than for buyers across the State as a whole.
Income and health levies were replaced by the new Universal Social Charge from January 2011.
The tax and USC changes announced in Budget 2016 apply from January 2016.
ASSUMPTIONS (1)
The assumptions underlying the calculation of housing affordability for FTBs are summarised below.
1 The analysis of housing affordability in this report is based on data published up to the 18th February 2016.


This publication is for information purposes only. Any expression of opinion is subject to change without notice. EBS and DKM accepts no liability whatsoever for the outcome of any actions taken arising from the use of information contained in this report. Figures quoted represent the latest available figures from each source at the time of going to press. EBS Limited is regulated by the Central Bank of Ireland.
EBS Limited, EBS Building 2 Burlington Road, Dublin 4, Ireland. Telephone: +353 1 665 9000 Email: [email protected]; Website: www.ebs.ie.
DKM Economic Consultants Ltd., 6 Grand Canal Wharf, South Dock Road, Ringsend, Dublin 4, Ireland Telephone: +353 1 667 0372 Email: [email protected]; Website: www.dkm.ie


![[GPM 028] - DKM Bismarck](https://img.pdfslide.net/doc/110x75/55cf9041550346703ba4586f/gpm-028-dkm-bismarck.jpg)