Embed Size (px)
Citation preview
State of Maine Office of Information Technology
EBS Reporting: APEX Enterprise Billing System APEX billing reports
Chadbourne, William 5/31/2016

2
Contents Specifications ................................................................................................................................................ 4
New Billing for Selected Fiscal Year .............................................................................................................. 5
New Billing – Count by Category ................................................................................................................... 7
Non-Personnel .............................................................................................................................................. 9
Personnel .................................................................................................................................................... 12
Applications................................................................................................................................................. 15
Reports ........................................................................................................................................................ 18
Pre-Billing ................................................................................................................................................ 19
Expiring................................................................................................................................................ 19
Category .............................................................................................................................................. 19
Billing ....................................................................................................................................................... 21
Billing Comparison .............................................................................................................................. 22
Billing Summary .................................................................................................................................. 24
Reporting Choices ............................................................................................................................... 26
Cumulative Report (non-personnel) ................................................................................................... 31
Cumulative Report (personnel) ........................................................................................................... 33
General Search .................................................................................................................................... 35
Analysis ................................................................................................................................................... 37
Billing Drill Down ................................................................................................................................. 37
Billing Cost Analysis – Customer Code ................................................................................................ 38
Billing Cost Analysis – Approp & Unit Codes ....................................................................................... 42
Finance Team .......................................................................................................................................... 46
Statewide Detail .................................................................................................................................. 46
Customer Codes .................................................................................................................................. 47
Billing Rates ......................................................................................................................................... 48
Customer Codes assigned to Users ..................................................................................................... 48
Phone Auth Codes/Pins ...................................................................................................................... 48
Locations ............................................................................................................................................. 49
Device Bundle Cost ............................................................................................................................. 49
Admin Reports ........................................................................................................................................ 50
............................................................................................................................................................ 50
Audit Report ........................................................................................................................................ 50
3
Feedback Report ................................................................................................................................. 51
Miscellaneous Reports ............................................................................................................................ 51
Missing Application IDs ....................................................................................................................... 51
TrackIT search by serial no. ................................................................................................................. 52
Trackit Search by Department ............................................................................................................ 52
4
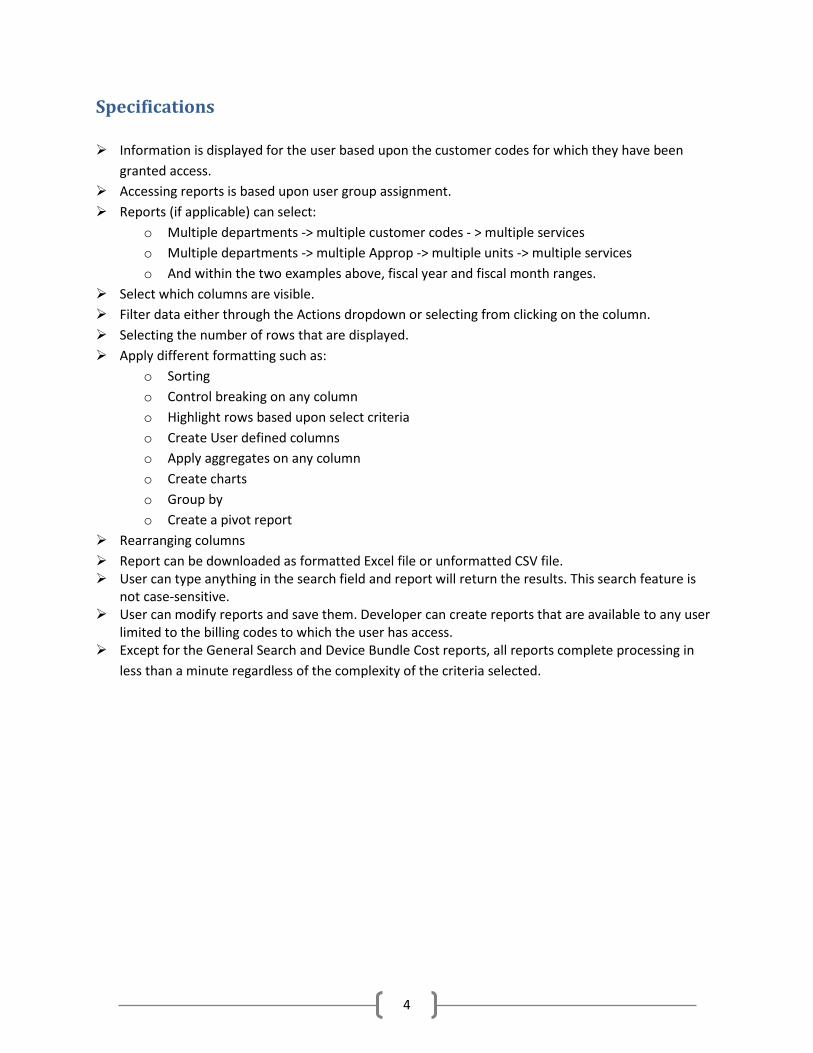
Specifications Information is displayed for the user based upon the customer codes for which they have been
granted access. Accessing reports is based upon user group assignment. Reports (if applicable) can select:
o Multiple departments -> multiple customer codes - > multiple services o Multiple departments -> multiple Approp -> multiple units -> multiple services o And within the two examples above, fiscal year and fiscal month ranges.
Select which columns are visible. Filter data either through the Actions dropdown or selecting from clicking on the column. Selecting the number of rows that are displayed. Apply different formatting such as:
o Sorting o Control breaking on any column o Highlight rows based upon select criteria o Create User defined columns o Apply aggregates on any column o Create charts o Group by o Create a pivot report
Rearranging columns Report can be downloaded as formatted Excel file or unformatted CSV file. User can type anything in the search field and report will return the results. This search feature is
not case-sensitive. User can modify reports and save them. Developer can create reports that are available to any user
limited to the billing codes to which the user has access. Except for the General Search and Device Bundle Cost reports, all reports complete processing in
less than a minute regardless of the complexity of the criteria selected.
5
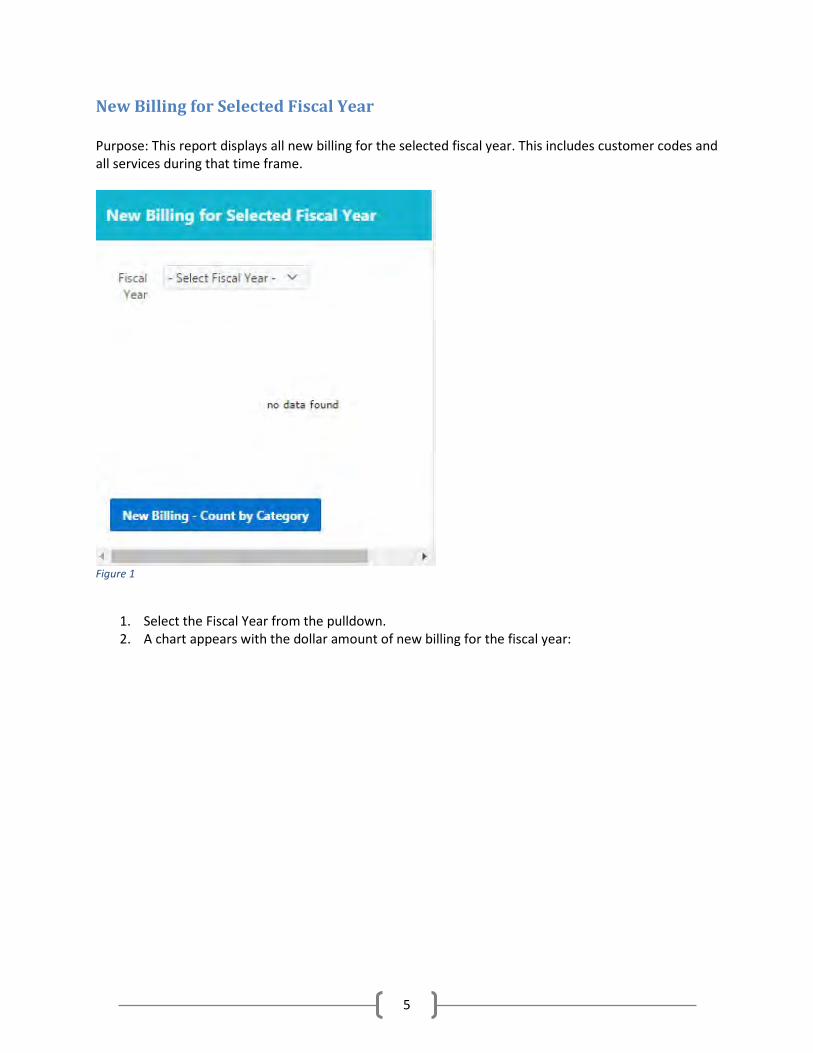
New Billing for Selected Fiscal Year Purpose: This report displays all new billing for the selected fiscal year. This includes customer codes and all services during that time frame.
Figure 1
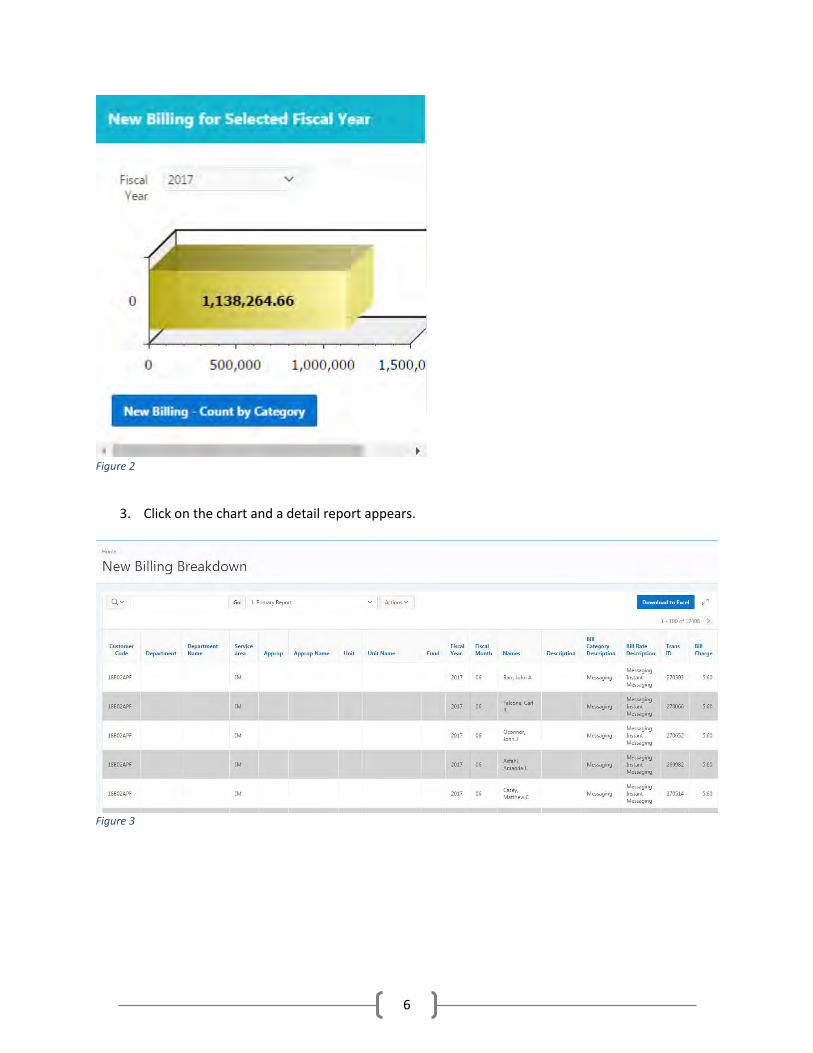
1. Select the Fiscal Year from the pulldown. 2. A chart appears with the dollar amount of new billing for the fiscal year:
6
Figure 2
3. Click on the chart and a detail report appears.
Figure 3
7
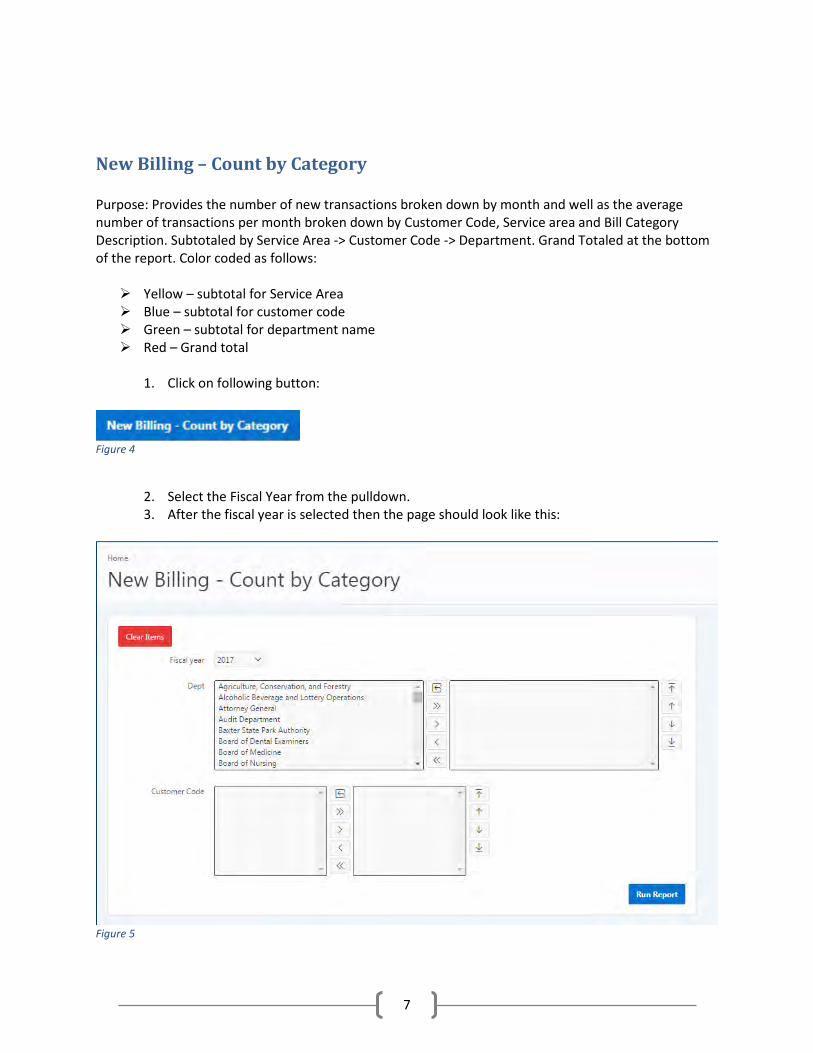
New Billing – Count by Category Purpose: Provides the number of new transactions broken down by month and well as the average number of transactions per month broken down by Customer Code, Service area and Bill Category Description. Subtotaled by Service Area -> Customer Code -> Department. Grand Totaled at the bottom of the report. Color coded as follows: Yellow – subtotal for Service Area Blue – subtotal for customer code Green – subtotal for department name Red – Grand total
1. Click on following button:
Figure 4
2. Select the Fiscal Year from the pulldown. 3. After the fiscal year is selected then the page should look like this:
Figure 5
8
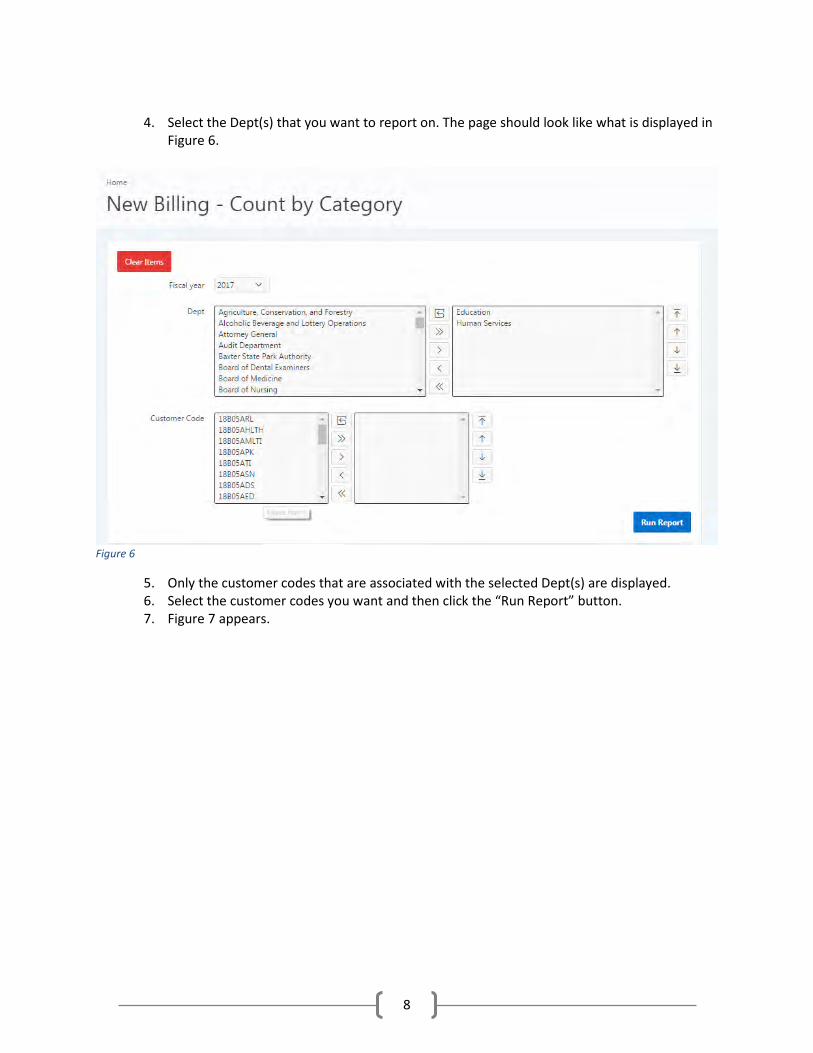
4. Select the Dept(s) that you want to report on. The page should look like what is displayed in
Figure 6.
Figure 6
5. Only the customer codes that are associated with the selected Dept(s) are displayed. 6. Select the customer codes you want and then click the “Run Report” button. 7. Figure 7 appears.
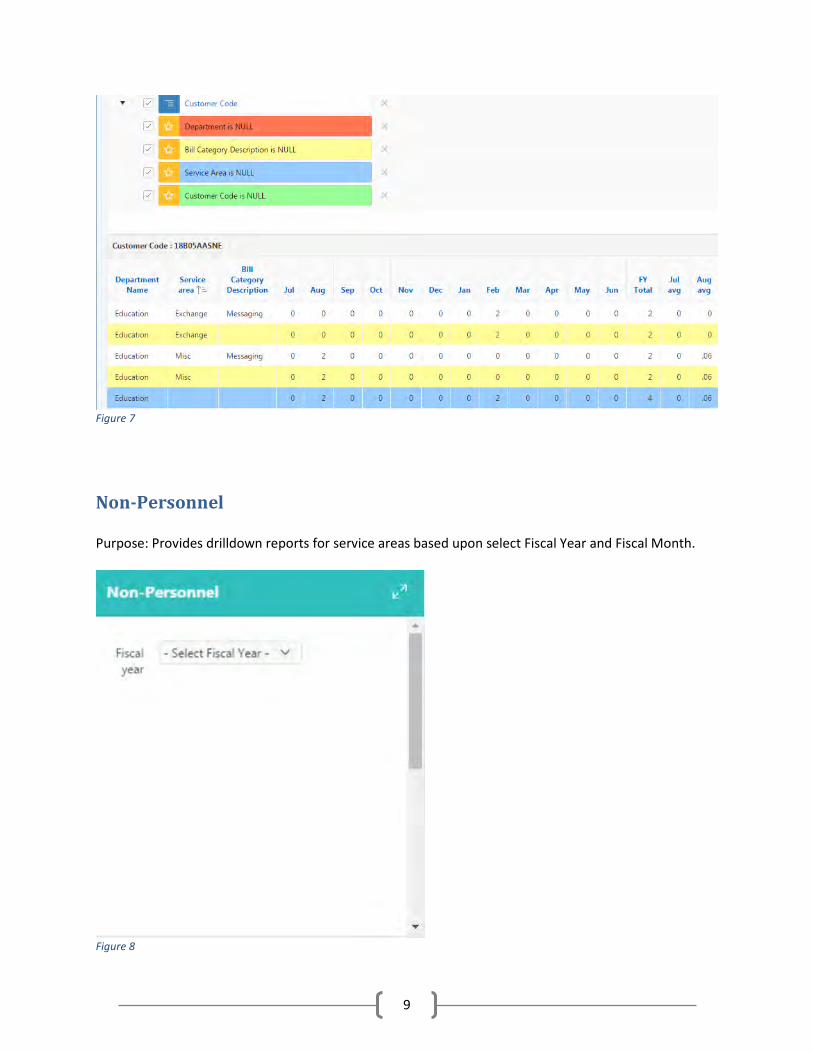
9
Figure 7
Non-Personnel Purpose: Provides drilldown reports for service areas based upon select Fiscal Year and Fiscal Month.
Figure 8
10
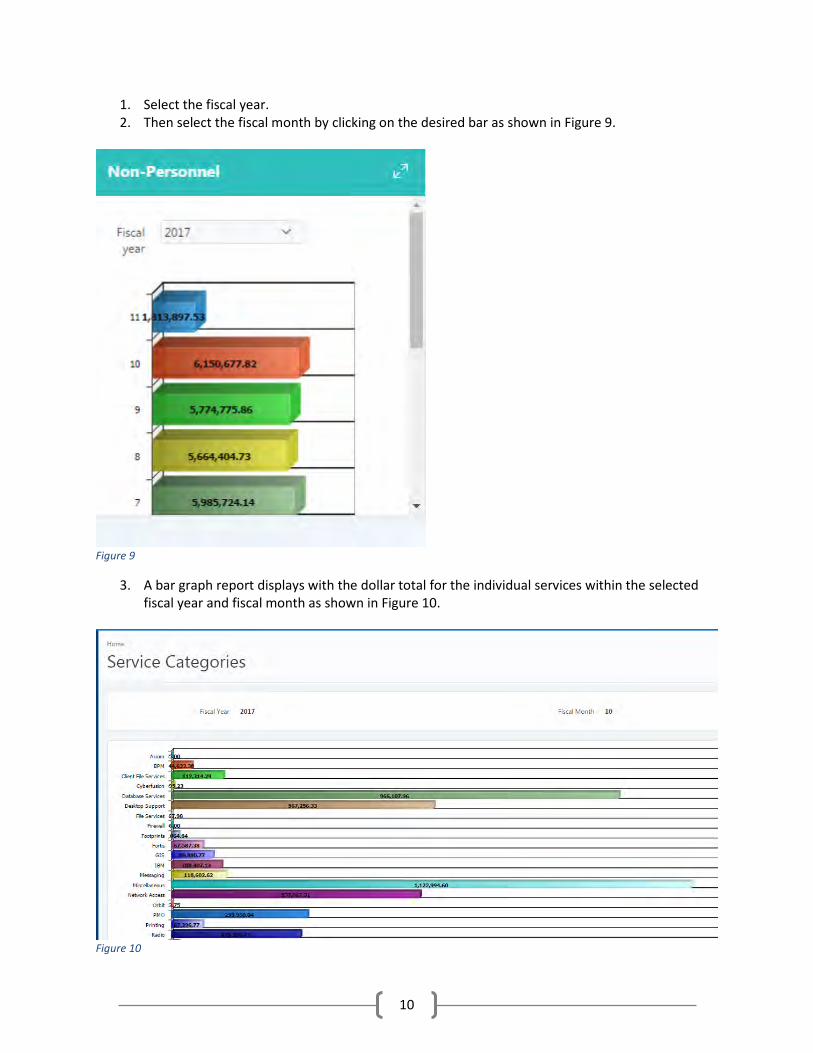
1. Select the fiscal year. 2. Then select the fiscal month by clicking on the desired bar as shown in Figure 9.
Figure 9
3. A bar graph report displays with the dollar total for the individual services within the selected fiscal year and fiscal month as shown in Figure 10.
Figure 10
11
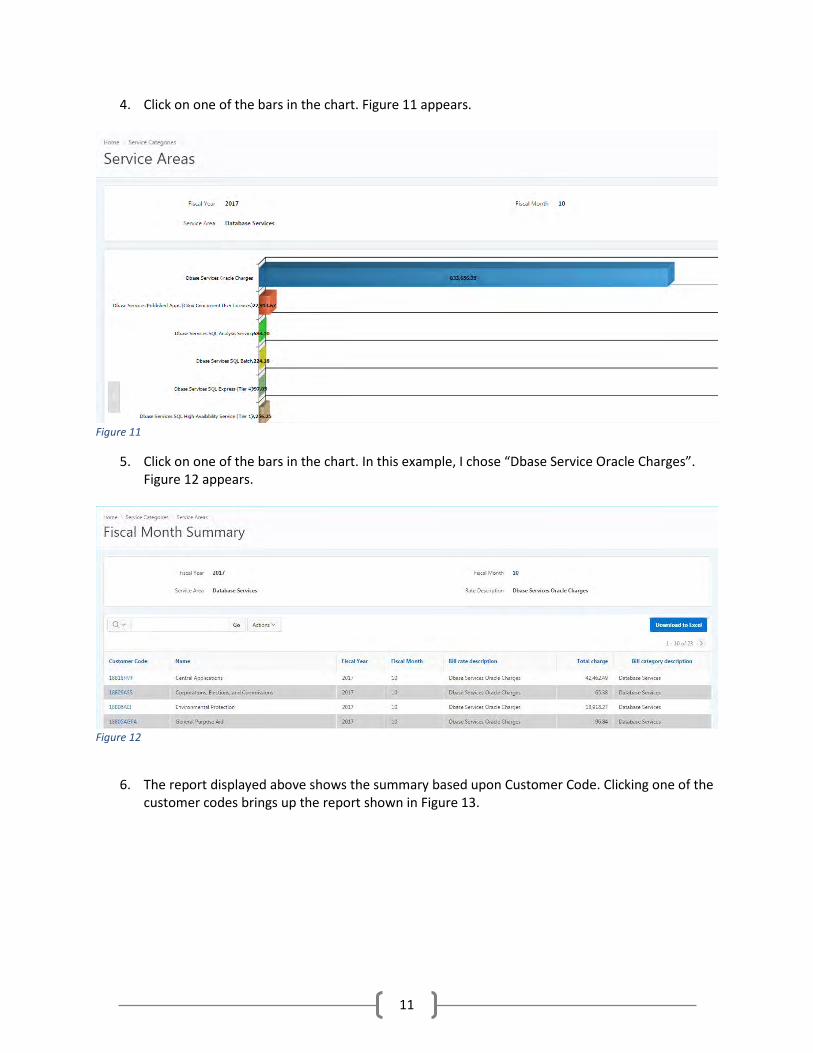
4. Click on one of the bars in the chart. Figure 11 appears.
Figure 11
5. Click on one of the bars in the chart. In this example, I chose “Dbase Service Oracle Charges”. Figure 12 appears.
Figure 12
6. The report displayed above shows the summary based upon Customer Code. Clicking one of the
customer codes brings up the report shown in Figure 13.
12
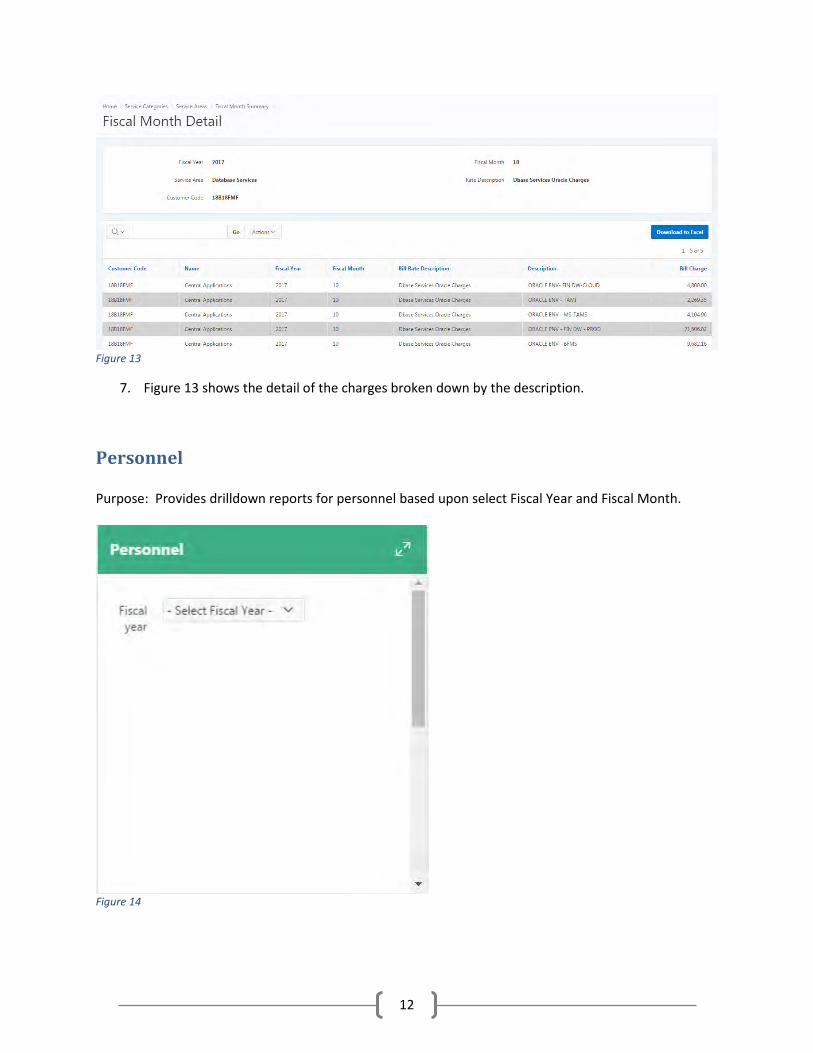
Figure 13
7. Figure 13 shows the detail of the charges broken down by the description.
Personnel Purpose: Provides drilldown reports for personnel based upon select Fiscal Year and Fiscal Month.
Figure 14
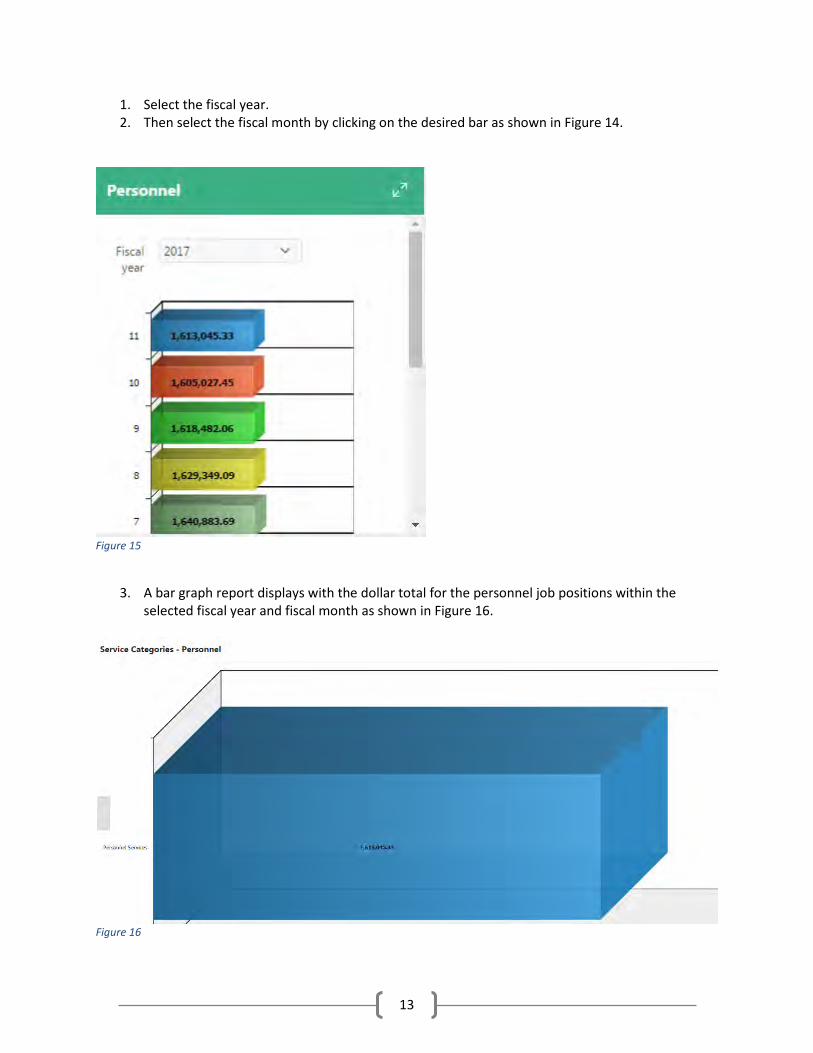
13
1. Select the fiscal year. 2. Then select the fiscal month by clicking on the desired bar as shown in Figure 14.
Figure 15
3. A bar graph report displays with the dollar total for the personnel job positions within the
selected fiscal year and fiscal month as shown in Figure 16.
Figure 16
14
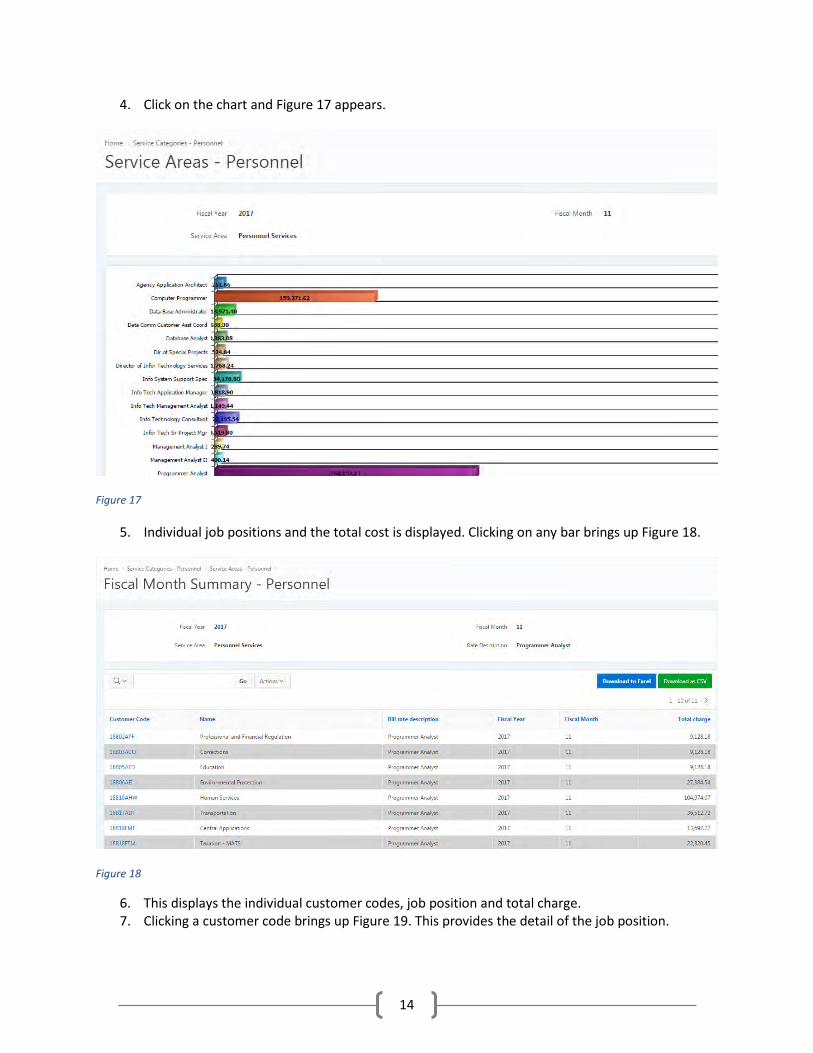
4. Click on the chart and Figure 17 appears.
Figure 17
5. Individual job positions and the total cost is displayed. Clicking on any bar brings up Figure 18.
Figure 18
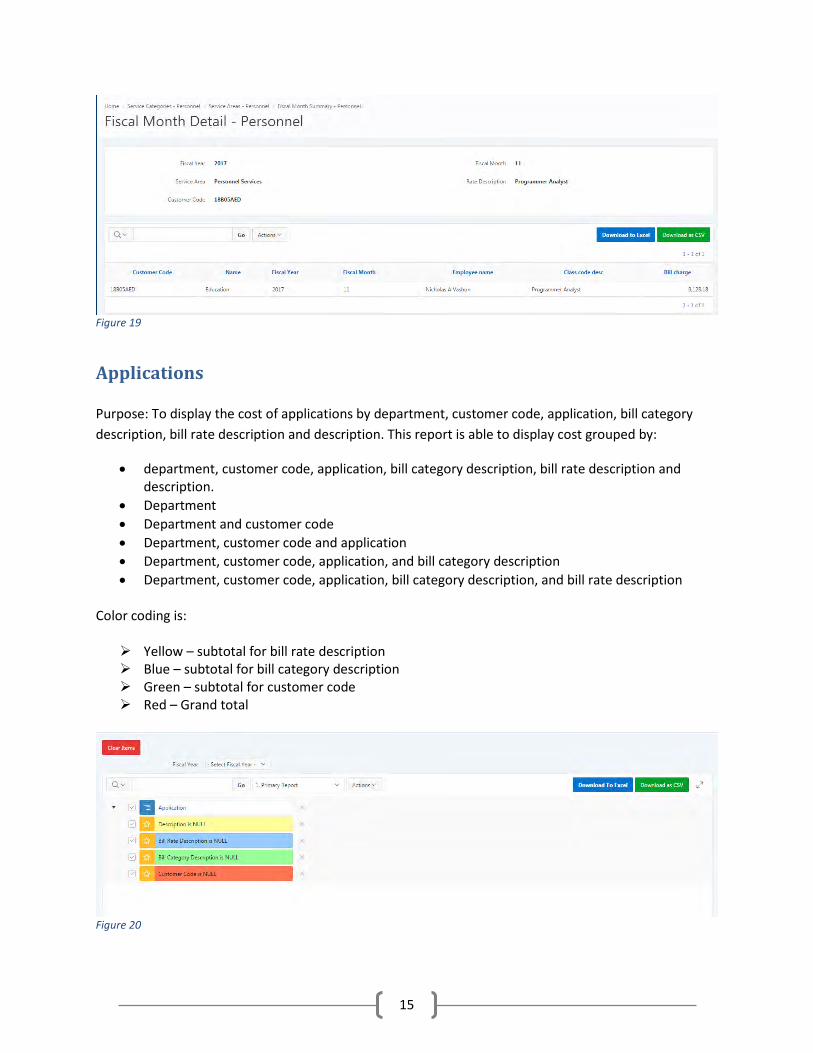
6. This displays the individual customer codes, job position and total charge. 7. Clicking a customer code brings up Figure 19. This provides the detail of the job position.
15
Figure 19
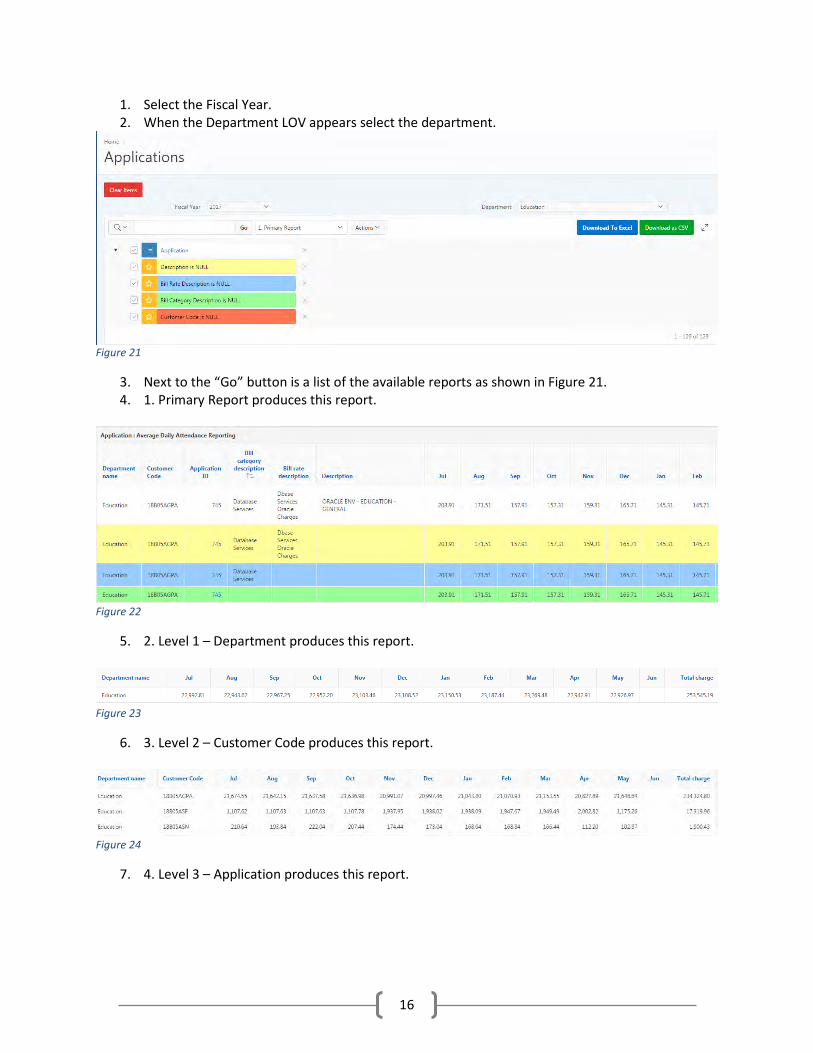
Applications Purpose: To display the cost of applications by department, customer code, application, bill category description, bill rate description and description. This report is able to display cost grouped by:
• department, customer code, application, bill category description, bill rate description and description.
• Department • Department and customer code • Department, customer code and application • Department, customer code, application, and bill category description • Department, customer code, application, bill category description, and bill rate description
Color coding is: Yellow – subtotal for bill rate description Blue – subtotal for bill category description Green – subtotal for customer code Red – Grand total
Figure 20
16
1. Select the Fiscal Year. 2. When the Department LOV appears select the department.
Figure 21
3. Next to the “Go” button is a list of the available reports as shown in Figure 21. 4. 1. Primary Report produces this report.
Figure 22
5. 2. Level 1 – Department produces this report.
Figure 23
6. 3. Level 2 – Customer Code produces this report.
Figure 24
7. 4. Level 3 – Application produces this report.
17
Figure 25
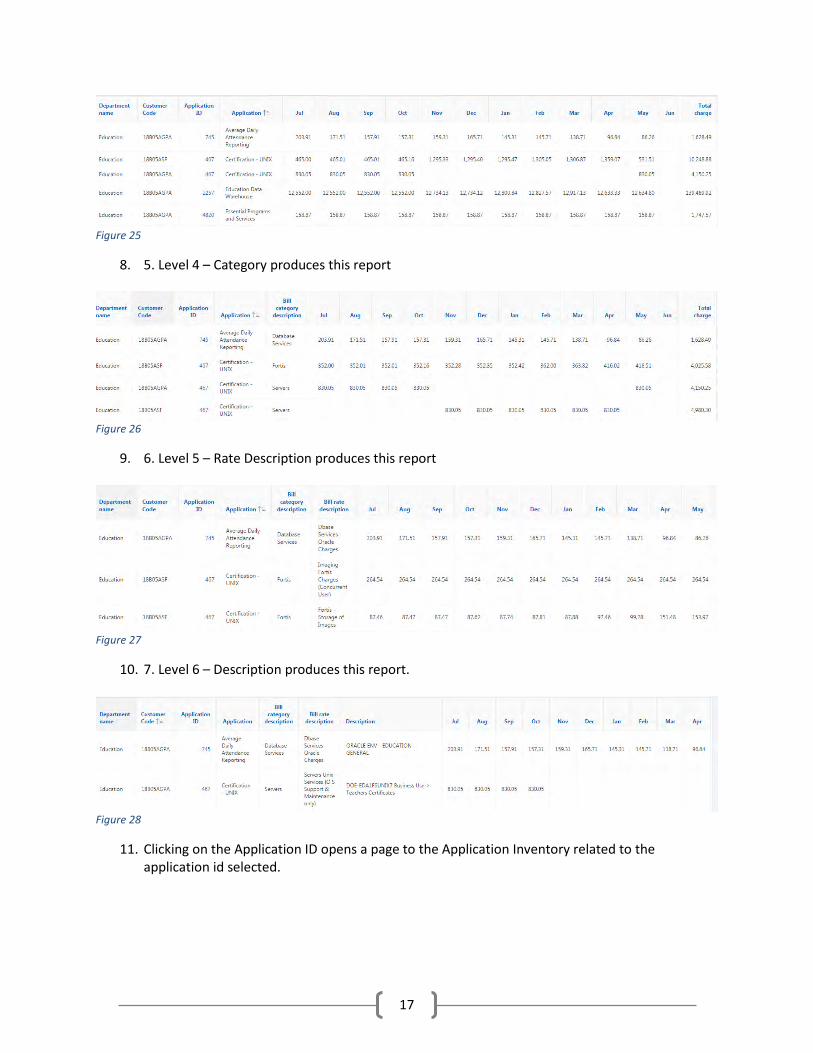
8. 5. Level 4 – Category produces this report
Figure 26
9. 6. Level 5 – Rate Description produces this report
Figure 27
10. 7. Level 6 – Description produces this report.
Figure 28
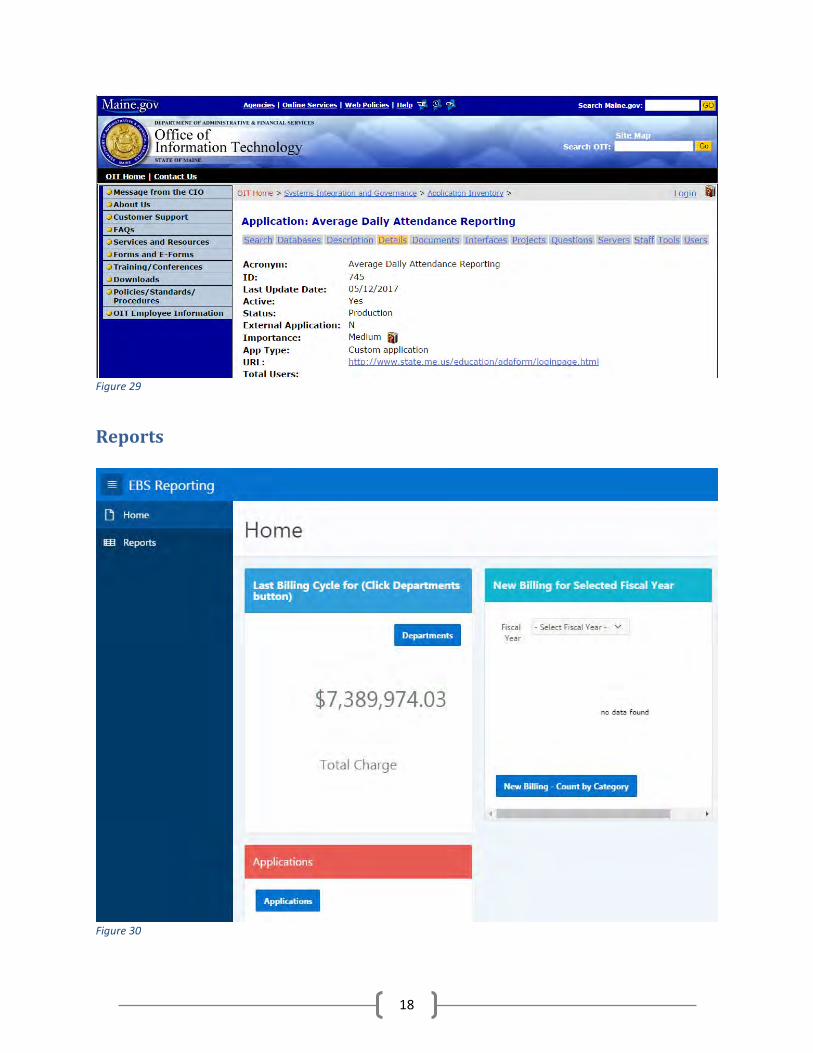
11. Clicking on the Application ID opens a page to the Application Inventory related to the application id selected.
18
Figure 29
Reports
Figure 30
19
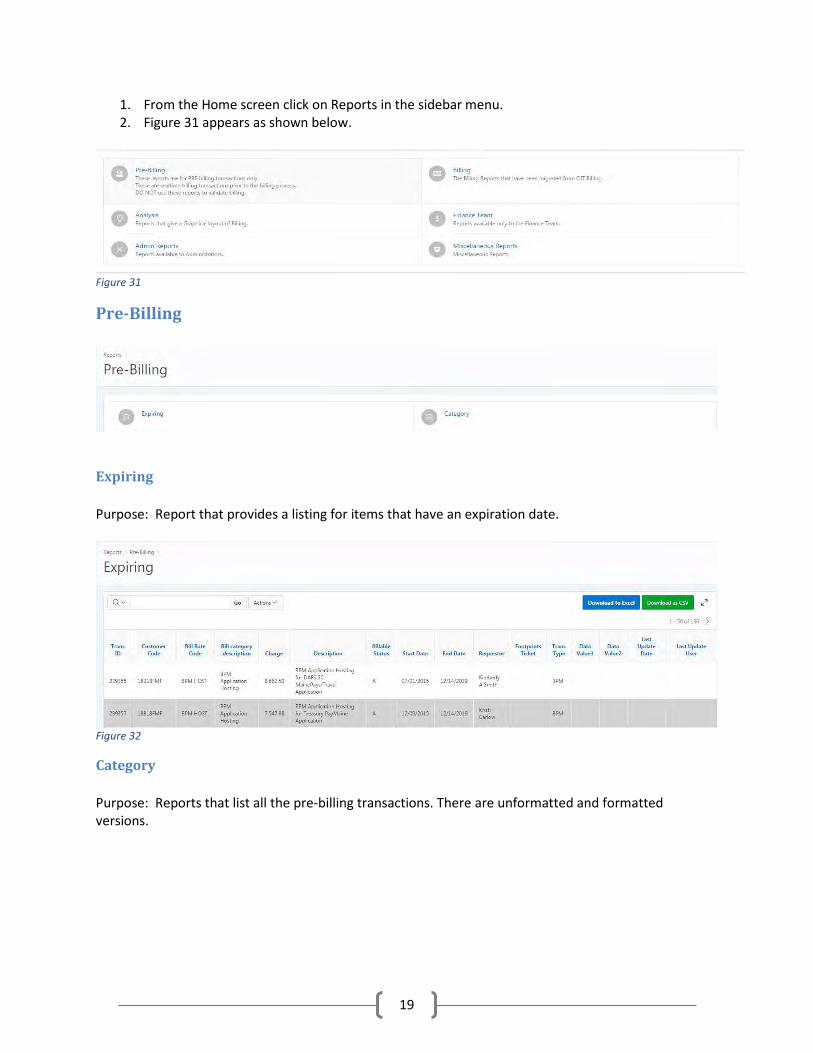
1. From the Home screen click on Reports in the sidebar menu. 2. Figure 31 appears as shown below.
Figure 31
Pre-Billing
Expiring Purpose: Report that provides a listing for items that have an expiration date.
Figure 32
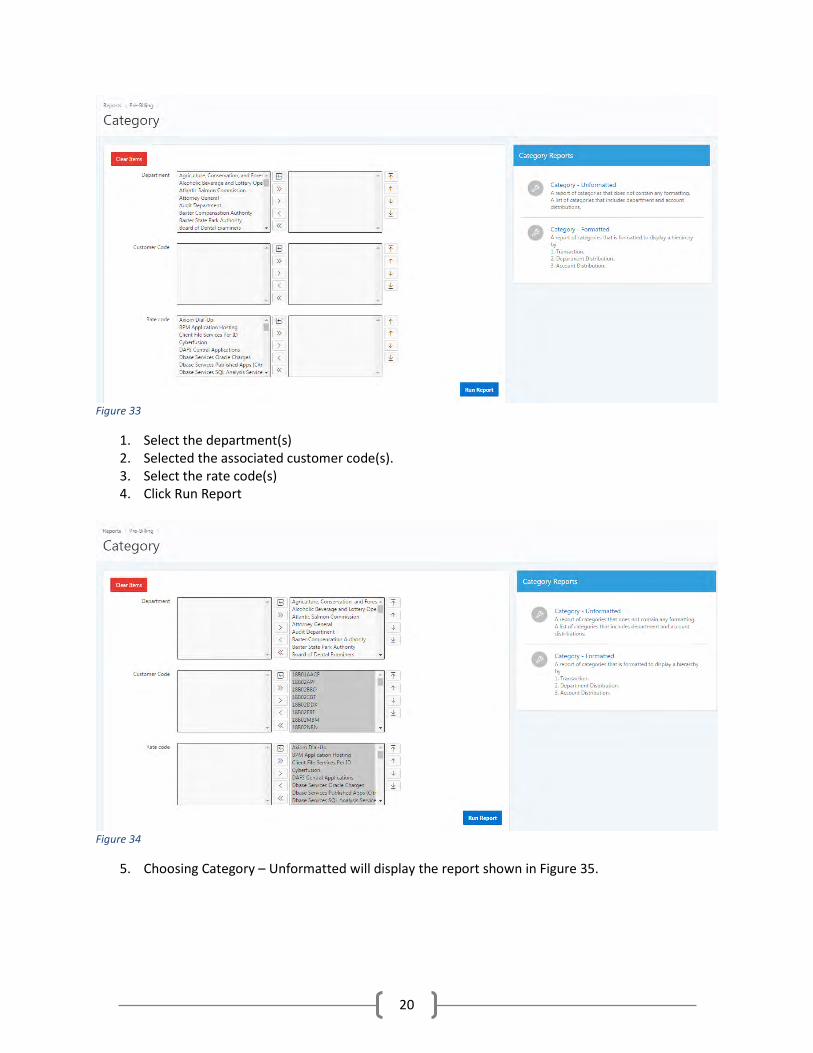
Category Purpose: Reports that list all the pre-billing transactions. There are unformatted and formatted versions.
20
Figure 33
1. Select the department(s) 2. Selected the associated customer code(s). 3. Select the rate code(s) 4. Click Run Report
Figure 34
5. Choosing Category – Unformatted will display the report shown in Figure 35.
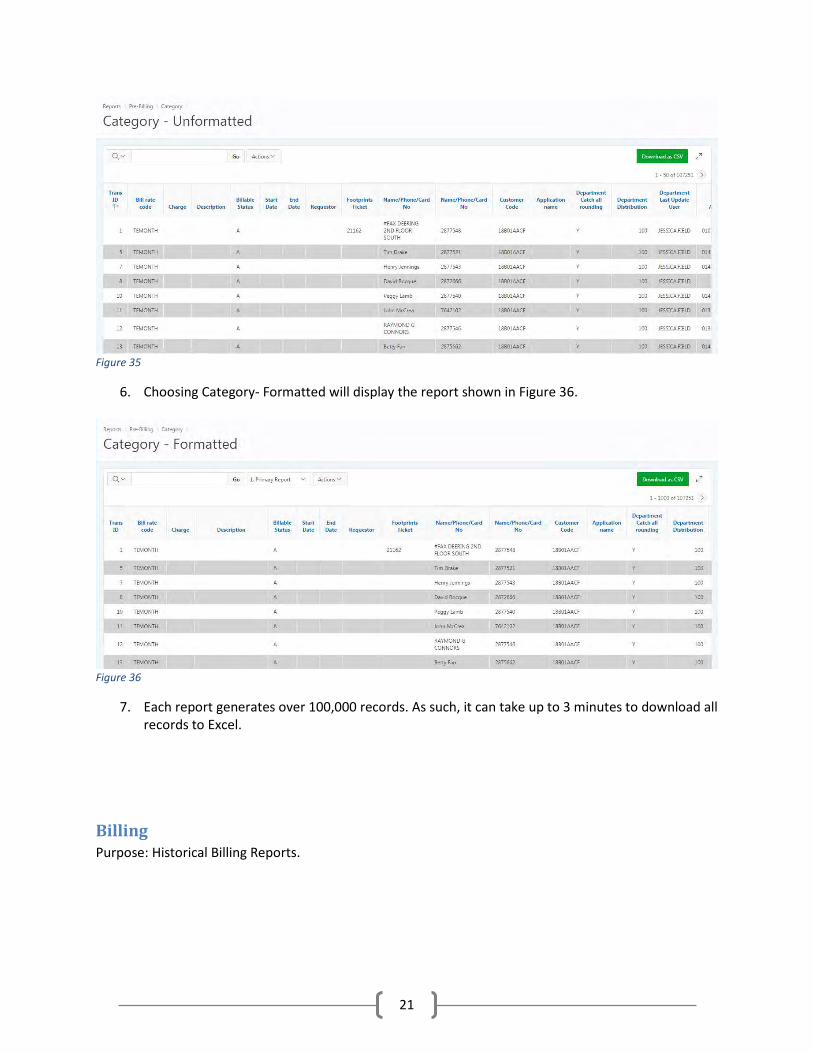
21
Figure 35
6. Choosing Category- Formatted will display the report shown in Figure 36.
Figure 36
7. Each report generates over 100,000 records. As such, it can take up to 3 minutes to download all records to Excel.
Billing Purpose: Historical Billing Reports.
22
Figure 37
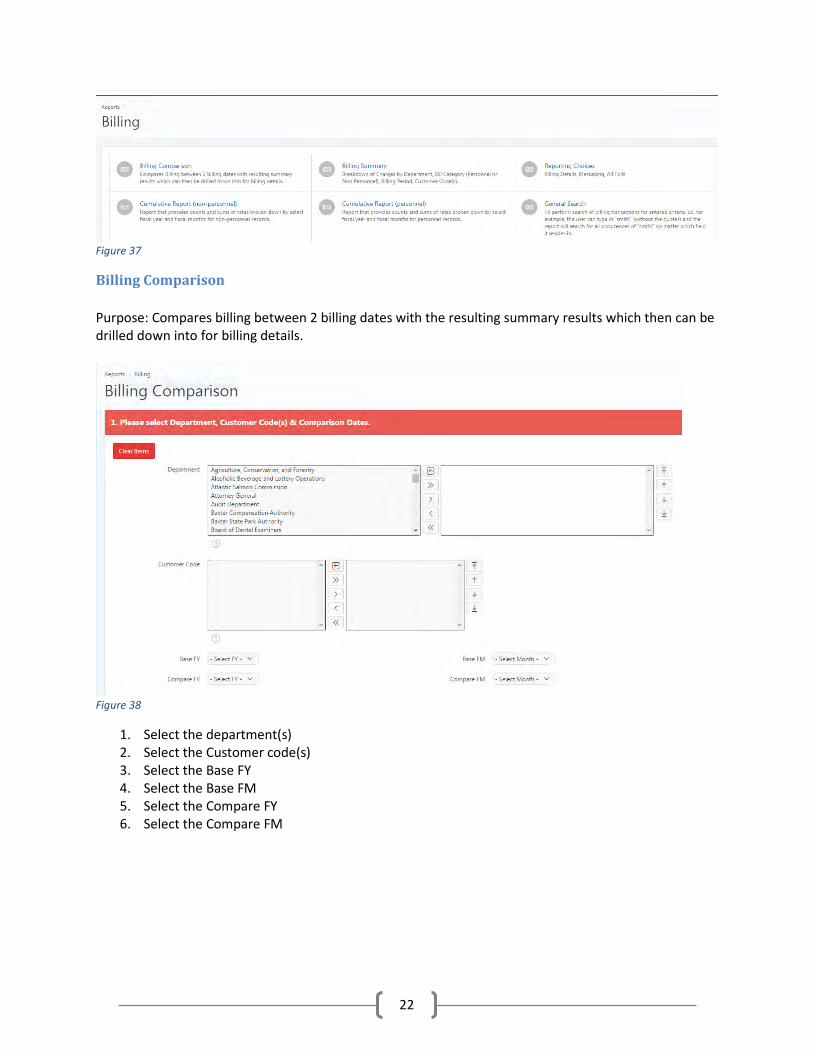
Billing Comparison Purpose: Compares billing between 2 billing dates with the resulting summary results which then can be drilled down into for billing details.
Figure 38
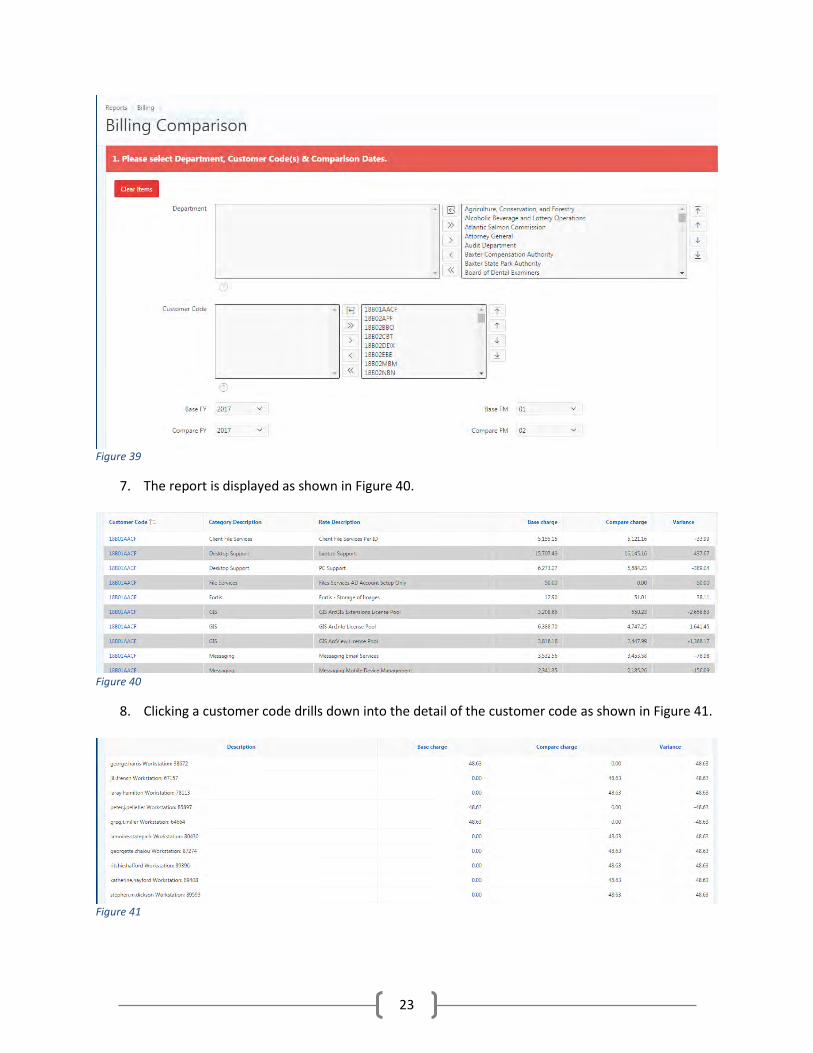
1. Select the department(s) 2. Select the Customer code(s) 3. Select the Base FY 4. Select the Base FM 5. Select the Compare FY 6. Select the Compare FM
23
Figure 39
7. The report is displayed as shown in Figure 40.
Figure 40
8. Clicking a customer code drills down into the detail of the customer code as shown in Figure 41.
Figure 41
24
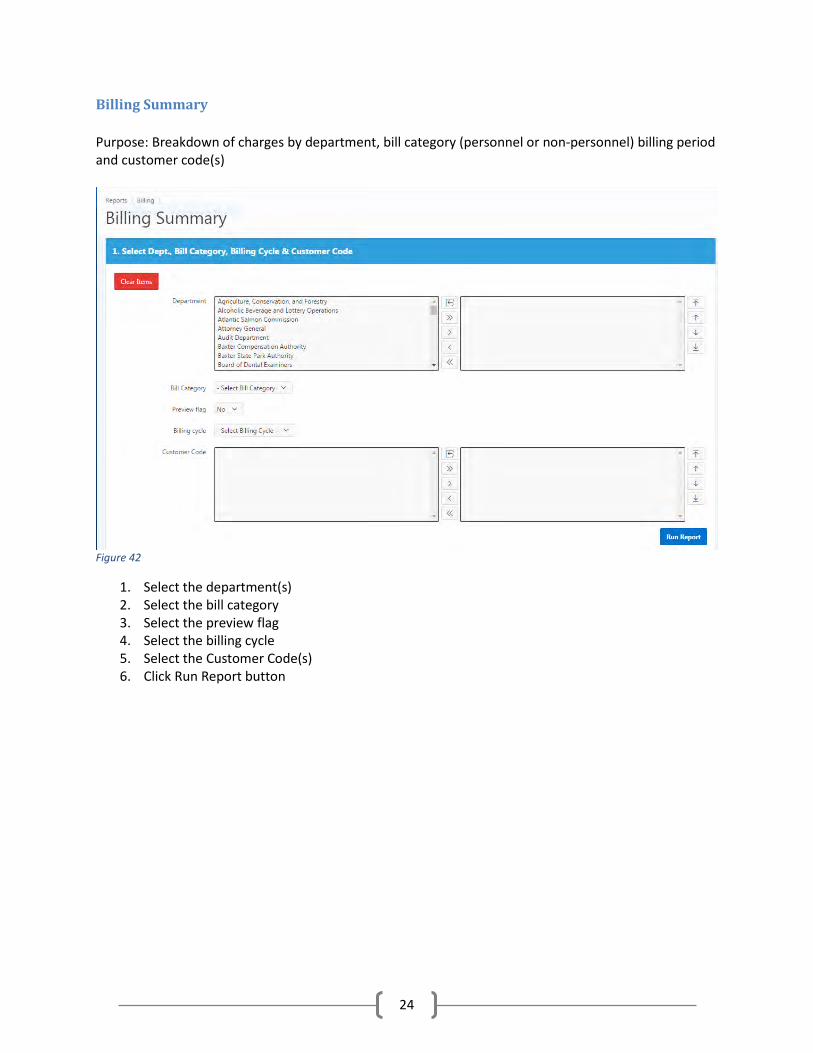
Billing Summary Purpose: Breakdown of charges by department, bill category (personnel or non-personnel) billing period and customer code(s)
Figure 42
1. Select the department(s) 2. Select the bill category 3. Select the preview flag 4. Select the billing cycle 5. Select the Customer Code(s) 6. Click Run Report button
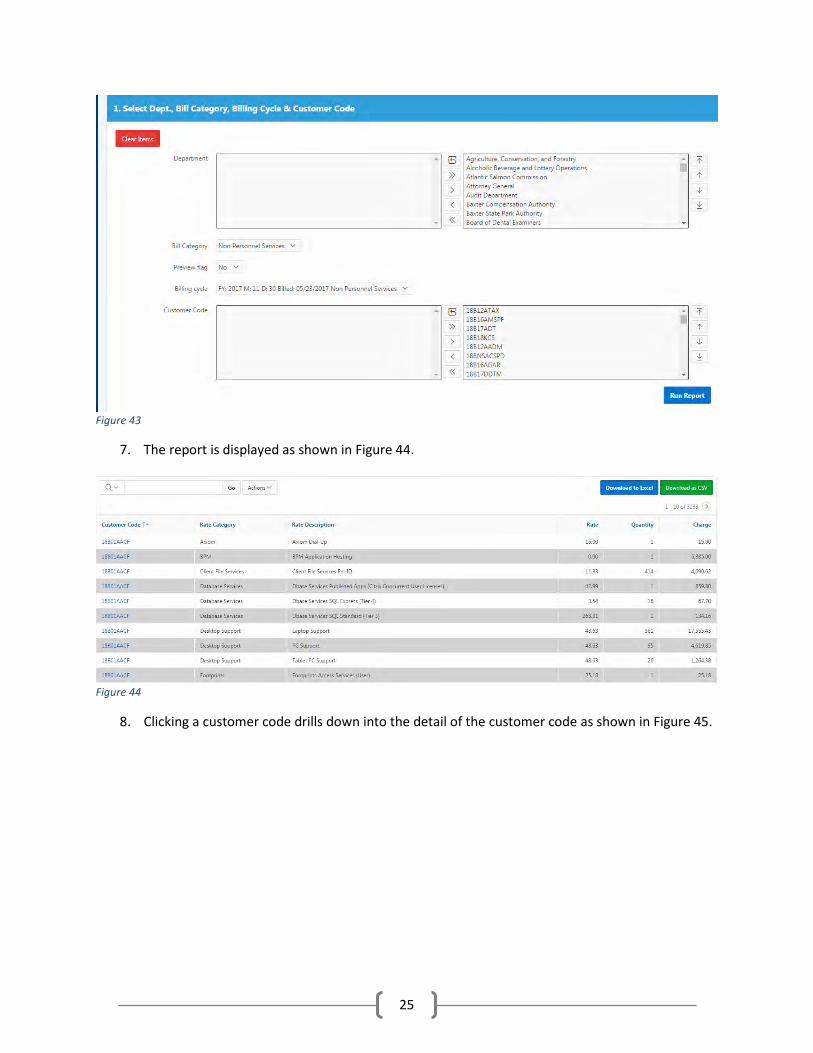
25
Figure 43
7. The report is displayed as shown in Figure 44.
Figure 44
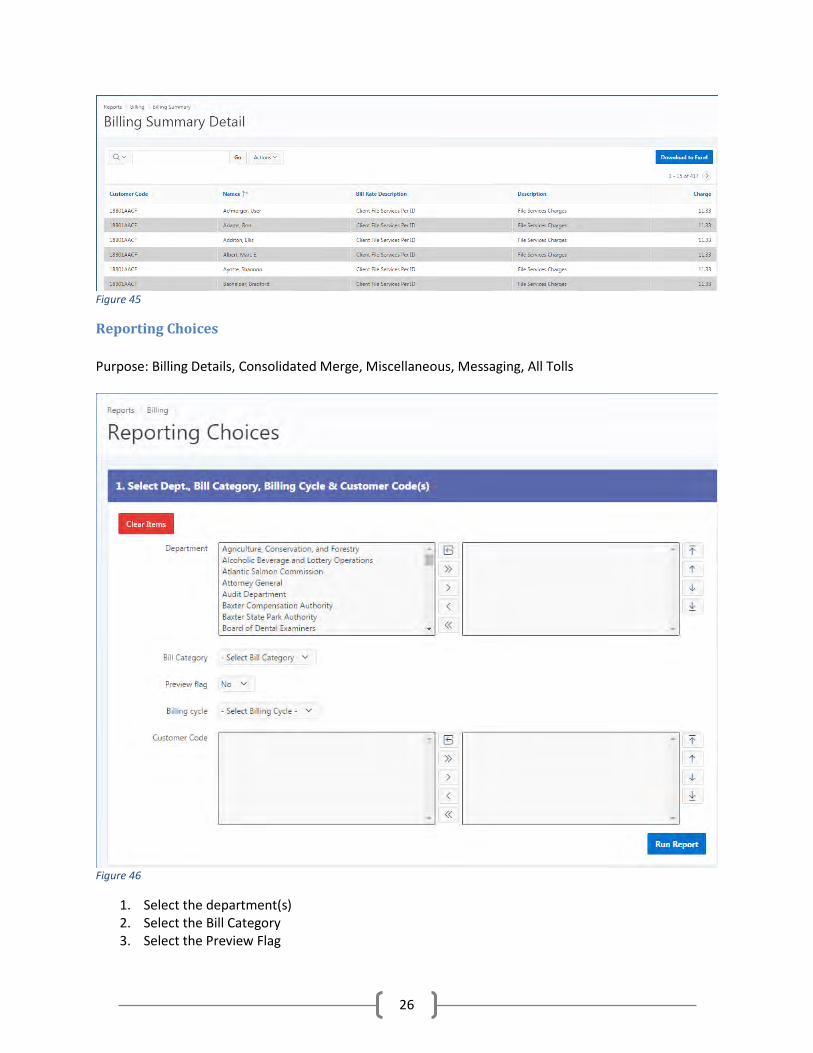
8. Clicking a customer code drills down into the detail of the customer code as shown in Figure 45.
26
Figure 45
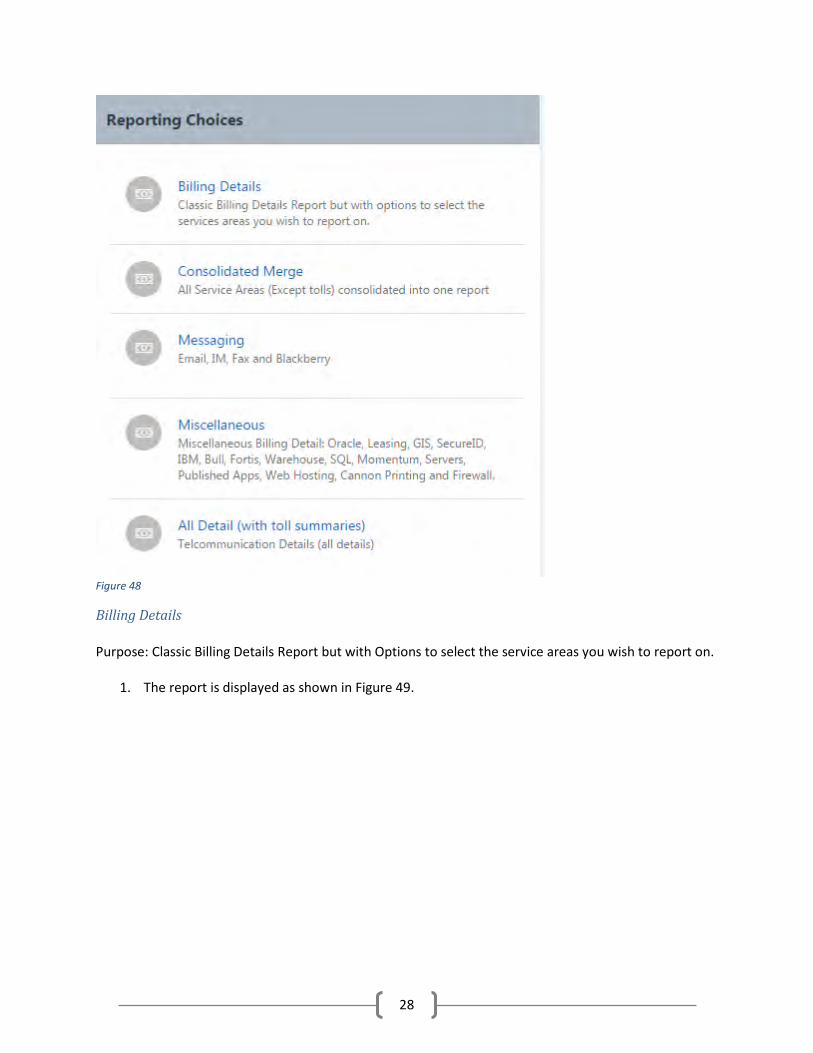
Reporting Choices Purpose: Billing Details, Consolidated Merge, Miscellaneous, Messaging, All Tolls
Figure 46
1. Select the department(s) 2. Select the Bill Category 3. Select the Preview Flag
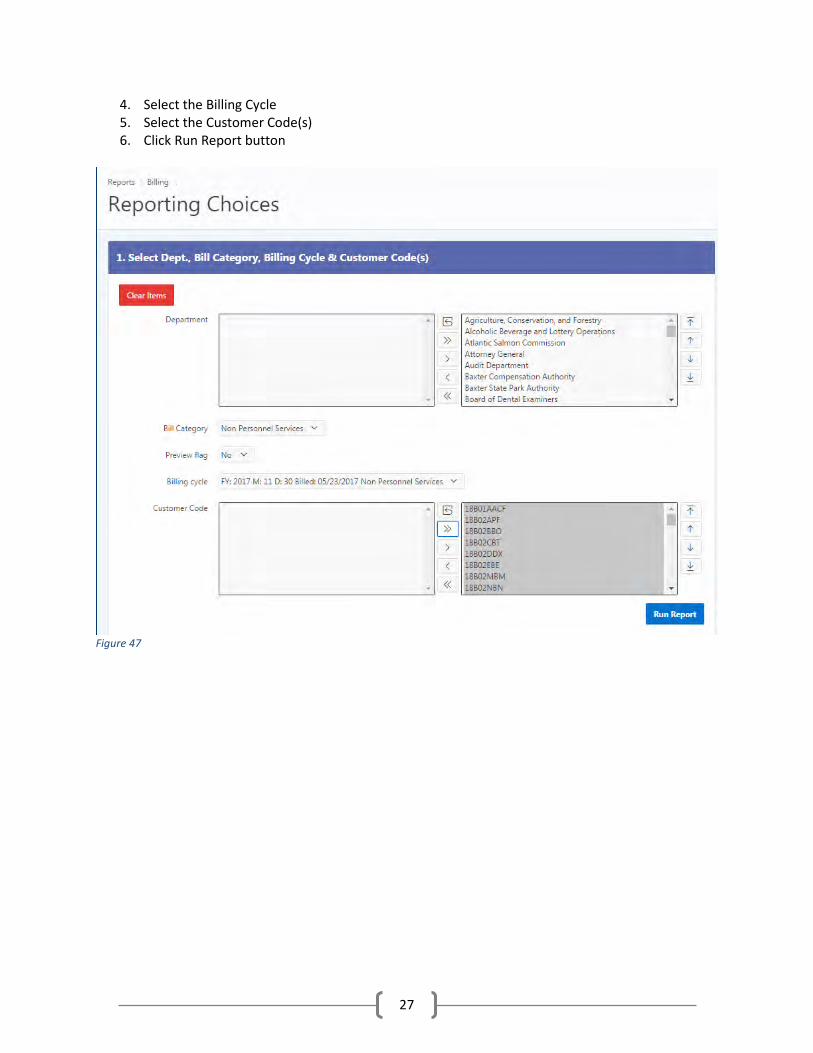
27
4. Select the Billing Cycle 5. Select the Customer Code(s) 6. Click Run Report button
Figure 47
28
Figure 48
Billing Details Purpose: Classic Billing Details Report but with Options to select the service areas you wish to report on.
1. The report is displayed as shown in Figure 49.
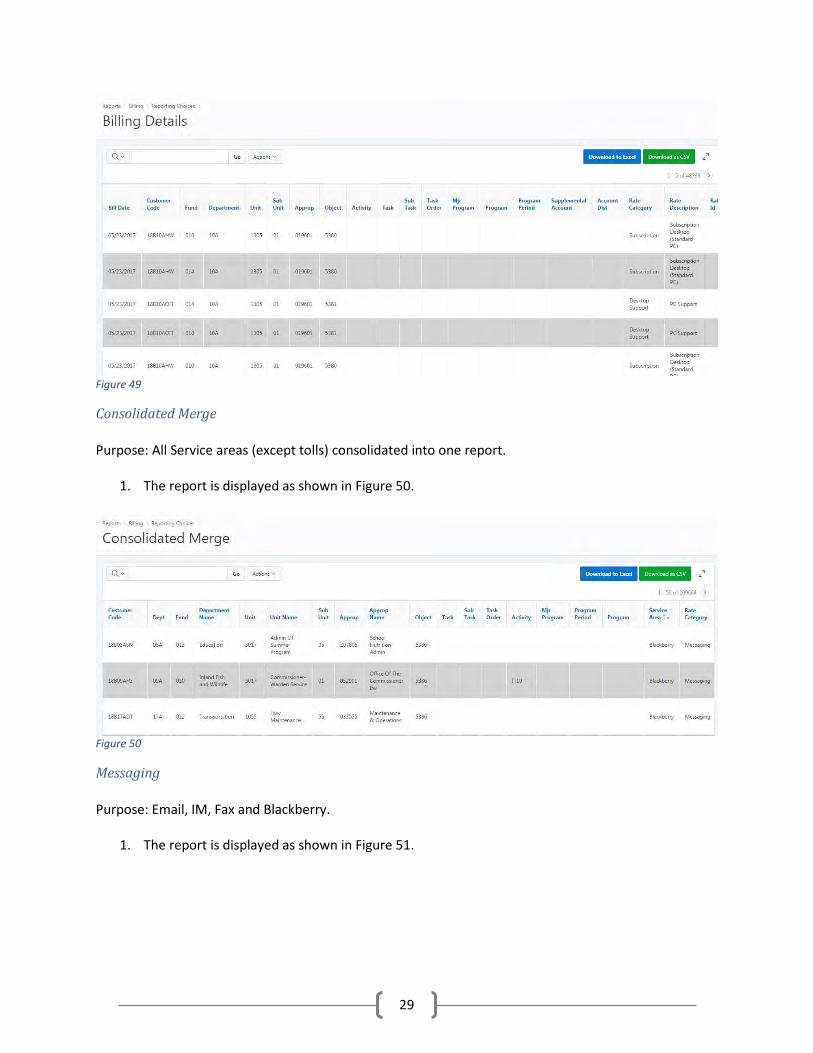
29
Figure 49
Consolidated Merge Purpose: All Service areas (except tolls) consolidated into one report.
1. The report is displayed as shown in Figure 50.
Figure 50
Messaging Purpose: Email, IM, Fax and Blackberry.
1. The report is displayed as shown in Figure 51.
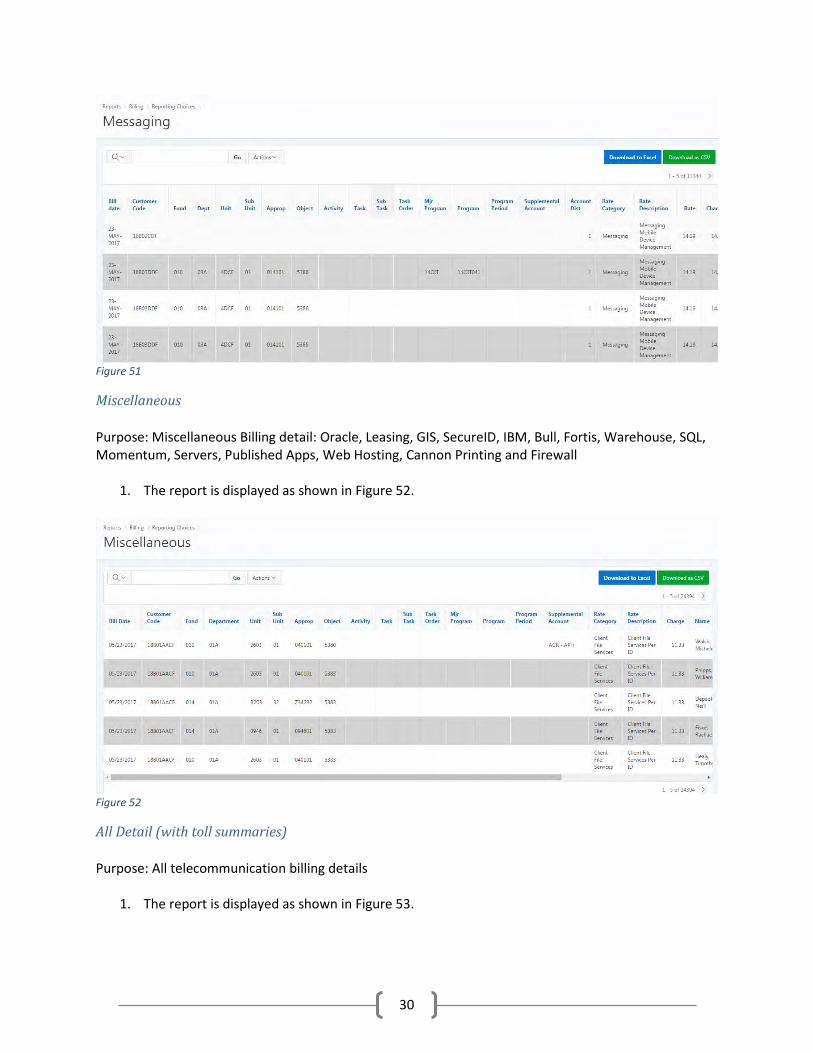
30
Figure 51
Miscellaneous Purpose: Miscellaneous Billing detail: Oracle, Leasing, GIS, SecureID, IBM, Bull, Fortis, Warehouse, SQL, Momentum, Servers, Published Apps, Web Hosting, Cannon Printing and Firewall
1. The report is displayed as shown in Figure 52.
Figure 52
All Detail (with toll summaries) Purpose: All telecommunication billing details
1. The report is displayed as shown in Figure 53.
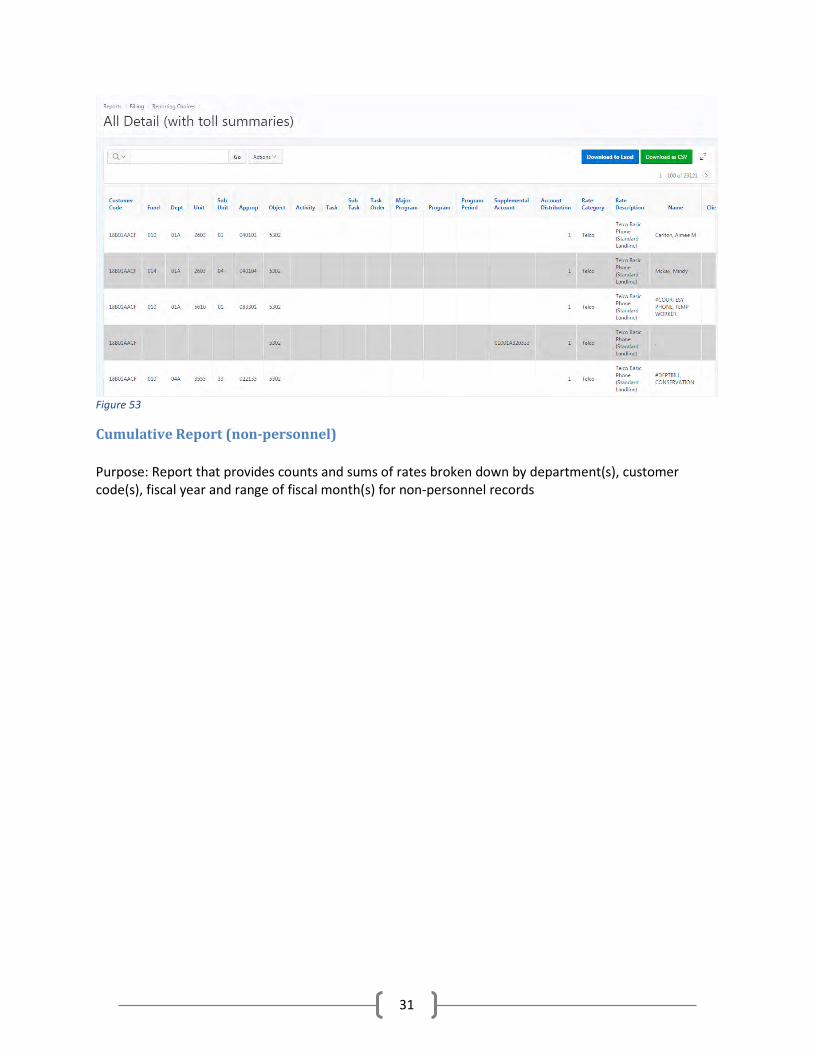
31
Figure 53
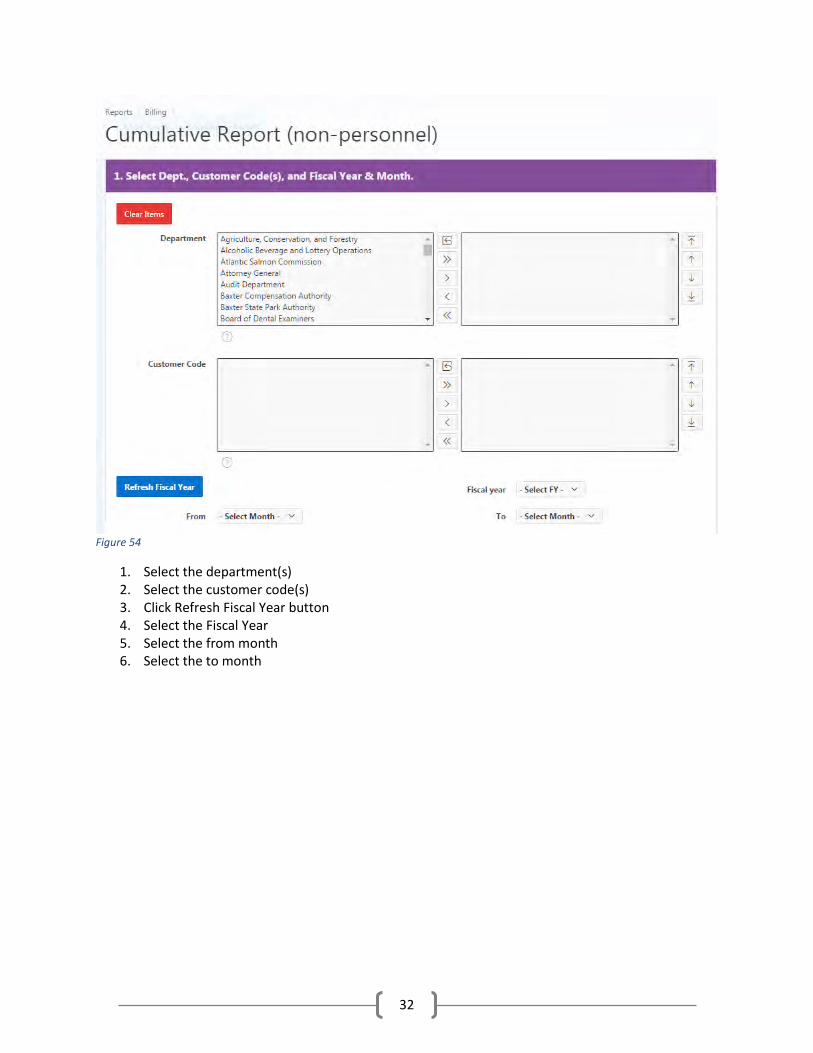
Cumulative Report (non-personnel) Purpose: Report that provides counts and sums of rates broken down by department(s), customer code(s), fiscal year and range of fiscal month(s) for non-personnel records
32
Figure 54
1. Select the department(s) 2. Select the customer code(s) 3. Click Refresh Fiscal Year button 4. Select the Fiscal Year 5. Select the from month 6. Select the to month
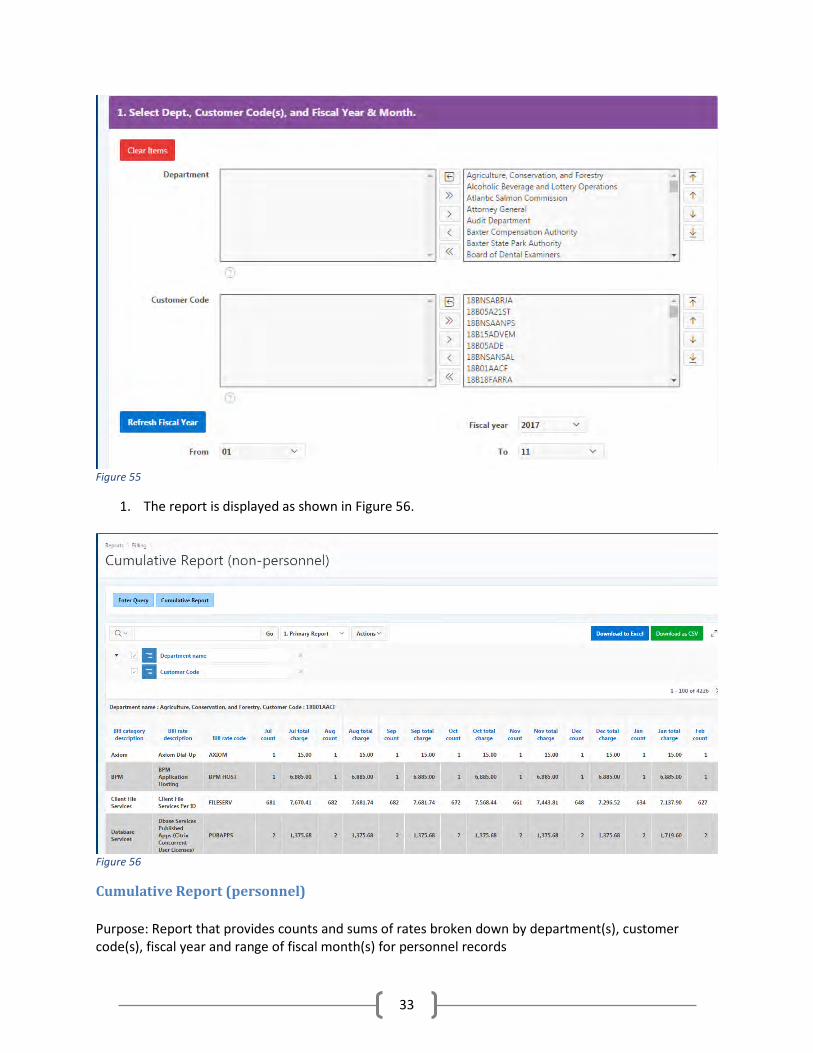
33
Figure 55
1. The report is displayed as shown in Figure 56.
Figure 56
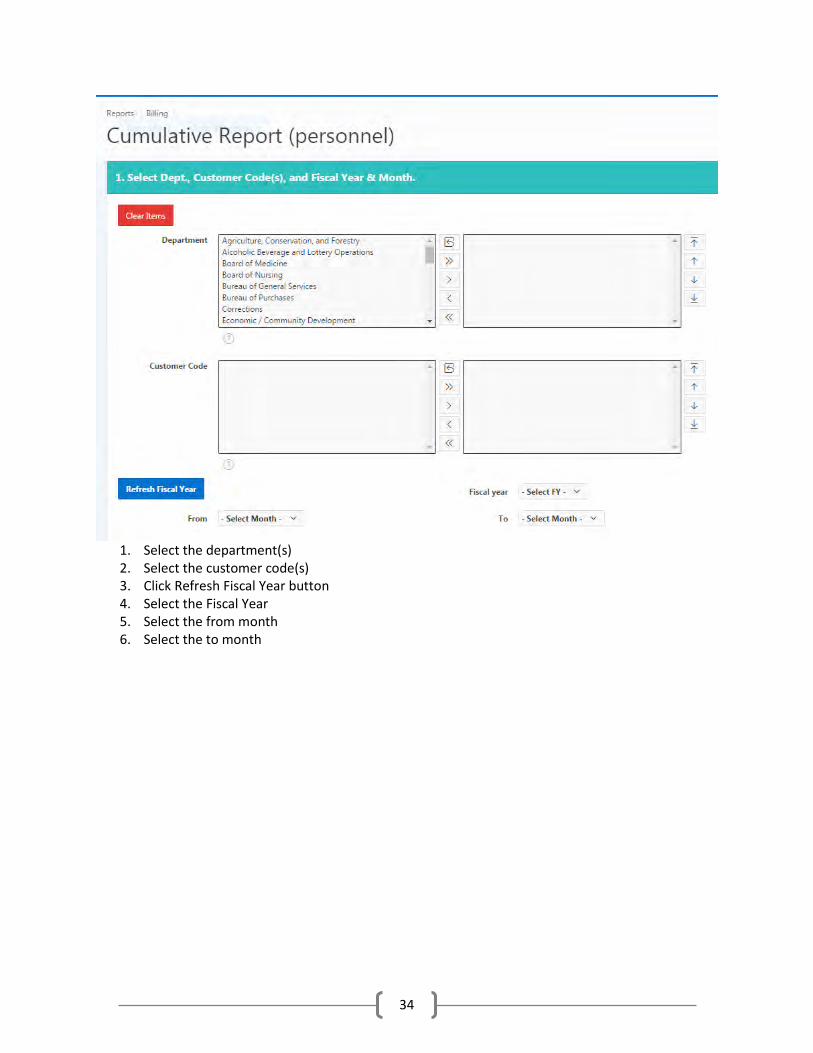
Cumulative Report (personnel) Purpose: Report that provides counts and sums of rates broken down by department(s), customer code(s), fiscal year and range of fiscal month(s) for personnel records
34
1. Select the department(s) 2. Select the customer code(s) 3. Click Refresh Fiscal Year button 4. Select the Fiscal Year 5. Select the from month 6. Select the to month
35
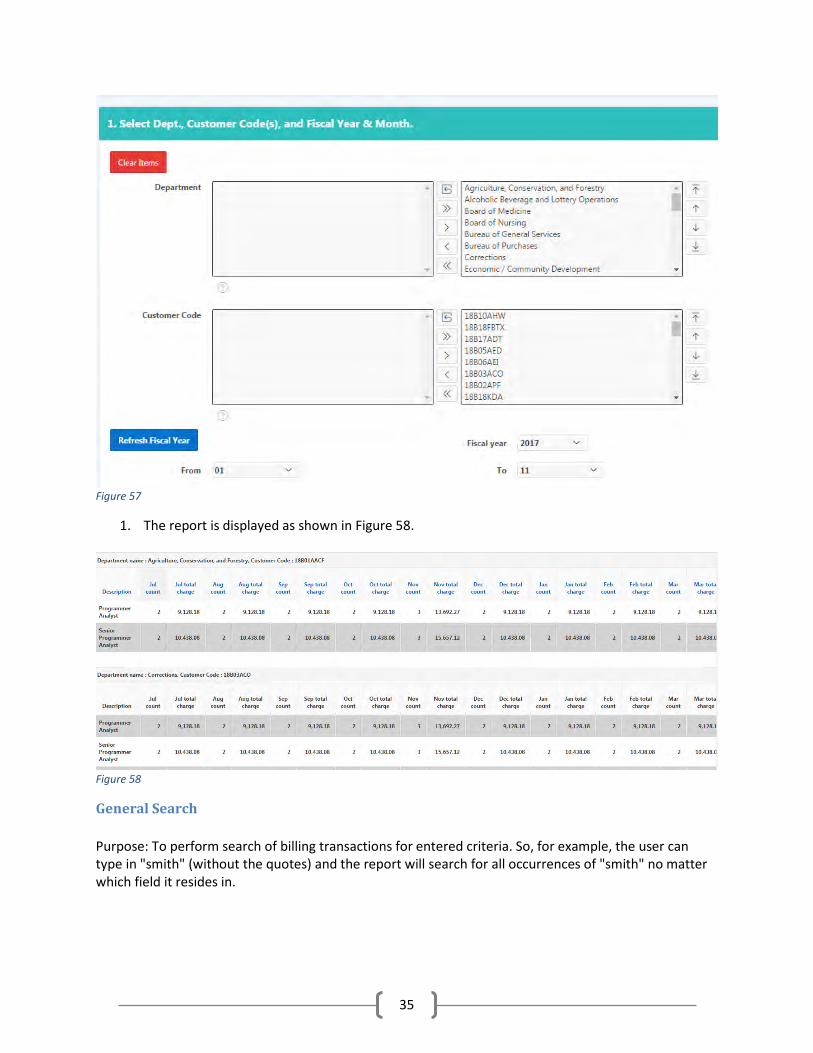
Figure 57
1. The report is displayed as shown in Figure 58.
Figure 58
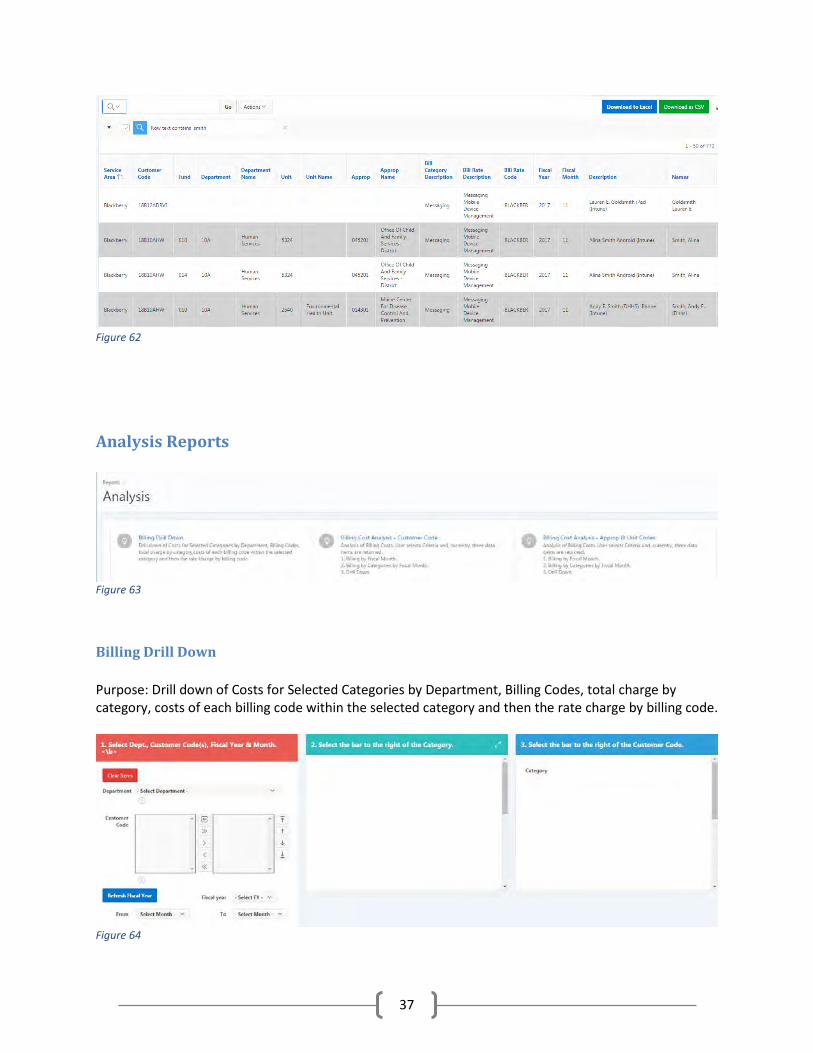
General Search Purpose: To perform search of billing transactions for entered criteria. So, for example, the user can type in "smith" (without the quotes) and the report will search for all occurrences of "smith" no matter which field it resides in.
36
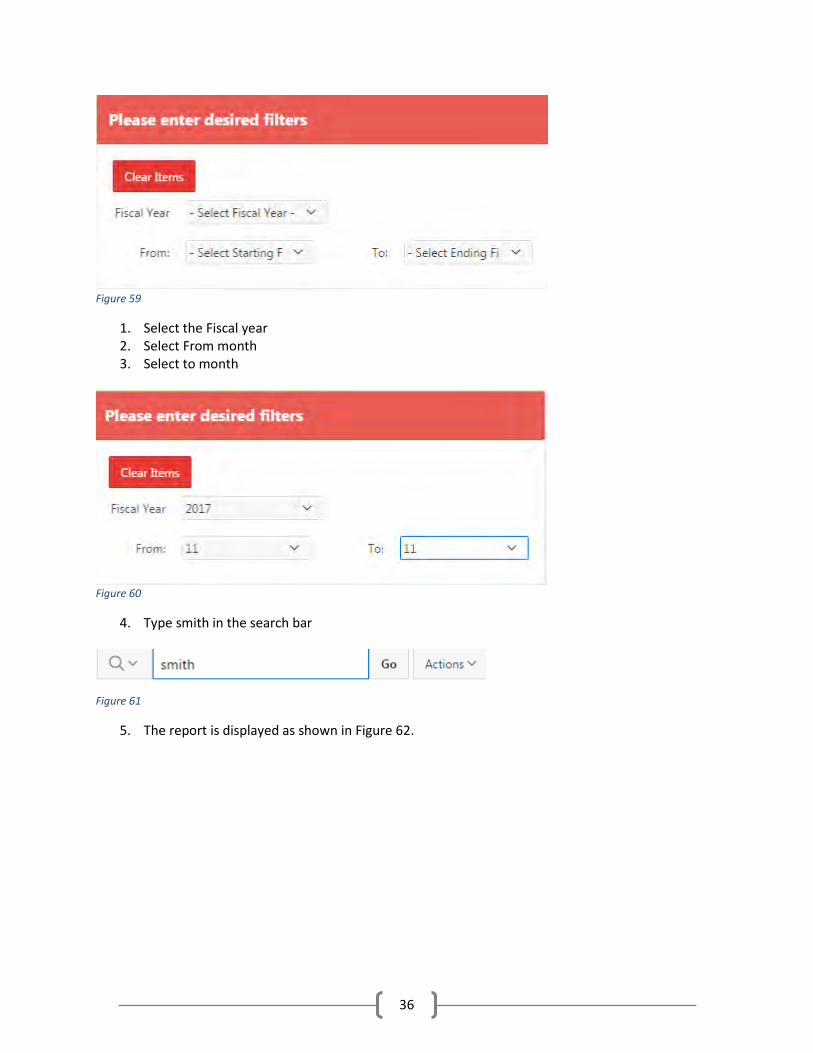
Figure 59
1. Select the Fiscal year 2. Select From month 3. Select to month
Figure 60
4. Type smith in the search bar
Figure 61
5. The report is displayed as shown in Figure 62.
37
Figure 62
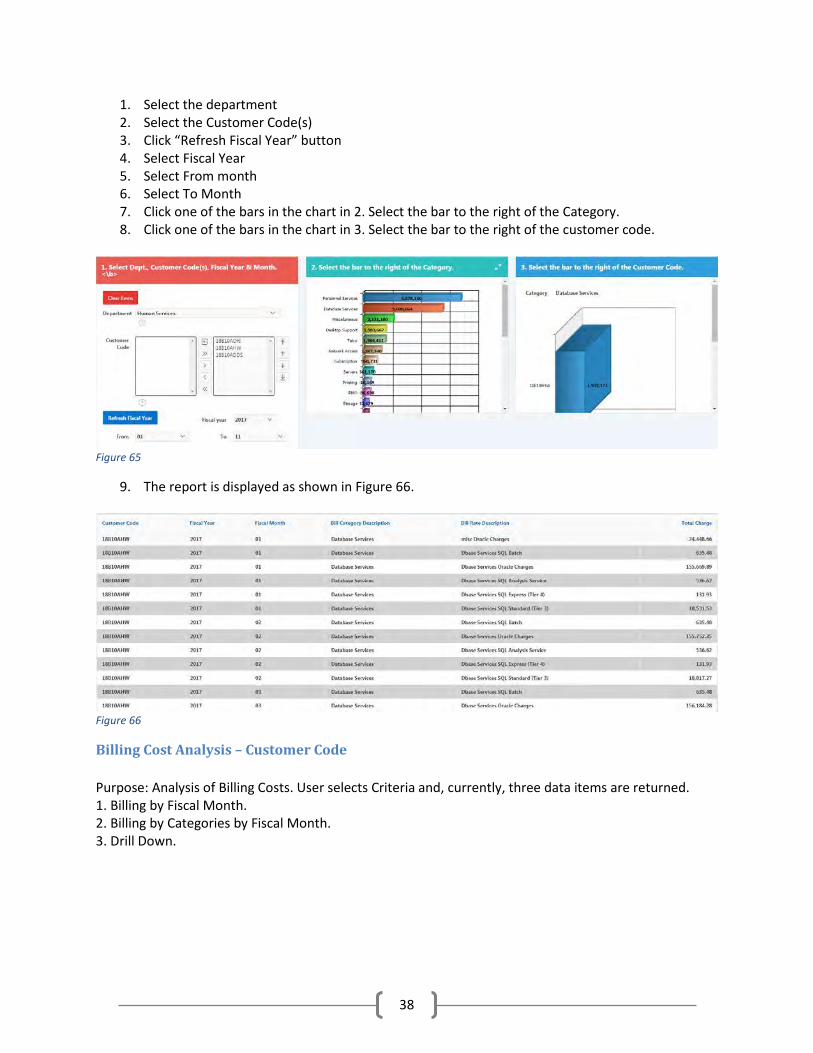
Analysis Reports
Figure 63
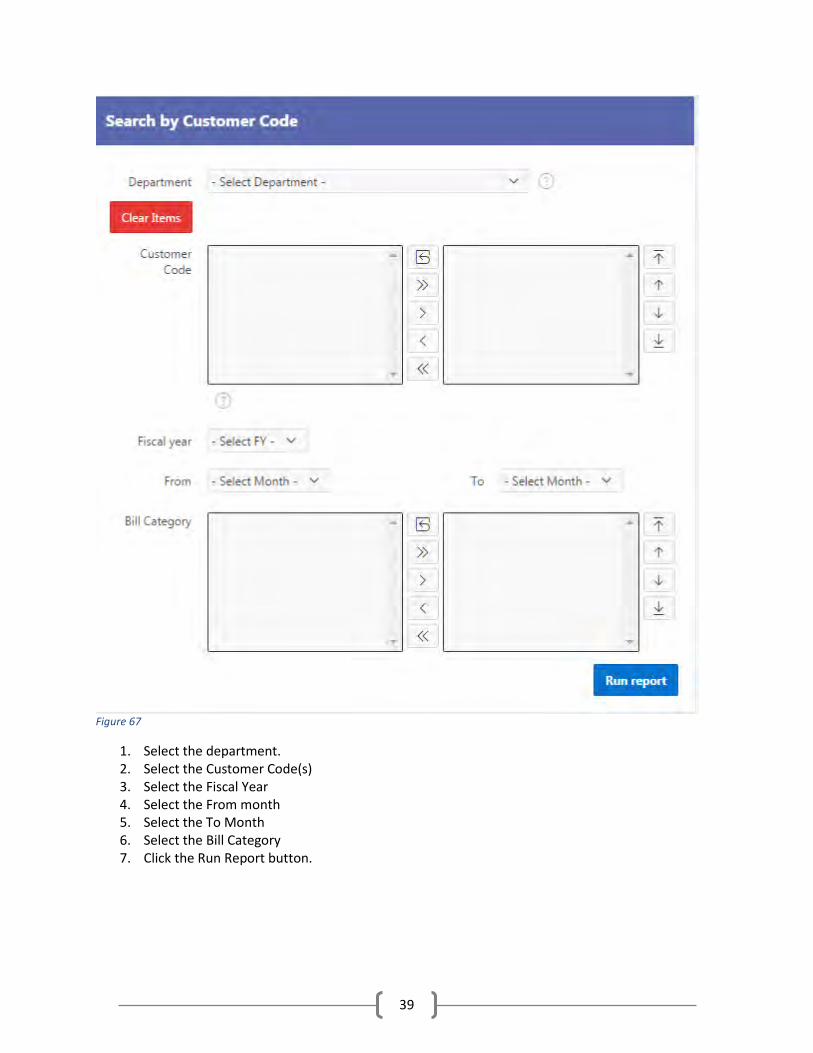
Billing Drill Down Purpose: Drill down of Costs for Selected Categories by Department, Billing Codes, total charge by category, costs of each billing code within the selected category and then the rate charge by billing code.
Figure 64
38
1. Select the department 2. Select the Customer Code(s) 3. Click “Refresh Fiscal Year” button 4. Select Fiscal Year 5. Select From month 6. Select To Month 7. Click one of the bars in the chart in 2. Select the bar to the right of the Category. 8. Click one of the bars in the chart in 3. Select the bar to the right of the customer code.
Figure 65
9. The report is displayed as shown in Figure 66.
Figure 66
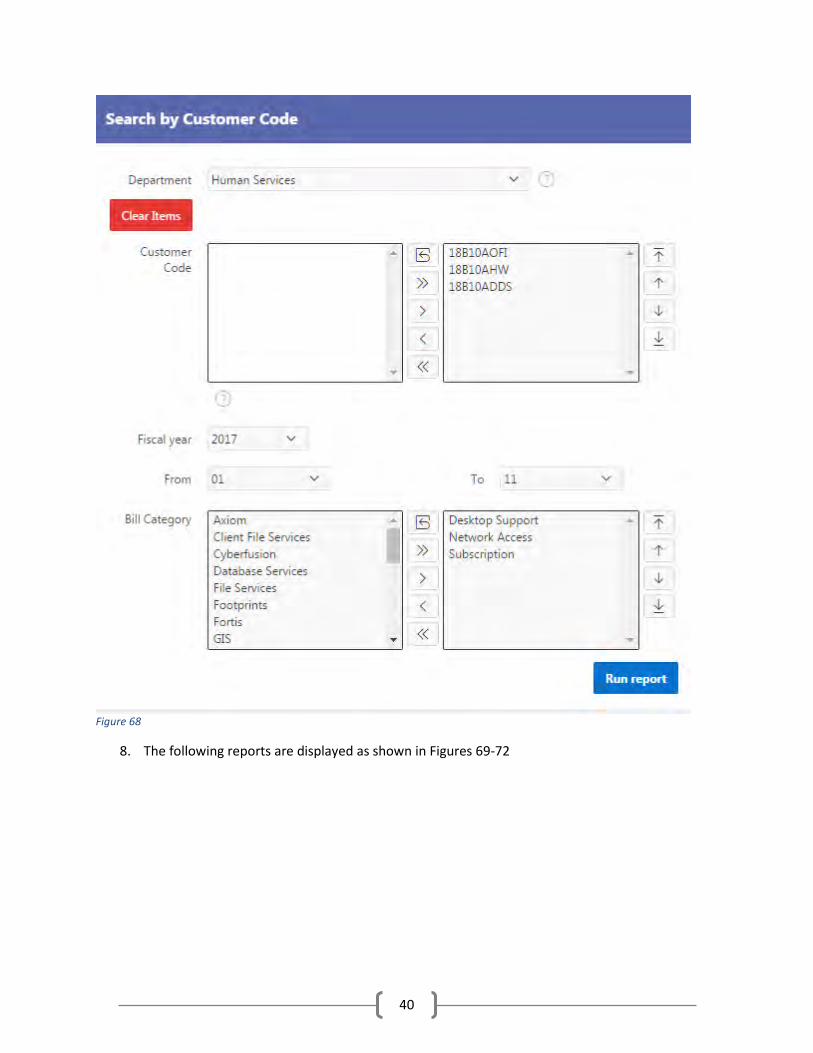
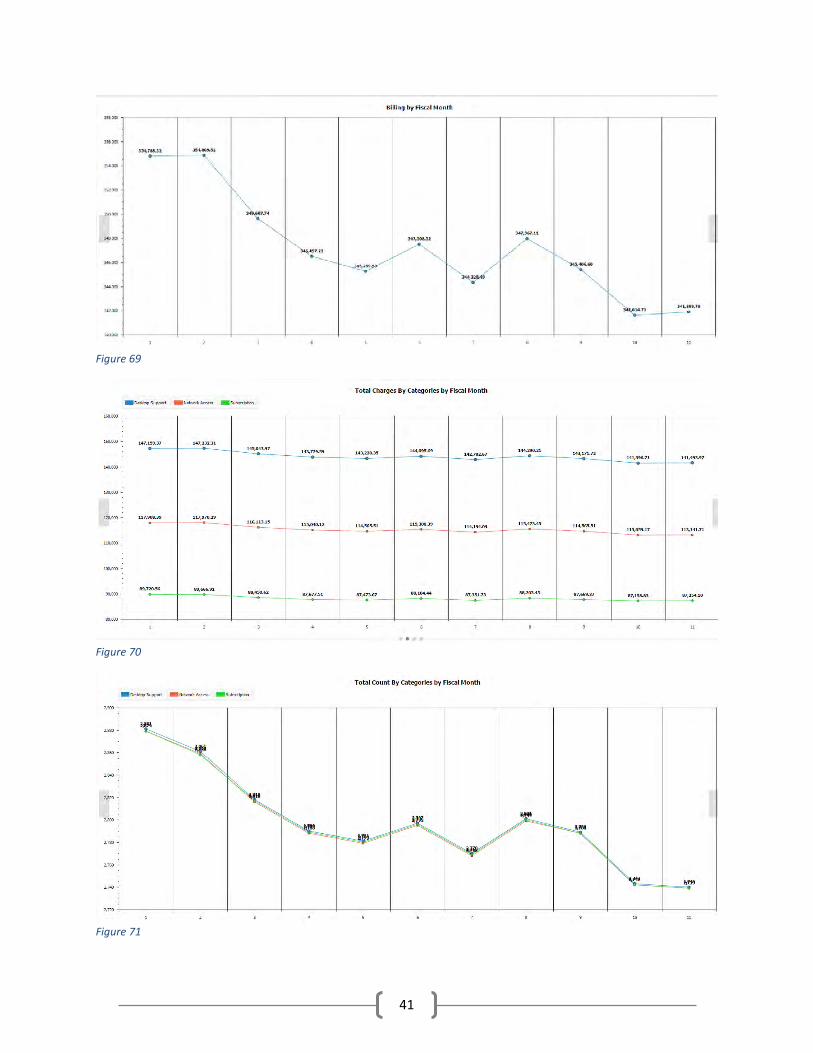
Billing Cost Analysis – Customer Code Purpose: Analysis of Billing Costs. User selects Criteria and, currently, three data items are returned. 1. Billing by Fiscal Month. 2. Billing by Categories by Fiscal Month. 3. Drill Down.
39
Figure 67
1. Select the department. 2. Select the Customer Code(s) 3. Select the Fiscal Year 4. Select the From month 5. Select the To Month 6. Select the Bill Category 7. Click the Run Report button.
40
Figure 68
8. The following reports are displayed as shown in Figures 69-72
41
Figure 69
Figure 70
Figure 71
42
Figure 72
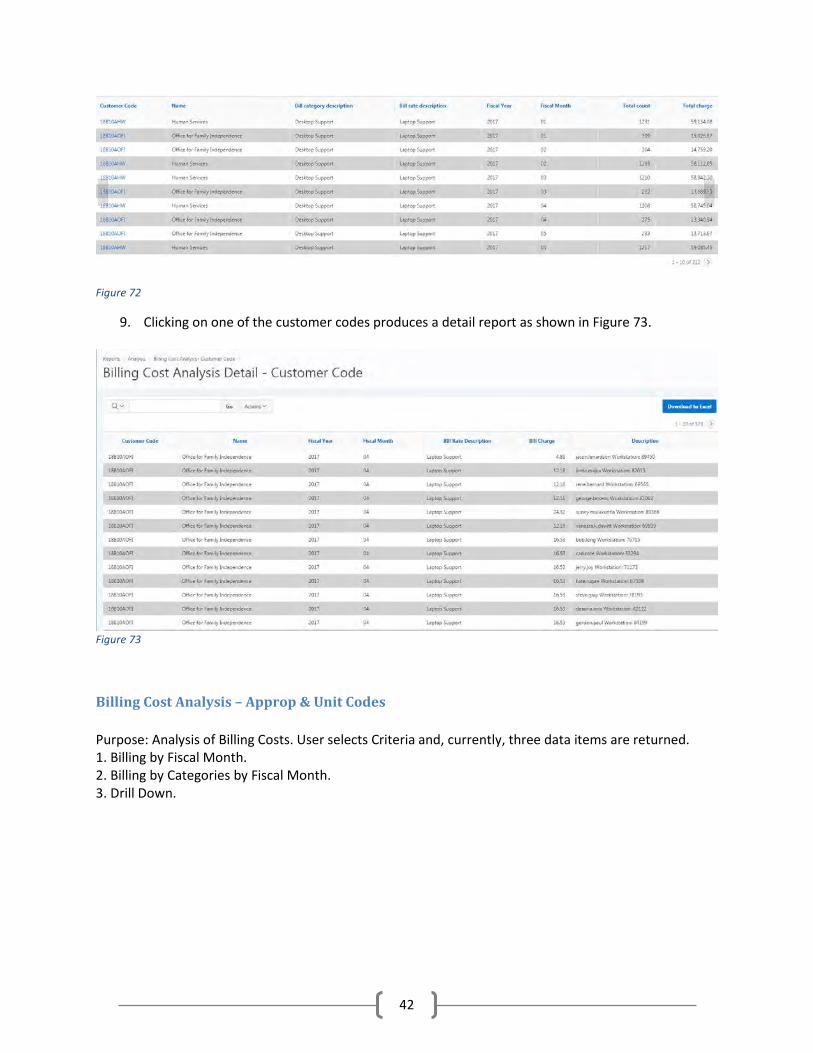
9. Clicking on one of the customer codes produces a detail report as shown in Figure 73.
Figure 73
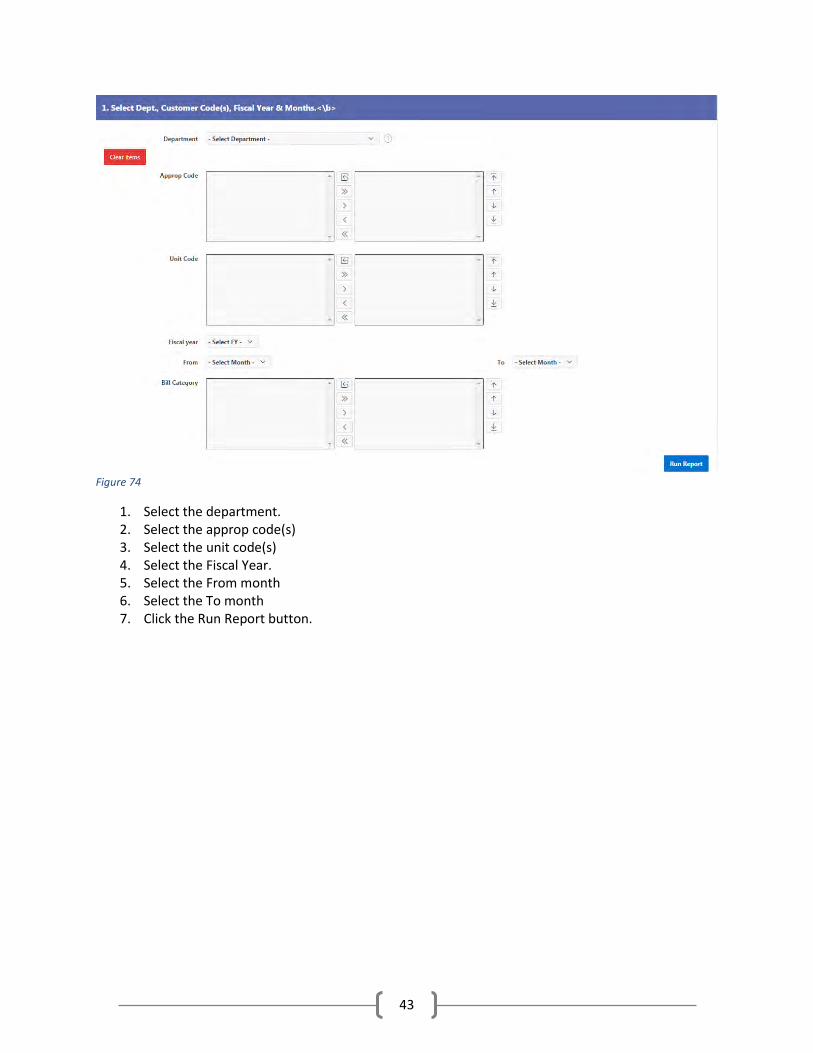
Billing Cost Analysis – Approp & Unit Codes Purpose: Analysis of Billing Costs. User selects Criteria and, currently, three data items are returned. 1. Billing by Fiscal Month. 2. Billing by Categories by Fiscal Month. 3. Drill Down.
43
Figure 74
1. Select the department. 2. Select the approp code(s) 3. Select the unit code(s) 4. Select the Fiscal Year. 5. Select the From month 6. Select the To month 7. Click the Run Report button.
44
Figure 75
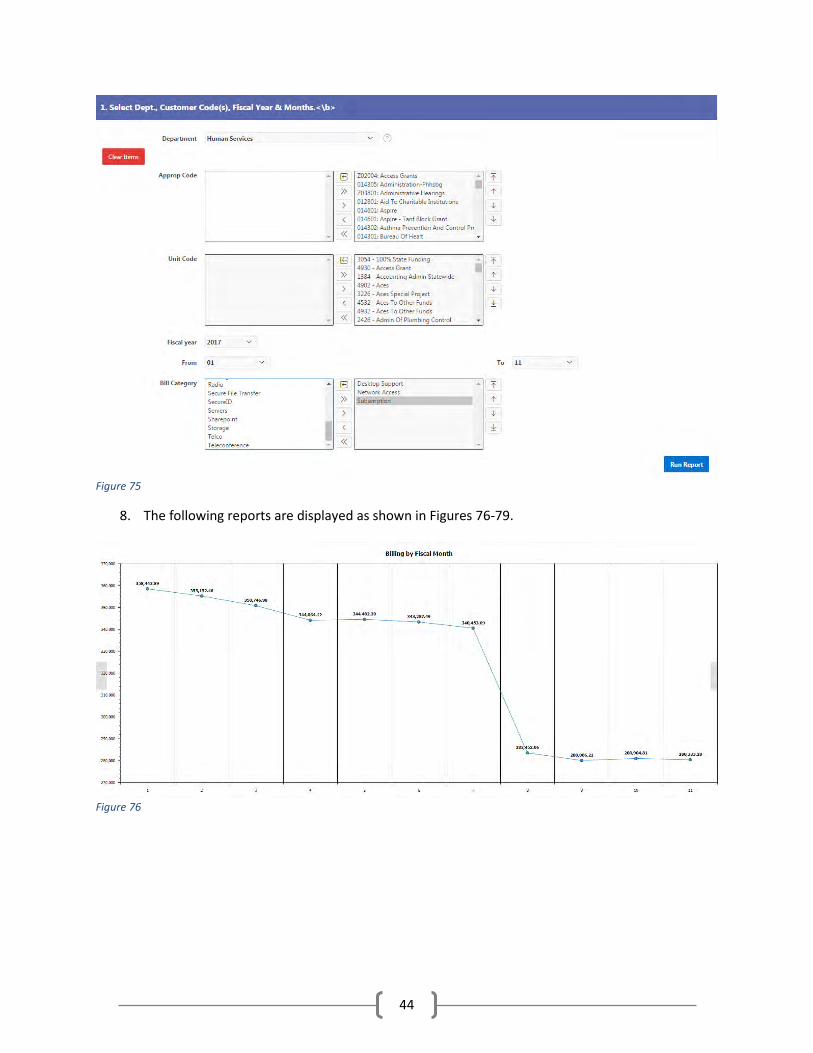
8. The following reports are displayed as shown in Figures 76-79.
Figure 76
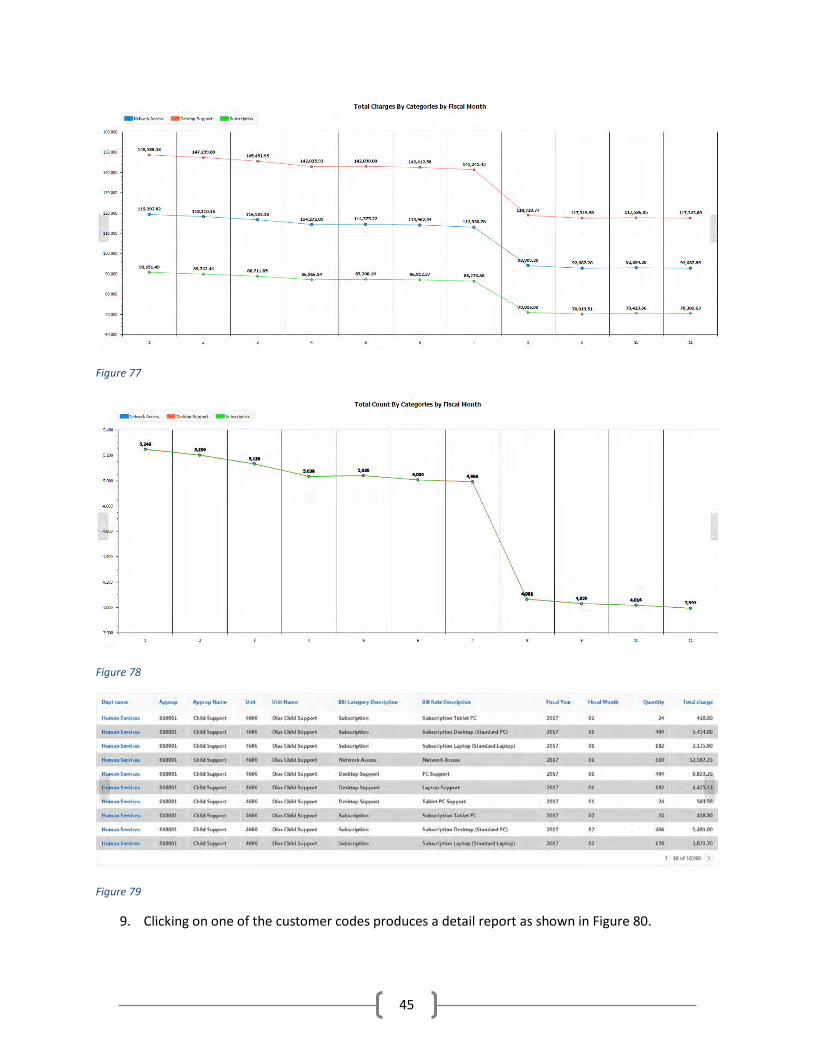
45
Figure 77
Figure 78
Figure 79
9. Clicking on one of the customer codes produces a detail report as shown in Figure 80.
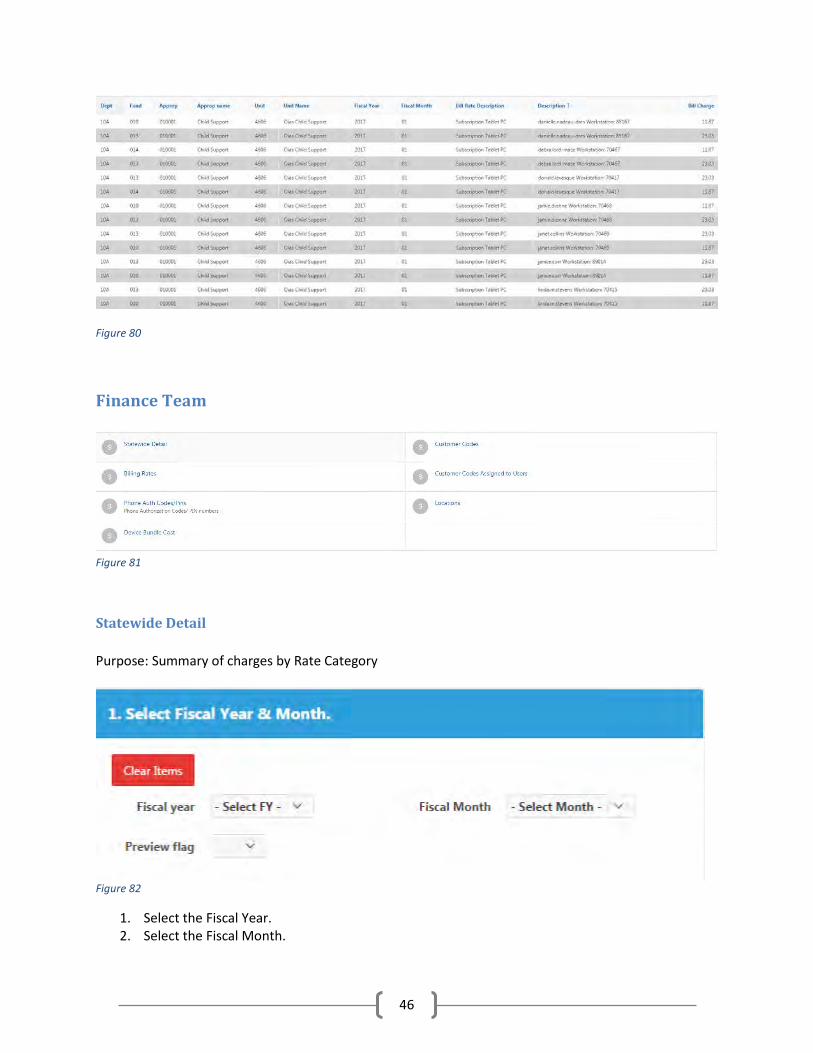
46
Figure 80
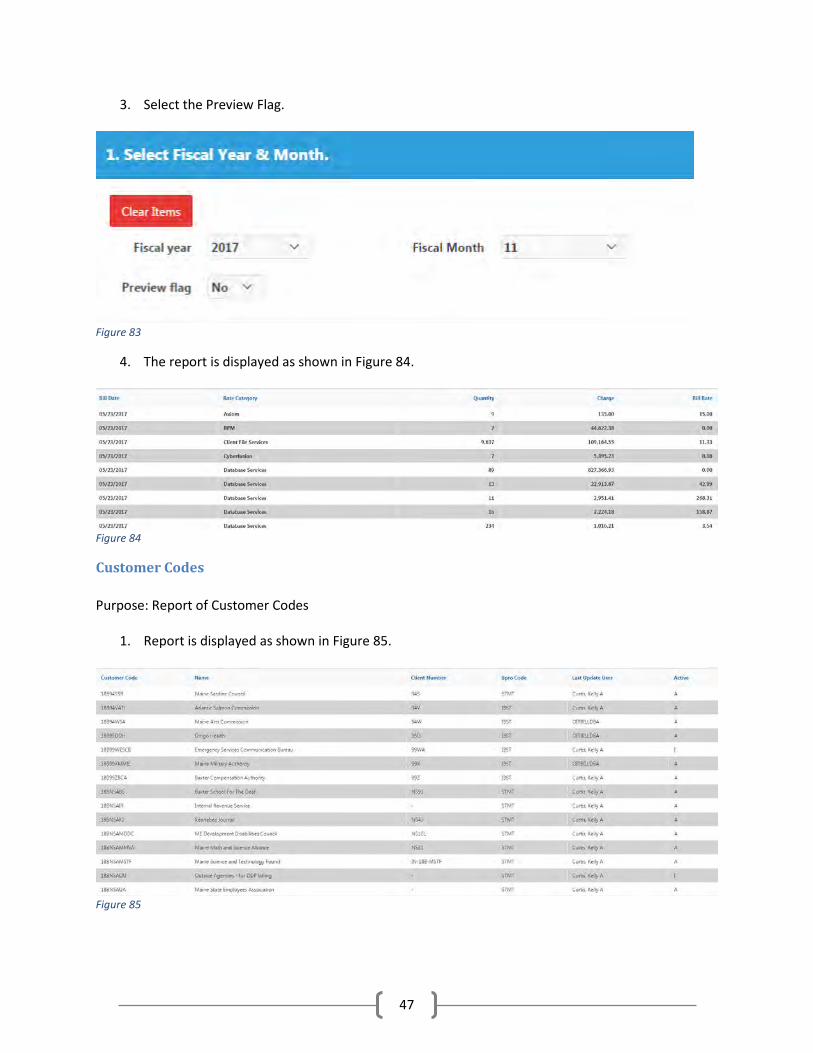
Finance Team
Figure 81
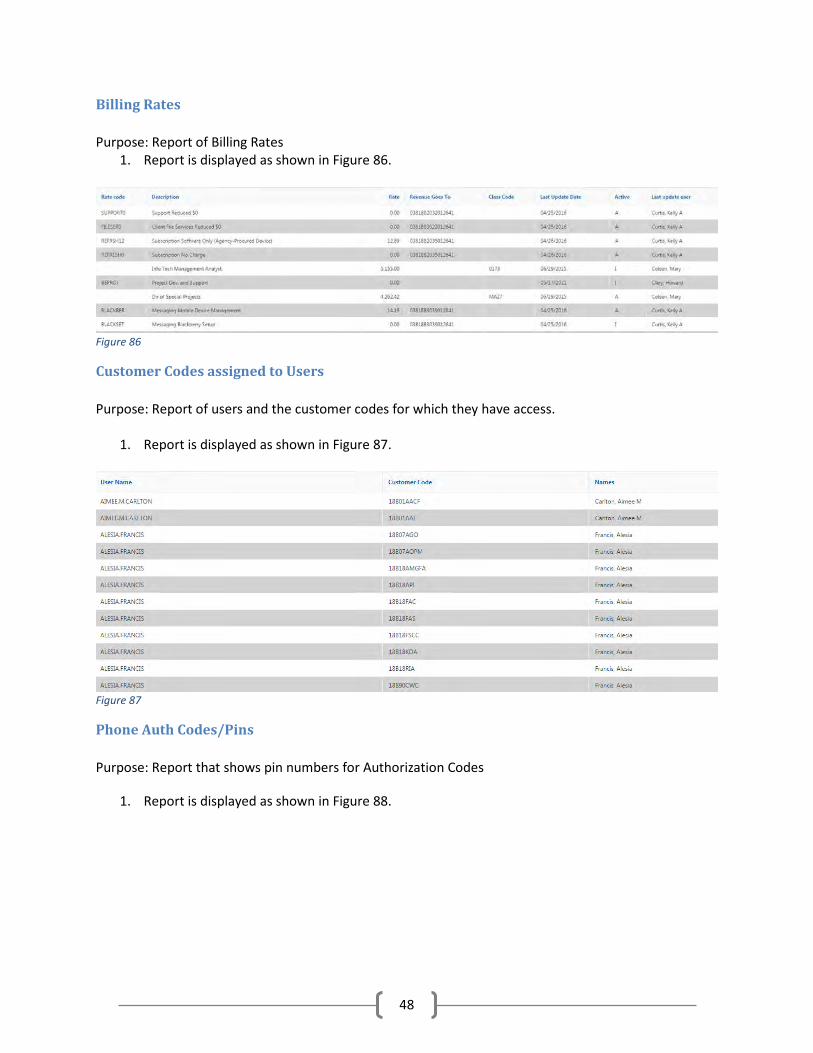
Statewide Detail Purpose: Summary of charges by Rate Category
Figure 82
1. Select the Fiscal Year. 2. Select the Fiscal Month.
47
3. Select the Preview Flag.
Figure 83
4. The report is displayed as shown in Figure 84.
Figure 84
Customer Codes Purpose: Report of Customer Codes
1. Report is displayed as shown in Figure 85.
Figure 85
48
Billing Rates Purpose: Report of Billing Rates
1. Report is displayed as shown in Figure 86.
Figure 86
Customer Codes assigned to Users Purpose: Report of users and the customer codes for which they have access.
1. Report is displayed as shown in Figure 87.
Figure 87
Phone Auth Codes/Pins Purpose: Report that shows pin numbers for Authorization Codes
1. Report is displayed as shown in Figure 88.
49
Figure 88
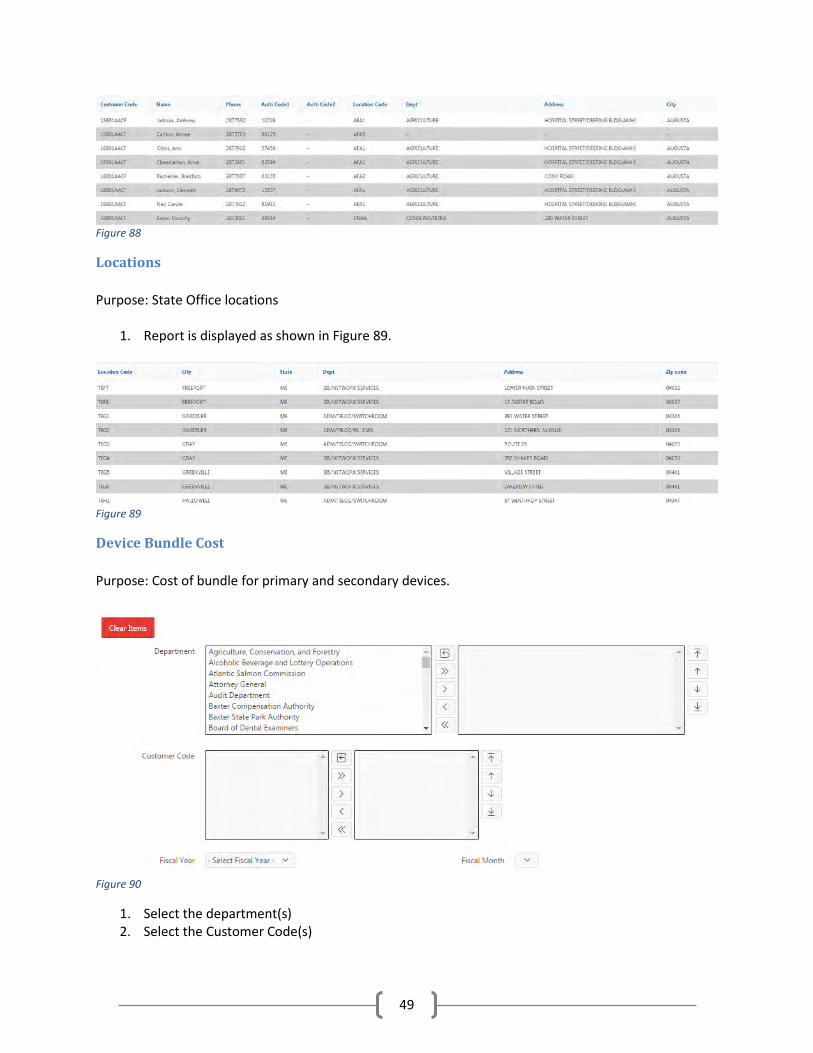
Locations Purpose: State Office locations
1. Report is displayed as shown in Figure 89.
Figure 89
Device Bundle Cost Purpose: Cost of bundle for primary and secondary devices.
Figure 90
1. Select the department(s) 2. Select the Customer Code(s)
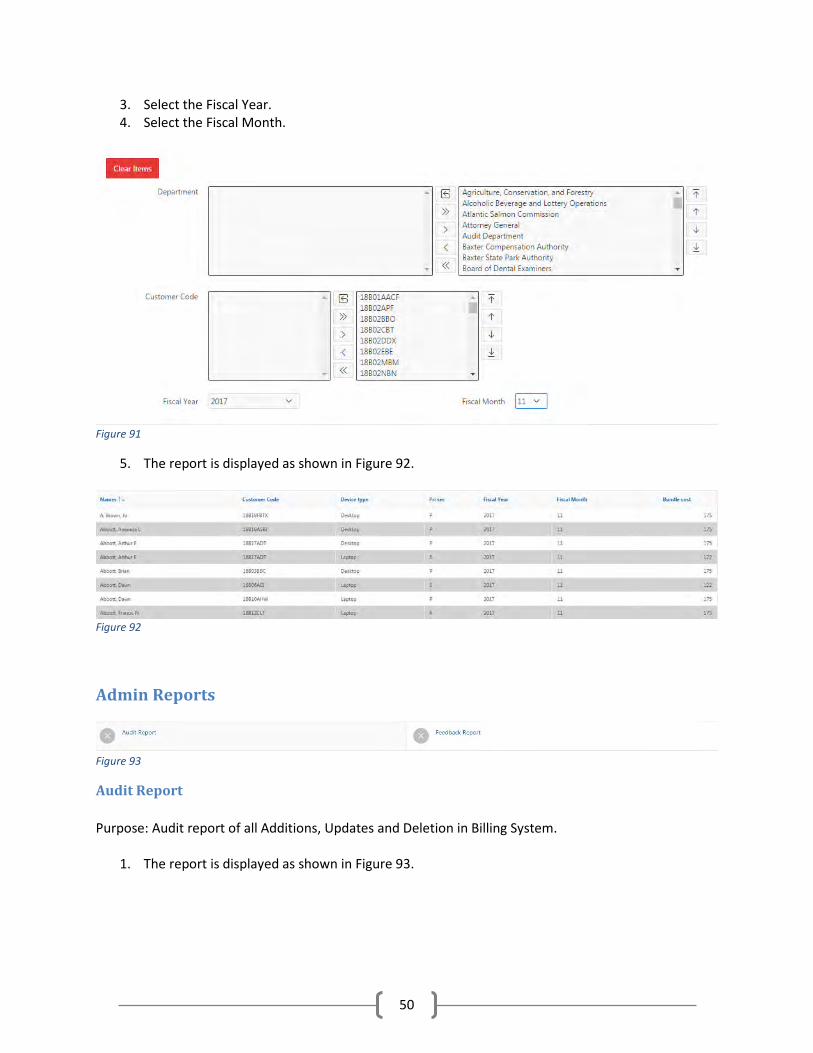
50
3. Select the Fiscal Year. 4. Select the Fiscal Month.
Figure 91
5. The report is displayed as shown in Figure 92.
Figure 92
Admin Reports
Figure 93
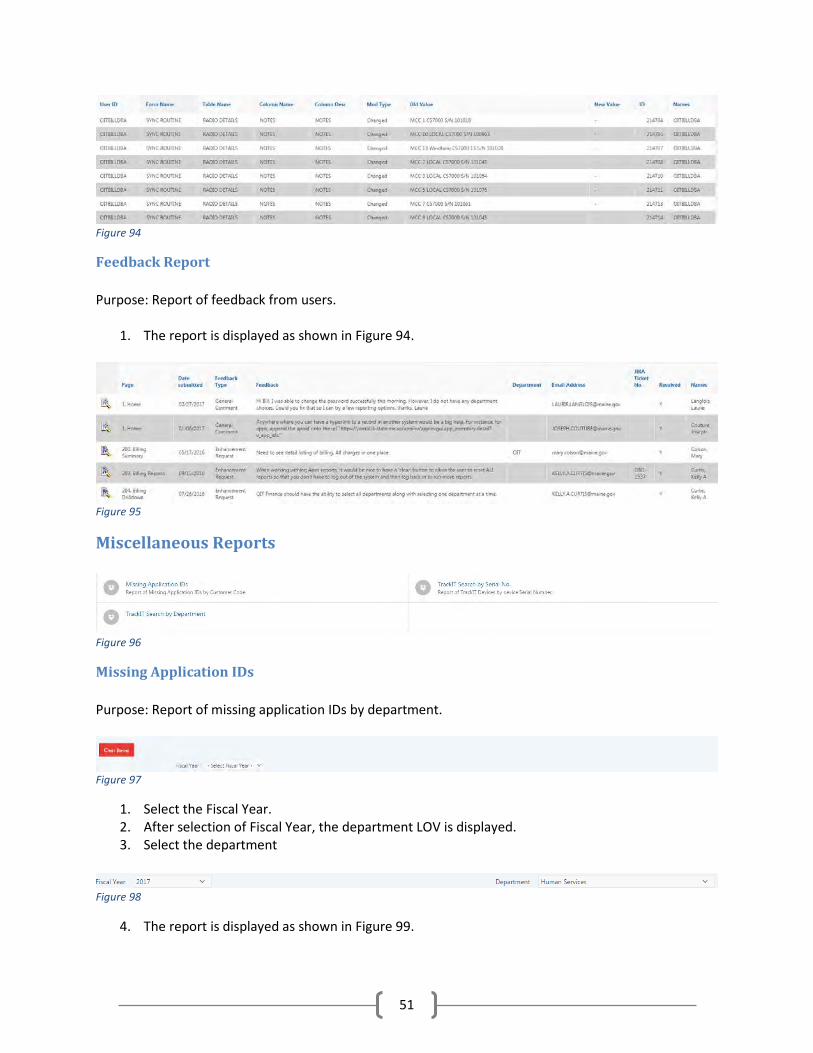
Audit Report Purpose: Audit report of all Additions, Updates and Deletion in Billing System.
1. The report is displayed as shown in Figure 93.
51
Figure 94
Feedback Report Purpose: Report of feedback from users.
1. The report is displayed as shown in Figure 94.
Figure 95
Miscellaneous Reports
Figure 96
Missing Application IDs Purpose: Report of missing application IDs by department.
Figure 97
1. Select the Fiscal Year. 2. After selection of Fiscal Year, the department LOV is displayed. 3. Select the department
Figure 98
4. The report is displayed as shown in Figure 99.
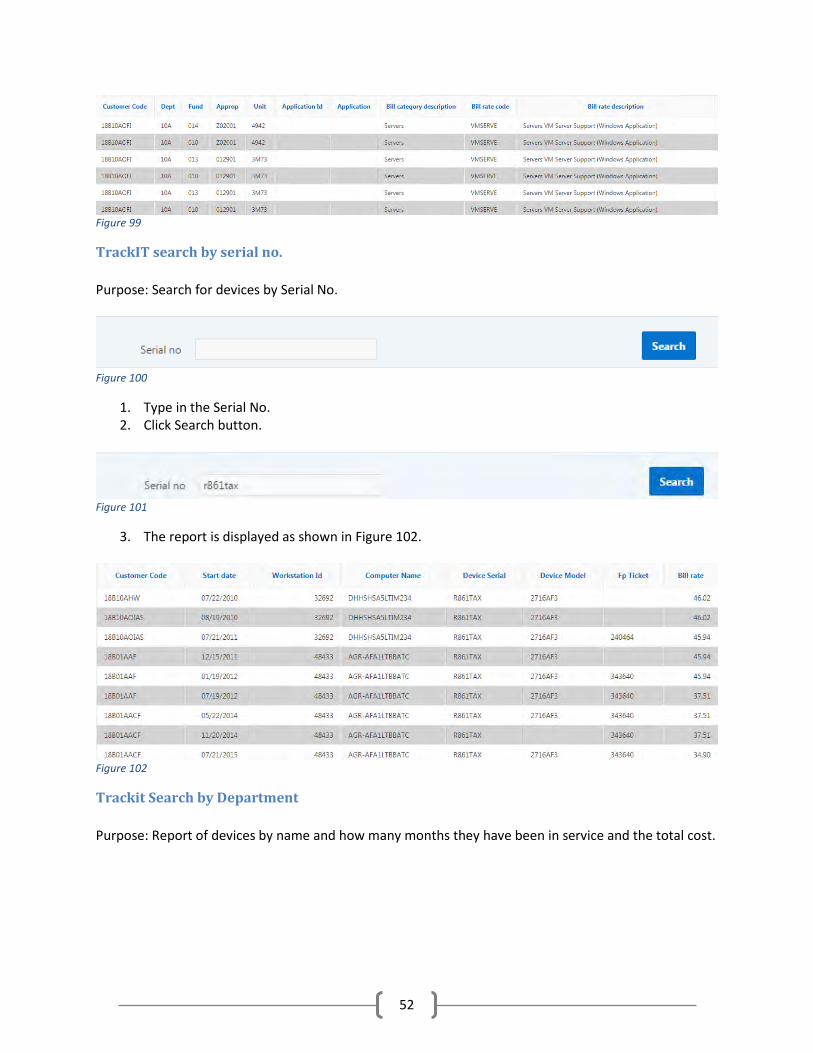
52
Figure 99
TrackIT search by serial no. Purpose: Search for devices by Serial No.
Figure 100
1. Type in the Serial No. 2. Click Search button.
Figure 101
3. The report is displayed as shown in Figure 102.
Figure 102
Trackit Search by Department Purpose: Report of devices by name and how many months they have been in service and the total cost.
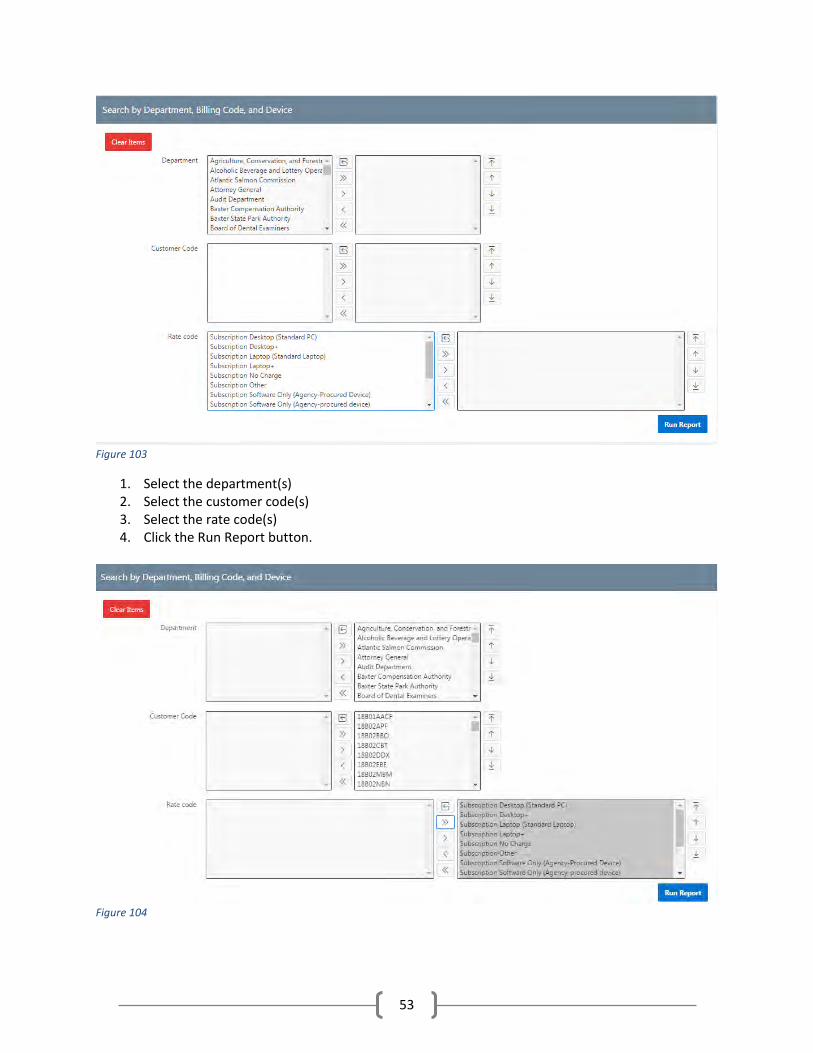
53
Figure 103
1. Select the department(s) 2. Select the customer code(s) 3. Select the rate code(s) 4. Click the Run Report button.
Figure 104