Embed Size (px)
Citation preview

EB:tSCO SERVICES INCORPORATED
400 11fti. A ... t::r n.le l'1E, Bellevue, WA 98004, (206) 451-4500
Mr. Robert Mohn Alaska Power Authority 334 West 5th Avenue Anchorage, Alaska 99501
February 7, 1983 EN~J-NSG-L-83-
E~Wi:O
HARZJ\~EBASCO Susitna Joint Venture
Document Number
Please· Return To
DOCUMENT CONTROL
SUBJECT: NORTH SLOPE GAS FEASIBILITY STUDY DRAFT FINAL REPORT FINAL COST RELATED SECTIONS
Dear ~1r. Mohn:
Attached for your review and use are the subject sections. For the North Slope and Fairbanks scenarios a wellhead value of $1.50/MMBtu has been assumed, and for the Kenai scenario a delivered gas price of $4.00/MMBtu has been assumed for both "waste" gas and sales gas from the Trans Alaska Gas System. The table presented below itemizes the differences between each scenario's Total System Cost with and without fuel costs.
North Slope
Medium Forecast Low Forecast
Fairbanks
Power Generation f4edi um Forecast Low Forecast
Gas D·rstri buti on Medium Forecast Low Forecast
Kenai
Medium Forecast Low Forecast
Tota 1 System Costs (Mi 11 ions of 1982 Do 11 Ul"S) With Fue 1 Without Fue 1 -
4,778 3,206
6,176 3,909
936 1,073
5,608 4,021
3,757 2,705
5,202 3,431
891 1,050
2,048 1,673
Should you wish us to revise the draft report to include fuel cost sections, please advise.
Very truly yours,
EBASCO SERVICES INCORPORATED
JEB~klb John E. Butts

WORKP AGE FROf~ CHAPTER 3
Pages 1-3
Fuel costs for the 10\t gt"O\"Jth scenario are identical to those
associ a ted ~~i th the medium grm·Jth scenario. The gas price is assumed
to be $1.50/million Btu and the real escalation rate is assumed to be 2% per year.
2o95B
-1-

fl: '·'
TABLE 3-6
TOTAL ANNUAL FUEL COST REPORT NORTH SLOPE POWER GENERATION - LOW LOAD FORECAST
0~11 11 ions of January, 1982 Do 11 ars)
Ca 1 en dar Year
1982 1983 1~84 1985 lY86 1987 1988 1989 ]990 1991 1992 1993 1994 1995 1996 1997 1998 1999 2000 2001 2002 2003 2004 2005 2006 2007 2008 2009 2010
TOTAL
Electricity Generated!!
0. 0. 0. 0. 0. 0. 0. 0. 0. 0. 0. 0. 0. 0.
13.7 27.8 28.3 28.9 29.5 30.0 46.0 62.5 63.9 97.6 99.5
101.5 116.3 122.5 128.9
$997.
Y Assumes fuel price escalation at 2%/yr above inflation.
2u95B
-2-
Calendar Year
1982 1983 1984 1 ~<35 1986 1987 1~88 1989 19~0 1991 1!192 1993 1 !:J94
(,' 1995 1996 l!:J97 19Y8 l!:J99 ~000 2001 ~002 2003 2004 2005 2006 2007 2008 2009 2010
Total
Present Worth @ 3%
26958
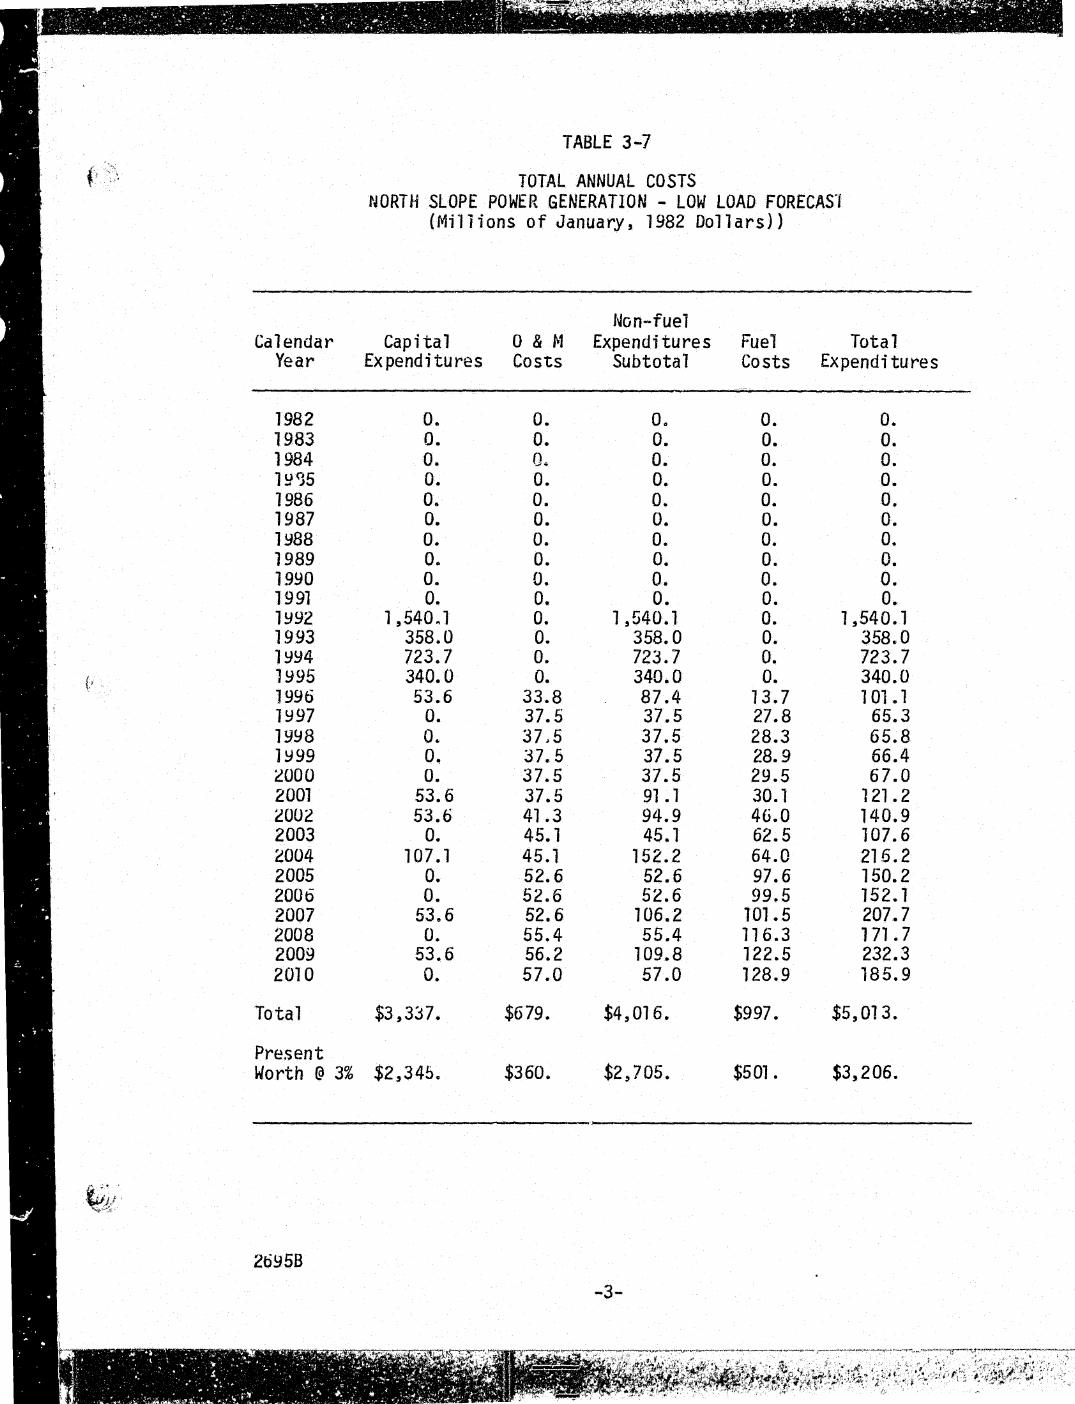
TABLE 3-7
TOTAL ANNUAL COSTS NORTH SLOPE POWER GENERATION - LOW LOAD FORECAS'l
(Millions of January, 1982 Dollars))
Non-fuel Capital 0 & ~1 Expenditures Fuel Total
Expenditures Costs Subtotal Costs Expenditures
0. 0. 0. 0. D. 0. 0. 0. 0. 0. 0. 0 .. 0. 0. 0. 0. 0. 0. 0. 0. 0. 0. 0. 0. 0. 0. 0. o. 0. 0. 0. 0. 0. 0. 0. 0~ 0. 0. 0. 0. 0. 0. 0. 0. 0. 0. 0. 0. 0. D.
1 ,540~ 1 0. 1,540.1 0. 1 ,540. 1 358.0 0. 358.0 0. 358.0 723.7 0. 723.7 0. 723.7 340.0 0. 340.0 0. 340.0 53.6 33.8 87.4 13.7 l 01 01
0. 37.5 37.5 27.8 65.3 0. 37,5 37.5 28.3 65.8 o. 37., 5 37.5 28.9 66.4 0. 37.5 37.5 29.5 67.0
53.6 37.5 91 . 1 30.1 121.2 53.6 41 .3 94.9 46.0 140.9
0. 45.1 45.1 62.5 107.6 107.1 45.1 152.2 64.0 215.2
0. 52.6 52.6 97.6 150.2 0. 52.6 52.6 99.5 152.1
53.6 52.6 106.2 101.5 207.7 0. 55.4 55.4 116.3 171.7
53.6 56.2 109.8 122.5 232.3 o. 57.0 57.0 128.9 185.9
$3,337. $679. $4,016. $997. $5,013.
$2,345. $360. $2' 705. $501. $3,206.
-3-

C . . , "'
WORKPAGE FROM CHAPTER 2
Pages 4-6
Fuel costs for· the North Slope power generation scenario, medi urn 1 oad fur·'=cc.tst, are estimated to be $1 oSO per mill ion Btu (1982 dollars), and they are expected to esc a 1 ate at 2:1,/yr above the assumed gene;--al rate of inflation. All economic analyses in this study are based upon these values.
The $1.50 per million Btu value is based upon studies by The Governor's Economic Committee (1983), Hhich place the economic value of the gas~ before transport costs, at $0.73 to $2.22 per million Btu in 1988
dollars. These values, discounted at a 7% inflation rate (The Governor's Economic Committee 1983) to the year 1Y82, yield a range in price of $0.49 to $1.48 per million Btu in 1982 dollars. TI1e higher value is more conservative, and consistent with the nature of the present study. The real fuel escalation rate of 2% is consistent with
the most likely scenario defined by the Battelle studies for the Rdi 1 be 1 t r·egi on.
26958
-4-

TABLE 2-10
TOTAL ANNUAL FUEL COSTS NORTH SLOPE POWER GENERATION - MEDIUM LOAD FORECAST
(Millions of Janua, ry, 1982. Do 11 ars)
Calendar Year
1982 1983 1984 1985 1986 1987. 1~88 1989 1~90 1991 lY92 l9Y3 1Y94 1995 1996 1997 1998 1999 2000 2001 2002 2003 2004 2005 2006 2007 2008 2009 2010
Total
Electricity Generation!!
0. 0. 0. 0. 0. 0. 0. 0. 0. 0. 0.
12.826 13.082 26.688 40.947 55.510 70.781 72.197 88.374 90.141
122.601 125.053 143.901 157.225 167.944 179.000 190.461 202.279 214.523
$1,974 ..
i/ Assumes fuel price escalation at 2%/yr above inflatione
2u95B
-5-
f
I~ ' 1
.
r ~.
f t . (
I:
f !:
v f
lr '. 'o
"
~ t;
r: ~~ . r J

• t' ' .. , 'y
Calendar Year
1983 1984 1985 1986 1987 1988 1989 1990 1991 1992 l!J93 1994 1995 1996 1997 1998 1999 2000 2001 2002 2003 2004 2005 2006 2007
. 2008 2009 2010
Total
Present Worth @ 3%
26958
TABLE 2-11
TOTAL ANNUAL SYSTEt~S COST NORTH SLOPE POWER GEtJERATION - MEDIUM LOAD FORECAST
(Ni 11 ions of January, 1982 Dollars)
Non-fuel Capital 0 & M Expenditures Fuel Total
Expenditures Costs Subtotal Costs Expenditures
04 0. 0. 0. o. o. 0'" 0. 0. 0. 0. 0. 0. 0. 0., o., 0. 0. 0. 0. 0. 0. 0. 0. 0. o. 0. 0. 0. 0.
1,803.3 0. 1,803.3 0. 1 ,80 3. 3 418.5 o. 418.5 0. 418.5 842.6 0. 842.6 0. 842.6 388.3 0. 388.3 0. 388.3
o. .38.8 38.8 12.8 51 .6 53.6 38.8 92.4 13.1 105.5 53.6 42.5 96.1 26.7 122.8 53.6 46 .. 3 99.9 40,9 140.8 53.6 50.1 103.7 55.5 159.2
0. 53.8 53.8 70.8 124.6 53.6 53.8 107.4 72.2 179.6
0. 57.7 57.7 88.4 146.1 107.1 57.6 164.7 90.1 254.8
o. 65.1 65.1 122.6 187.7 53.6 65.1 118.7 125.1 243.8
107.1 69.0 176.1 144.0 320.1 53 .. 6 71.4 125.0 157.2 282.2 53.6 73.1 126.7 1 G7 .• 9 294.6 53.6 74.8 128.4 179. D 307.4
0 • 76.b 76.6 190.5 267.1 53.6 7e.3 131.9 202.3 334.2
o. 80.0 80.0 214.5 294.5
$4,202. $1,093. $5,295. $1,974 $7,259.
$3,156. $600. $3,7 57. $1 ,022. $4,778.

" l. •,/
Calendar Year
1~83 1984 1985 1986 1987 1988 1989 1990 1991 1992 1~93 1994 1~95 1996 1997 1998 1999 2000 2001 2002 2003 2004 2005 2006 2007
. 2008 2009 2010
Total
Present Worth @ 3%
26958
TABLE 2-11
TOTAL ANNUAL SYSTEMS COST NORTH SLOPE POWER GEtJERATION - f4EDIU~1 LOAD FORECAST
(Nillions of January, 1982 Dollars)
Non-fuel Cdpital o & M Expenditures Fuel Total
Expenditures Costs Subtotal Costs Expenditures
0. 0. 0. 0. 0. 0. 0. 0. o. 0. 0 .. 0. 0. o. Oe o. Oe 0. 0. 0. 0. 0. 0. 0. 0. o. 0. 0. 0. 0.
1,803.3 0. 1,803.3 0. 1,803.3 418.5 0. 418.5 0. 418.5 842.6 0. 842.6 0. 842.6 388.3 0. 388.3 0. 388.3
o. 38.8 38~8 12.8 51 .6 53.6 38.8 92.4 13. l 105.5 53.6 42.5 96. l 26.7 122.8 53.6 46.3 99.9 40.9 140.8 53.6 50. i 103.7 55.5 159.2
0. 53.8 53.8 70.8 124.6 53.6 53.8 107.4 72.2 179.6
o. 57.7 57.7 88. Ll,. 146.1 107.1 57.6 164.7 90.1 254.8
o. 65.1 65.1 122.6 187.7 53.6 65.1 118.7 125.1 243.8
107.1 69.0 176.1 144.0 320.1 53.6 71.4 125.0 157.2 282.2 53.6 73. l 126.7 1G7.9 294.6 53.6 74.8 128.4 179.0 307.4
0. 76.b 76.6 190.5 267.1 53.6 78.3 131.9 202.3 334.2
0. 80.0 80.0 214.5 294.5
$4,202. $1 ,093. $5,295. $1,974 $7,259.
$3,156. $600. $3,7 57. $1 ,022. $4,778.
-6-

WORKPAGE FROM CHAPTER 4 Pages 7-11
4.5.2.1 Gas Pipeline and Conditioning Facility
Annual Operating and maintenance costs (January 1982 dollars) for the gas conditioning facilities are estimated to be as follows:
ITEM
Sal aries Maintenance Costs (Parts and
Expendables) Fuc:l Costs Electrical Costs
TOTAL
{ $1 000) AMOUtJT
$2,480
3,750 6,650 4,900
$17,780
Anuual operating and maintenance costs (January 1982 dollars) for the gas compressor stations and pipeline maintenance activities are estimated to be as follows:
26958
ITEM
Sal aries Maintenance Costs (Parts,
Expendables, Other) Fuel Costs
TOTAL
-7-
( $1 000) Af.10UNT
$ 4,400
5,850 5,470
$15,720

Fuel costs for the Fairbanks medium growth scenario are assumed to be
identical to those fuel costs assa•:iated \'lith the North Slope Po\ler
Generation scenarios. Tnese costs are assumed to be $1.50/million Btu
(1982 dollars), escalated at a re-al rate of 2 pel"Cent per year.
The reason for using ~1ellhead gas costs in the Fairbanks scenario is
that all other fuel price related costs are explicitly considered in
the total systems cost analysis. Such costs include the gas
conditioning facility at the Nor1:h Slope, and the gas pipeline fl"om the
North Slope to Fairbanks. To raise the gas price from the wellhead
value \IOUl d necessarily be udoubl e counti ng 11 of costs associ a ted with
gas conditioning.and transportation.
26958
-8-

f0 ·~ -~ ; '; >
Calendar Year
1982 1983 1984 1985 1986 1Y87 1988 1989 1990 1991 1992 1993 1994 1995 19Y6 1997 19Y8 1999 2000 2001 2002 2003 2004 2005 2006 2007 2008 2009 2010
Total
TABLE 4-21
TOTAL ANNUAL FUEL COST REPORTl/ FAIR BANKS POtiER GENERATION - MEDIUM LOAD FORECAST
{Millions of January, 1982 Dollars)
Gas Electricity Conditioning Generated Pipeline Plant
0. 0. 0. 0. 0. 0. 0. 0. 0. 0. 0. 0. 0 .. 0. 0. o. 0. 0. 0. 0. 0. 0. 0. 0. 0. o. 0. 0. 0. 0. 0. 0. 0.
12.223 5.49 11.59 12.468 4.80 10.14 25.435 5.24 11.06 26.154 4.93 10.40 53.072 5.5Y 11.80 54.284 5.70 12.04 55.370 5.74 12.12 70.704 6.16 13.01 71.926 6. 20 13.10 88.139 6.48 13.70 89.902 6 .. 62 13.97
107.185 6. 91 14.59 113.339 7.05 14.88 125.009 7.28 15.36 136.803 7.42 15.66 137.297 7.57 15.98 149.687 7. 71 16.30 162.329 7.96 16.82
$1 ,491 . $115. .$243.
l! Assumes fuel price escalation at 2%/yr above inflation.
26Y5B
-9-
Total
0. 0. 0. 0. 0. 0. 0. 0. o. 0. 0.
29.3 27.4 41.7 41.5 70.5 72.0 73.2 89.9 91.2
108.3 110.5 128.7 135.3 147 ~6 159.9 160.9 173.7 187.1
$i,849 •

Ca 1 endar Year
1983 1984 1985 1986 1987 1988 1Y89 19~0 1991 1992 1993 1994 1995
L. 1996 l9Y7 1998 l!JY9 2000 2001 2002 2003 2004 2005 2006 2007 2008 2009 2010
Total
Present Worth @ 3%
2695B
TABLE 4-22
TOTAL ANNUAL COSTS FAIRBANKS POWER GENERATION - MEDIUM LOAD FORECAST
{Millions of January, 1982 Dollars)
Non-fuel Capital 0 & t4 Expenditures Fue1 Total
Expenditures Costs Subtotal Costs Expenditures
0 . 0. 0. 0. 0. . 0. . 0. 0. 0. 0. o. 0. 0. 0. 0. o. 0. 0. 0. 0. 0. 0. 0. 0. 0.
499.8 0. 499.8 0. 499.8 1,431 ~2 0, 1,431.2 0., 1 ,431 ~ 2 1,865.3 0. 1,865.3 o. 1,865.3 1, 737.3 0. 1,737.3 0. 1~737.3
33.9 0. 33.9 0. 33.9 0. 28.1 28.1 29.3 57.4
33.9 26.1 60.0 27.4 87.4 57.0 29.2 86.2 41.7 127.9 67.8 30.1 97.9 41.5 139.4 57.0 35.9 92.9 70.5 163.4
0. 37,.7 37.7 72.0 109.7 33.9 37.6 71 ~ 5 73.2 144.7
0. 40.5 40.5 89.9 130.4 90.9 40.3 1 Jl .2 9l.Z 222.4
o. 44.8 44.8 108.3 153.1 33.9 44.8 78.7 11 0.5 189.2 90.9 47.4 138.3 128.7 267.0 33.9 49a 1 83.0 135.3 218.3 33.9 50.4 84.3 147.6 231.9 33.9 51.5 85.4 159.9 245.3 33.9 52.6 86.5 160.9 247.4 33.9 53.7 87.6 173.7 261 .3
o. 54.9 54.9 187.1 242.0
$6,240. $755. .$6,994. $1,849. $8,843.
$4,787. $415. $5,202. $974. $6,176.
-10-
t
26958
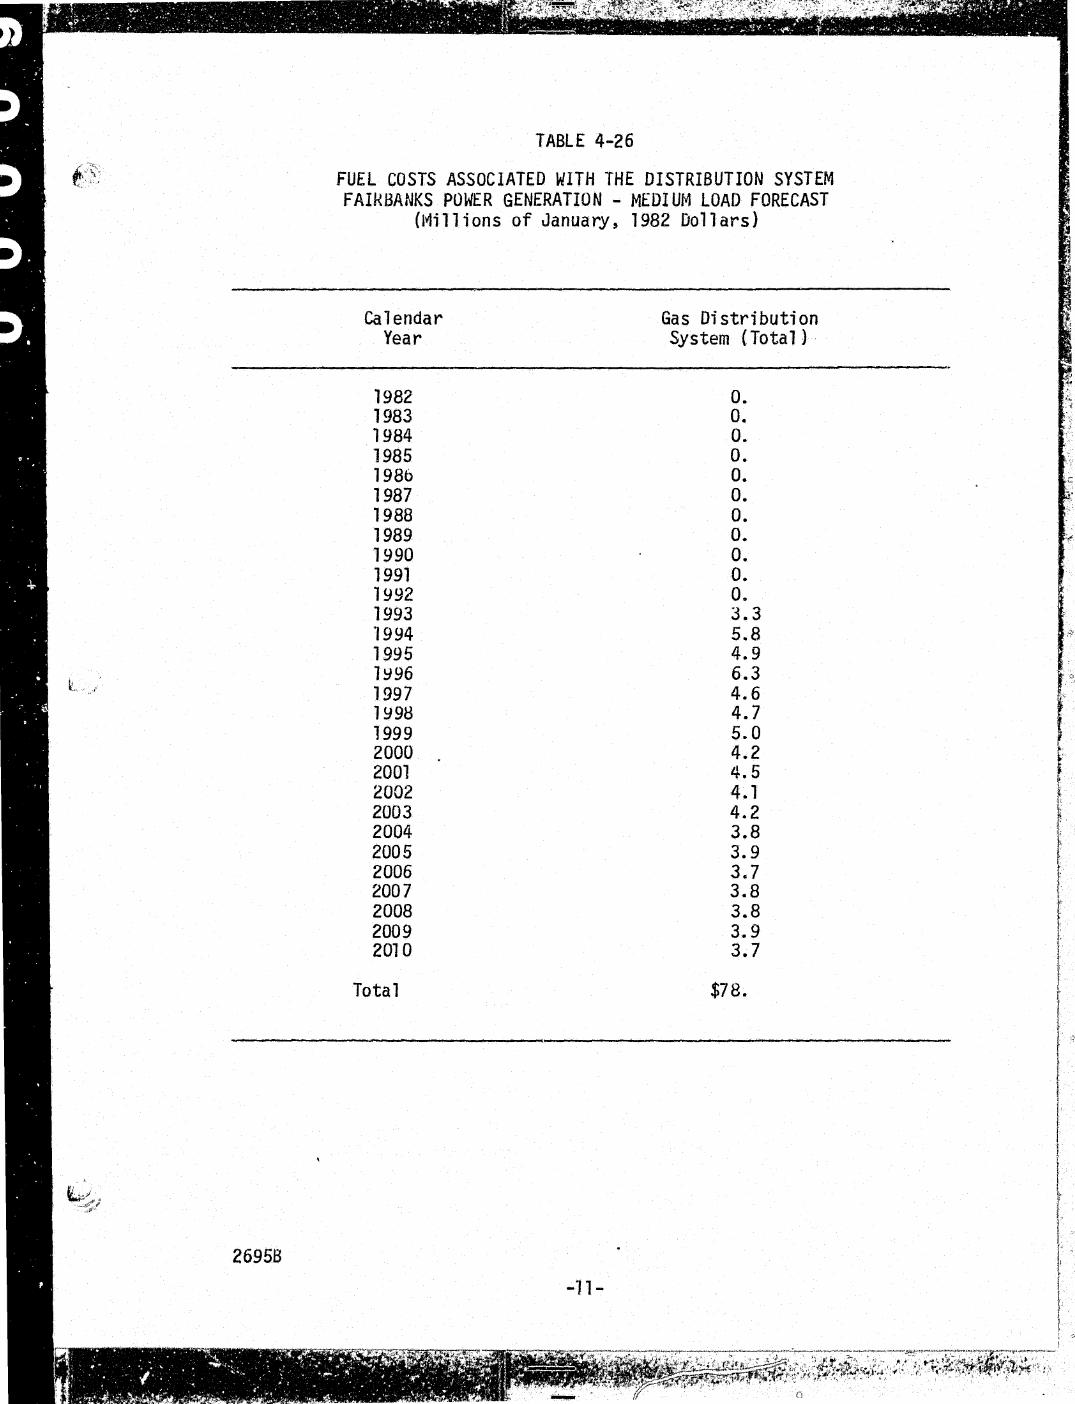
TABLE 4-26
FUEL COSTS ASSOCIATED WITH THE DISTRIBUTION SYSTEM FAIHBANKS POWER GENERATION - MEDIUI~ LOAD FORECAST
(l~illions of January, 1982 Dollars)
Ca 1 en dar Year
1982 1983 1984 1985 1986 1987 1988 1989 1990 1991 1~92 1993 1994 1995 1~96 1997 1 ~98 1999 2000 2001 2002 2003 2004 2005 2006 2007 2008 2009 2010
Total
-11-
Gas Distribution System {Total)
0. o. 0. 0. 0. 0. 0. 0. 0. 0. 0. 3.3 5.8 4.9 6.3 4.6 4.7 5.0 4.2 4.5 4.1 4.2 3.8 3.9 3c7 3.8 3.8 3.9 3.7
$78.

WORKPAGE FROM CHAPTER 5 Pages 12-17
Gas Pipeline and Conditioning Facility
Annual operating and maintenance costs (January, 1Y82 dollars) for the gas conditioning facilities are estimated to be as follows:
Item
Sal aries Maintenance Costs
(Parts and Expendables) Fuel Costs Electrical Costs
TOTAL
Annual Costs ($1000)
$1,390 2,100
3,720 2,740
$9,950
Annual operating and maintenance cost (January 1982 dullars) for the gas compressor s-cations and pipeline maintenance activities are estimated to be as follows:
2695B
Item
Sal aries Main-cenance Costs (Parts and Expendables) Fuel Costs
TOTAL
-12-
~1nual Costs ($1000)
$2,090 1,750
1,640
$5,480
Calendar Year
1982 1983 1984 1985 1986 1987 1988 1989 1990 1991 1992 1993 1994 1995 1996 1997 1998 1999 2000 2001 2002 2003 2004 2005 2006 2007 2008 2009 2010
Tota•t
Present
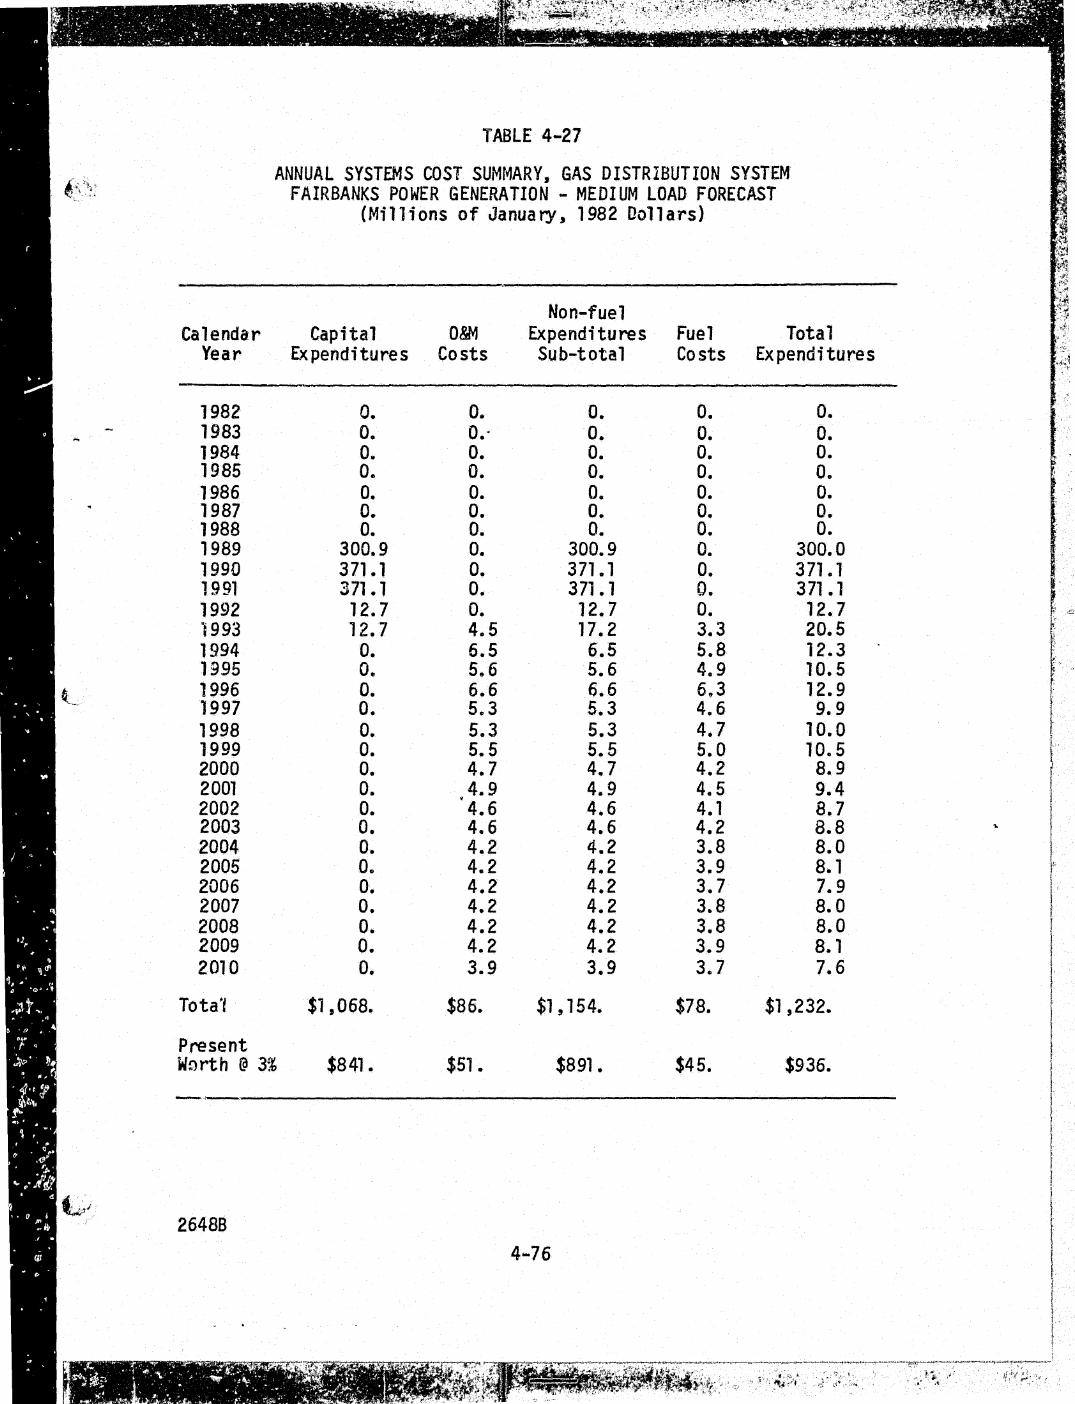
TABLE 4-27
ANNUAL SYSTEMS COST SUMMARY, GAS DISTRIBUTION SYSTEM FAIRBANKS POWER GENERATION - MEDIUM LOAD FORECAST
(Millions of January, 1982 Dollars)
Non-fuel Capital O&M Expenditures Fuel Total
Expenditures Costs Sub-total Costs Expenditures
0. o. 0. 0. 0. o. 0 •. o. 0. 0. 0. o. 0. 0. 0. o. 0. 0. o. 0. o. 0. 0 .. 0. o. o. 0. 0. o. o. 0. 0. 0. 0. o.
300.9 0. 300.9 0. 300.0 371.1 0. 371.1 o. 371 .. 1 371.1 0. 371.1 0. 371 .1 12.7 0. 12.7 o. 12.7 12.7 4.5 17.2 3.3 20.5
0. 6.5 6.5 5.8 12 .. 3 0 .. 5 .. 6 5.6 4.9 10.5 o. 6.6 6.6 6 .. 3 12.9 o. 5.3 5.3 4.6 9.9 o. 5.3 5.3 4.7 10.0 0. 5.5 5.5 5.0 10.5 o. 4.7 4.7 4.2 8.9 0. 4.9 4.9 4.5 9.4 o. 4.6 4.6 4.1 8.7 o. 4.6 4.6 4.2 8.8 o. 4.2 4.2 3.8 8.0 o .. 4.2 4.2 3.9 a. 1 o. 4.2 4.2 3.7 7.9 0. 4.2 4.2 3.8 8.0 0. 4.2 4.2 3.8 8.0 o. 4.2 4.2 3.9 8. 1 0. 3.9 3.9 3.7 7.6
$1 ,068. $86. $1 '154. $78. $1,232.
Worth @ 3% $841. $51. $891. $45. $936.
--~!
26488 4-76
.,;,
...

..... , .. r:,. l
Fuel costs for the Fairbanks low growth scenario are identical to those for the medium growth scenario. Natural gas is assumed to cost $1.50/million Btu (1982 dollars), and is assumed to escalate in price . at a rate of 2 percent (real escalation) per year.
26958
-13-

26958
TABLE 5-8
ANNUAL FUEL.COST REPORTll FAIRBANKS POWER GENERATION - LOW LOAD FORECAST
(Mi 11 ions of January~ 1982 Dollars)
-14-

Calendar Year
1983 1!184 1985 1986 1987 1988 1989 1990 1991 1992 1993 1994 1995 1996 1997 1998 1999 2000 2001 2002 2003 2004 2005 2006 2007 2008 2009 2010
Total
Present Worth @ 3%
26958
TABLE 5-9
TOTAL ANNUAL COSTS
'.-_\.\
FAIRBANKS POWER GENERATION - LOW LOAD FORECAST (Millions of January, 1982 Dollars)
Non-fuel Capital 0 & 1"4 Expenditures Fuel Total
Expenditures Costs Subtotal Costs Expenditures
o. o. 0. 0. 0. o. o. Oa 0. 0. 0. o. 0. 0. 0. o. Oo 0. 0. D. 0. o. 0. 0. o. o. 0. 0. 0. 0. 0. 0. 0. 0. 0. o. o. 0. 0. 0. o. 0. 0. 0. 0.
311.3 0. 311.3 0. 311.3 1 ,21 0.3 0. 1 '21 0.3 0. 1 ,21 0. 3 1,476.4 0. 1,476.4 0. 1,476.4 1,392.5 0. 1,392.5 0. 1 ,392. 5
33.9 16.3 50.2 21.0 71 .'2 0. 18.5 18.5 34.6 53. l 0. 18.0 18.0 34.6 52.6 o. 17.6 17.6 34.6 52.2
57.0 17.2 74.2 34.8 109.0 33.9 19.0 52.9 35.6 88.5
0. 21.9 21.9 51.9 73.8 33.9 21.9 55.8 52.9 108.7 57.0 24.6 81.6 69.9 151.5 33.9 26.4 60.3 71.3 131.6
0. 28.8 28.8 88.9 117.7 33.9 28.8 62.7 90.7 153.4
o. 30.1 30.1 102.7 132.8 0. 30.7 30.7 107.8 138.5 o. 31 .1 31 .1 103.3 134.4
$4,718. $351. $5,069. $934. $6,003.
$3,246. $185. $3,431. $478. $3909.
-15-
_...,.......__~.,.,.._--....... ., ................. ....._ .. __ .,,_........._ .... _,.., ...... _ .......... __ .._ ..... __ .................. ~-~~-""""·~· ..... ~ ... -~~·--·-...... -~.___,..._.. .... ~~·~~·....-.....~--.... -· . .,. ..... ._...._"-...... ._. .......... ~ . . ,'.• '. . ·= ::t'J' ,'.~ . r:'~'·.'·. ,, , 1 ~ '"~. r • . . " . l ., .'1 • t;; !
\)

26958
TABLE 5-13
FUEL COSTS ASSOCIATED WITH THE DISTRIBUTION SYSTEM FAIRBANKS POl!JER GENERATION - LOW LOAD FORECAST
{Millions of January, 1982 Dollars)
Ca 1 en dar Year Fuel Cost
1982 0. 1983 0. 1984 0. 1985 0. 1986 0. 1987 0. 1988 0. 1989 0. 1990 0. 1991 o. 1992 0. 1993 0. 1994 0. 1995 0. 1996 1. 8 1997 1.9 1998 2.7 1999 3.4 2000 4.0 2001 4.2 2002 3.2 2003 3.3 2004 2.8 2005 2.8 2006 2.5 2007 2.6 2008 2.3 2009 2.4 2010 2.6
Total $43.
-16·
~a ·~, '•\

TABLE 5-14
ANNUAL SYSTENS COST SUMMARY FOR THE GAS DISTRIBUTION SYSTEM FAIRBANKS POWER GENERATION - LOW LOAD FORECAST
(Nill ions of January, 1982 Do 11 ars)
Total Calendar Non-fuel
Year Capital Cost 0 & M Cost Costs Fuel Cost Total Cost
1982 0. 0. 0 0. 0. 1983 0. o. 0. 0. 0. 1984 0. 0. 0. 0. 0. 1985 0. o. 0. 0. 0. 1986 0. 0. 0. 0. 0. 1987 0. o. 0. O:o 0. 1988 0. 0. 0. 0. 0. 1989 0. o. 0. 0. 0. 1990 0. o. 0. 0. 0. 1991 0. o. 0. 0. 0. 1992 0. 0. 0. 0. o. 1993 433.0 0. 433.0 0. 433.0 1!194 505.6 Oa 505.6 0. 505.6 1995 505.6 0. 505.6 0. 505.6 1996 1~ .. 0 2.3 14.3 1.8 16.1 1997 12.0 2.3 14.3 1.9 16.2 1998 0. 2.8 2.8 '2..7 5.5 1999 0. 3.2 3.2 3.4 6.6 2000 0. 3.6 3.6 4.0 7.6 2001 0. 3.7 3.7 4.2 7.9 2002 0. 3,0 3.0 ~ ,.
v-.t:. 6.2 2003 0. 3.0 3.0 3.3 6.3 2004 o. 2.6 2.6 2.8 5.4 2005 0. 2.6 2.6 2.8 5.4 2006 0. 2.4 2.4 2.5 4.9 2007 0. 2.4 2.4 2.6 5.0 2008 0. 2.3 2.3 2.3 4.6 2009 0. 2.3 2.3 2.4 4.7 2010 0 .. 2.3 2.3 2.6 4.9
Total $1 ,468. $41. $1 ,509. . $43. $1,552 .
Present Worth at 3% $1,027. $22. $1 ,050. $23. $1 ,073.
26958
-17-
.·.
"
()

WORKP AGE FROl4 CHAPTER 6 Pages 18-20
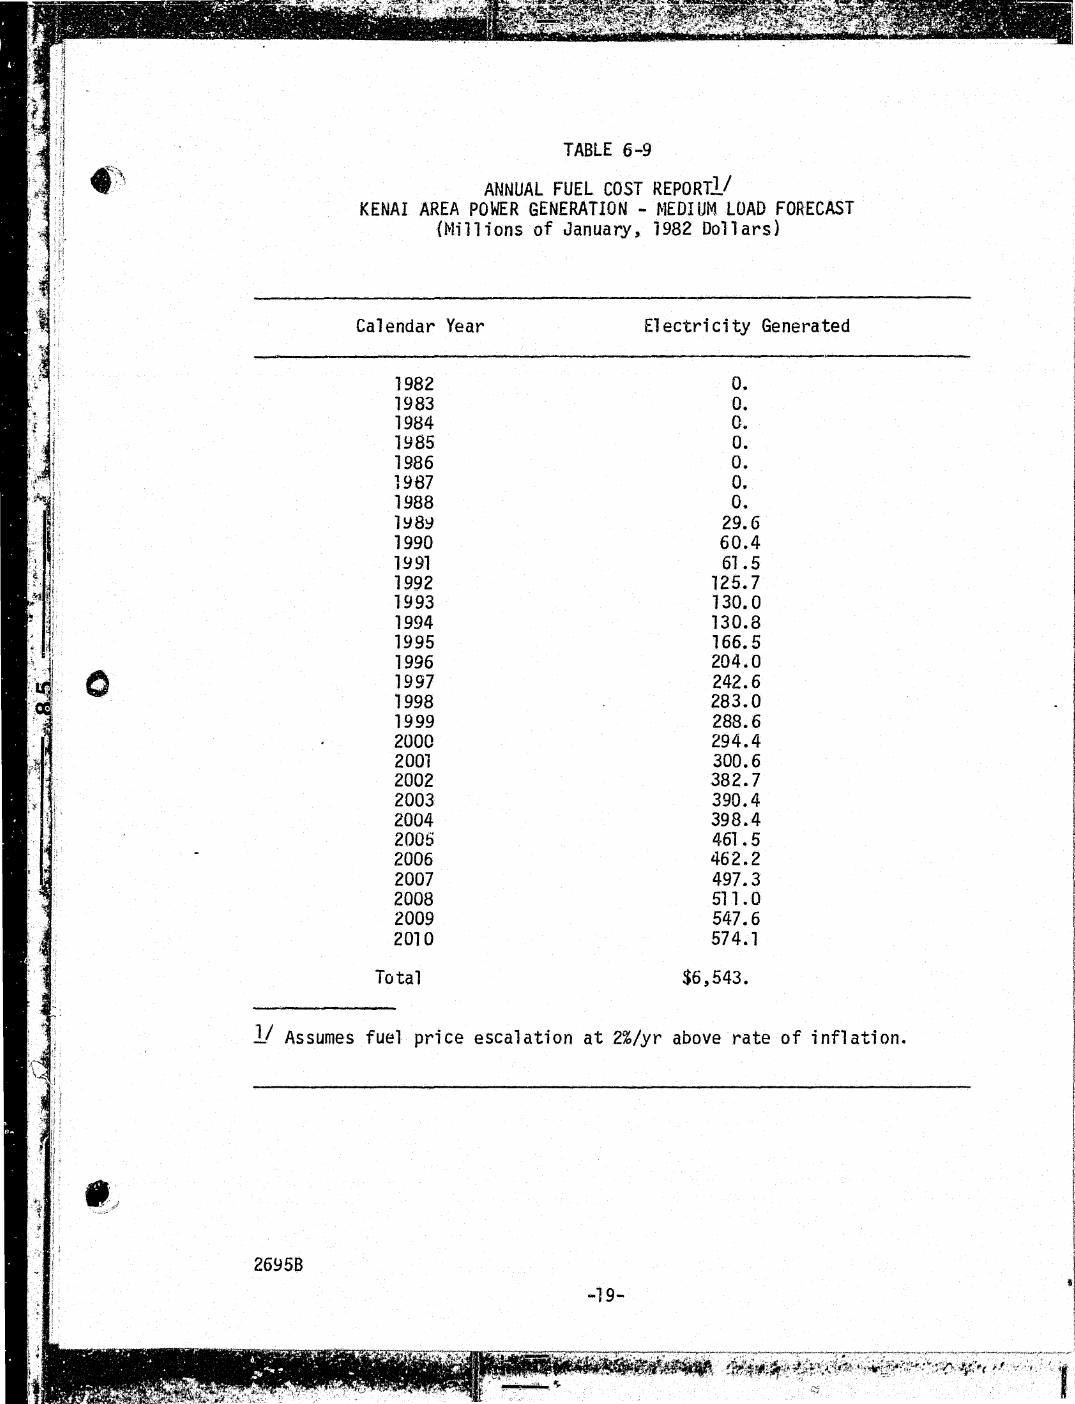
Fuel costs for the Kenai medium load forecast differ from those associated ~lith the North Slope or Fair-banks scenarios. The costs associated with the pipaline and gas conditioning must be subsumed into the fuel cost in this case. The Governor's Economic Committee on North Slope Natural Gas (1983) places the price of gas, delivered in South Alaska, at $4.67-$6.16/million Btu in 1988 dollars for the total system. Assuming an inflation rate of 7 percent (The Governor's Economic Corrrnittee on North Slope Natural Gas, 1983), these values are equivalent to $3.11 to $4.10/million Btu in 1Y82 dollars. Consistent with the conservative approach employ~d for the North Slope scenario (see Section 2.4.3), this analysis uses the higher of the two numbers as a guideline, and consequently uses a price of $4.00/million Btu for analytical ~urposes. Again the 2 percent real fuel escalation rate, as discussed previously, is employed.
2695B
-18-
:.~._.,
'·'
0
TABLE 6-9
ANNUAL FUEL COST REPORTll KENAI AREA POWER GENERATION - ~1EDI UM LOAD FORECAST
(~ti 11 ions of January, 1982 Dollars)
Calendar Year
1982 1983 1984 1~85 1986 1987 1988 1Y8Y 1990 1991 1992 1993 1994 1995 1996 1997 1998 1999 2000 2001 2002 2003 2004 2005 2006 2007 2008 2009 2010
Total
El ectri city Generated
0. 0. 0. 0. 0. 0. 0.
29.6 60.4 61 .5
125.7 130.0 130.8 166.5 204.0 242.6 283.0 288.6 294.4 300.6 382.7 390.4 398.4 461.5 462.2 497.3 511.0 547.6 574.1
$6,543.
11 Assumes fuel price escalation at 2%/yr above rate of inflation.
26958
-19-
r
I l I I
I'
I I l t
f I·
.l l J '
11 "' :~ :.~. ;,,. -- ' ' ~ .,, ,'
. \]

Ca 1 en dar Year
1982 1983 1984 1985 1986 1987 1988 1989 1990 1991 1992 1993 1994
0 1995 1996 1997 1998 1999 2000 2001 2002 2003 2004 2005 2006 2007 2008 2009 2010
Total
Present Worth @ 3%
• £6958
TABLE 6-10
TOTAL ANNUAL COSTS KENAI AREA POWER GENERATION - MEDIUM LOAD FORECAST
(lvtillions of January, 1982 Dollars)
Non-fuel Capital 0 & M Expendi tur,es Fuel Total
Expenditures Costs Subtotal Costs Expenditures
0. 0. o. 0. 0. 0. 0. 0. 0. 0. 0. 0. 0. 0. 0 ..
621.2 0. 621.2 o. 621.2 142.8 o. 142.8 o. 142.8 292.8 0. 292.8 0. 292.8 150.6 o. 150.6 0. 150.6
35.7 14.21 49.91 29.5 79!041 o. 16~42 16.42 60.4 76.82
125.0 16.42 141 .42 61.,5 202.92 0. 22.64 22.64 125.7 148.34
53.7 22.64 76.34 130.0 206.34 35.7 24.46 60.16 130.8 190 .. 96 35.7 26.66 62.36 1o6.5 228.86 89.3 28.87 118. 17 203.5 321 .67 35.7 32.89 68.59 242.6 311.19 0. 35.10 35.10 283.0 318.10
53.7 35.10 88.80 288.6 377.40 0. 36.91 36.91 294.4 331 . 31
71.4 36.91 108.31 300.6 408.91 0. 41.33 41.33 382.7 • 424.03
53.7 41.33 95.03 390.4 485.43 71 .4 43.14 114. 54 398.4 512.94 53.7 45.64 99.34 461 .5 560.84 35.7 46.72 82.42 462.2 544.62 89.3 47.81 137.11 497.3 634.41 35.7 48.90 84.60 511.0 595.60
o. 49.99 49.99 542.6 597.59 0. 51.08 51.08 574.1 625.18
$2,083. $765. $2,848. $6,542. $9,3910
$1 ,612. $436. $2,048. $3,560. $5,608.
-20-
" l
r I I I
! ! I I j
I 1
l I t ' I l t l j 1
! I f j

'~'.
\, <,
•
WORKPAGE FROM CHAPTER 7 Pages 21-23
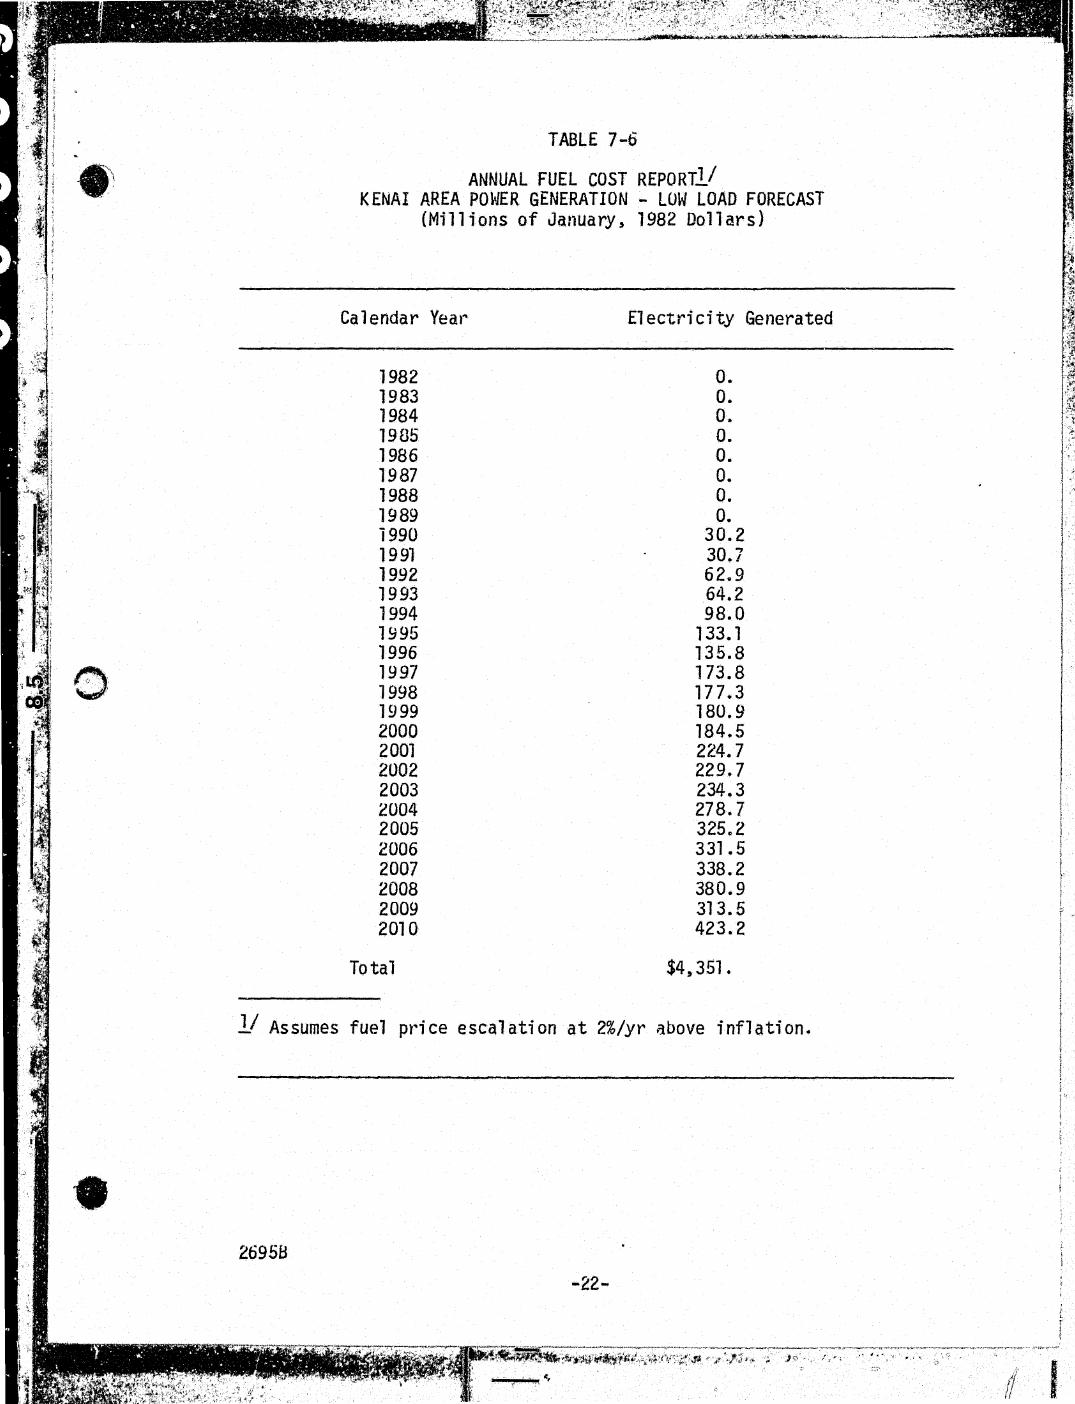
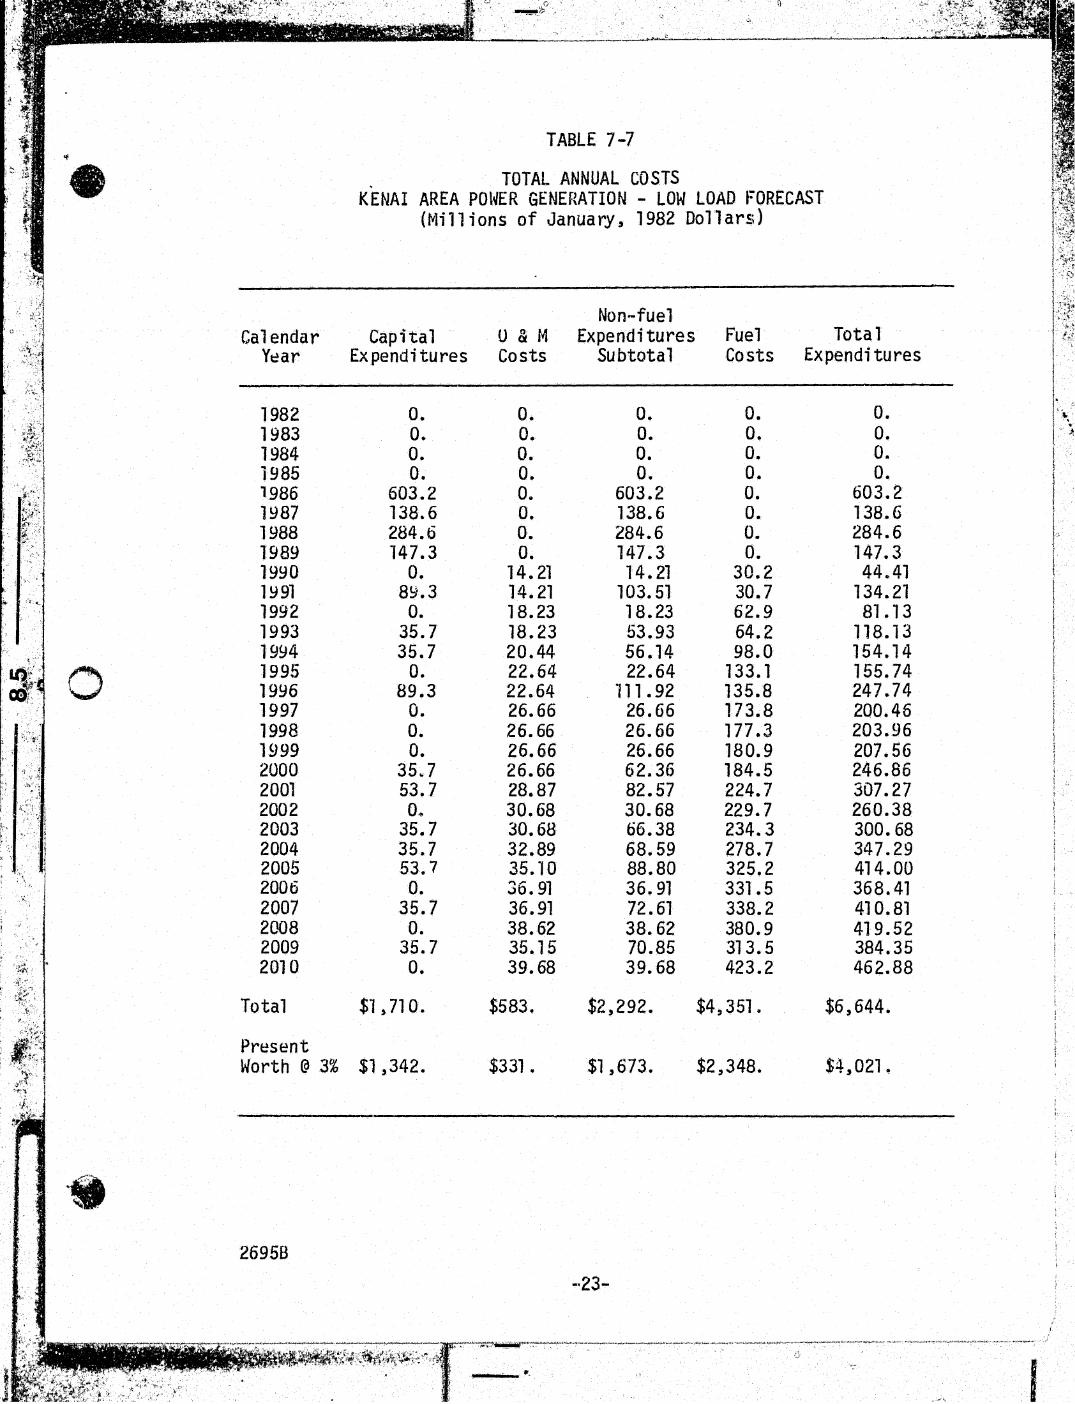
Fuel costs for the Kenai low load gro\lth scenario al"e assumed to be identical to those associated \'lith the Kenai medium load forecast scenario. Gas supplied to the pOller plant is assumed to cost $4.00/million Btu (1982 dollars) and escalate at a real rate of 2 percent per year.
26958
-21-
j
I j
' l
I
I f " l 1 ii I' !•,
-•\ .
•
.·· --~~~~r·,s~~~~::~i~~~::·r\: ., '· }·· .
TABLE 7-6
ANNUAL FUEL COST REPORTll KENAI AREA POWER GENERATION - LOW LOAD FORECAST
(Millions of January, 1982 Dollars)
Calendar Year~
1982 1983 1984 19U5 1986 1987 1988 1989 i990 1991 1992 1993 1994 1995 1996 1997 1998 1999 2000 2001 2002 2003 2004 2005 2006 2007 2008 2009 2010
Total
El ectri city Generated
0. 0. 0. 0. 0. 0. 0. 0.
30.2 30.7 62.9 64.2 98.0
133.1 135.8 173.8 177.3 180.9 184.5 224.7 229.7 234.3 278.7 325c2 331.5 338.2 380.9 313.5 423.2
$4,351.
l/ Assumes fuel pr·ice escalation at 2%/yr above inflation .
26958
-22-
! ··,
11 I
• Calendar
Y~ar
1982 1983 1984 1985
r 1986 ' . ,,,, ,, 1987 I ~·A·'
'~. t ; 1988 1989 1990 1991 1992 1993 1994
0 1995 1996 1997 1998 1999 2000 2001 2002 2003 2004 2005 2006 .. 2007 2008 2009 2010
Total
Pr~sent Worth @ 3%
. • 26958
0 ' (. ·~_tl· ..
TABLE 7-7
. TOTAL ANNUAL COSTS KENAI AREA POl~ER GENERATION - LOW LOAD FORECAST
(t>'lillions of January, 1982 Dollars)
Non-fuel Capital u & ~~ Expenditures Fuel Total
Expenditures Costs Subtotal Costs Expenditures
0. 0. 0. 0. 0. 0. 0. 0. 0. 0. 0. 0. 0. 0. 0. 0. 0. 0. 0. 0.
603.2 De 603.2 0. 603.2 138.6 0. 138.6 0. 138.6 284.6 0. 284.6 0. 284.6 147.3 0. 147.3 0. 147.3
0. 14.21 14.21 30.2 44.41 89.3 14.21 103.51 30.7 134.21 0. 18.23 18.23 62.9 81.13
35.7 18.23 53.93 64.2 118.13 35.7 20.44 56.14 98.0 154.14
0. 22.64 22.64 133.1 155.74 89.3 22.64 "11 1.92 135.8 247.74
0. 26.66 26.66 173.8 200.46 0. 26.66 26.66 177.3 203.96 0. 26.66 26.66 180.9 207.56
35 .. 7 26.66 62.36 184.5 246.86 53.7 28.87 82.57 224.7 307.27 0~ 30.68 30.68 229.7 260.38
35.7 30.68 66.38 234.3 300.68 35.7 32.89 68.59 278.7 347.29 53.7 35.10 88.80 325.2 414.00 0. 36.91 36.91 331.5 368.41
35.7 36.91 72.61 338.2 41 0. 81 0. 38.62 38.62 380.9 419.52
35.7 35.15 70.85 313.5 384.35 0. 39.68 39.68 423.2 462.88
$1,710. $583. $2,292. $4,351 e $6,644.
$1,342 • $331. $1 ,673. $2,348. $4,021~
-·23-