Embed Size (px)
Citation preview
Spring 2006W. Rhett Davis NC State University ECE 406 Slide 1
ECE 747 ECE 747 Digital Signal Processing Digital Signal Processing
ArchitectureArchitecture
DSP Implementation Architectures DSP Implementation Architectures
Spring 2006Spring 2006W. Rhett DavisW. Rhett Davis
NC State UniversityNC State University
Spring 2006W. Rhett Davis NC State University ECE 406 Slide 2
My Goal
Challenge you to use the techniques you have learned in this class to design the next generation of DSP hardware
When you undertake a new design, the most important question for you to answer is whether or not it will work better than an existing design.» Faster» Longer Battery Life» Cheaper
Spring 2006W. Rhett Davis NC State University ECE 406 Slide 3
Today’s Lecture
Types of DSP Implementations
Comparison of Hardware Efficiency
The Promise of Systems-on-Chip
What’s keeping us from getting there?
Spring 2006W. Rhett Davis NC State University ECE 406 Slide 4
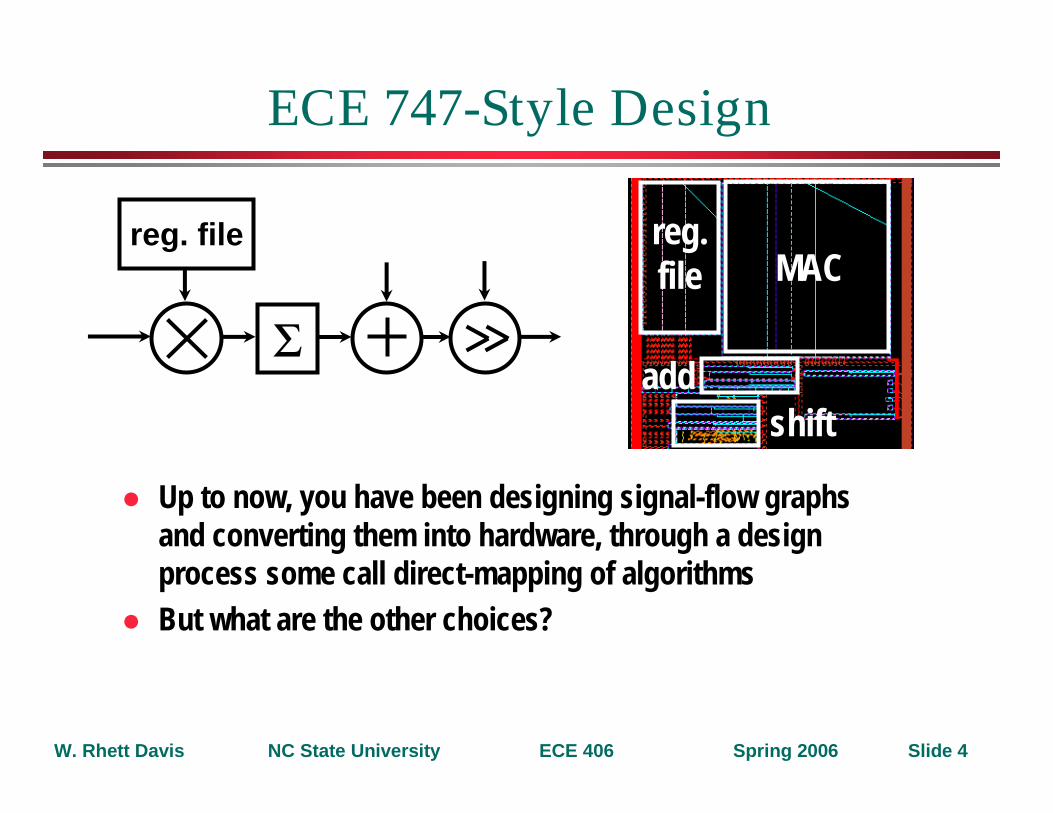
ECE 747-Style Design
Up to now, you have been designing signal-flow graphs and converting them into hardware, through a design process some call direct-mapping of algorithmsBut what are the other choices?
MACreg.file
addshift
reg. file
Σ
Spring 2006W. Rhett Davis NC State University ECE 406 Slide 5
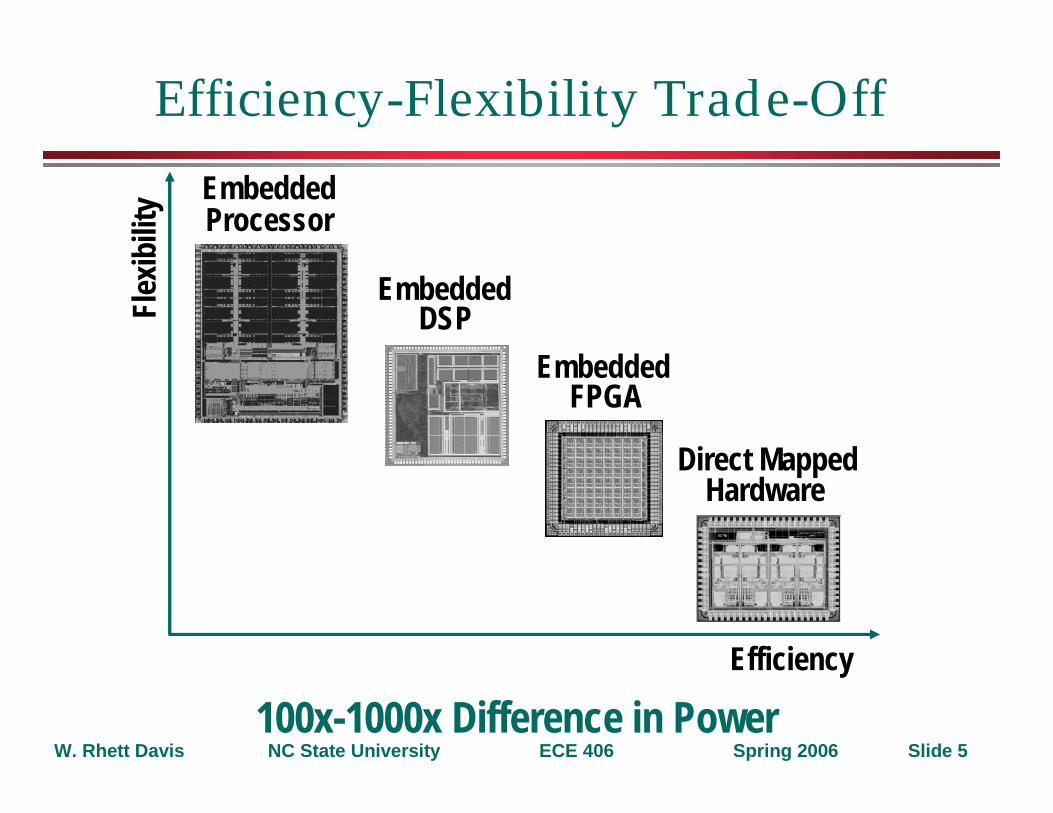
Efficiency-Flexibility Trade-Off
100x-1000x Difference in Power
Direct MappedHardware
EmbeddedFPGA
Flex
ibili
ty
Efficiency
Embedded Processor
DSPEmbedded
Spring 2006W. Rhett Davis NC State University ECE 406 Slide 6
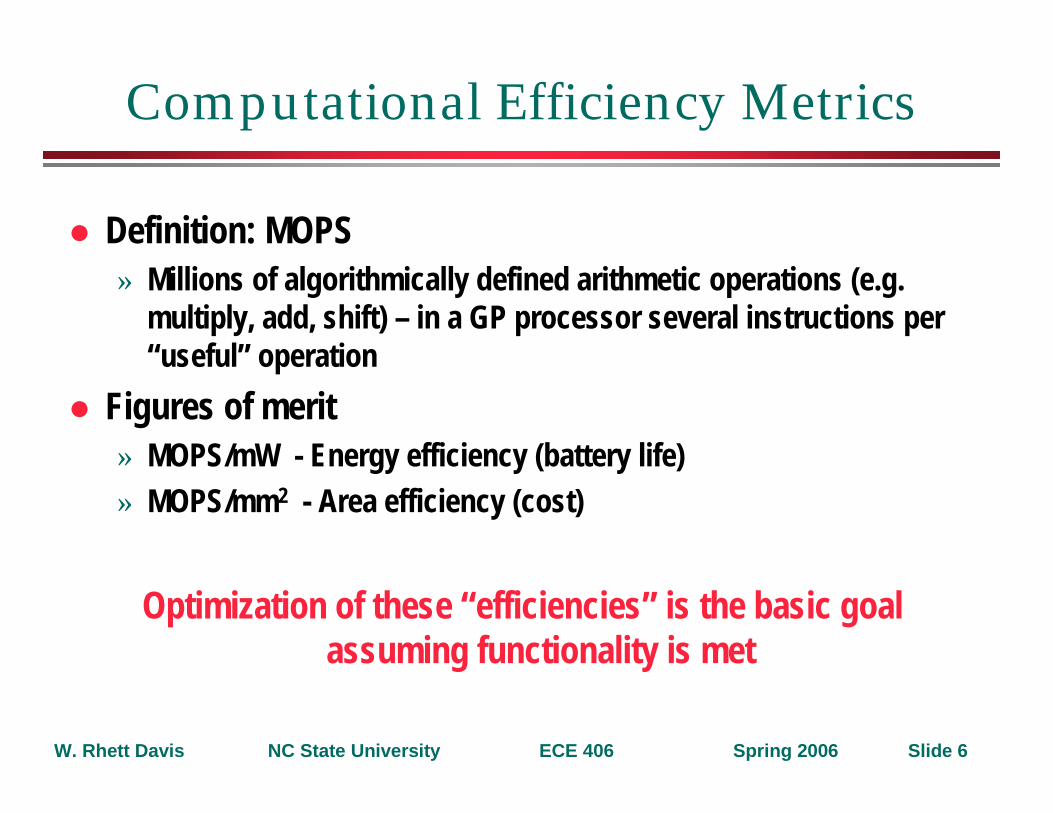
Computational Efficiency Metrics
Definition: MOPS » Millions of algorithmically defined arithmetic operations (e.g.
multiply, add, shift) – in a GP processor several instructions per “useful” operation
Figures of merit » MOPS/mW - Energy efficiency (battery life)» MOPS/mm2 - Area efficiency (cost)
Optimization of these “efficiencies” is the basic goal assuming functionality is met
Spring 2006W. Rhett Davis NC State University ECE 406 Slide 7
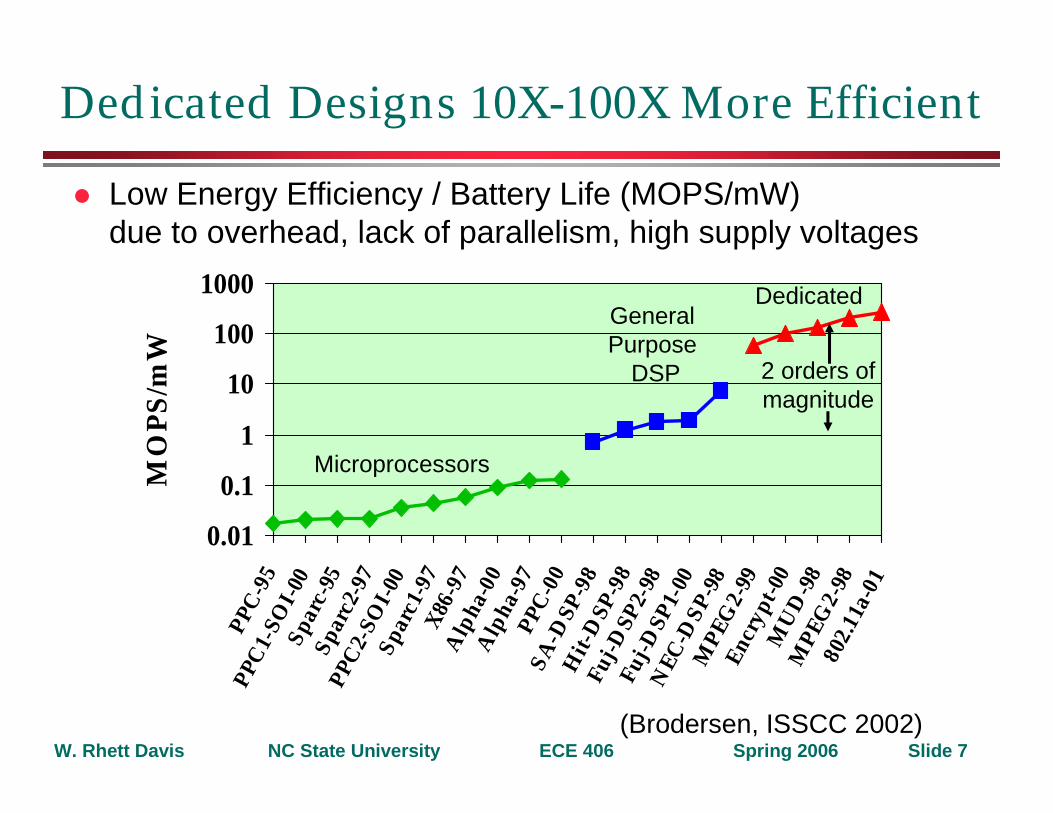
Dedicated Designs 10X-100X More Efficient
0.01
0.1
1
10
100
1000
PPC
-95
PPC
1-SO
I-00
Spar
c-95
Spar
c2-9
7PP
C2-
SOI-
00Sp
arc1
-97
X86-
97A
lpha
-00
Alp
ha-9
7PP
C-0
0SA
-DSP
-98
Hit-
DSP
-98
Fuj-D
SP2-
98Fu
j-DSP
1-00
NEC
-DSP
-98
MPE
G2-
99En
cryp
t-00
MU
D-9
8M
PEG
2-98
802.
11a-
01
MO
PS
/mW
Microprocessors
General Purpose
DSP
Dedicated
2 orders ofmagnitude
(Brodersen, ISSCC 2002)
Low Energy Efficiency / Battery Life (MOPS/mW) due to overhead, lack of parallelism, high supply voltages

Spring 2006W. Rhett Davis NC State University ECE 406 Slide 8
Potential of Direct Mapping
In .25 micron a multiplier requires .05 mm2 and 7pJ per operation at 1 V. Adders and registers are about 10 times smaller and 10 times lower energy
Lets implement a 50mm2 , .25 micron chip using adders, registers and multipliers
We can have 2000 adders/registers and 200 multipliers in less than 1/2 of the chip, also assume 1/3 of power goes into clocks
25 MHz clock (1 volt) gives ~50 Gops at 100mW
500 MOPS/mW and 1000 MOPS/mm2
Spring 2006W. Rhett Davis NC State University ECE 406 Slide 9
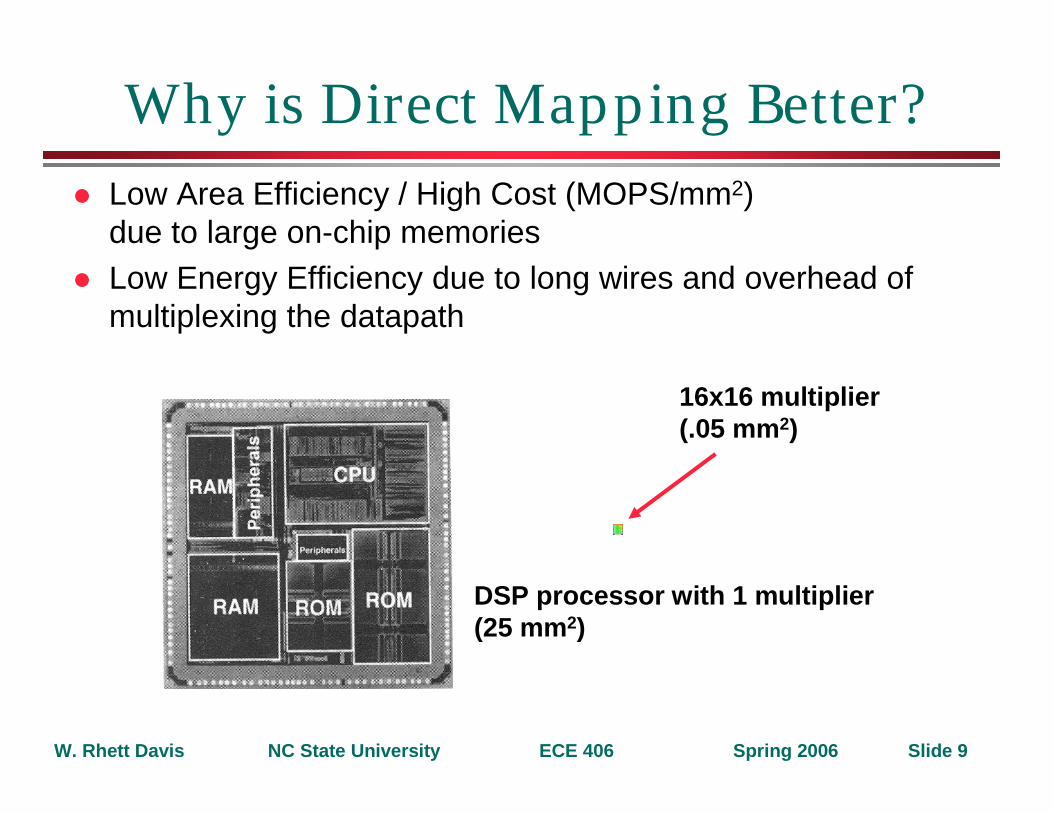
Why is Direct Mapping Better?
DSP processor with 1 multiplier (25 mm2)
16x16 multiplier(.05 mm2)
Low Area Efficiency / High Cost (MOPS/mm2) due to large on-chip memoriesLow Energy Efficiency due to long wires and overhead of multiplexing the datapath
Spring 2006W. Rhett Davis NC State University ECE 406 Slide 10
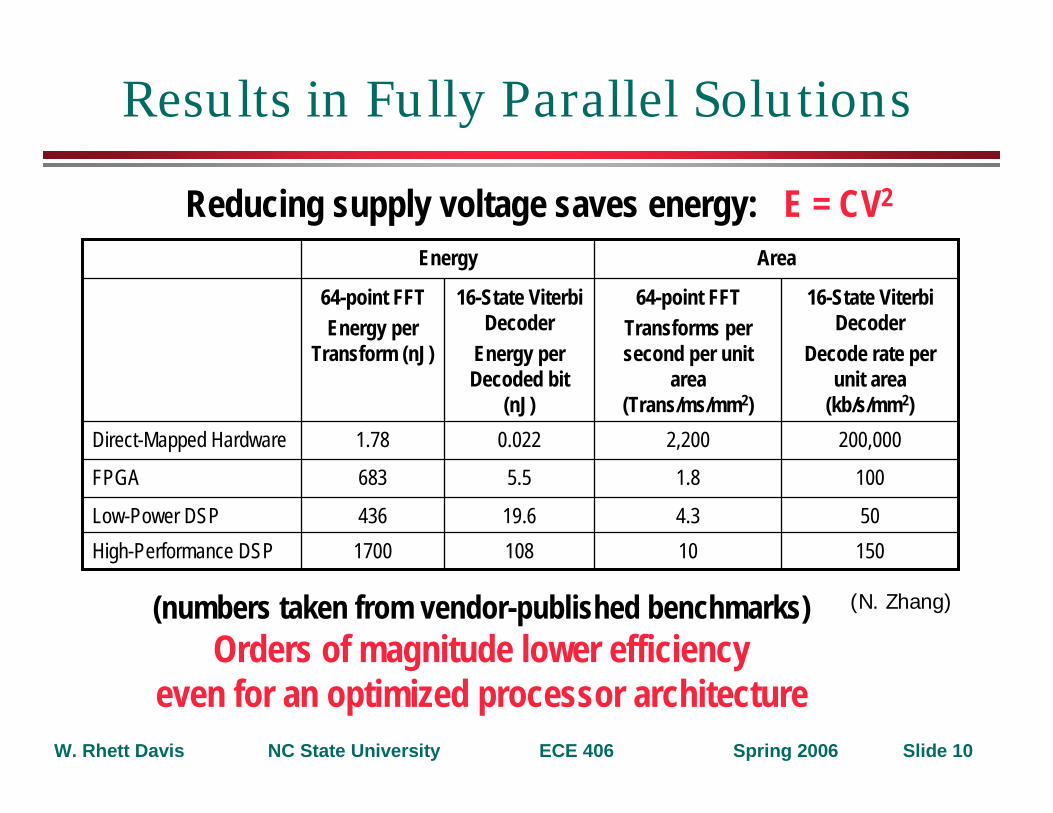
Results in Fully Parallel Solutions
108
19.6
5.5
0.022
16-State ViterbiDecoder
Energy per Decoded bit
(nJ)
10
4.3
1.8
2,200
64-point FFTTransforms per second per unit
area (Trans/ms/mm2)
AreaEnergy
16-State ViterbiDecoder
Decode rate per unit area
(kb/s/mm2)
64-point FFTEnergy per
Transform (nJ)
1501700High-Performance DSP
50436Low-Power DSP
100683FPGA
200,0001.78Direct-Mapped Hardware
(numbers taken from vendor-published benchmarks)Orders of magnitude lower efficiency
even for an optimized processor architecture
Reducing supply voltage saves energy: E = CV2
(N. Zhang)
Spring 2006W. Rhett Davis NC State University ECE 406 Slide 11
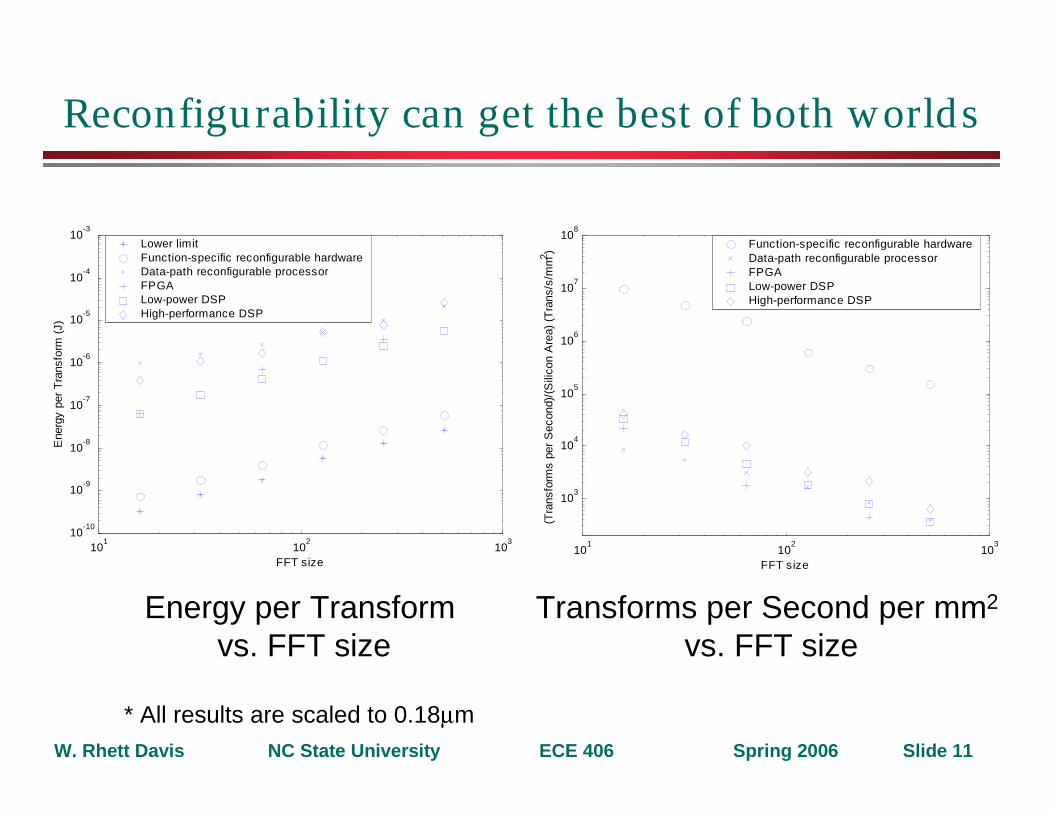
Reconfigurability can get the best of both worlds
Energy per Transform vs. FFT size
101
102
103
10-10
10-9
10-8
10-7
10-6
10-5
10-4
10-3
FFT size
Ene
rgy
per
Tra
nsfo
rm (
J)
Lower limit Function-specific reconfigurable hardwareData-path reconfigurable processor FPGA Low-power DSP High-performance DSP
101
102
103
103
104
105
106
107
108
FFT size(T
rans
form
s pe
r S
econ
d)/(
Sili
con
Are
a) (
Tra
ns/s
/mm
2 ) Function-specific reconfigurable hardwareData-path reconfigurable processor FPGA Low-power DSP High-performance DSP
Transforms per Second per mm2
vs. FFT size
* All results are scaled to 0.18µm
Spring 2006W. Rhett Davis NC State University ECE 406 Slide 12
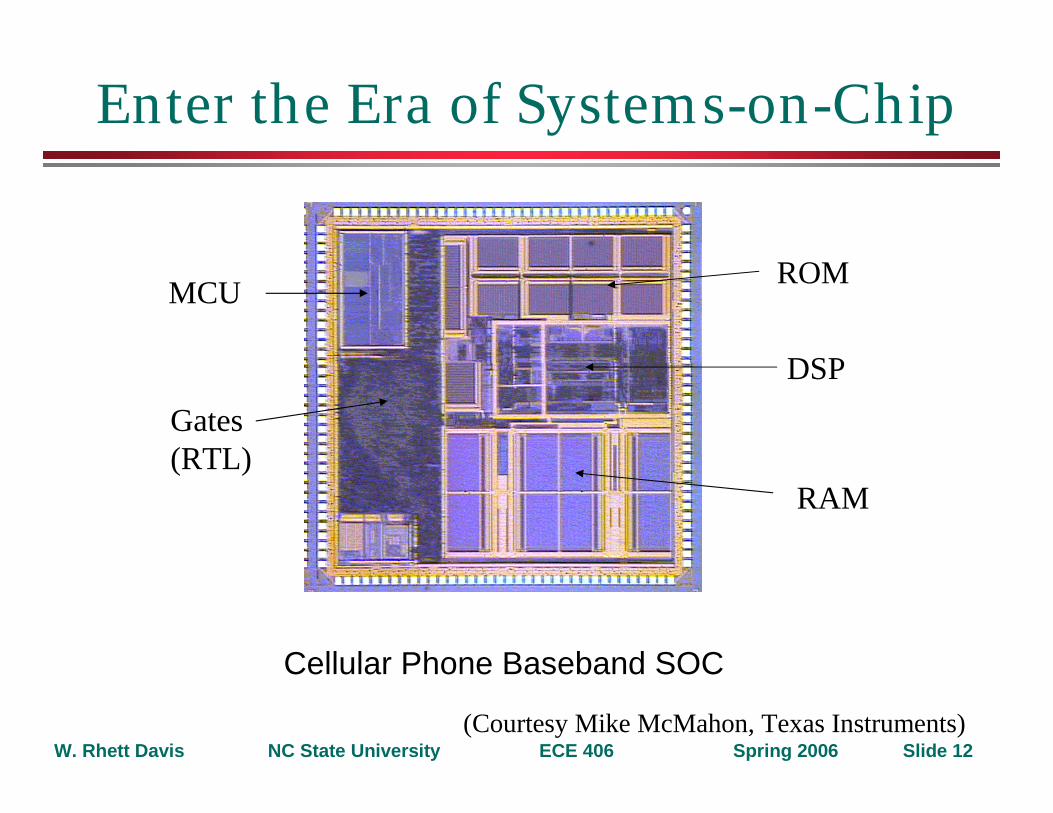
Enter the Era of Systems-on-Chip
MCU
Gates(RTL)
ROM
DSP
RAM
(Courtesy Mike McMahon, Texas Instruments)
Cellular Phone Baseband SOC
Spring 2006W. Rhett Davis NC State University ECE 406 Slide 13
What is a System-on-Chip?
“a complex IC that integrates the major functional elements of a complete end-product into a single chip... incorporates at least one programmable processor, on-chip memory, and accelerating function-units....”» Winning the SoC Revolution,
Martin & Chang 2003(paraphrasing from Dataquest)
Spring 2006W. Rhett Davis NC State University ECE 406 Slide 14
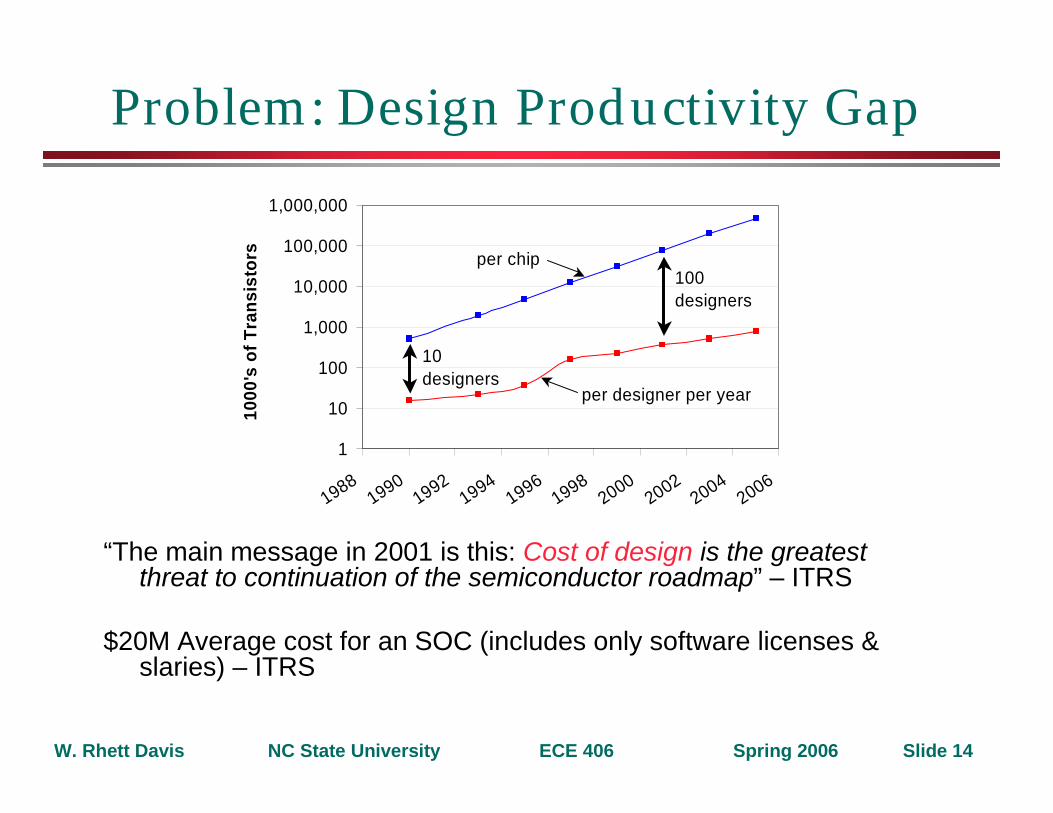
Problem: Design Productivity Gap
“The main message in 2001 is this: Cost of design is the greatest threat to continuation of the semiconductor roadmap” – ITRS
$20M Average cost for an SOC (includes only software licenses & slaries) – ITRS
1
10
100
1,000
10,000
100,000
1,000,000
19881990
19921994
19961998
20002002
20042006
1000
's o
f T
ran
sist
ors per chip
per designer per year
10 designers
100 designers
Spring 2006W. Rhett Davis NC State University ECE 406 Slide 15
Next Lectures
Survey of System-Level Design Techniques» What tools can I use to get performance
estimates faster, with less work?
Methods of Scaling» How do I convert my 180 nm performance
estimates into the latest technology?