Embed Size (px)
Citation preview
FINAL DEGREE THESIS
ECG Recording and Heart Rate
Detection with Textile-Electronic
Integrated Instrumentation
Part I
By
Juan Manuel Rodríguez Escriche
Marc Tena Gil
II
FINAL DEGREE THESIS 30 ECTS, 2011-12 SWEDEN
THESIS Nº 3/2012, ELECTRICAL ENGINEERING
ECG Recording and Heart Rate Detection with Textile-
Electronic Integrated Instrumentation
Juan Manuel Rodríguez Escriche
Marc Tena Gil
Master thesis
Subject Category: Medical Technology, Electrical Engineering
University of Borås
School of Engineering
SE- 501 90 BORÅS
Phone number: +46 33 435 4640
Examiner: Fernando Seoane Martínez
Supervisor: Fernando Seoane Martínez

III
Keywords: Electrogardiogram, MATLAB, printed electronics, Wearable Technology

IV
ABSTRACT
In this thesis is presented the whole process to design an ECG on textile and the
different techniques available for its development that were found in a previous literary
research. Two different circuits were built using a hybrid solution in between two
different disciplines, electronics and textiles. A first ECG with a more handmade
procedure using conductive painting and textiles; a second one employing a conductive
ink printer and film. In both the interconnections were done on the fabric or film and the
circuits were placed in three different PCB attached to them.
Experimental measurements were performed with both circuits to test their
operation and reliability; even though the real purpose was to start a path for further
investigation in order to achieve a functional wearable device for stress monitoring and
a possibility to transfer this technology to other fields.

V
ACKNOWLEDGEMENTS
The authors would like to thank to their supervisor Fernando Seoane Martínez for
the constant support during the thesis development and all year long, and for making
this thesis and experience possible. Also thank the PhD students working with Fernando
for all their help during the whole year and especially with the thesis; as much with the
technical skills and with their knowledge. Not less important our friends in Sweden for
such a great time and with their help when we needed it.
Juanma would like to thank his beloved family and his girlfriend Dana for all the
affect and support received during all this years without which his life would be
completely different. Special mention to his father Ignacio who rests in peace since
2009.
Marc would like to thank to his family the support received during this whole year
in Sweden and in his all career, especially to his parents Elo and Emilio for being all the
time to his side.
Juan Manuel Rodríguez Escriche
Marc Tena Gil

VI
TABLE OF CONTENTS
Abstract ...................................................................................................................................... IV
Acknowledgements ..................................................................................................................... V
Table of Contents ...................................................................................................................... VI
List of Acronyms .................................................................................................................... VIII
CHAPTER 1. Introduction ..................................................................................................... 9
1.1 Motivation ....................................................................................................................... 9
1.2 Goal ................................................................................................................................. 9
1.3 Work Done ...................................................................................................................... 9
1.4 Structure of the Thesis Report ...................................................................................... 9
1.5 Out of Scope .................................................................................................................. 10
CHAPTER 2. Background .................................................................................................... 11
2.1 Bioelectromagnetism .................................................................................................... 11
2.1.1 Conduction Mechanism in the Cell Membrane .................................................... 12
2.1.2 The Action Potential ................................................................................................ 13
2.1.3 Action Potential Propagation Through Heart ....................................................... 14
2.2 Biomedical Engineering ............................................................................................... 16
2.2.1 ECG ........................................................................................................................... 16
2.2.1.1 Leads System ........................................................................................ 16
2.2.2 ECG Amplifier ......................................................................................................... 17
2.2.2.1 Instrumentation Amplifier .................................................................... 17
2.2.2.2 Filters .................................................................................................... 18
2.2.3 Safety ......................................................................................................................... 20
2.2.3.1 Active Feedback in Third Electrode ..................................................... 20
2.2.4 Wearable Electronics ............................................................................................... 21
2.2.4.1 Stella Project ......................................................................................... 22
2.2.4.2 Stella Activity Monitor ......................................................................... 22
2.2.4.3 Verhaert Infant Respiratory Monitor .................................................... 22
CHAPTER 3. Materials & Methods .................................................................................... 24
3.1 Introduction .................................................................................................................. 24
3.2 Software ........................................................................................................................ 24
3.2.1 Matlab ....................................................................................................................... 24
3.2.2 MIT-BIH Arrhythmia Database ............................................................................ 24
3.2.3 Altium ....................................................................................................................... 24
3.3 Instrumentation ............................................................................................................ 25
3.3.1 Oscilloscope Tektronik MSO2012 .......................................................................... 25
3.4 Materials ....................................................................................................................... 25
3.4.1 3M Electrodes ........................................................................................................... 25
3.4.2 Silver Conductive Paint ........................................................................................... 26
3.4.3 Silver Conductive Grease ........................................................................................ 26
3.4.4 Silver Conductive Pen ............................................................................................. 27
3.4.5 Conductive Epoxy .................................................................................................... 27
3.4.6 Textiles ...................................................................................................................... 27
3.4.7 Refillable Cartridge ................................................................................................. 27
VII
3.4.8 Conductive Ink ......................................................................................................... 28
3.4.9 Films .......................................................................................................................... 28
3.4.10 PCB ........................................................................................................................... 28
3.5 Methods ......................................................................................................................... 28
3.5.1 Signal Processing for Simulation ............................................................................ 28
3.5.2 Conductive Ink Printer Development Kit from Methode Electronics ................ 29
3.5.3 Cartridge Refilling ................................................................................................... 29
3.5.4 PCB Interconnection on Textile ............................................................................. 29
3.5.5 PCB on Film ............................................................................................................. 30
3.5.6 Printing Tests ........................................................................................................... 30
CHAPTER 4. ECG Circuit Design ...................................................................................... 32
4.1 Introduction .................................................................................................................. 32
4.2 Development ................................................................................................................. 32
4.3 Design ............................................................................................................................ 34
4.3.1 Instrumentation Amplifier ...................................................................................... 34
4.3.2 Filtering ..................................................................................................................... 35
4.3.3 Gain Stage ................................................................................................................. 36
4.3.4 Peak Detector and Comparator .............................................................................. 37
4.3.5 Power Supply ............................................................................................................ 38
4.4 Simulation ..................................................................................................................... 39
4.5 Test Board ..................................................................................................................... 40
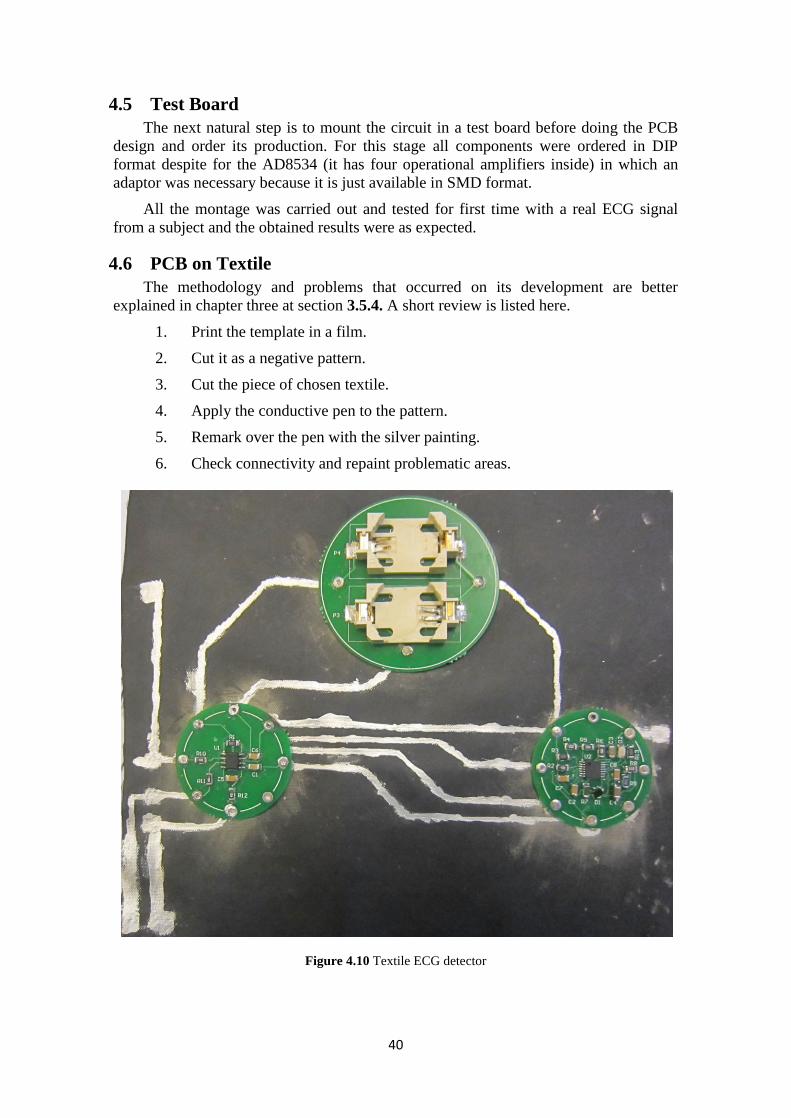
4.6 PCB on Textile .............................................................................................................. 40
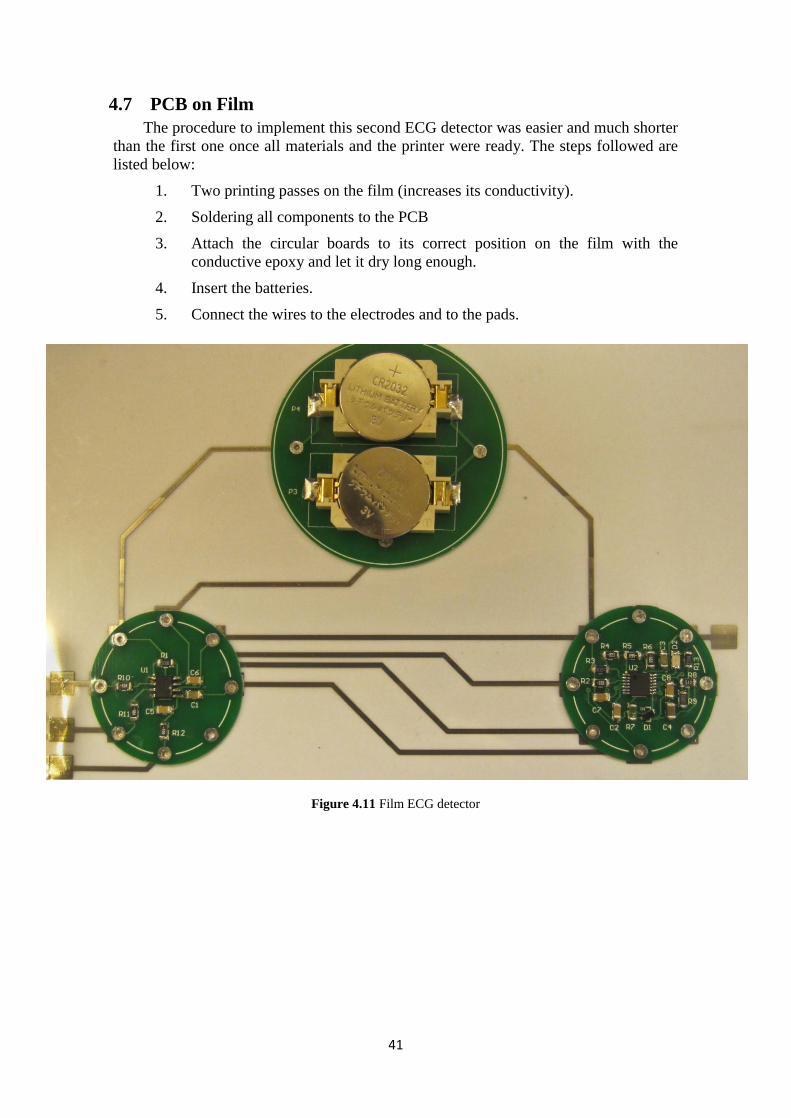
4.7 PCB on Film.................................................................................................................. 41
CHAPTER 5. Validation& Results ...................................................................................... 44
5.1 PCB on Textile plots ..................................................................................................... 44
5.2 PCB on Film Plots ........................................................................................................ 46
CHAPTER 6. Conclusion & Future Work .......................................................................... 48
6.1 Conclusion ..................................................................................................................... 48
6.2 Future Work ................................................................................................................. 48
REFERENCES .......................................................................................................................... 50
ANNEX....................................................................................................................................... 51
VIII
LIST OF ACRONYMS
Ag/AgCl Silver / Silver Chloride
ATP Adenosine Triphosphate
A-V Atrioventricular
BPF Band Pass Filter
CAD Computer Aided Design
CMRR Common-Mode Rejection Ratio
dB Decibels
DIP Dual In-line Package
ECG/EKG Electrocardiogram
EEG Electroencephalography
EMG Electromyography
FPGA Field Programmable Gate Array
GND Ground
HDL Hardware Description Language
HPF High Pass Filter
HR Hear Rate
HRV Heart Rate Variability IC Integrated Circuit
LED Light Emitting Diode
LPF Low Pass Filter
MIT Massachusetts Institute of Technology
MSDS Material Safety Data Sheet
OA Operational Amplifier
PCB Printed Circuit Board
PET Polyethylene Terephthalate
SC Skin conductance
SCB Stretchable Copper Board
SMD Surface Mount Device
USB Universal Serial Bus
VIA Vertical Interconnect Access

9
CHAPTER 1.
INTRODUCTION
Nowadays, in a rapidly changing society where everyone has a lot of
responsibilities and chores, stress is a common cause of poor job performance, illness,
disease and sometimes risk for the own person and for the rest (think of jobs as police,
firefighters, professional drivers, etc..). Rapid detection on symptoms of stress and act
on them can prevent major problems.
1.1 Motivation
The motivation of this project arises during a research carried out looking up for
assessment of alertness and stress with non-invasive physiological measurements (the
research report is annexed at the end of the thesis); in its discussion and conclusion you
can see deeply explained why finally the ECG was chosen in between all techniques
that are developed for this purpose. How the ECG and the stress are related, how
important is that the subject do not perceive the sensors, etc.
1.2 Goal
Develop a simple three electrodes ECG detector prototype over textile for stress
assessment. This represents a first step to achieve an ECG on textile in order to have a
totally flexible design without using any rigid materials
1.3 Work Done
A hybrid (textile and electronics) heart rate detector has been designed and
implemented. The ECG amplifier and the peak detector were divided into three round
PCBs designed with Altium‟s CAD software, its interconnections were printed over the
textile with conductive ink. Finally several measurements with different subjects were
performed to test the proper functionality of the system.
1.4 Structure of the Thesis Report
This thesis consists of six chapters, an appendix and a references section. In
Chapter 1 the introduction part. Chapter 2 presents a brief background where the bases
of bioelectromagnetism and ECG are explained, safety is also considered as well as a
short explanation and example of electronic textiles. Chapter 3 describes the materials
and methods employed to develop the whole project, meaning that all materials and
techniques are listed. Other used equipment appears too. Chapter 4 describes the ECG
design starting for the analog design with all its stages and its simulation; to finish this
chapter the tests carried out with the textile and films where the ECG has been
implemented are shown. Chapter 5 contains the validation and results, few plots
demonstrate the ECG operation. Then in the last Chapter it follows the conclusion and
several points that could be taken into account for future work. Notice that in the Annex
is attached the research carried out, that it could be considered as the real motivation for
developing this project.
10
1.5 Out of Scope
During the project development was decided to rule out some of the original
considerations like wireless data transmission, automate the ECG signal and the peak
detection capture with Labview software and a National Instruments acquisition card.
As a last point a posterior signal treatment with digital processing software (Matlab for
instance) was also proposed at the beginning. Notice that if this processing is developed,
the analog R-R detector becomes something unnecessary.
11
CHAPTER 2.
BACKGROUND
A hybrid textile-electronics ECG amplifier is a complex design that involves
different disciplines as follows: Bioelectromagnetism that studies the electric,
electromagnetic, and magnetic phenomena, which arise in biological tissue. Biomedical
engineering that is concerned in the application of science and technology to biology
and medicine. Wearable electronics also known as smart textiles, which allows
embedding electronics into the fabrics.
This chapter consists of a briefly introduction in the mentioned disciplines,
focusing on the information relevant towards the design.
2.1 Bioelectromagnetism
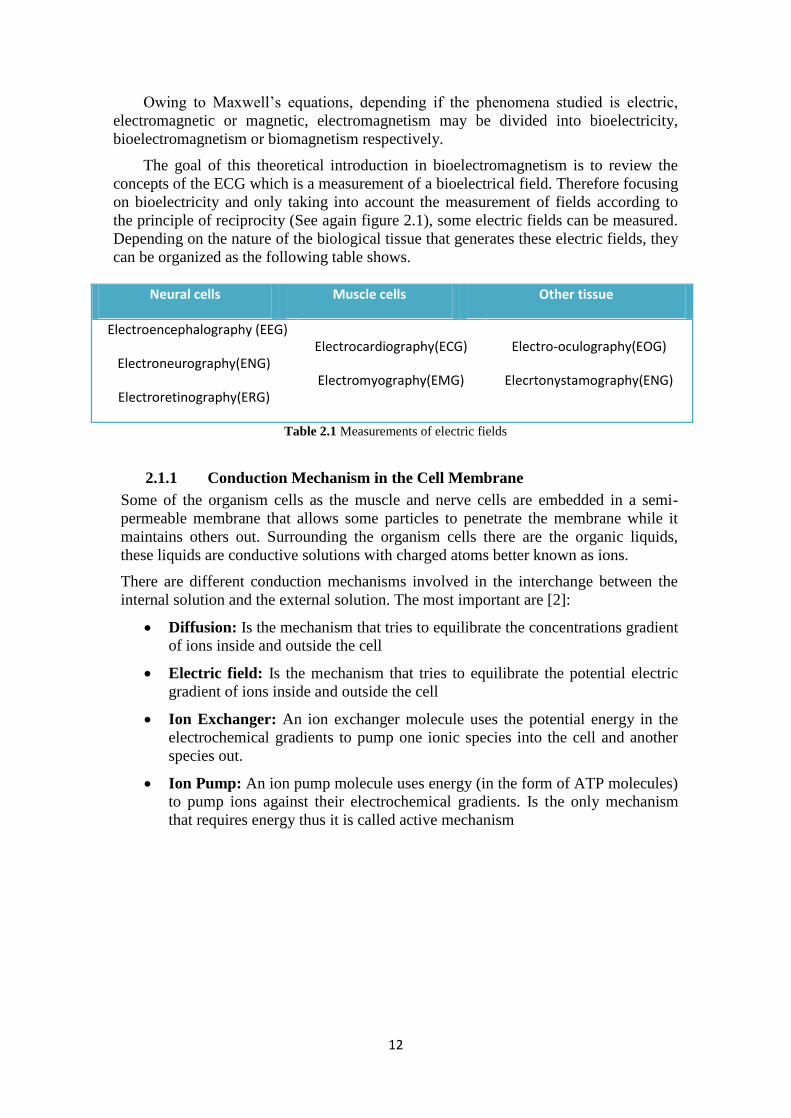
Bioelectromagnetism field can be divided on different theoretical groups according
to principles: Maxwell‟s equations and the principle of reciprocity [1] as can be seen in
the figure below.
Figure 2.1 Organization of Bioelectromagnetism [1]
12
Owing to Maxwell‟s equations, depending if the phenomena studied is electric,
electromagnetic or magnetic, electromagnetism may be divided into bioelectricity,
bioelectromagnetism or biomagnetism respectively.
The goal of this theoretical introduction in bioelectromagnetism is to review the
concepts of the ECG which is a measurement of a bioelectrical field. Therefore focusing
on bioelectricity and only taking into account the measurement of fields according to
the principle of reciprocity (See again figure 2.1), some electric fields can be measured.
Depending on the nature of the biological tissue that generates these electric fields, they
can be organized as the following table shows.
2.1.1 Conduction Mechanism in the Cell Membrane
Some of the organism cells as the muscle and nerve cells are embedded in a semi-
permeable membrane that allows some particles to penetrate the membrane while it
maintains others out. Surrounding the organism cells there are the organic liquids,
these liquids are conductive solutions with charged atoms better known as ions.
There are different conduction mechanisms involved in the interchange between the
internal solution and the external solution. The most important are [2]:
Diffusion: Is the mechanism that tries to equilibrate the concentrations gradient
of ions inside and outside the cell
Electric field: Is the mechanism that tries to equilibrate the potential electric
gradient of ions inside and outside the cell
Ion Exchanger: An ion exchanger molecule uses the potential energy in the
electrochemical gradients to pump one ionic species into the cell and another
species out.
Ion Pump: An ion pump molecule uses energy (in the form of ATP molecules)
to pump ions against their electrochemical gradients. Is the only mechanism
that requires energy thus it is called active mechanism
Neural cells Muscle cells Other tissue
Electroencephalography (EEG)
Electroneurography(ENG)
Electroretinography(ERG)
Electrocardiography(ECG)
Electromyography(EMG)
Electro-oculography(EOG)
Elecrtonystamography(ENG)
Table 2.1 Measurements of electric fields
13
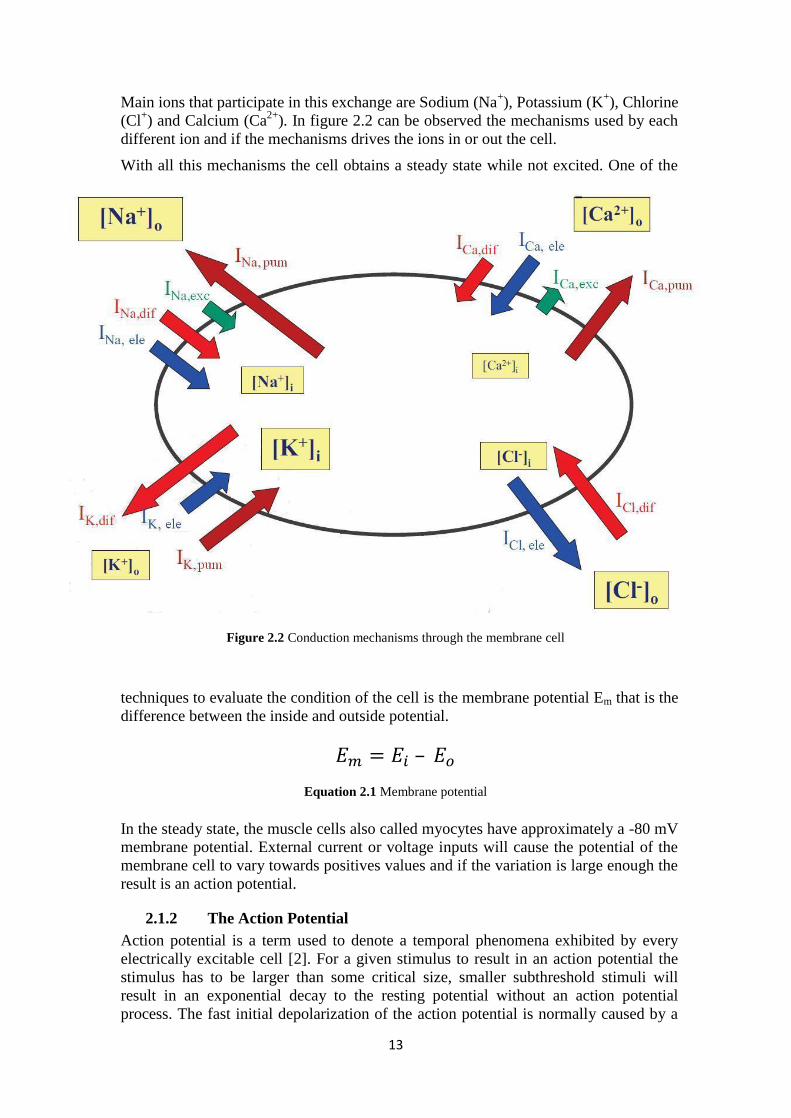
Main ions that participate in this exchange are Sodium (Na+), Potassium (K
+), Chlorine
(Cl+) and Calcium (Ca
2+). In figure 2.2 can be observed the mechanisms used by each
different ion and if the mechanisms drives the ions in or out the cell.
With all this mechanisms the cell obtains a steady state while not excited. One of the
techniques to evaluate the condition of the cell is the membrane potential Em that is the
difference between the inside and outside potential.
In the steady state, the muscle cells also called myocytes have approximately a -80 mV
membrane potential. External current or voltage inputs will cause the potential of the
membrane cell to vary towards positives values and if the variation is large enough the
result is an action potential.
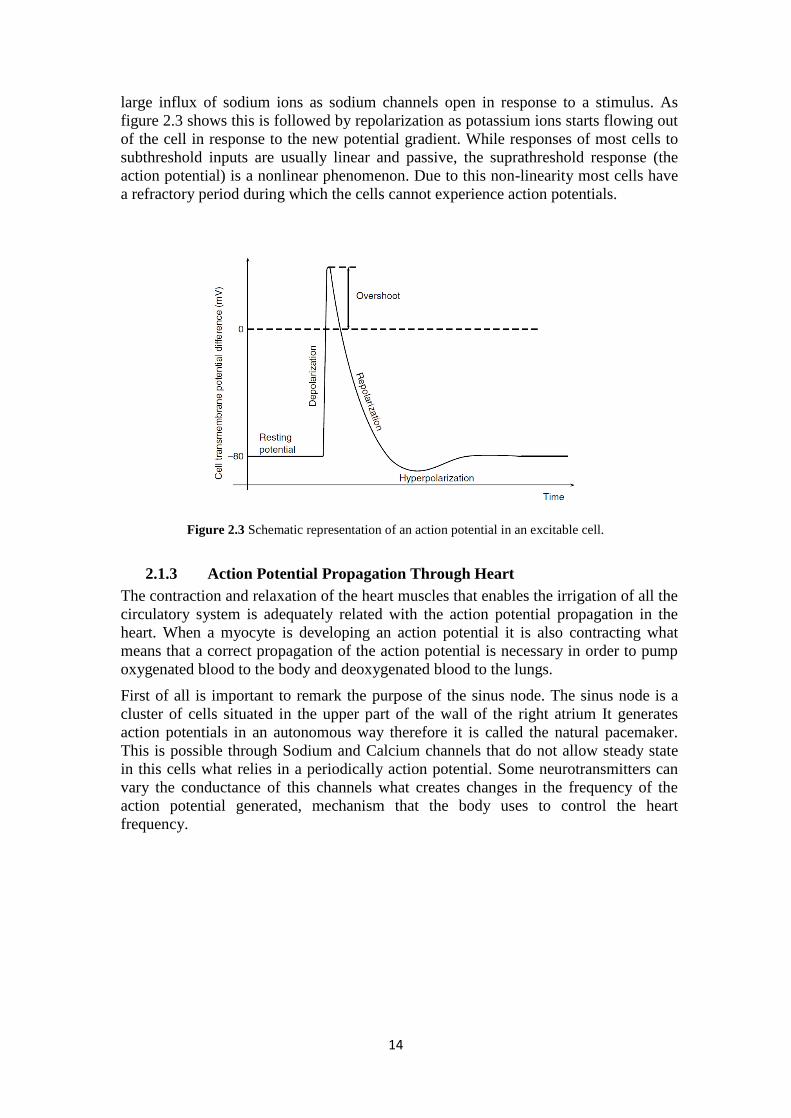
2.1.2 The Action Potential
Action potential is a term used to denote a temporal phenomena exhibited by every
electrically excitable cell [2]. For a given stimulus to result in an action potential the
stimulus has to be larger than some critical size, smaller subthreshold stimuli will
result in an exponential decay to the resting potential without an action potential
process. The fast initial depolarization of the action potential is normally caused by a
Equation 2.1 Membrane potential
Figure 2.2 Conduction mechanisms through the membrane cell
14
large influx of sodium ions as sodium channels open in response to a stimulus. As
figure 2.3 shows this is followed by repolarization as potassium ions starts flowing out
of the cell in response to the new potential gradient. While responses of most cells to
subthreshold inputs are usually linear and passive, the suprathreshold response (the
action potential) is a nonlinear phenomenon. Due to this non-linearity most cells have
a refractory period during which the cells cannot experience action potentials.
2.1.3 Action Potential Propagation Through Heart
The contraction and relaxation of the heart muscles that enables the irrigation of all the
circulatory system is adequately related with the action potential propagation in the
heart. When a myocyte is developing an action potential it is also contracting what
means that a correct propagation of the action potential is necessary in order to pump
oxygenated blood to the body and deoxygenated blood to the lungs.
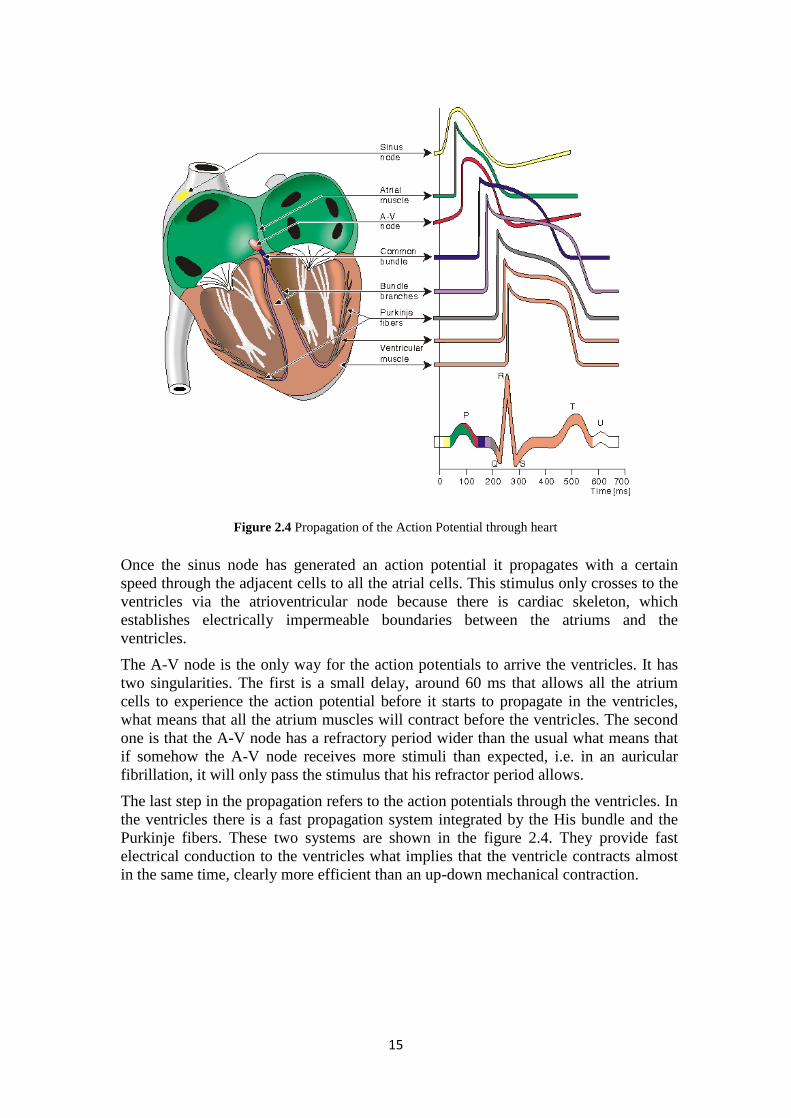
First of all is important to remark the purpose of the sinus node. The sinus node is a
cluster of cells situated in the upper part of the wall of the right atrium It generates
action potentials in an autonomous way therefore it is called the natural pacemaker.
This is possible through Sodium and Calcium channels that do not allow steady state
in this cells what relies in a periodically action potential. Some neurotransmitters can
vary the conductance of this channels what creates changes in the frequency of the
action potential generated, mechanism that the body uses to control the heart
frequency.
Figure 2.3 Schematic representation of an action potential in an excitable cell.
15
Once the sinus node has generated an action potential it propagates with a certain
speed through the adjacent cells to all the atrial cells. This stimulus only crosses to the
ventricles via the atrioventricular node because there is cardiac skeleton, which
establishes electrically impermeable boundaries between the atriums and the
ventricles.
The A-V node is the only way for the action potentials to arrive the ventricles. It has
two singularities. The first is a small delay, around 60 ms that allows all the atrium
cells to experience the action potential before it starts to propagate in the ventricles,
what means that all the atrium muscles will contract before the ventricles. The second
one is that the A-V node has a refractory period wider than the usual what means that
if somehow the A-V node receives more stimuli than expected, i.e. in an auricular
fibrillation, it will only pass the stimulus that his refractor period allows.
The last step in the propagation refers to the action potentials through the ventricles. In
the ventricles there is a fast propagation system integrated by the His bundle and the
Purkinje fibers. These two systems are shown in the figure 2.4. They provide fast
electrical conduction to the ventricles what implies that the ventricle contracts almost
in the same time, clearly more efficient than an up-down mechanical contraction.
Figure 2.4 Propagation of the Action Potential through heart
16
2.2 Biomedical Engineering
The activation sequence of the action potential in the heart leads to the production
of closed-line action currents that flow in the thoracic volume conductor (considered a
purely passive medium containing no electric sources or sinks). Potentials measured at
the outer surface of this medium (that is, on the body surface) are referred as
electrocardiograms (ECGs) [3].
2.2.1 ECG
Using a model where the heart consists of an electric dipole the activity of the heart
can be represented as a vector quantity. This dipole represents the electric activity of
the heart in a particular moment. In the next moment of the cardiac cycle the dipole
will change its value (orientation and amplitude) because there is a variation in the
electric field produced by the heart.
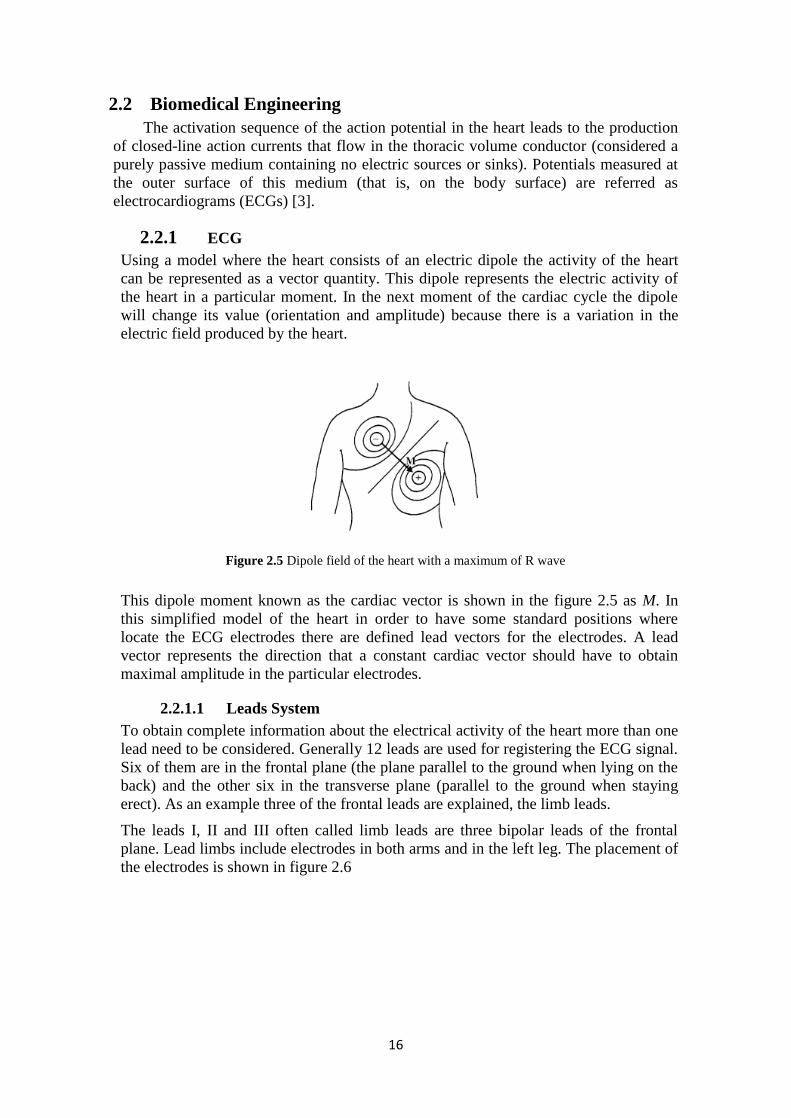
This dipole moment known as the cardiac vector is shown in the figure 2.5 as M. In
this simplified model of the heart in order to have some standard positions where
locate the ECG electrodes there are defined lead vectors for the electrodes. A lead
vector represents the direction that a constant cardiac vector should have to obtain
maximal amplitude in the particular electrodes.
2.2.1.1 Leads System
To obtain complete information about the electrical activity of the heart more than one
lead need to be considered. Generally 12 leads are used for registering the ECG signal.
Six of them are in the frontal plane (the plane parallel to the ground when lying on the
back) and the other six in the transverse plane (parallel to the ground when staying
erect). As an example three of the frontal leads are explained, the limb leads.
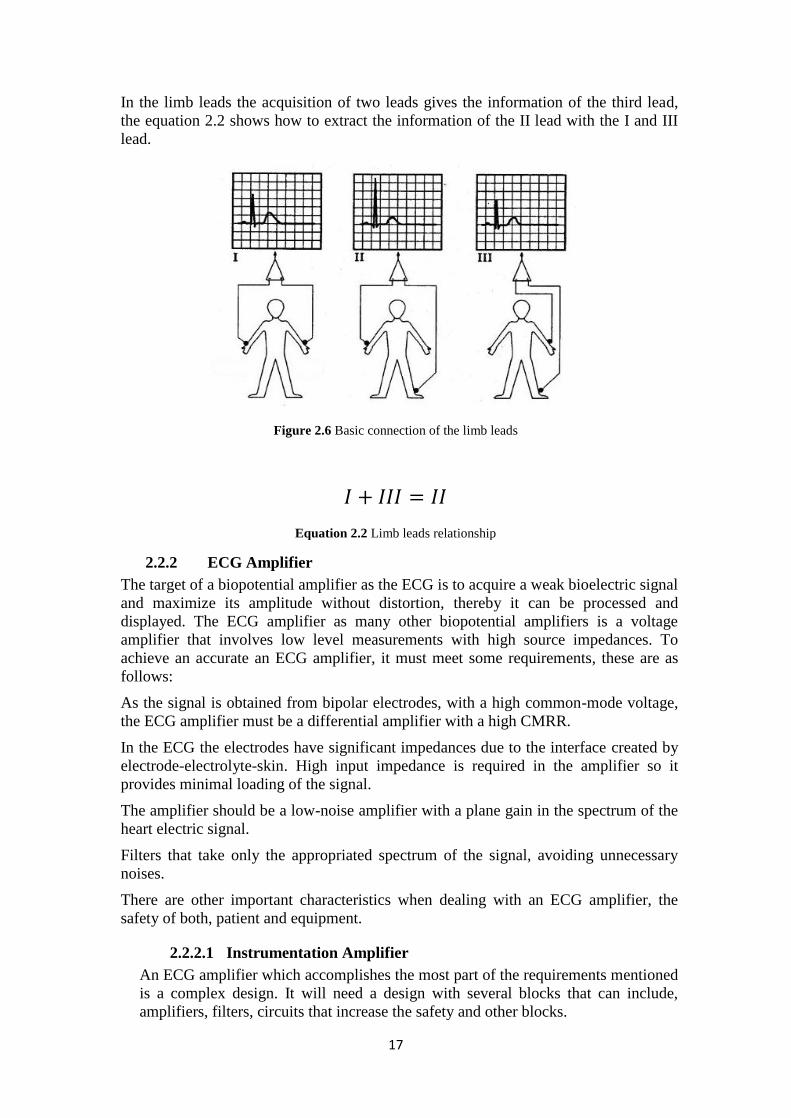
The leads I, II and III often called limb leads are three bipolar leads of the frontal
plane. Lead limbs include electrodes in both arms and in the left leg. The placement of
the electrodes is shown in figure 2.6
Figure 2.5 Dipole field of the heart with a maximum of R wave
17
In the limb leads the acquisition of two leads gives the information of the third lead,
the equation 2.2 shows how to extract the information of the II lead with the I and III
lead.
2.2.2 ECG Amplifier
The target of a biopotential amplifier as the ECG is to acquire a weak bioelectric signal
and maximize its amplitude without distortion, thereby it can be processed and
displayed. The ECG amplifier as many other biopotential amplifiers is a voltage
amplifier that involves low level measurements with high source impedances. To
achieve an accurate an ECG amplifier, it must meet some requirements, these are as
follows:
As the signal is obtained from bipolar electrodes, with a high common-mode voltage,
the ECG amplifier must be a differential amplifier with a high CMRR.
In the ECG the electrodes have significant impedances due to the interface created by
electrode-electrolyte-skin. High input impedance is required in the amplifier so it
provides minimal loading of the signal.
The amplifier should be a low-noise amplifier with a plane gain in the spectrum of the
heart electric signal.
Filters that take only the appropriated spectrum of the signal, avoiding unnecessary
noises.
There are other important characteristics when dealing with an ECG amplifier, the
safety of both, patient and equipment.
2.2.2.1 Instrumentation Amplifier
An ECG amplifier which accomplishes the most part of the requirements mentioned
is a complex design. It will need a design with several blocks that can include,
amplifiers, filters, circuits that increase the safety and other blocks.
Figure 2.6 Basic connection of the limb leads
Equation 2.2 Limb leads relationship
18
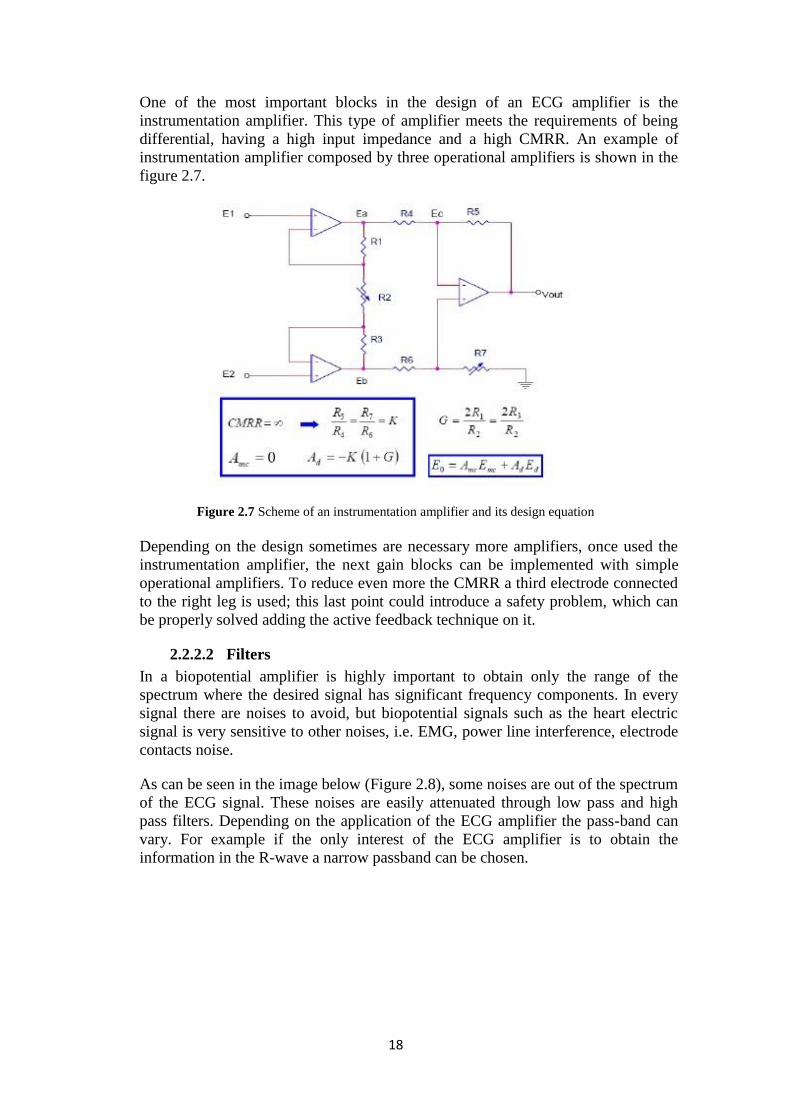
One of the most important blocks in the design of an ECG amplifier is the
instrumentation amplifier. This type of amplifier meets the requirements of being
differential, having a high input impedance and a high CMRR. An example of
instrumentation amplifier composed by three operational amplifiers is shown in the
figure 2.7.
Depending on the design sometimes are necessary more amplifiers, once used the
instrumentation amplifier, the next gain blocks can be implemented with simple
operational amplifiers. To reduce even more the CMRR a third electrode connected
to the right leg is used; this last point could introduce a safety problem, which can
be properly solved adding the active feedback technique on it.
2.2.2.2 Filters
In a biopotential amplifier is highly important to obtain only the range of the
spectrum where the desired signal has significant frequency components. In every
signal there are noises to avoid, but biopotential signals such as the heart electric
signal is very sensitive to other noises, i.e. EMG, power line interference, electrode
contacts noise.
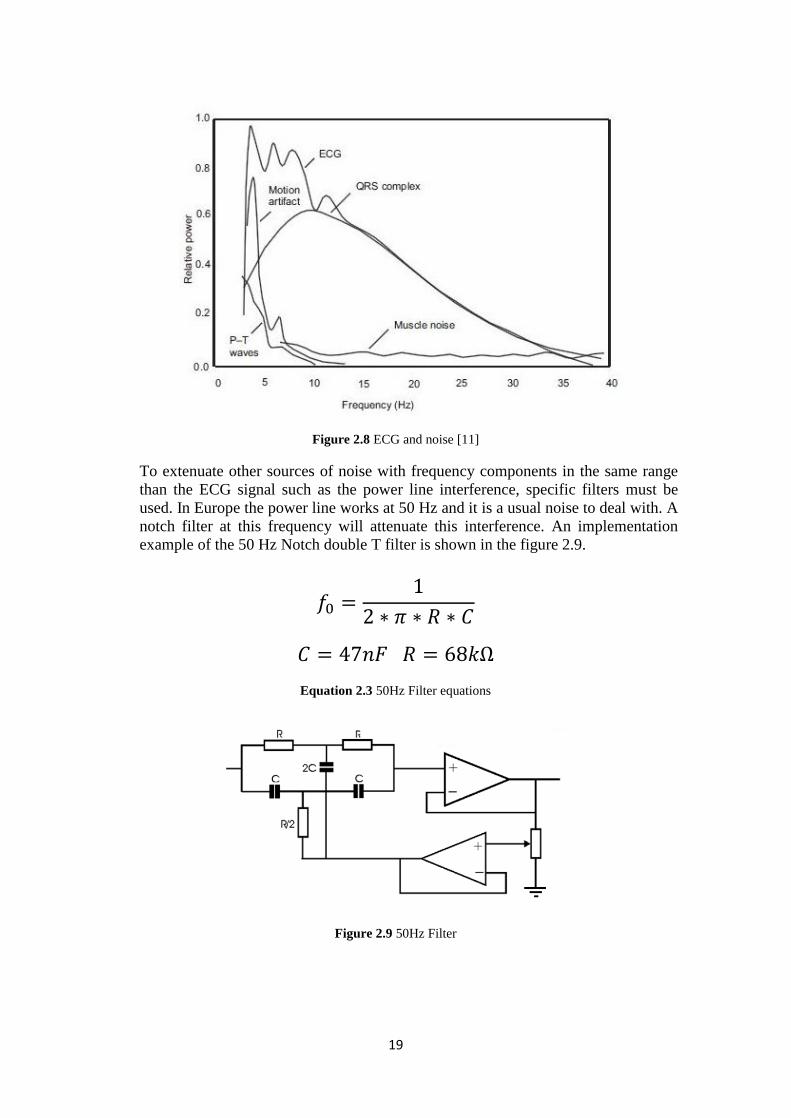
As can be seen in the image below (Figure 2.8), some noises are out of the spectrum
of the ECG signal. These noises are easily attenuated through low pass and high
pass filters. Depending on the application of the ECG amplifier the pass-band can
vary. For example if the only interest of the ECG amplifier is to obtain the
information in the R-wave a narrow passband can be chosen.
Figure 2.7 Scheme of an instrumentation amplifier and its design equation
19
To extenuate other sources of noise with frequency components in the same range
than the ECG signal such as the power line interference, specific filters must be
used. In Europe the power line works at 50 Hz and it is a usual noise to deal with. A
notch filter at this frequency will attenuate this interference. An implementation
example of the 50 Hz Notch double T filter is shown in the figure 2.9.
Figure 2.8 ECG and noise [11]
Equation 2.3 50Hz Filter equations
Figure 2.9 50Hz Filter
20
2.2.3 Safety
It is quite evident that safety should be a much contemplated topic and must be taken
into account carefully, obviously patient‟s health have to be valued over all. Whatever
the application or purpose that involves connecting a person to electronic equipment
connected to the power grid implies a risk to the patient/user for its health due to the
possible effects of the current flow through the body.
In the current effects on human body there are a few factors to be considered.
Magnitude (the more the worst), frequency (the human body impedance varies with
the frequency, therefore the way it affects depends on it. Curiously the 50 Hz from the
grid is one of the worst frequencies that could have been chosen for power carriage
because it allow an easy flow along the body (most dangerous range is [10, 500] Hz.
Exposures, around 100ms are very influenced for the weight and for the current
input/output points in the body, longer shocks than 0.5 or 1 seconds will lead fatally to
a ventricular fibrillation, hereby death. For instance, a very low intensity current across
the heart can be instantly lethal).
The worst case is when the patient is connected directly to ground via the measurement
device. A bad connection or an isolation failure could drive the current through the
patient‟s body. In order to avoid this problem, the precautions to take into account are:
isolate the subject from the system with an isolated instrumentation amplifier and a
separated ground reference than the circuit one, isolate the power system and active
feedback on third electrode using the common voltage as reference.
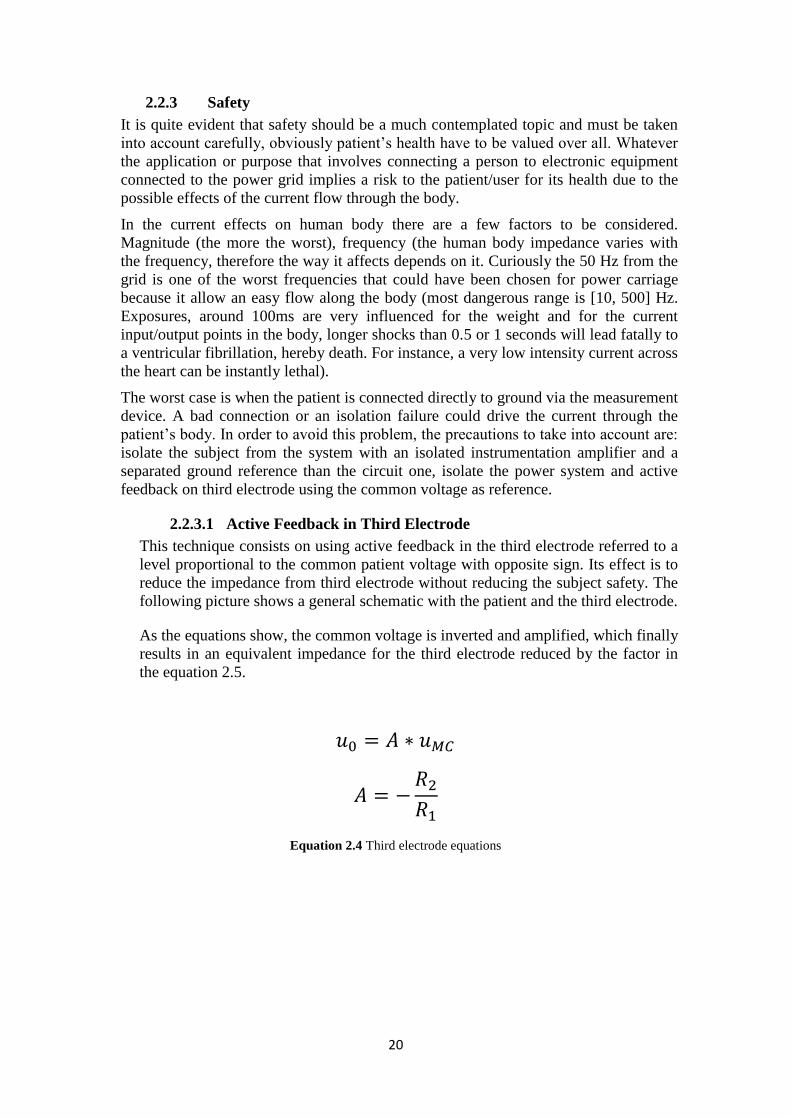
2.2.3.1 Active Feedback in Third Electrode
This technique consists on using active feedback in the third electrode referred to a
level proportional to the common patient voltage with opposite sign. Its effect is to
reduce the impedance from third electrode without reducing the subject safety. The
following picture shows a general schematic with the patient and the third electrode.
As the equations show, the common voltage is inverted and amplified, which finally
results in an equivalent impedance for the third electrode reduced by the factor in
the equation 2.5.
Equation 2.4 Third electrode equations
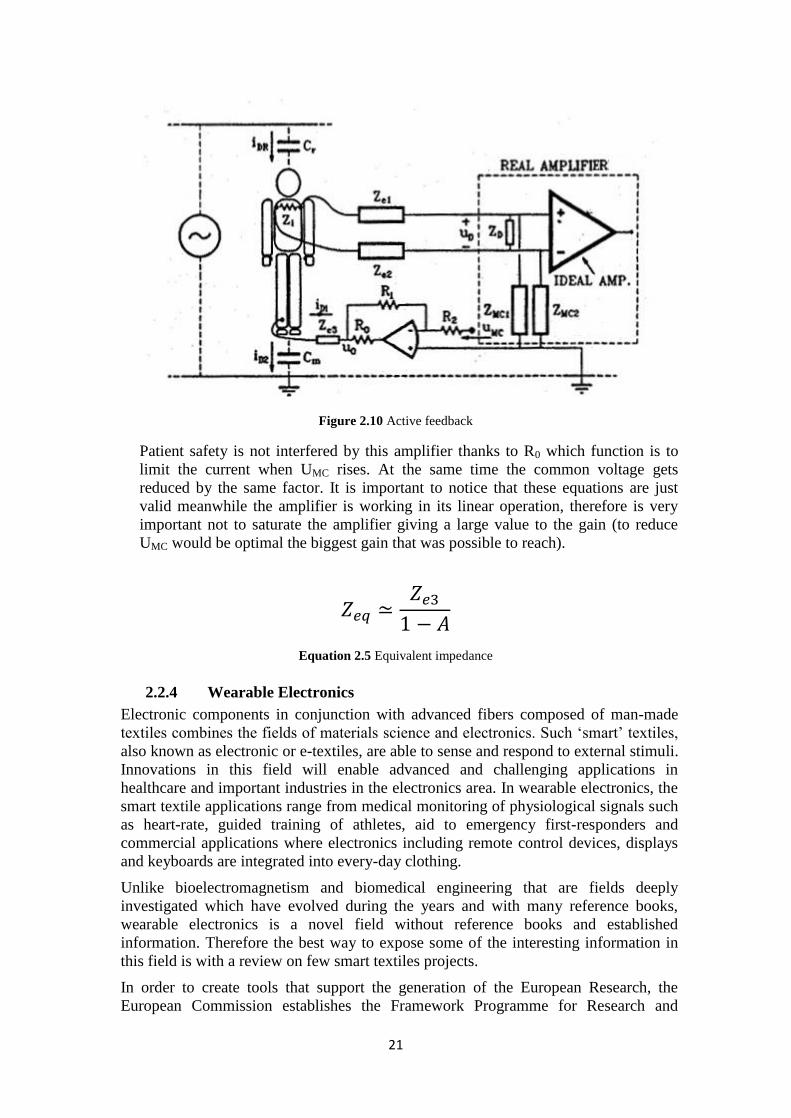
21
Patient safety is not interfered by this amplifier thanks to R0 which function is to
limit the current when UMC rises. At the same time the common voltage gets
reduced by the same factor. It is important to notice that these equations are just
valid meanwhile the amplifier is working in its linear operation, therefore is very
important not to saturate the amplifier giving a large value to the gain (to reduce
UMC would be optimal the biggest gain that was possible to reach).
2.2.4 Wearable Electronics
Electronic components in conjunction with advanced fibers composed of man-made
textiles combines the fields of materials science and electronics. Such „smart‟ textiles,
also known as electronic or e-textiles, are able to sense and respond to external stimuli.
Innovations in this field will enable advanced and challenging applications in
healthcare and important industries in the electronics area. In wearable electronics, the
smart textile applications range from medical monitoring of physiological signals such
as heart-rate, guided training of athletes, aid to emergency first-responders and
commercial applications where electronics including remote control devices, displays
and keyboards are integrated into every-day clothing.
Unlike bioelectromagnetism and biomedical engineering that are fields deeply
investigated which have evolved during the years and with many reference books,
wearable electronics is a novel field without reference books and established
information. Therefore the best way to expose some of the interesting information in
this field is with a review on few smart textiles projects.
In order to create tools that support the generation of the European Research, the
European Commission establishes the Framework Programme for Research and
Figure 2.10 Active feedback
Equation 2.5 Equivalent impedance
22
Technological Development. In the Sixth Framework Programme that include
activities in the period 2002-2006 seven [4] projects were related with smart textile
and flexible wearable systems. The Stella project is a sample that shows what the
research on smart textiles can do.
2.2.4.1 Stella Project
Stella project consisted of developing stretchable electronics for large area
application for use in health care systems, wellness clothes and for integrated
electronics in stretchable parts and products. In the Stella project several [5]
systems and applications were developed, here three final applications are shown.
2.2.4.2 Stella Activity Monitor
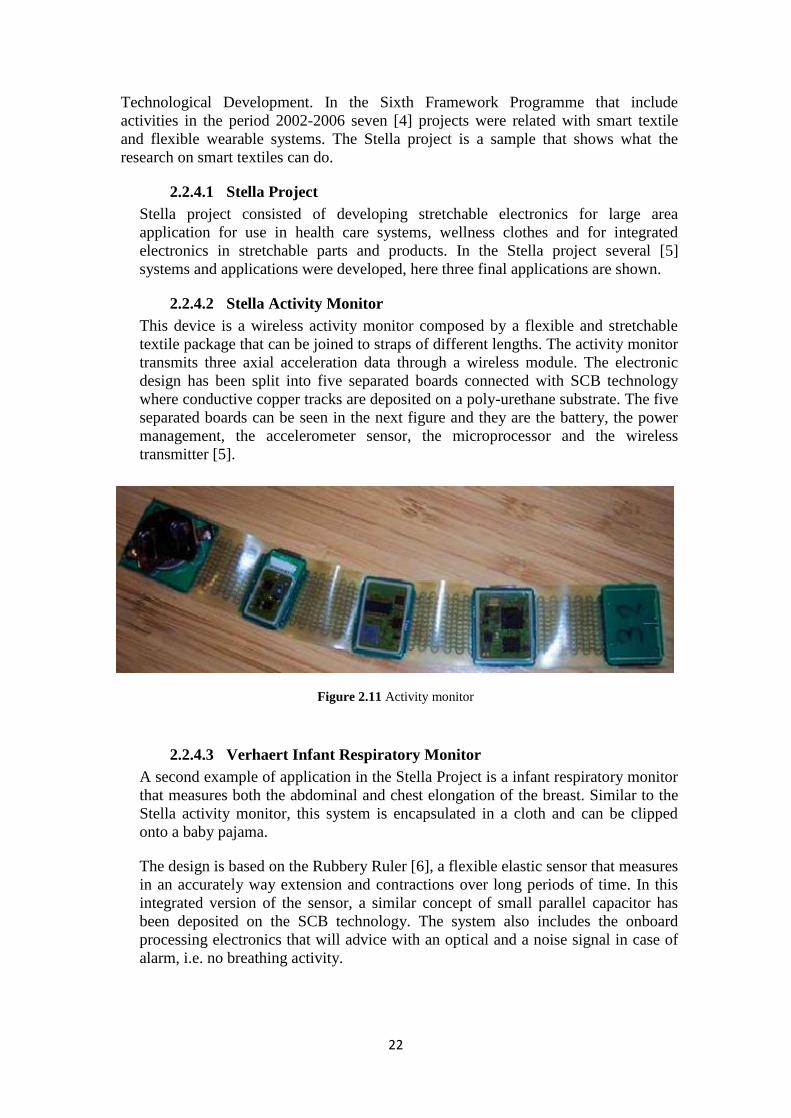
This device is a wireless activity monitor composed by a flexible and stretchable
textile package that can be joined to straps of different lengths. The activity monitor
transmits three axial acceleration data through a wireless module. The electronic
design has been split into five separated boards connected with SCB technology
where conductive copper tracks are deposited on a poly-urethane substrate. The five
separated boards can be seen in the next figure and they are the battery, the power
management, the accelerometer sensor, the microprocessor and the wireless
transmitter [5].
2.2.4.3 Verhaert Infant Respiratory Monitor
A second example of application in the Stella Project is a infant respiratory monitor
that measures both the abdominal and chest elongation of the breast. Similar to the
Stella activity monitor, this system is encapsulated in a cloth and can be clipped
onto a baby pajama.
The design is based on the Rubbery Ruler [6], a flexible elastic sensor that measures
in an accurately way extension and contractions over long periods of time. In this
integrated version of the sensor, a similar concept of small parallel capacitor has
been deposited on the SCB technology. The system also includes the onboard
processing electronics that will advice with an optical and a noise signal in case of
alarm, i.e. no breathing activity.
Figure 2.11 Activity monitor
23
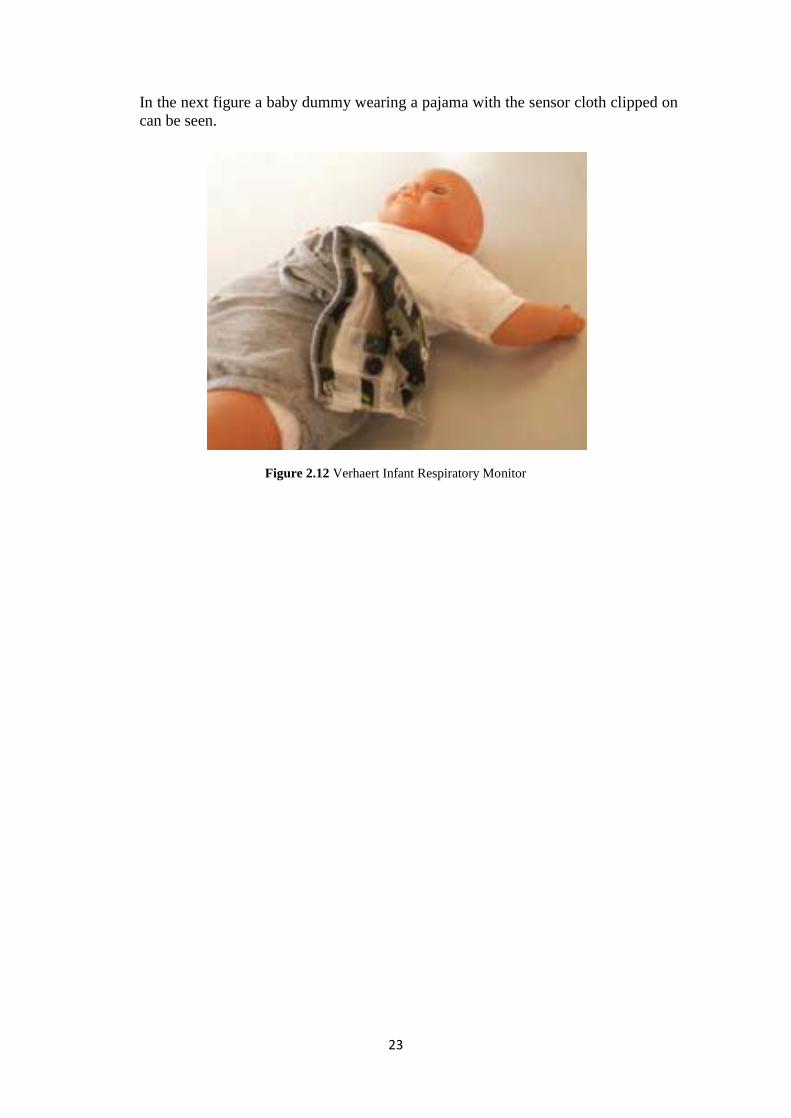
In the next figure a baby dummy wearing a pajama with the sensor cloth clipped on
can be seen.
Figure 2.12 Verhaert Infant Respiratory Monitor

24
CHAPTER 3.
MATERIALS & METHODS
3.1 Introduction
In this chapter, the materials and methods used and implemented to execute this
thesis work will be explained. First of all in the materials section the software used in
the design and simulation procedure will be shown, after that the material used for the
physical implementation will be presented. Finally the methods section will show a
short description of the ECG signal acquisition and the peak detector besides the
physical implementation process.
3.2 Software
3.2.1 Matlab
Programming environment for algorithm development, data analysis, visualization,
and numerical computation.
3.2.2 MIT-BIH Arrhythmia Database
The MIT-BIH Arrhythmia Database [7], [8] contains 48 half-hour excerpts of two-
channel ambulatory ECG recordings, obtained from 47 subjects studied by the BIH
Arrhythmia Laboratory between 1975 and 1979. Twenty-three recordings were chosen
at random from a set of 4000 24-hour ambulatory ECG recordings collected from a
mixed population of inpatients (about 60%) and outpatients (about 40%) at Boston's
Beth Israel Hospital; the remaining 25 recordings were selected from the same set to
include less common but clinically significant arrhythmias that would not be well-
represented in a small random sample.
3.2.3 Altium
Altium Designer is a unified electronic product development environment, involving
the major of aspects in the electronic development process. In this project the
following aspects of the Altium Software have been used:
Front-end design and capture
Signal circuit simulation
Figure 3.1 Matlab Logo
25
Physical PCB design
Altium Designer includes edition tools and software engines useful to perform almost
any step in the development process of an electronic product. The edition, compilation
and process of all documents are performed within the Altium Designer environment.
The software supports tools too, such as FPGA route software, or third party HDL
simulation and synthesis software. The Design Explorer Integration Platform is in the
layer below Altium Designer, it brings together Altium Designer's several editors and
software engines. It also provides a consistent interface across all the tools and editors.
Depending on the specific license purchased the set of features and functionality that is
available will vary. The Altium Designer environment allows the user to set up the
workspace in a fully customizable way.
3.3 Instrumentation
3.3.1 Oscilloscope Tektronik MSO2012
This Oscilloscope includes two analog channels that were used to visualize the ECG
and pulse detection signals simultaneously. It also has an USB port to easily store the
information in a memory stick.
3.4 Materials
3.4.1 3M Electrodes
The electrode area is 4cm x 3,2cm, it is an Ag/AgCl electrode with radiolucent gel, and
repositionable. It is used especially recommended for cardiac monitoring, event
detection, telemetry and Holter for adults and pediatrics use. The up side consists of
soft cloth and in the down side is covered with conductive adhesive gel. None skin
preparation needed.
Figure 3.2 Altium Logo
Figure 3.3 3M Electrode
26
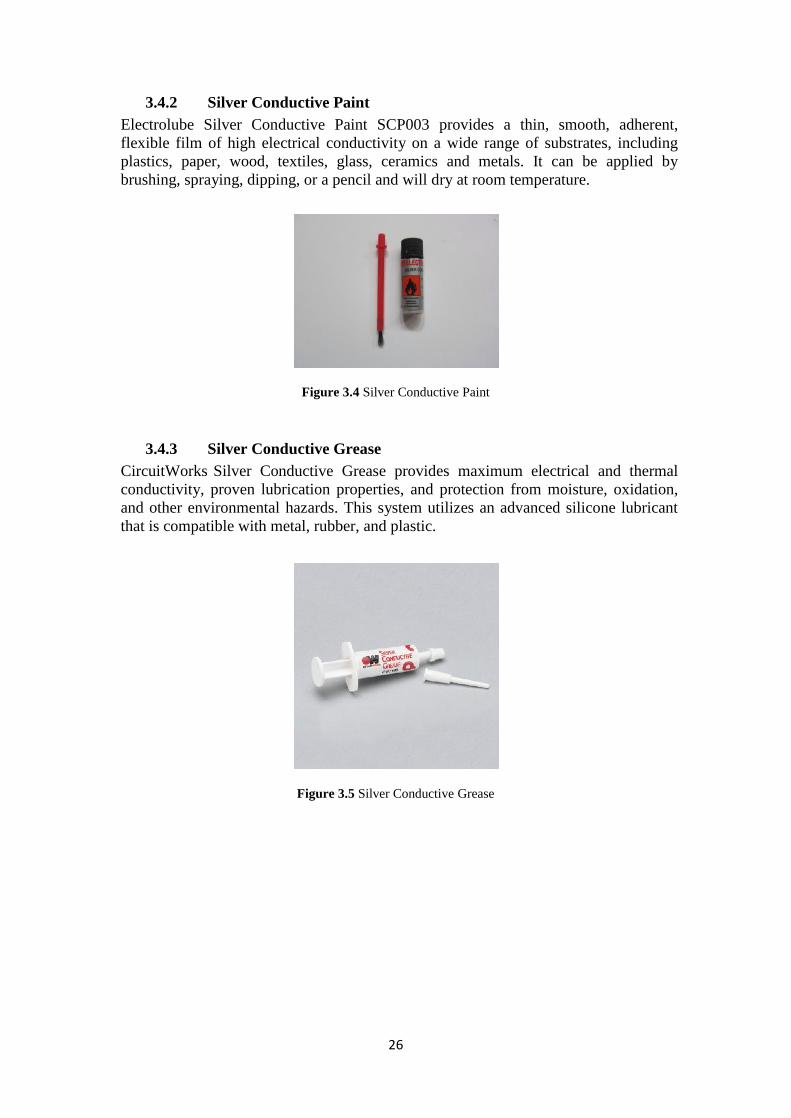
3.4.2 Silver Conductive Paint
Electrolube Silver Conductive Paint SCP003 provides a thin, smooth, adherent,
flexible film of high electrical conductivity on a wide range of substrates, including
plastics, paper, wood, textiles, glass, ceramics and metals. It can be applied by
brushing, spraying, dipping, or a pencil and will dry at room temperature.
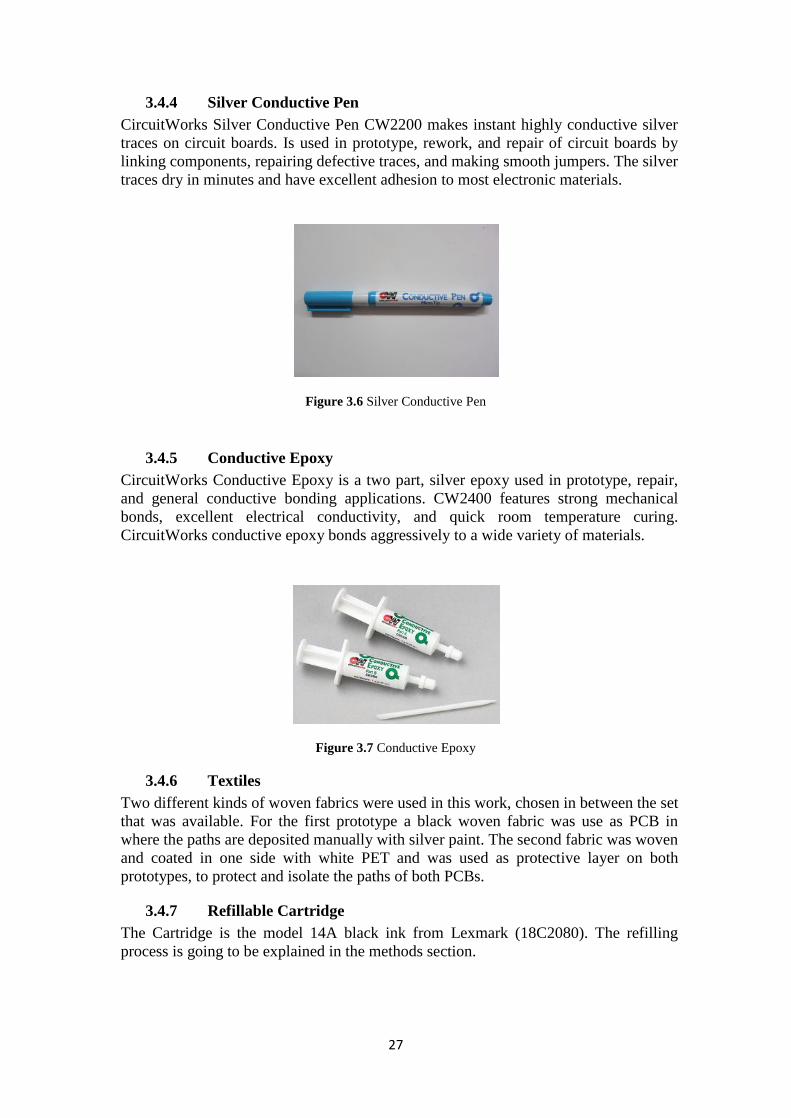
3.4.3 Silver Conductive Grease
CircuitWorks� Silver Conductive Grease provides maximum electrical and thermal
conductivity, proven lubrication properties, and protection from moisture, oxidation,
and other environmental hazards. This system utilizes an advanced silicone lubricant
that is compatible with metal, rubber, and plastic.
Figure 3.5 Silver Conductive Grease
Figure 3.4 Silver Conductive Paint
27
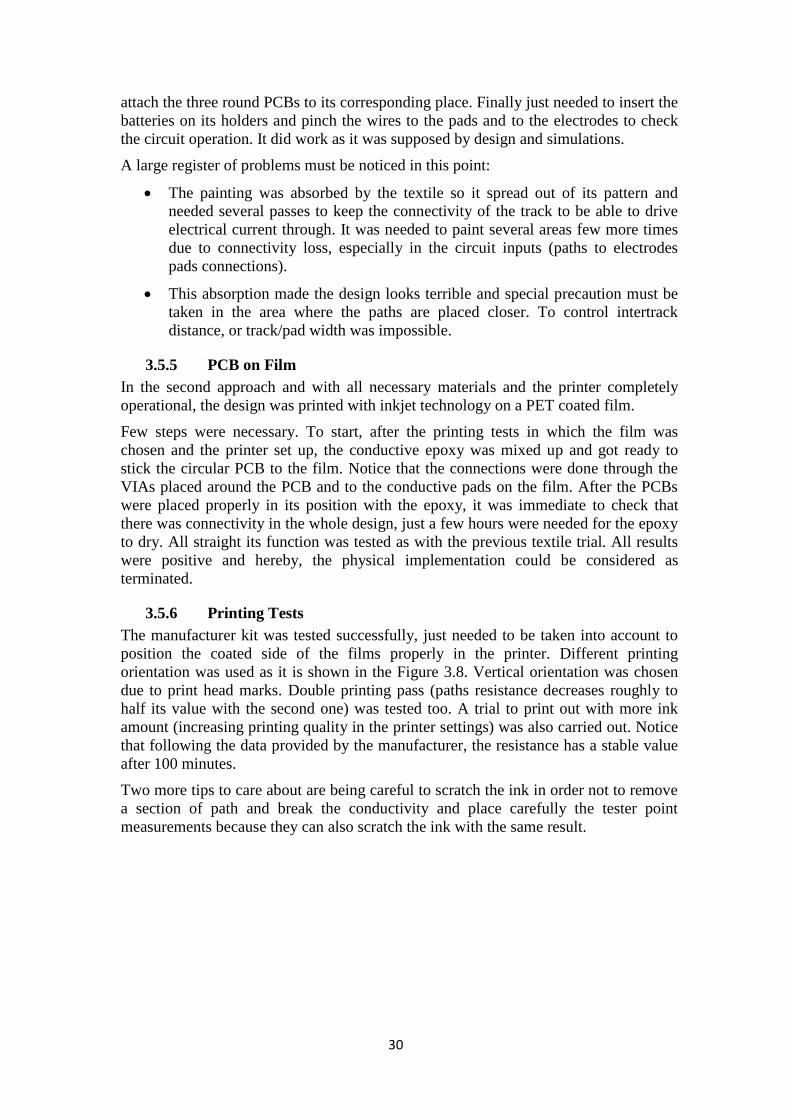
3.4.4 Silver Conductive Pen
CircuitWorks Silver Conductive Pen CW2200 makes instant highly conductive silver
traces on circuit boards. Is used in prototype, rework, and repair of circuit boards by
linking components, repairing defective traces, and making smooth jumpers. The silver
traces dry in minutes and have excellent adhesion to most electronic materials.
3.4.5 Conductive Epoxy
CircuitWorks Conductive Epoxy is a two part, silver epoxy used in prototype, repair,
and general conductive bonding applications. CW2400 features strong mechanical
bonds, excellent electrical conductivity, and quick room temperature curing.
CircuitWorks conductive epoxy bonds aggressively to a wide variety of materials.
3.4.6 Textiles
Two different kinds of woven fabrics were used in this work, chosen in between the set
that was available. For the first prototype a black woven fabric was use as PCB in
where the paths are deposited manually with silver paint. The second fabric was woven
and coated in one side with white PET and was used as protective layer on both
prototypes, to protect and isolate the paths of both PCBs.
3.4.7 Refillable Cartridge
The Cartridge is the model 14A black ink from Lexmark (18C2080). The refilling
process is going to be explained in the methods section.
Figure 3.6 Silver Conductive Pen
Figure 3.7 Conductive Epoxy

28
3.4.8 Conductive Ink
The nano ink 9101 is a silver Conductive Ink 50 ml water based and manufactured by
Methode Development.
3.4.9 Films
Among the films provided by the Methode Electronics, the one selected to implement
the prototype was the labeled 3G Clear PET treated for enhanced adhesion.
3G White PET treated for enhanced adhesion.
Opaque PET
3.4.10 PCB
A two layer printed circuit board from EzPCB [9] manufacturer was used. This
enterprise has a worldwide online ordering service, they also offer an assembling
service but it was decided to be done by ourselves.
The electronic parts (SMD) of the design were soldered on the top layer, both layers
(top and bottom) were used to route the paths.
3.5 Methods
3.5.1 Signal Processing for Simulation
In order to design and validate the algorithm to detect HR from ECG measurements,
few signals from the MIT-BIH Arrhythmia Database have been adapted using Matlab
enabling the simulate of the HR detection circuit in Altium.
The functions used to adapt the signal are the following:
function [C]=signal_vpwl()
%Path where the function is cd('C:\Users\MARC\UPV\ASIB\Prácticas\PRACTICA
4\Student_1.01_versionalumno\SmallSignals') %1st load 1-lead signal in Matlab with leedat
signal=leedat; signal=signal(1,:); %first signal is separated(there are 2 signals in each
file)
%2nd resample the signal from 360Hz to 90 Hz
signal_90=resample(signal,1,4);
%3rd Generate the time array (in this case the array has 2500 points)
t=0:1/90:(length(signal_90)-1)/90;
%4th Normalize the signal suppressing dc and set the maximum amplitude to
0.005
signal_90=signal_90-mean(signal_90); signal_90=signal_90/max(abs(signal_90)); signal_90=signal_90/200;

29
3.5.2 Conductive Ink Printer Development Kit from Methode Electronics
To produce the second prototype a specific development kit manufactured by Methode
Electronics was used. In addition to a Lexmark printer a model X2670, the 9101
conductive ink and the film with the surface treated coating film.
3.5.3 Cartridge Refilling
This procedure was needed because ink cartridges provided by the manufacturer were
the Lexmark 14 cartridge type instead of the Lexmark 14a.
After researching on the topic, a cartridge Lexmark 14a was bought because it can be
refilled not like the 14, that is intended for single use.
Several steps were needed to success the refilling:
1. Break cartridge sealing and sand the rough corners.
2. Clean the sponge where the black ink is stored with water under the tap and
also cleaning with some tissue the interior of the cartridge.
3. Put back the sponge in the cartridge and inject on it 15ml of the conductive ink
with a syringe from the 50 ml extra bottle provided by the manufacturer.
4. Seal the cartridge.
5. Calibrate the printer following the manual.
3.5.4 PCB Interconnection on Textile
As a first approach to achieve the intended goal of this project, it was decided to
transfer the pattern to a one side coated textile and draw the paths and pads with silver
conductive paint. The first step was to print with black ink in a regular film the pattern,
to cut it afterwards with a cutter, stick it to the textile and paint it. The next step was to
%5th Generate an auxiliary variable that has the time and the signal
interspersed in order to adjust the data to Altium .pwl format
C=zeros(1,2*length(signal_90));
close()
figure() plot(t,signal_90) for i = 1:length(signal_90) C(2*i-1)=t(i); C(2*i)=signal_90(i); end
%fid = fopen('C:\Users\MARC\UPV\BORAS\PFC\Altium Project 3\prueba.pwl', 'w'); fid = fopen('C:\Users\MARC\Desktop\prueba.pwl', 'w');
%fwrite(fid,C,'integer*4'); fprintf(fid ,'%f ', C); fclose(fid);
%6th In Altium create a VPWL part and choose fullpath in properties->Models->
Edit
30
attach the three round PCBs to its corresponding place. Finally just needed to insert the
batteries on its holders and pinch the wires to the pads and to the electrodes to check
the circuit operation. It did work as it was supposed by design and simulations.
A large register of problems must be noticed in this point:
The painting was absorbed by the textile so it spread out of its pattern and
needed several passes to keep the connectivity of the track to be able to drive
electrical current through. It was needed to paint several areas few more times
due to connectivity loss, especially in the circuit inputs (paths to electrodes
pads connections).
This absorption made the design looks terrible and special precaution must be
taken in the area where the paths are placed closer. To control intertrack
distance, or track/pad width was impossible.
3.5.5 PCB on Film
In the second approach and with all necessary materials and the printer completely
operational, the design was printed with inkjet technology on a PET coated film.
Few steps were necessary. To start, after the printing tests in which the film was
chosen and the printer set up, the conductive epoxy was mixed up and got ready to
stick the circular PCB to the film. Notice that the connections were done through the
VIAs placed around the PCB and to the conductive pads on the film. After the PCBs
were placed properly in its position with the epoxy, it was immediate to check that
there was connectivity in the whole design, just a few hours were needed for the epoxy
to dry. All straight its function was tested as with the previous textile trial. All results
were positive and hereby, the physical implementation could be considered as
terminated.
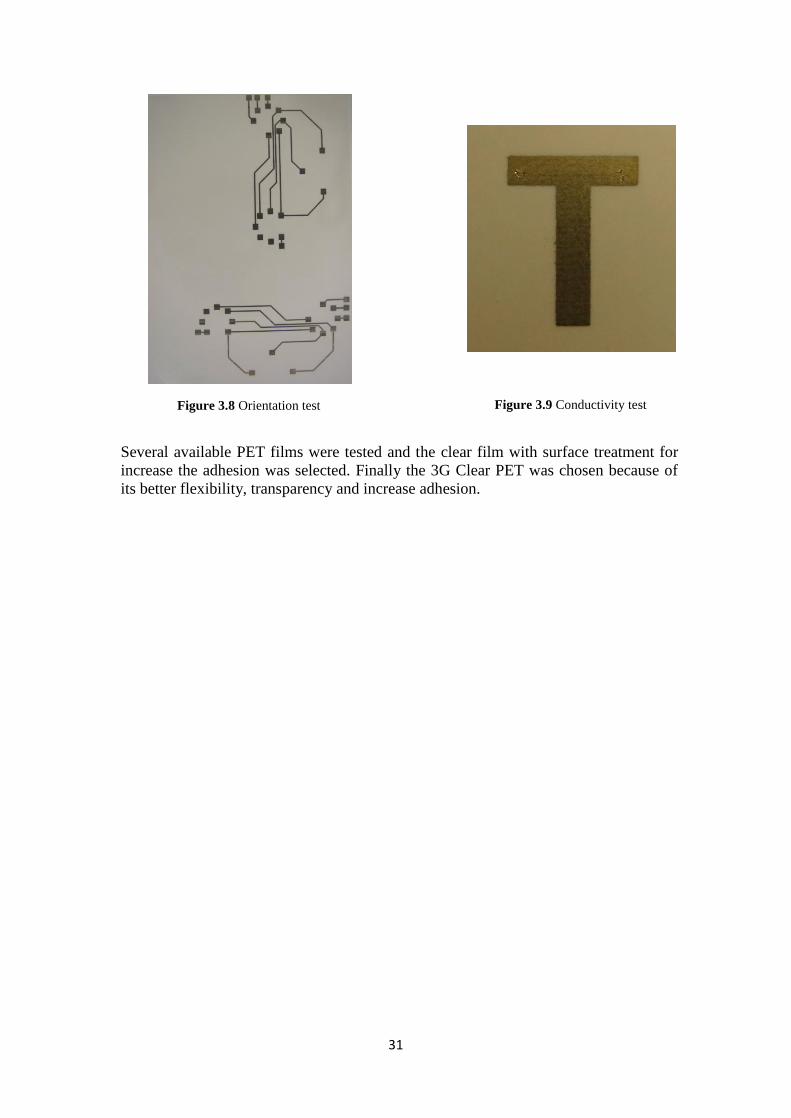
3.5.6 Printing Tests
The manufacturer kit was tested successfully, just needed to be taken into account to
position the coated side of the films properly in the printer. Different printing
orientation was used as it is shown in the Figure 3.8. Vertical orientation was chosen
due to print head marks. Double printing pass (paths resistance decreases roughly to
half its value with the second one) was tested too. A trial to print out with more ink
amount (increasing printing quality in the printer settings) was also carried out. Notice
that following the data provided by the manufacturer, the resistance has a stable value
after 100 minutes.
Two more tips to care about are being careful to scratch the ink in order not to remove
a section of path and break the conductivity and place carefully the tester point
measurements because they can also scratch the ink with the same result.
31
Several available PET films were tested and the clear film with surface treatment for
increase the adhesion was selected. Finally the 3G Clear PET was chosen because of
its better flexibility, transparency and increase adhesion.
Figure 3.8 Orientation test
Figure 3.9 Conductivity test
32
CHAPTER 4.
ECG CIRCUIT DESIGN
4.1 Introduction
This chapter has been decided to be an independent section due to its importance in
the project. Considerable amount of time was invested in this part because re-design
was needed for meeting the final goal in the project due to technological, time and other
issues that influenced in all those decisions.
4.2 Development
As a first design approach and with first requirements for the project, the whole
ECG spectrum for acquiring the complete PQRST (see figure 2.4) was going to be
acquired. In this design the filters included the range in between 2Hz and 150Hz with a
gain of 62dB (roughly 1150 in linear units). A notch filter to eliminate the 50Hz from
the power grid was also implemented. An active feedback for the third electrode was
added in order to reduce the common signal level in the patient and to maintain stable
the transistor‟s quiescent point in the instrumentation amplifier where the electrodes are
connected. It is important that the amplifier for this third electrode is connected to the
common mode voltage and a resistor with a large resistance value in between to comply
with safety guidelines (See 2.2.3 Safety).
Other point to notice is that several trials were conducted to eliminate the
amplification extra stage. It was tried to implement the gain in the Sallen-Key filter,
even reordering the different circuit stages but the frequency response resulted very
altered and changing, so finally it was decided to reject the idea and keep the extra gain
amplifier.
To avoid extending beyond necessary this chapter, only the final design will be
explained.
Finally it was decided that the goal of the project would become to detect the heart
rate using a LED, for which is often required the detection of the R wave, so all filters
were re-designed to filter the QRS complex and extra electronics were added to be able
to detect the R-wave, that is the maximum point of the ECG signal. A detail of the
filtering appears in the image below.
At that point of the project was decided to eliminate the 50 Hz filter (even though
the power will not interfere with 50Hz because batteries are being used, some 50 Hz
noise still gets coupled) and to replace all third electrode electronics to a simple resistor
connected to ground. Note that this action is not increasing patient risk because the
ground reference in the design is the middle point in between two batteries.
33
A new paradigm was proposed in order to simplify the design because of the
difficulty that developing everything in textile resulted too complicated and the
technology needed for it is not totally developed. The final implementation is a hybrid
solution where the circuit is distributed into three round PCBs and the interconnection
in between them as well as the access to the pads is done printing over a PET.
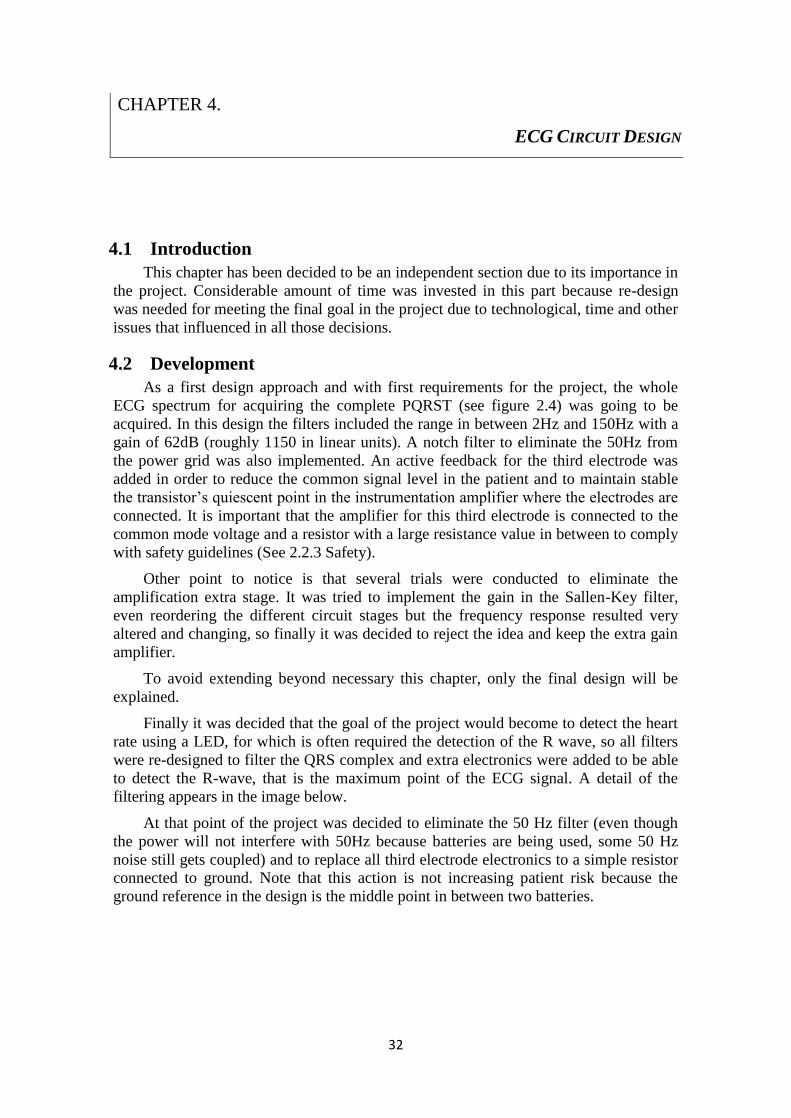
Figure 4.1 ECG and noise power spectrum [11]
34
4.3 Design
The design of this ECG amplifier includes instrumentation amplifier, filtering and
gain stages, peak detector and power. A brief explanation of the functionality and its
design of each stage are going to be stated.
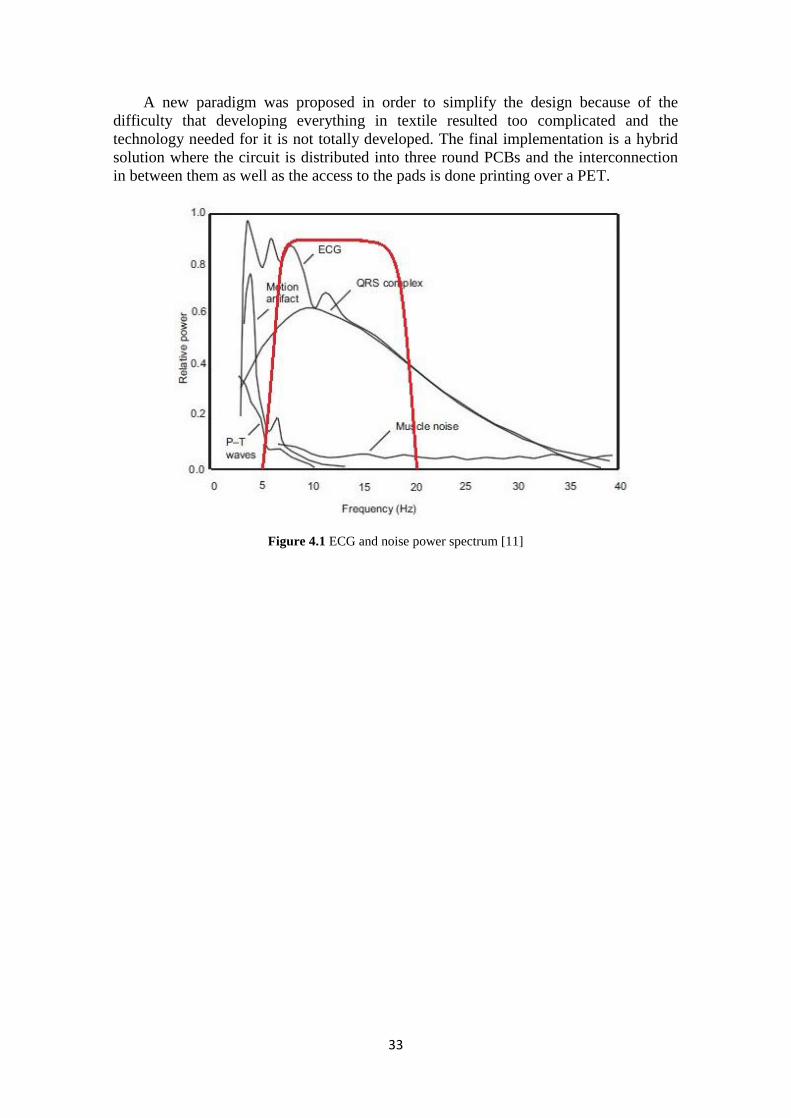
4.3.1 Instrumentation Amplifier
To reduce the number of electronic parts involved in the design, it was decided to use
an IC for the instrumentation amplifier.The chosen IC is the AD620 which is well
suited for medical applications. The advantages of using an IC are basically a CMRR
upper than 120dB and the possibility of varying the gain with a single resistor avoiding
to design it and to place several parts and its interconnections.
The theoretical desired gain value is 50. Using a resistor a gain of 50.4 is
obtained. Two capacitors are set to avoid noise in the IC.
Figure 4.2 Input stage. Instrumentation amplifier
Equation 4.1 Gain Equation
35
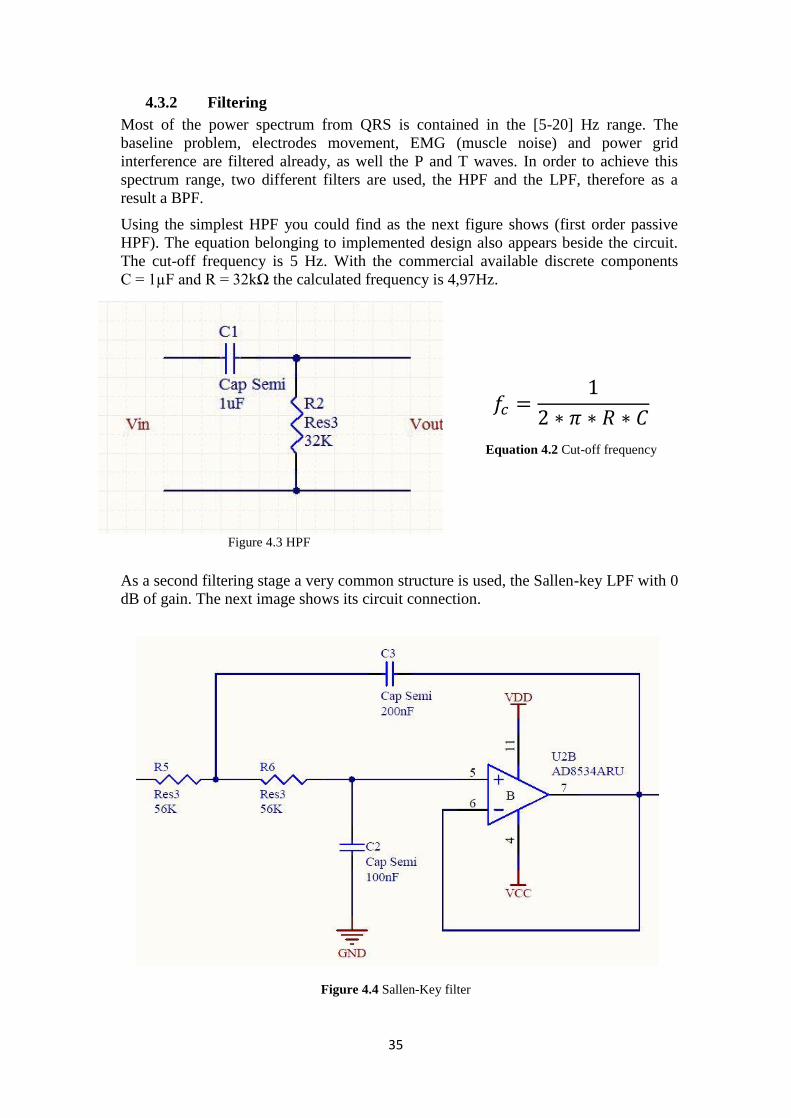
4.3.2 Filtering
Most of the power spectrum from QRS is contained in the [5-20] Hz range. The
baseline problem, electrodes movement, EMG (muscle noise) and power grid
interference are filtered already, as well the P and T waves. In order to achieve this
spectrum range, two different filters are used, the HPF and the LPF, therefore as a
result a BPF.
Using the simplest HPF you could find as the next figure shows (first order passive
HPF). The equation belonging to implemented design also appears beside the circuit.
The cut-off frequency is 5 Hz. With the commercial available discrete components
C = 1µF and R = 32k the calculated frequency is 4,97Hz.
As a second filtering stage a very common structure is used, the Sallen-key LPF with 0
dB of gain. The next image shows its circuit connection.
Figure 4.4 Sallen-Key filter
Figure 4.3 HPF
Equation 4.2 Cut-off frequency
36
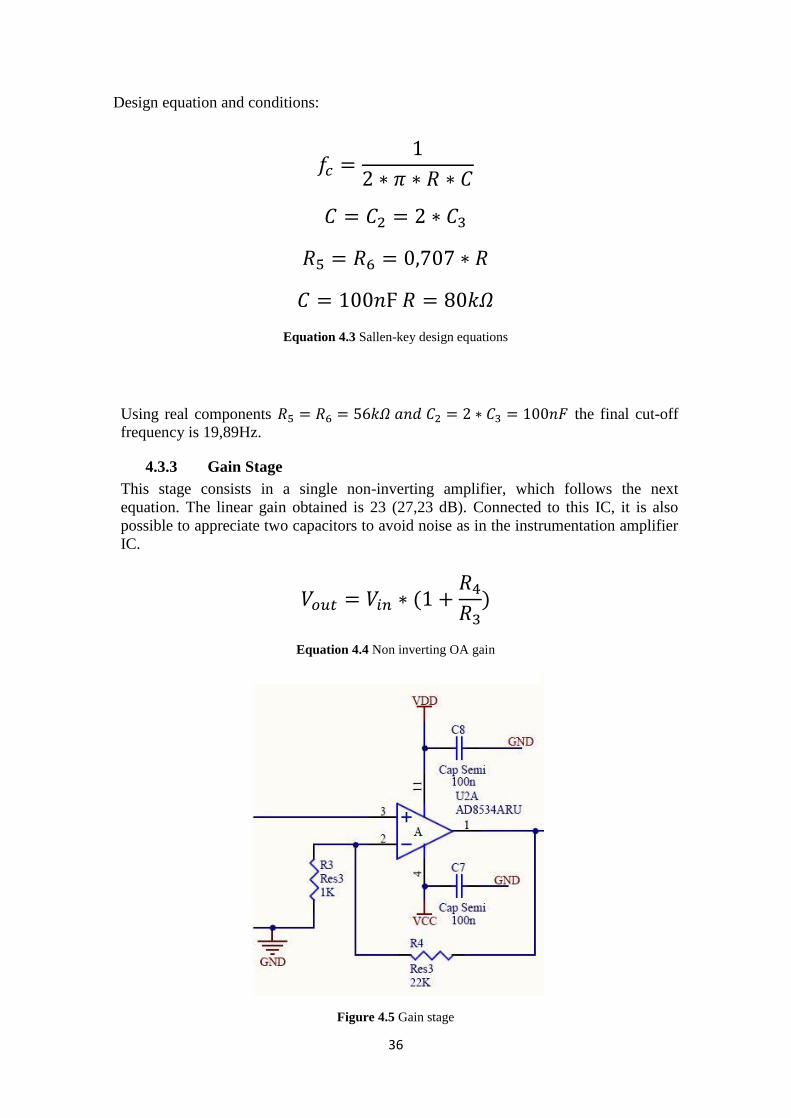
Design equation and conditions:
Using real components the final cut-off
frequency is 19,89Hz.
4.3.3 Gain Stage
This stage consists in a single non-inverting amplifier, which follows the next
equation. The linear gain obtained is 23 (27,23 dB). Connected to this IC, it is also
possible to appreciate two capacitors to avoid noise as in the instrumentation amplifier
IC.
Equation 4.3 Sallen-key design equations
Figure 4.5 Gain stage
Equation 4.4 Non inverting OA gain
37
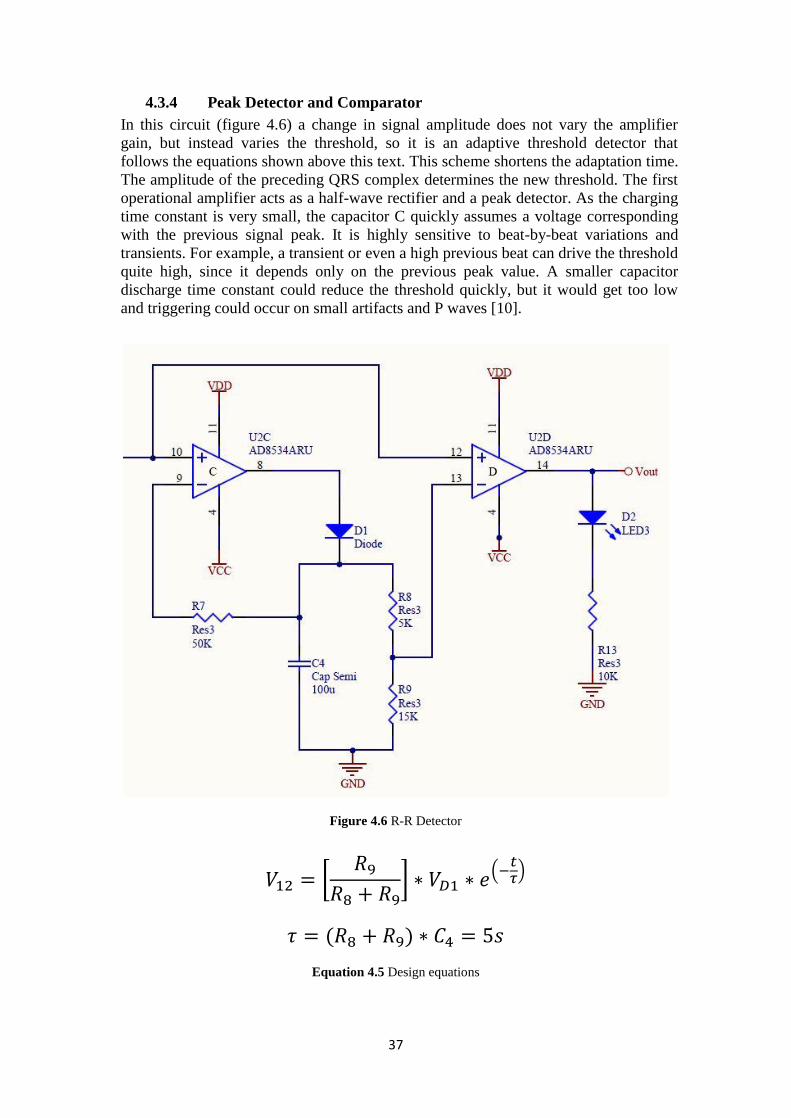
4.3.4 Peak Detector and Comparator
In this circuit (figure 4.6) a change in signal amplitude does not vary the amplifier
gain, but instead varies the threshold, so it is an adaptive threshold detector that
follows the equations shown above this text. This scheme shortens the adaptation time.
The amplitude of the preceding QRS complex determines the new threshold. The first
operational amplifier acts as a half-wave rectifier and a peak detector. As the charging
time constant is very small, the capacitor C quickly assumes a voltage corresponding
with the previous signal peak. It is highly sensitive to beat-by-beat variations and
transients. For example, a transient or even a high previous beat can drive the threshold
quite high, since it depends only on the previous peak value. A smaller capacitor
discharge time constant could reduce the threshold quickly, but it would get too low
and triggering could occur on small artifacts and P waves [10].
Figure 4.6 R-R Detector
Equation 4.5 Design equations
38
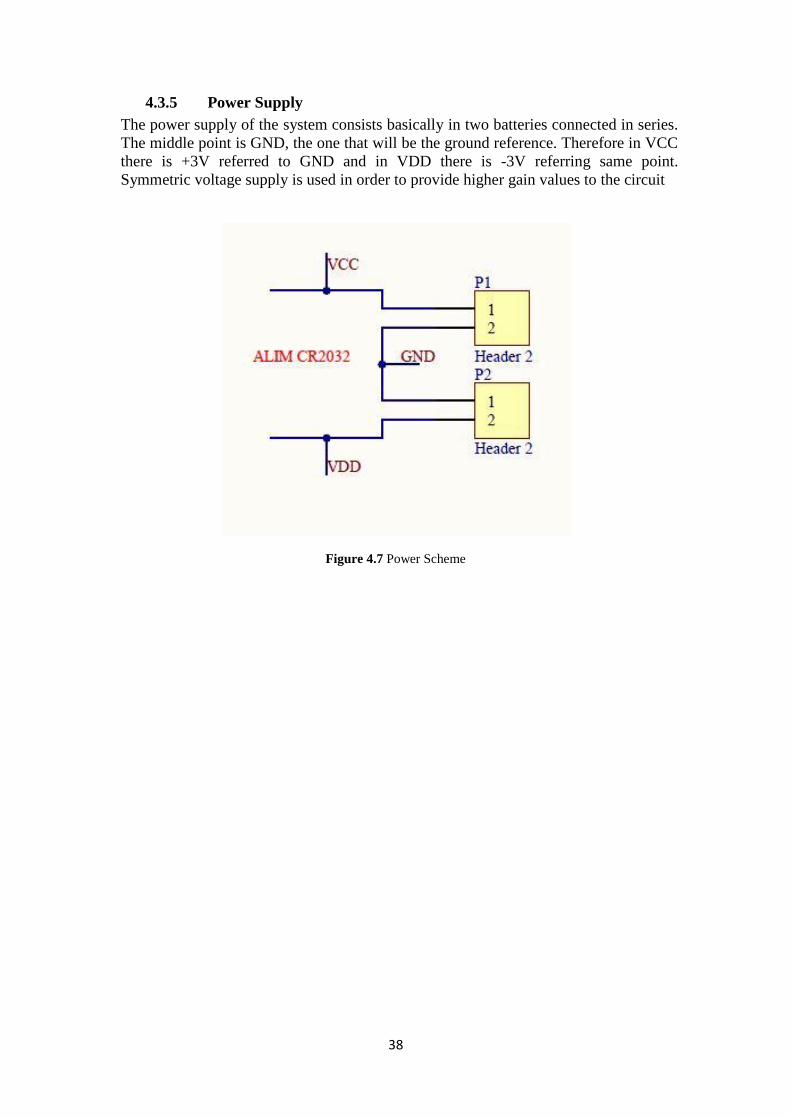
4.3.5 Power Supply
The power supply of the system consists basically in two batteries connected in series.
The middle point is GND, the one that will be the ground reference. Therefore in VCC
there is +3V referred to GND and in VDD there is -3V referring same point.
Symmetric voltage supply is used in order to provide higher gain values to the circuit
Figure 4.7 Power Scheme
39
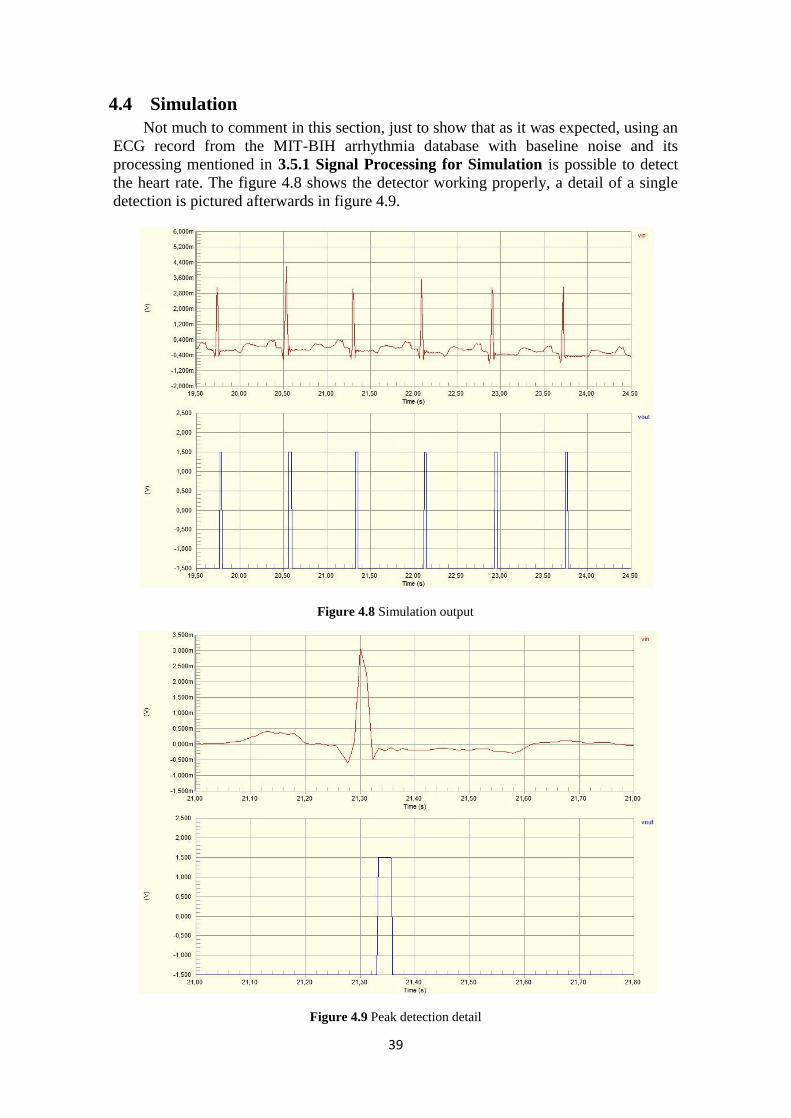
4.4 Simulation
Not much to comment in this section, just to show that as it was expected, using an
ECG record from the MIT-BIH arrhythmia database with baseline noise and its
processing mentioned in 3.5.1 Signal Processing for Simulation is possible to detect
the heart rate. The figure 4.8 shows the detector working properly, a detail of a single
detection is pictured afterwards in figure 4.9.
Figure 4.8 Simulation output
Figure 4.9 Peak detection detail
40
4.5 Test Board
The next natural step is to mount the circuit in a test board before doing the PCB
design and order its production. For this stage all components were ordered in DIP
format despite for the AD8534 (it has four operational amplifiers inside) in which an
adaptor was necessary because it is just available in SMD format.
All the montage was carried out and tested for first time with a real ECG signal
from a subject and the obtained results were as expected.
4.6 PCB on Textile
The methodology and problems that occurred on its development are better
explained in chapter three at section 3.5.4. A short review is listed here.
1. Print the template in a film.
2. Cut it as a negative pattern.
3. Cut the piece of chosen textile.
4. Apply the conductive pen to the pattern.
5. Remark over the pen with the silver painting.
6. Check connectivity and repaint problematic areas.
Figure 4.10 Textile ECG detector
41
4.7 PCB on Film
The procedure to implement this second ECG detector was easier and much shorter
than the first one once all materials and the printer were ready. The steps followed are
listed below:
1. Two printing passes on the film (increases its conductivity).
2. Soldering all components to the PCB
3. Attach the circular boards to its correct position on the film with the
conductive epoxy and let it dry long enough.
4. Insert the batteries.
5. Connect the wires to the electrodes and to the pads.
Figure 4.11 Film ECG detector
42
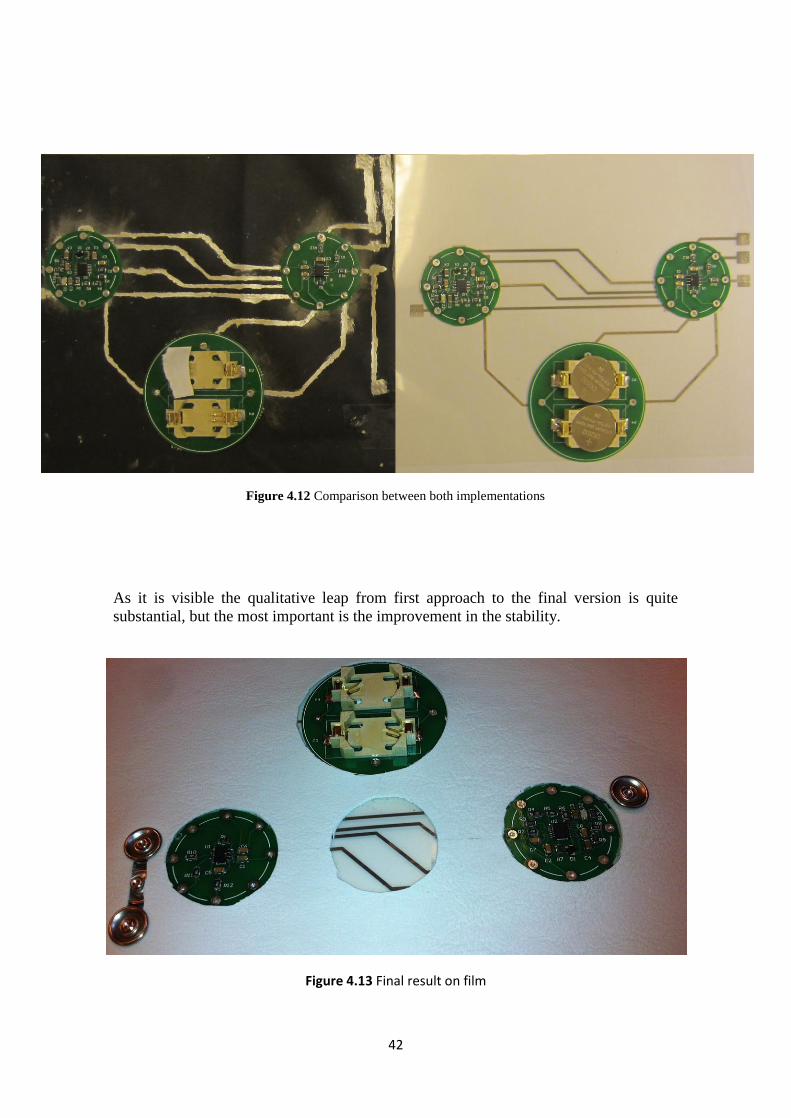
As it is visible the qualitative leap from first approach to the final version is quite
substantial, but the most important is the improvement in the stability.
Figure 4.12 Comparison between both implementations
Figure 4.13 Final result on film
43
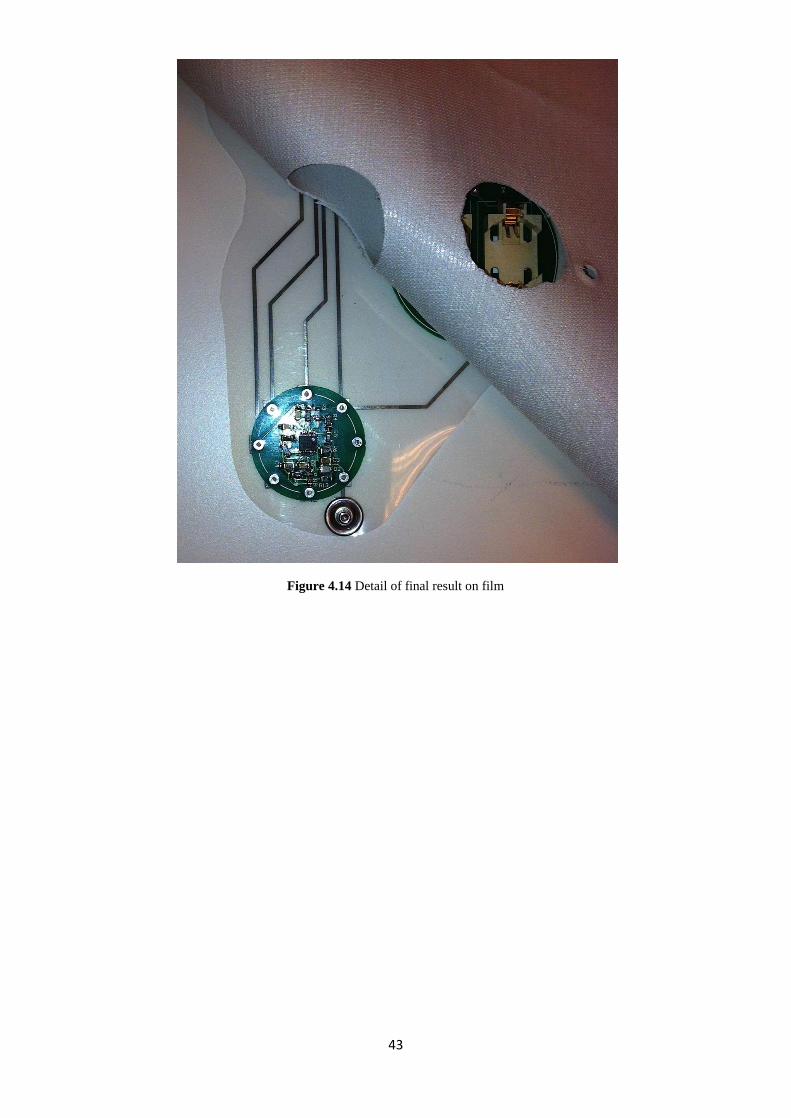
Figure 4.14 Detail of final result on film
44
CHAPTER 5.
VALIDATION& RESULTS
After testing the circuits and verify that everything worked properly few tests with
both circuits were done. None of the people who participated in these tests had
significant cardiac problems, thereby the signals acquired match with the sinus rhythm.
In this chapter the results consist of measures taken with the oscilloscope of both
the ECG and the peak detection signal. As two circuits were developed (textile and
film) the results of both are going to be shown. The signals are plotted with Matlab
without any process, thanks to the USB port that the Tektronik oscilloscope has.
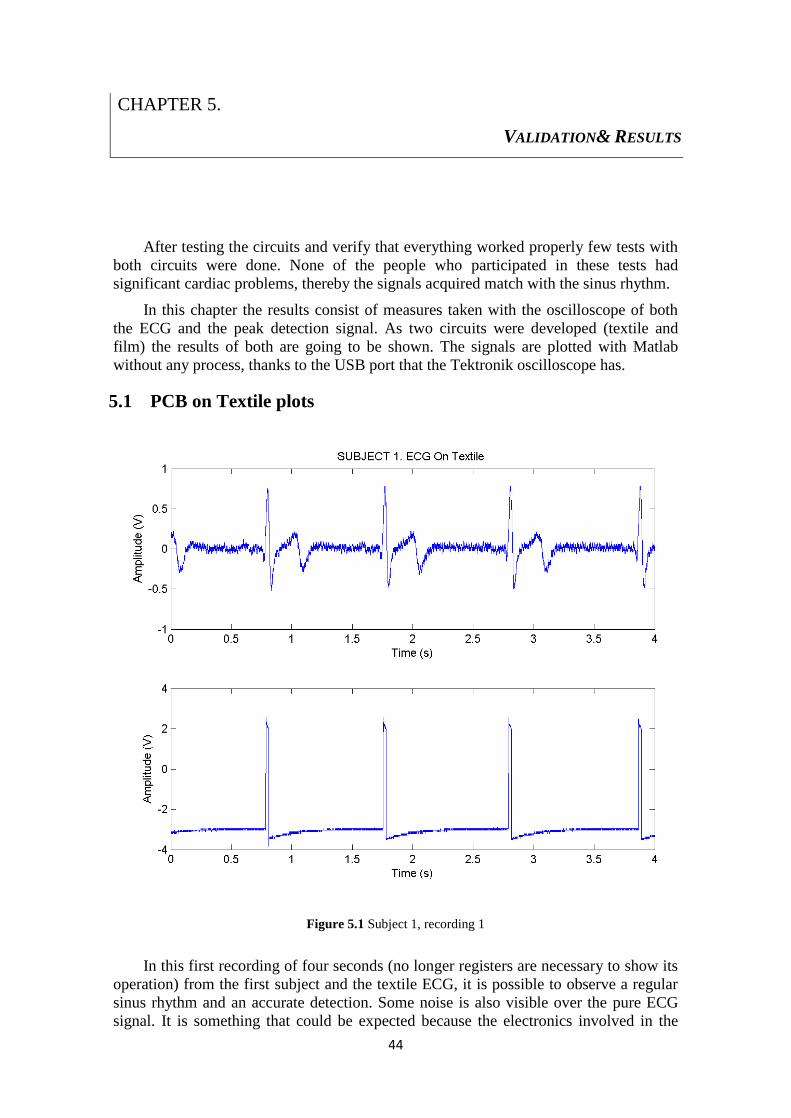
5.1 PCB on Textile plots
In this first recording of four seconds (no longer registers are necessary to show its
operation) from the first subject and the textile ECG, it is possible to observe a regular
sinus rhythm and an accurate detection. Some noise is also visible over the pure ECG
signal. It is something that could be expected because the electronics involved in the
Figure 5.1 Subject 1, recording 1
45
circuit were reduced to the bare minimum. A more precise signal could be acquired
improving the filtering stages and adding the 50 Hz filter for the power grid; other facts
could also be taken into account to enhance a bit more its quality, like shielded cables,
active feedback, etc.
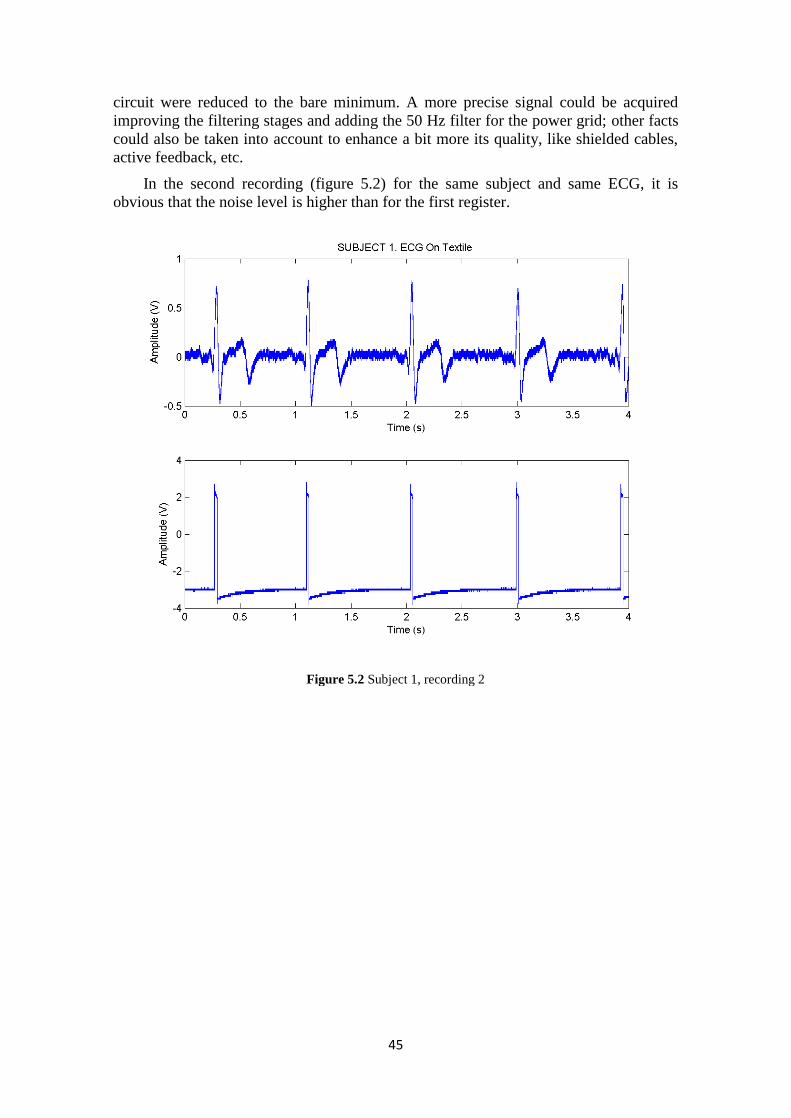
In the second recording (figure 5.2) for the same subject and same ECG, it is
obvious that the noise level is higher than for the first register.
Figure 5.2 Subject 1, recording 2
46
5.2 PCB on Film Plots
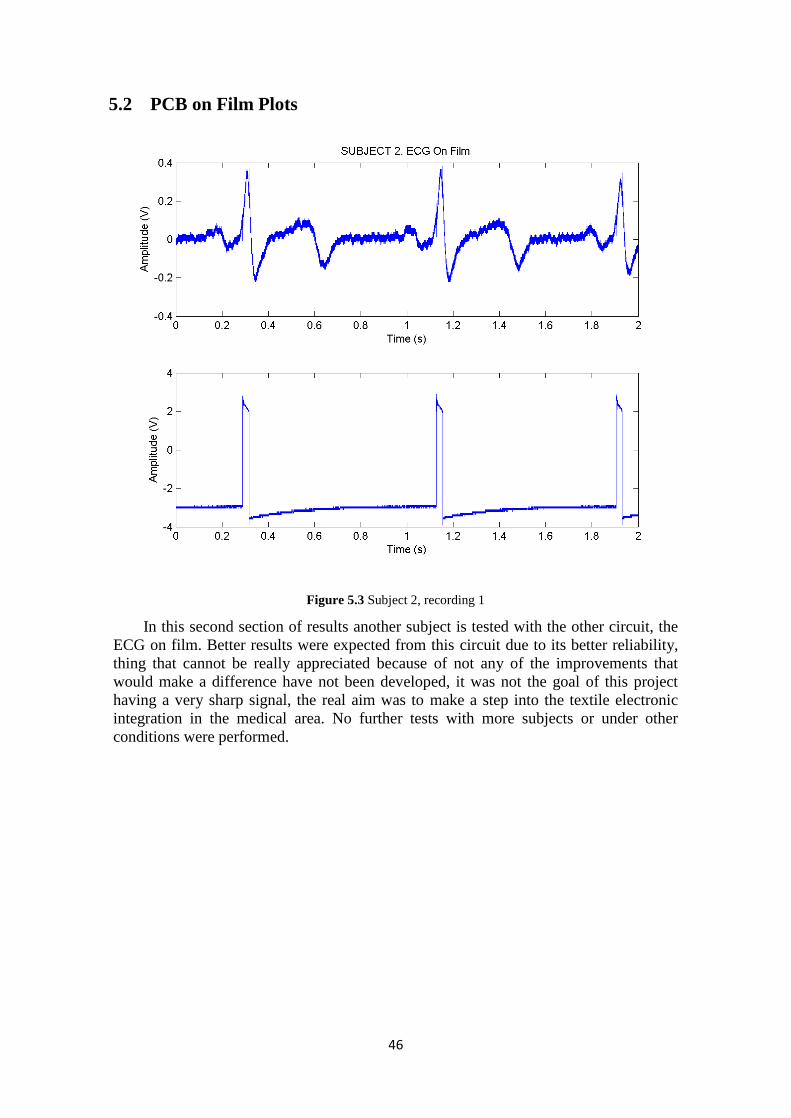
In this second section of results another subject is tested with the other circuit, the
ECG on film. Better results were expected from this circuit due to its better reliability,
thing that cannot be really appreciated because of not any of the improvements that
would make a difference have not been developed, it was not the goal of this project
having a very sharp signal, the real aim was to make a step into the textile electronic
integration in the medical area. No further tests with more subjects or under other
conditions were performed.
Figure 5.3 Subject 2, recording 1
47
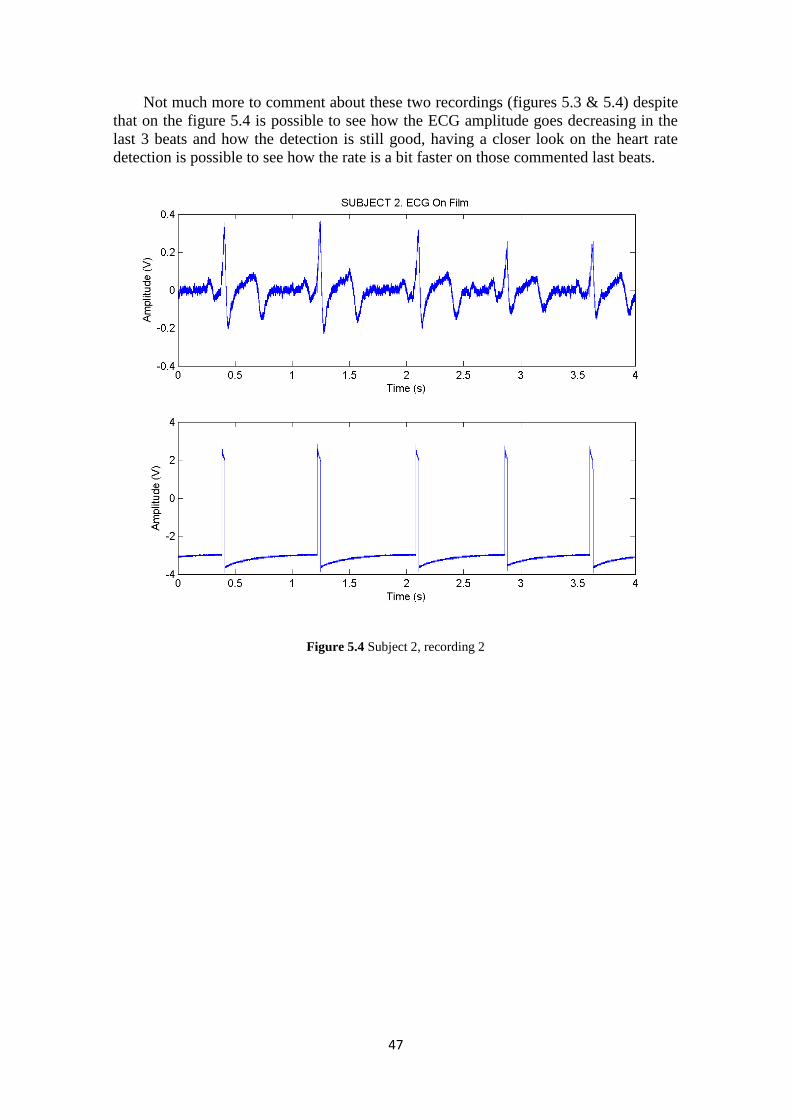
Not much more to comment about these two recordings (figures 5.3 & 5.4) despite
that on the figure 5.4 is possible to see how the ECG amplitude goes decreasing in the
last 3 beats and how the detection is still good, having a closer look on the heart rate
detection is possible to see how the rate is a bit faster on those commented last beats.
Figure 5.4 Subject 2, recording 2

48
CHAPTER 6.
CONCLUSION & FUTURE WORK
6.1 Conclusion
Attempting to implement a stress detector, a research in non-invasive
measurements was carried out. Based on the conclusions it was decided to design an
ECG recorder and heart rate detector based on textiles.
Due to issues related with the present situation of the wearable electronics
technology, a redesign was necessary in order to make the project affordable. It
consisted on implementing a hybrid design where the circuit was distributed into three
round PCBs and the interconnection in between was done using printed electronics
techniques on stretchable substrates. Two different models were carried out, one on a
film and another one on a textile. Tests were executed with both models in the ECG
acquisition and in the heart rate detection with successful results.
Despite the main goal consisting on develop a simple three electrodes ECG
detector prototype on textile for stress assessment was not achieved, the attainment of a
medium-term goal, a hybrid system that works properly satisfy the authors. Future work
will be necessary if the final goal want to be reached.
This is a first step in order to obtain full textile circuits that can help to improve the
life style, not only in the health field but in countless fields. Many years of studies and
research will be needed to create a solid technology that allows the humanity to
integrate all kind of wearable electronics into his garments.
6.2 Future Work
After demonstrate that the hybrid design prototype works properly acquiring the
ECG signal and detecting the R-wave, future work, especially in the e-textile area, is
needed in order to improve the usability and power of a textile ECG.
Some of the possibilities to enhance the initial design are:
Implement the ECG totally over a textile as it was the first idea in this thesis. This
technology still has to evolve to be viable a full electronic design without using any
rigid support for the components. Other point to take into account is that with the actual
technology the components and paths get fast deteriorated with the washing, daily use
and stretching, so further research is also required in this field.
When the technique to integrate the components in the textile would be mature,
another way to have a better system would be to increase the filters order and adding the
50 Hz rejection filter that was omitted to confer ease to the circuitry and its textile
ensemble.
Flexible plain batteries have been in development and research in the last few years this is an optimal option to reduce the size, weight and to improve the flexibility of the mentioned system. Mention that in the project, one of those three PCBs was totally occupied by the

49
batteries and its holders. Another extra for the power would be to redesign for using single supply amplifiers reducing to just one battery.

50
REFERENCES
[1] Malmivuo, J.; Plonsey, R. “Bioelectromagnetism - Principles and
Applications of Bioelectric and Biomagnetic Fields,” (New York: Oxford
University Press), 1995
[2] Bronzino, J. “The Biomedical Engineering Handbook,” 3rd Edition, (CRC
Press), 2006
[3] Webster, J. “Medical Instrumentation – Application and Design,” 4th
Edition 2011
[4] Cluster of EC co-financed projects on Smart fabrics, interactive Textile.
(2010). Retrieved August, 2012, from http://csnej106.csem.ch/sfit/
[5] Stella. (2011). Retrieved August, 2012, from http://www.stella-project.de/
[6] Cimmino, A.; Klein, A.; Togawa, T.;, Spelman, F.; Opat, G.; “A wide range,
conformable, capacitive displacement transducer,” In Proceedings of the
8th international conference on solid-state sensors and actuators
(transducers 95/Eurosensors IX). Stockholm, Sweden;. pp. 84–85. 1995
[7] Moody G.; Mark R. “The impact of the MIT-BIH Arrhythmia Database,”
IEEE Enineering in Medicine and Biology Society, vol. 20(3), pp. 45-50.
May-June 2001.
[8] Goldberger, L; Amaral, .; Glass, L.; Hausdorff J.; Ivanov, P.; Mark, R.;
Mietus, J.; Moody, G.; Peng, C.; Stanley, H.; “PhysioBank, PhysioToolkit,
and PhysioNet: Components of a New Research Resource for Complex
Physiologic Signals,” Circulation 101(23):e215-e220. 2000
[9] EzPCB Electronic Ltd. (2011). Retrieved July, 2012,from
http://www.ezpcb.com
[10] Thakor N.; Webster, J.; Tompkins, J. “Optimal QRS detector,” Medical &
Biological Engineering & Computing, vol. 21 ,pp. 343 350, 1983
[11] Tompkins, J. “Biomedical Digital Signal Processing: C Language Examples
and Laboratory Experiments for the IBM PC,”, pp.246-274, (Prentice Hall),
1993
51
ANNEX
Technological approaches to assessment of alertness
and stress with non-invasive physiological
measurements.
Introduction
Nowadays ,in a rapidly changing society where everyone has a lot of
responsibilities and chores, stress is a common cause of poor job performance, illness,
disease and sometimes risk for the own person and for the rest (think of jobs as police,
firefighters, professional drivers, etc..). Rapid detection on symptoms of stress and act
on them can prevent major problems. A real-time personal stress monitor based on a
device implemented with a textile ECG would help in that innovative task. Here it is
presented a literary research carried out before starting the thesis; it pretends to evaluate
the available technologies for this stress and alertness assessment, detection and its
analysis.
Research Methodology
The proceed basically will consist in a deep research of papers and articles in the
HB INSPEC´s database, IEEEXplore and Google searcher with related issues to
assessment and stress diagnostics. In first instance, a very generic research with topics
related with “Technological approaches to assessment of alertness and stress with non-
invasive physiological measurements” such as stress monitoring, mental load
monitoring, stress detection ECG and so on; some of the searches provided lots of
results, some other almost none and some a big amount without any relation with our
investigation. To continue focusing on the important results and narrowing the list, extra
keywords were added to restrict the number of results. The sort of papers obtained for
each topic was classified in function of the method used for obtaining a response of the
stress and alertness in persons. After set in order all the articles, we read all of them and
checked the most important references. Once this was done we collected the articles that
concern to our issue To improve the initial research in the INSPEC database we
checked the intern references of the most important papers and downloaded a certain
amount of them.
Skin Conductance
The references encountered in the literature show that SC is a good measure of the
sympathetic activation which is related with the stress reaction. Although few records
were found, all of them are quite recent (the oldest is from 2005).
Few records, nine, were found related with the use of SC as an indicator of stress.
Only one of them [1] refers to SC as a separate system to detect stress. The rest of the
references combine SC with other physiological signals in order to evaluate the stress
level. [2 & 3] Use SC and HRV together in a stress detection system for real time
situations. [4-6] Consider SC with Blood Volume Pulse, Pupil Diameter and Skin
Temperature in a system for detecting stress on computer users. SC has also been used
with EMG and ECG to infer the emotional state of a user in a human-robot interaction
52
[7] and detect stress in driving situations [8]. The last record [9], uses SC besides
oximetry pulse to detect the alertness and mental stress on drivers as well.
Electroencephalography
The strong correlation between EEG power spectra in each frequency band to the
mental state makes the EEG one of the best physiological measures to detect stress.
Recent studies [10] based on the frontal asymmetry theory demonstrate that the relation
between alpha and beta waves ratio in left and right hemisphere can be used to indicate
the existence of stress.
When research about detection of stress and alertness involving physiological
measures has been done, most of the results in it are related with EEG. The search of
keywords as “stress EEG” or “alertness EEG” in the INSPEC database produce many
results, most of them deal in a general way with the issue.
Based on the results of the research and considering EEG as one of the main
indicators of stress level and alertness, a limited number of articles related with EEG
were reported in here [10-15].
[10] Does a review of previous works using the EEG signal as input for stress
evaluation. [11] Use EEG to classify workload on pilots during task executions. In the
area of alertness and drowsiness [12, 13, 41] realize an analysis on driver‟s fatigue. On
[14] a study involving military and civilian volunteers show that high frequency EEG
may be applied for electroencephalographic monitoring of cognitive performance. A
real-time detection of alertness model based on multi-channel EEG power spectra
estimation was presented on [15].
Heart Rate Variability
HRV reflects the cardiac events and represents one of the most important markers
to detect mental stress and ease to implement. We selected in total twenty-five papers
for this section.
Most of found papers behave towards how to relate, measure and interpret the
stress and mental load with HRV measured through the ECG, [16-32] remark that [20]
uses breath monitoring. The key point is to detect the stress early enough to avoid major
problems and its consequences.
Based on the previous conducted research, the next classification is appropriate
according to the topics that have been used for the investigation and its target.
As you can appreciate in the following sources enumeration, one of the most
developed fields related with the HRV is the measurement of the mental load and stress
assessment through the ECG [16-32].
As second point, we tackled the multiple measurements systems, which use
different kind of techniques to achieve better and more reliable results [33-35]. Despite
of this, HRV is not a very extended method because it is still under research and
development, but it is being pointed as the future leading trend. Just a few papers are
going to be listed, but it is possible to find some extra amount with deeper research if it
is considered necessary.
53
The third point in relevance we want to remark is the HRV with Stress Response
Inventory. It tries to relate the HRV with stress through different type of forms and in a
different selection of scenarios with external controlled stimulus [36-39]. [38 & 39]
combines the photoplethysmography as an extra tool to diagnose.
The fourth spot is taken by HRV combined with EEG to detect lack of alertness.
EEG is one of most developed applications in driving monitoring fatigue and
drowsiness. Another extended development field is the evaluation and control of mental
load in risky jobs [13 & 40].
Discussion
The main purpose of stress assessment is to prevent people about health problems
and possible accidents in work environment and a large list of scenarios.
Referring to the non-invasive methodologies collected in this report, SC, EEG, and
HRV are the most suitable techniques to detect stress and lack of alertness have been
deeply developed and studied. Other techniques as eye and mouth tracking, blood
pressure, skin temperature, etc. have been considered but they were less attractive for
our goal. It does not mean that a good combination of these different methods will not
provide satisfactory results.
We have been focused in non-invasive single measurement data acquisition
motivated by a future possible implementation of the sensor, despite that multiple
parameters sensing makes easier the data interpretation, they are more powerful and
provide trusty results.
One point that must be considered is that if we are trying to measure the stress of
the subject, it is important that the person under test does not perceive the sensor/s to
avoid acting unwittingly over the sympathetic system and therefore increasing its stress
level, just because of the thought of being constantly monitored and consequently
registering non reliable results. We think that probably the best of the three selected
candidates is the HRV through the ECG measurements with the novelty of smart
textiles for integrate the system in clothing and with possibility of wireless data
transmission for total motion independency.
Conclusion
Several studies have been trying to link stress, lack of alertness and emotional
states to physiological signals. As seen in the available literature EEG, HRV and SC are
the most used methods up to know. These methods are non-invasive which makes them
perfect for implement real-time stress detection systems.
SC detects the sympathetic activation of the body, directly related with the stress of
a subject. Due to its limitations it has been used normally with other physiological
signals in a multiple measurement system. By contrast both EEG and HRV are
physiological signals that can be used alone in order to detect or assess in stress and
alertness issues as literature shows.
Many studies use EEG as the main signal to detect stress, EEG is also known for
its relation with sleep phases, which is interesting in applications related with alertness
and drowsiness. In any case we consider HRV as a valuable method in order to make
54
real-time stress detection and assessment of alertness not only based on the results given
on the available literature, but on the ease and comfort that a mobile device such as a
textile ECG can bring.
Nevertheless, the trend in stress detection is using multiple measurements to
conform a system that can achieve lower error rates. Multiple measurements are against
the ease and comfort in mobile devices but are by far the best solution because most of
the signals cannot disassociate sympathetic and parasympathetic activation if collected
alone.
Finally it is important to remark that although these techniques had been used
during last 40 years, is in the last decade when wireless applications and small devices
can handle a huge amount of data where real-time systems has sense. Therefore it is
expected to notice a high increase in real-time applications or devices related to stress
detection as well as new studies in the field.
Annex References
[1] Setz, C.; Arnrich, B.; Schumm, J.; La Marca, R.; Troster, G.; Ehlert, U.; ,
"Discriminating Stress From Cognitive Load Using a Wearable EDA Device,"
Information Technology in Biomedicine, IEEE Transactions, vol.14, no.2, pp.410-
417, March 2010
[2] de Santos Sierra, A.; vila, C.S.; Guerra Casanova, J.; Bailador del Pozo, G.; Jara
Vera, V.; , "Two Stress Detection Schemes Based on Physiological Signals for Real-
Time Applications," Intelligent Information Hiding and Multimedia Signal
Processing (IIH-MSP), 2010 Sixth International Conference, pp.364-367, Oct. 2010
[3] de Santos Sierra, A.; vila, C.S.; Guerra Casanova, J.; Bailador del Pozo, G.; ,
“Real-Time Stress Detection by Means of Physiological Signals,” Recent Application
in Biometrics, Jucheng Yang and Norman Poh (Ed.), 2011
[4] Zhai, J., Barreto, A.; , “Stress Recognition Using Non-invasive Technology,” FLAIRS
Conference 2006, pp.395-401, 2006
[5] Zhai, J.; Barreto, A.; , "Stress Detection in Computer Users Based on Digital Signal
Processing of Noninvasive Physiological Variables," Engineering in Medicine and
Biology Society, 2006. EMBS '06. 28th Annual International Conference of the IEEE
, pp.1355-1358, Sept. 2006
[6] Zhai, J.; Barreto, A.; Chin, C; Chao L.; , "Realization of stress detection using
psychophysiological signals for improvement of human-computer interactions,"
SoutheastCon, 2005. Proceedings. IEEE , pp. 415- 420, April 2005
[7] Kulic, D.; Croft, E.; , "Anxiety detection during human-robot interaction," Intelligent
Robots and Systems, 2005. 2005 IEEE/RSJ International Conference, pp. 616- 621,
Aug. 2005
[8] Healey, J.A.; Picard, R.; , "Detecting stress during real-world driving tasks using
physiological sensors," Intelligent Transportation Systems, IEEE Transactions, vol.6,
no.2, pp. 156- 166, June 2005

55
[9] Bundele, M.M.; Banerjee, R.; , "ROC analysis of a fatigue classifier for vehicular
drivers," Intelligent Systems (IS), 2010 5th IEEE International Conference, pp.296-
301, July 2010
[10] Saidatul, A.; Paulraj, M.P.; Yaacob, S.; Mohamad Nasir, N.F.; , "Automated system
for stress evaluation based on EEG signal: A prospective review," Signal Processing
and its Applications (CSPA), 2011 IEEE 7th International Colloquium on , pp.167-
171, March 2011
[11] Ling, C.; Goins, H.; Ntuen, A.; Li, R.; , "EEG signal analysis for human workload
classification," SoutheastCon 2001. Proceedings. IEEE , pp.123-130, 2001
[12] Kar, S.; Bhagat, M.; Routray, A.; , “EEG signal analysis for the assessment and
quantification of driver’s fatigue,” Transportation Research Part F: Traffic
Psychology and Behaviour, vol. 13, no.5, pp.297-306, Sept. 2010
[13] Oron-Gilad, T.; Ronen, A.; Shinar, D.; , “Alertness maintaining tasks (AMTs) while
driving,” Accident Analysis and Prevention, vol.40, no.3, pp. 851-860, May 2008
[14] Sing, H.; Kautz, M.; , Thorne, D.; Hall, S.; Redmond, D.; Johnson, D.; Warren, K.;
Bailey, J.; Russo, M. “High-frequency EEG as measure of cognitive function
capacity: a preliminary report,” Aviation, space, and environmental medicine, 2005
[15] Bi, L.; Zhang, R.; Chen, Z.; , "Study on Real-time Detection of Alertness Based on
EEG," Complex Medical Engineering, 2007. CME 2007. IEEE/ICME International
Conference, pp.1490-1493, May 2007
[16] Salahuddin, L.; Myeong, G.; Desok, K.; , "Ultra Short Term Analysis of Heart Rate
Variability using Normal Sinus Rhythm and Atrial Fibrillation ECG Data," e-Health
Networking, Application and Services, 2007 9th International Conference , pp.240-
243, June 2007
[17] Blitz, P. S.; Hoogstraten, J.; Mulder, G.; , ”Mental load, heart rate and heart rate
variability,” Psychological Research, Springer Berlin / Heidelberg, Vol.33, pp.277-
288, Dec. 1970
[18] Kalsbeek, J.; Sykes, R.; , ”Objective measurement of mental load,” Acta
Psychologica, Vol. 27, pp.253-261, 1967
[19] Hall, M.; Vasko, R.; Buysse, D.; Ombao, H.; Chen, O.; Cashmere, J.; Kupfer, D.;
Thayer, J.; , “Acute Stress Affects Heart Rate Variability During Sleep,”
Psychosomatic Medicine vol.66, no.1, pp.56-62, Jan. 2004
[20] Bernardi, L.; Wdowczyk-Szulc, J.; Valenti, C.; Castoldi, S.; Passino, C.; Spadacini,
G.; Sleight, P.; “Effects of controlled breathing, mental activity and mental stress
with or without verbalization on heart rate variability,” Journal of the American
College of Cardiology, Vol.35, pp.1462-1469, May. 2000
[21] Gorman JM.; Sloan RP.; , “Heart rate variability in depressive and anxiety
Disorders,” Am Heart J., pp.77-83, Oct. 2000

56
[22] Taelman, J. et al. 2009; , “Influence of Mental Stress on Heart Rate and Heart Rate
Variability,” Heart, pp.1366-1369, 2009
[23] Barreto, A.; Zhai, J.; Adjouadi, M.; , “Non-intrusive Physiological Monitoring for
Automated Stress Detection in Human-Computer Interaction,” Human–Computer
Interaction, Springer Berlin / Heidelberg, Vol.4796 pp.29-38, 2007
[24] Kim, D.; Seo, Y.; Kim, S.; Jung, S.; , "Short Term Analysis of Long Term Patterns of
Heart Rate Variability in Subjects under Mental Stress," bmei, International
Conference on BioMedical Engineering and Informatics, 2008, vol.2, pp.487-491,
2008
[25] Jovanov, E. et al. 2003; , “Stress monitoring using a distributed wireless intelligent
sensor system”, IEEE Engineering in Medicine and Biology Magazine, 22(3), p.49-
55, 2003
[26] Jovanov, E.; Raskovic, D.; Lords, A.O.; Cox, P.; Adhami, R.; Andrasik, F.; ,
"Synchronized physiological monitoring using a distributed wireless intelligent
sensor system," Engineering in Medicine and Biology Society, 2003. Proceedings of
the 25th Annual International Conference of the IEEE, vol.2, pp.1368- 1371, 17-21
Sept. 2003
[27] Seong, H.M.; Lee, J.S.; Shin, T.M.; Kim,W.S.; Yoon,Y.R.; , “The Analysis of Mental
Stress using Time-Frequency Distribution of Heart Rate Variability Signal,”
Engineering in Medicine and Biology Society, 2004, IEMBS '04,26th Annual
International Conference of the IEEE´, Oct. 2004
[28] McCraty, R.; Atkinson, M.; Tiller, W.; Rein, G.; Watkins, A.; , “The effects of
emotions on short-term power spectrum analysis of heart rate variability,” The
American Journal of Cardiology, Vol.76, Issue 14, pp.1089-1093, Nov. 1995
[29] Petrowski, K.; “The Effects of Psychosocial Stress on Heart Rate Variability in Panic
Disorder,” German J Psychiatry 2010; 13(2): 66-7, 2010
[30] Salahuddin, L.; Cho, J.; Gi Jeong, M.; Kim, D.; , "Ultra Short Term Analysis of
Heart Rate Variability for Monitoring Mental Stress in Mobile Settings," Engineering
in Medicine and Biology Society, 2007, EMBS 2007,29th Annual International
Conference of the IEEE, vol., pp. 4656-4659, 22-26 Aug. 2007
[31] Berntson, G. and Cacioppo, J.T.; ,”Heart Rate Variability: Stress and Psychiatric
Conditions, in Dynamic Electrocardiography,” Blackwell Publishing, Oxford, UK,
2007
[32] Kuriyagawa, Y.; Kageyama, I.; , "A modeling of heart rate variability to estimate
mental work load ," Systems, Man, and Cybernetics, 1999. IEEE SMC '99 Conference
Proceedings. 1999 IEEE International Conference, vol.2, pp.294-299, 1999

57
[33] Hjortskov, N.; Rissén, D.; Blangsted, A.; Fallentin, N.; Lundberg, U.; Søgaard, K.; ,
“The effect of mental stress on heart rate variability and blood pressure during
computer work,” European Journal of Applied Physiology on , vol.92, pp.84-89, Jun.
2004
[34] Parkka, J.; Ermes, M.; van Gils, M.; , "Automatic feature selection and classification
of physical and mental load using data from wearable sensors," Information
Technology and Applications in Biomedicine (ITAB), 2010 10th IEEE International
Conference on , pp.1-5, Nov. 2010
[35] Zhai, J.; Barreto, A.; , “Stress Recognition Using Non-invasive Technology, ”
Proceedings of the Nineteenth International Florida Artificial Intelligence Research
Society Conference 2006, Melbourne Beach, Florida, USA, pp. 395-401, May 2006
[36] Jinho K.; Chan-Hyun Y.; Desok K.; Jong-Min W.; Suntae J.; , "Cost-Minimized E-
Health Service for Identification of Mental Stress related Heart Rate Changes,"
Medical Devices and Biosensors, 2007. ISSS-MDBS 2007. 4th IEEE/EMBS
International Summer School and Symposium, pp.102-106, Aug. 2007
[37] Kawachi, I.; Sparrow, D.; Vokonas, P.; Weiss, S.; , “Decreased heart rate variability
in men with phobic anxiety,” The American Journal of Cardiology, vol.75, no.14, pp.
882-885, May 1995
[38] Desok, K.; Yunhwan S.; Salahuddin, L.; , "Decreased long term variations of heart
rate variability in subjects with higher self reporting stress scores," Pervasive
Computing Technologies for Healthcare, 2008. Pervasive Health 2008. Second
International Conference, pp.289-292, Feb. 2008
[39] Salahuddin, L.; Myeong Gi, J. Desok, K.; Seong-Kyeon, L.; Kim Won; Jong-Min, W.;
, "Dependence of Heart Rate Variability on Stress Factors of Stress Response
Inventory," e-Health Networking, Application and Services, 2007 9th International
Conference, pp.236-239, June 2007
[40] Michail, Emmanouil; Kokonozi, Athina; Chouvarda, Ioanna; Maglaveras, Nicos; ,
"EEG and HRV Markers of Sleepiness and Loss of Control During car Driving,"
Engineering in Medicine and Biology Society, 2008. EMBS 2008. 30th Annual
International Conference of the IEEE, vol., no., pp.2566-2569, 20-25 Aug. 2008