Embed Size (px)
Citation preview
RESEARCH ARTICLE Open Access
Echoic memory of a single pure tone indexed bychange-related brain activityKoji Inui1*, Tomokazu Urakawa1, Koya Yamashiro1, Naofumi Otsuru1, Yasuyuki Takeshima1, Makoto Nishihara1,2,Eishi Motomura1,3, Tetsuo Kida1, Ryusuke Kakigi1
Abstract
Background: The rapid detection of sensory change is important to survival. The process should relate closely tomemory since it requires that the brain separate a new stimulus from an ongoing background or past event. Giventhat sensory memory monitors current sensory status and works to pick-up changes in real-time, any changedetected by this system should evoke a change-related cortical response. To test this hypothesis, we examinedwhether the single presentation of a sound is enough to elicit a change-related cortical response, and therefore,shape a memory trace enough to separate a subsequent stimulus.
Results: Under a paradigm where two pure sounds 300 ms in duration and 800 or 840 Hz in frequency werepresented in a specific order at an even probability, cortical responses to each sound were measured withmagnetoencephalograms. Sounds were grouped to five events regardless of their frequency, 1D, 2D, and 3D (asound preceded by one, two, or three different sounds), and 1S and 2S (a sound preceded by one or two samesounds). Whereas activation in the planum temporale did not differ among events, activation in the superiortemporal gyrus (STG) was clearly greater for the different events (1D, 2D, 3D) than the same event (1S and 2S).
Conclusions: One presentation of a sound is enough to shape a memory trace for comparison with a subsequentphysically different sound and elicits change-related cortical responses in the STG. The STG works as a real-timesensory gate open to a new event.
BackgroundThe quick detection of a change in the sensory environ-ment is very important to survival. Studies using func-tional magnetic resonance imaging (fMRI) [1] andmagnetoencephalography (MEG) [2,3] have demon-strated change-specific cortical activation in the audi-tory, visual and somatosensory systems. Therefore, onecan assume the presence of a system that facilitatesdetection of a change, orientation to the new event anda subsequent behavioral response. Since the detection ofa sensory change is based on a comparison between thepast and present sensory status, the change-detectingsystem should relate closely to short-lasting sensorymemory. Sensory memory, and echoic memory for audi-tory sensory memory, in this paper means faculties of
the human brain that can hold sensory information in avery accessible state temporarily [4-7].In the auditory system, the mechanism of change-
detection or its relation to echoic memory has been stu-died using mismatch negativity (MMN) [6-11] orChange-N1, a subcomponent of N1 [12-16]. Usually,MMN is investigated by comparing event-related poten-tials (ERPs) to a frequently presented standard stimulusand a rare deviant stimulus under an oddball paradigm,and is taken to reflect a preattentive memory-basedcomparison process [6]. Change-N1, which is elicited bya sudden change in a continuous tone and peaksapproximately 100 ms after the onset of the change, hasbeen also used to investigate higher auditory processes[12-16]. Although Change-N1 differs from MMN in thatMMN does not contain the N1 component, Change-N1is also considered to relate to auditory store [12-17].Provided that sensory memory works to pick up sensorychanges by updating the current sensory status in real-time, activation of the change-detecting system by any
* Correspondence: [email protected] of Integrative Physiology, National Institute for PhysiologicalSciences, Okazaki 444-8585, JapanFull list of author information is available at the end of the article
Inui et al. BMC Neuroscience 2010, 11:135http://www.biomedcentral.com/1471-2202/11/135
© 2010 Inui et al; licensee BioMed Central Ltd. This is an Open Access article distributed under the terms of the Creative CommonsAttribution License (http://creativecommons.org/licenses/by/2.0), which permits unrestricted use, distribution, and reproduction inany medium, provided the original work is properly cited.
sensory change would be reflected in MMN or Change-N1. Indeed, the magnitude of change-related corticalactivation reflects the strength of echoic memory of thepast event to be compared [17]. However, according tothe prevailing view, several presentations of a standardstimulus are needed to elicit MMN (for review, see[18]). To understand mechanisms of the change-detect-ing system, that is, to know how the brain recognizes asensory change, this matter seems very important. It isalso important to know whether change-related brainresponses can be an objective index of sensory memory.We hypothesized that sensory memory works in real
time and therefore, the single presentation of a sound isenough to develop it. In the present study, we investi-gated whether the brief presentation of a sound formssensory memory (echoic memory) that can be indexedby a change-related cortical response. The change-related cortical response in the auditory system 1) is eli-cited by any kind of auditory change including the onsetand offset of a sound [19,20], 2) reflects the magnitudeof the physical difference between present and pastsounds, and 3) reflects the strength of echoic memoryestablished for the previous sound [17]. In addition, thechange-related response is little affected by the subject’sattention, and is stably elicited during a long timecourse. Therefore, it seems useful to investigate echoicmemory. To investigate whether a deviant sound follow-ing a single standard sound elicits a change-relatedresponse, we used a stimulation paradigm with two puretones at an even probability. If echoic memory works inreal time, a sound followed by a different sound wouldevoke a change-related cortical response. Althoughrecently a multi-feature paradigm without a simple repe-titive standard sound or even without a standard soundhas been used to shorten the recording time for MMN[21-23], the present paradigm is different in that theprobability of two sounds physically differing in a stimu-lus feature is even.The present results clearly showed the real-time nat-
ure of echoic memory and the change-related corticalresponses based on it. A model to explain the relation-ship between echoic memory and change-related corticalactivation is discussed.
ResultsEvoked waveformsTwo pure tones 300 ms in duration and 800 Hz or 840Hz in frequency were presented in a specific order withan even probability. Under this paradigm, trials weregrouped into two categories according to whether asound was different from the previous sound, that is,same (SAME) and different (DIFF) trials. In the SAMEtrials, a sound was preceded by one (1S) or two (2S)sounds of the same frequency. In the DIFF trials, a
sound was preceded by either of one (1D), two (2D), orthree (3D) sounds of a different frequency (3D). There-fore, there were five events. The probability of theoccurrence of the five events, 1D, 2D, 3D, 1S and 2S,was 1:1:1:2:1. In the present study, a comparison wasmade among the four equiprobable events.Figure 1A ~ C shows magnetic responses to the five
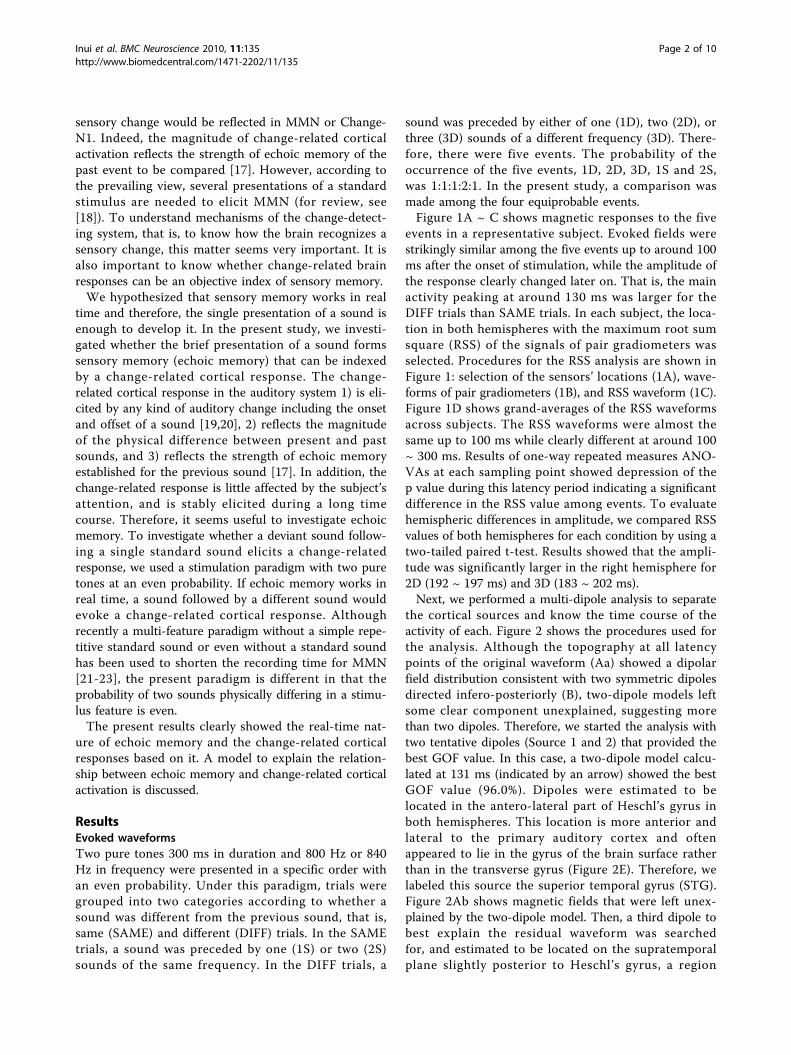
events in a representative subject. Evoked fields werestrikingly similar among the five events up to around 100ms after the onset of stimulation, while the amplitude ofthe response clearly changed later on. That is, the mainactivity peaking at around 130 ms was larger for theDIFF trials than SAME trials. In each subject, the loca-tion in both hemispheres with the maximum root sumsquare (RSS) of the signals of pair gradiometers wasselected. Procedures for the RSS analysis are shown inFigure 1: selection of the sensors’ locations (1A), wave-forms of pair gradiometers (1B), and RSS waveform (1C).Figure 1D shows grand-averages of the RSS waveformsacross subjects. The RSS waveforms were almost thesame up to 100 ms while clearly different at around 100~ 300 ms. Results of one-way repeated measures ANO-VAs at each sampling point showed depression of thep value during this latency period indicating a significantdifference in the RSS value among events. To evaluatehemispheric differences in amplitude, we compared RSSvalues of both hemispheres for each condition by using atwo-tailed paired t-test. Results showed that the ampli-tude was significantly larger in the right hemisphere for2D (192 ~ 197 ms) and 3D (183 ~ 202 ms).Next, we performed a multi-dipole analysis to separate
the cortical sources and know the time course of theactivity of each. Figure 2 shows the procedures used forthe analysis. Although the topography at all latencypoints of the original waveform (Aa) showed a dipolarfield distribution consistent with two symmetric dipolesdirected infero-posteriorly (B), two-dipole models leftsome clear component unexplained, suggesting morethan two dipoles. Therefore, we started the analysis withtwo tentative dipoles (Source 1 and 2) that provided thebest GOF value. In this case, a two-dipole model calcu-lated at 131 ms (indicated by an arrow) showed the bestGOF value (96.0%). Dipoles were estimated to belocated in the antero-lateral part of Heschl’s gyrus inboth hemispheres. This location is more anterior andlateral to the primary auditory cortex and oftenappeared to lie in the gyrus of the brain surface ratherthan in the transverse gyrus (Figure 2E). Therefore, welabeled this source the superior temporal gyrus (STG).Figure 2Ab shows magnetic fields that were left unex-plained by the two-dipole model. Then, a third dipole tobest explain the residual waveform was searchedfor, and estimated to be located on the supratemporalplane slightly posterior to Heschl’s gyrus, a region
Inui et al. BMC Neuroscience 2010, 11:135http://www.biomedcentral.com/1471-2202/11/135
Page 2 of 10
corresponding to the planum temporale [24]. Thissource was labeled PT. On addition of the third source(Source 3), the residual magnetic components at around120 ms and 170 ms disappeared (Ac). This source sig-nificantly improved the fit, for example, increasing theGOF value from 85 to 93% (F = 2.1, p = 2.3 × 10⁻⁶) at115 ms. Figure Ac shows residual waveforms that wereleft unexplained by the three-dipole model. After thelocation and orientation of Source 2 were slightlyadjusted to provide the best GOF value with the exis-tence of Source 3, the best fourth dipole to explain theresidual waveform was searched for, and estimated to belocated in an area slightly posterior to Source 1.Although the activity of this dipole was weak, the
improvement in fit was significant (F = 1.7, p = 2 ×10⁻⁴). After fitting four dipoles, no clear residual compo-nent was seen in the residual waveform (Ad). Althoughsome other sources were estimated according to our cri-teria in a few subjects, such as the anterior cingulatecortex and inferior frontal gyrus, the following analyseswere performed on these four sources that were presentin all the subjects.After the four cortical sources were obtained by the
multi-dipole analyses for each subject, the peak latencyand amplitude of each activity were compared amongthe four equiprobable events using ANOVAs. Thegrand-averages of a source’s strength as a function oftime are shown in Figure 3. As shown in Figure 3, both
Figure 1 Magnetic responses to the five events. A ~ C, data from a representative subject. A), top view traces of all the sensors. B), enlargedwaveforms of selected sensors indicated by circles in A, C), root sum square (RSS) waveforms obtained from selected pair gradiometers. D,grand-averaged RSS waveforms of the five events. The lower trace indicates the results (p value) of the one-way repeated measures ANOVA atall sampling points, which evaluates whether the RSS value differs significantly among events.
Inui et al. BMC Neuroscience 2010, 11:135http://www.biomedcentral.com/1471-2202/11/135
Page 3 of 10
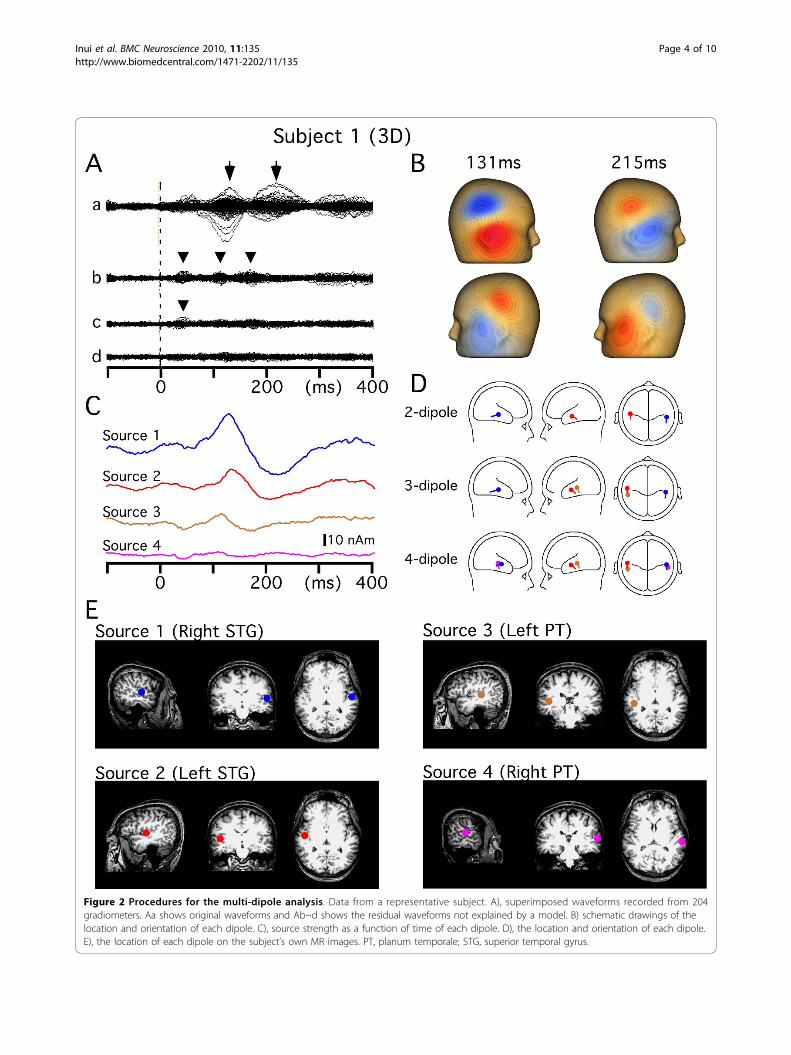
Figure 2 Procedures for the multi-dipole analysis. Data from a representative subject. A), superimposed waveforms recorded from 204gradiometers. Aa shows original waveforms and Ab~d shows the residual waveforms not explained by a model. B) schematic drawings of thelocation and orientation of each dipole. C), source strength as a function of time of each dipole. D), the location and orientation of each dipole.E), the location of each dipole on the subject’s own MR images. PT, planum temporale; STG, superior temporal gyrus.
Inui et al. BMC Neuroscience 2010, 11:135http://www.biomedcentral.com/1471-2202/11/135
Page 4 of 10
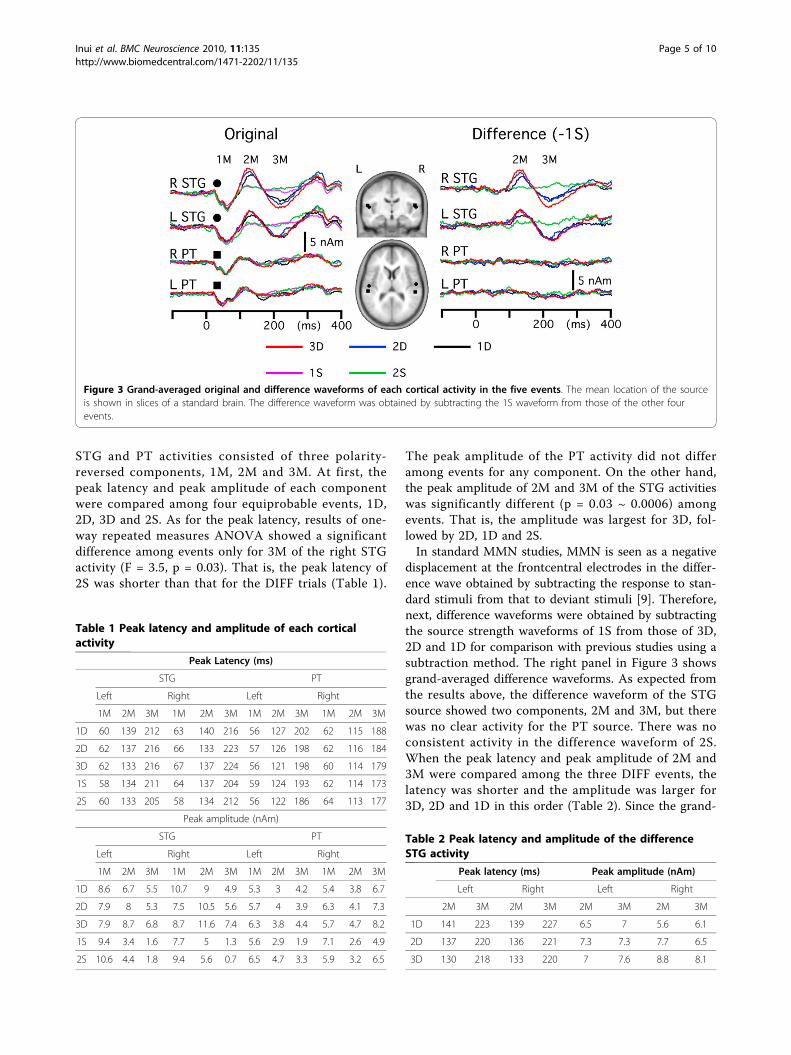
STG and PT activities consisted of three polarity-reversed components, 1M, 2M and 3M. At first, thepeak latency and peak amplitude of each componentwere compared among four equiprobable events, 1D,2D, 3D and 2S. As for the peak latency, results of one-way repeated measures ANOVA showed a significantdifference among events only for 3M of the right STGactivity (F = 3.5, p = 0.03). That is, the peak latency of2S was shorter than that for the DIFF trials (Table 1).
The peak amplitude of the PT activity did not differamong events for any component. On the other hand,the peak amplitude of 2M and 3M of the STG activitieswas significantly different (p = 0.03 ~ 0.0006) amongevents. That is, the amplitude was largest for 3D, fol-lowed by 2D, 1D and 2S.In standard MMN studies, MMN is seen as a negative
displacement at the frontcentral electrodes in the differ-ence wave obtained by subtracting the response to stan-dard stimuli from that to deviant stimuli [9]. Therefore,next, difference waveforms were obtained by subtractingthe source strength waveforms of 1S from those of 3D,2D and 1D for comparison with previous studies using asubtraction method. The right panel in Figure 3 showsgrand-averaged difference waveforms. As expected fromthe results above, the difference waveform of the STGsource showed two components, 2M and 3M, but therewas no clear activity for the PT source. There was noconsistent activity in the difference waveform of 2S.When the peak latency and peak amplitude of 2M and3M were compared among the three DIFF events, thelatency was shorter and the amplitude was larger for3D, 2D and 1D in this order (Table 2). Since the grand-
Figure 3 Grand-averaged original and difference waveforms of each cortical activity in the five events. The mean location of the sourceis shown in slices of a standard brain. The difference waveform was obtained by subtracting the 1S waveform from those of the other fourevents.
Table 1 Peak latency and amplitude of each corticalactivity
Peak Latency (ms)
STG PT
Left Right Left Right
1M 2M 3M 1M 2M 3M 1M 2M 3M 1M 2M 3M
1D 60 139 212 63 140 216 56 127 202 62 115 188
2D 62 137 216 66 133 223 57 126 198 62 116 184
3D 62 133 216 67 137 224 56 121 198 60 114 179
1S 58 134 211 64 137 204 59 124 193 62 114 173
2S 60 133 205 58 134 212 56 122 186 64 113 177
Peak amplitude (nAm)
STG PT
Left Right Left Right
1M 2M 3M 1M 2M 3M 1M 2M 3M 1M 2M 3M
1D 8.6 6.7 5.5 10.7 9 4.9 5.3 3 4.2 5.4 3.8 6.7
2D 7.9 8 5.3 7.5 10.5 5.6 5.7 4 3.9 6.3 4.1 7.3
3D 7.9 8.7 6.8 8.7 11.6 7.4 6.3 3.8 4.4 5.7 4.7 8.2
1S 9.4 3.4 1.6 7.7 5 1.3 5.6 2.9 1.9 7.1 2.6 4.9
2S 10.6 4.4 1.8 9.4 5.6 0.7 6.5 4.7 3.3 5.9 3.2 6.5
Table 2 Peak latency and amplitude of the differenceSTG activity
Peak latency (ms) Peak amplitude (nAm)
Left Right Left Right
2M 3M 2M 3M 2M 3M 2M 3M
1D 141 223 139 227 6.5 7 5.6 6.1
2D 137 220 136 221 7.3 7.3 7.7 6.5
3D 130 218 133 220 7 7.6 8.8 8.1
Inui et al. BMC Neuroscience 2010, 11:135http://www.biomedcentral.com/1471-2202/11/135
Page 5 of 10
averaged RSS waveform in Figure 1 and source strengthwaveform in Figure 3 showed an amplitude differencebetween hemispheres, we evaluated the difference usinga paired t-test for each component (1M, 2M and 3M)for each cortical source (STG and PT). However, wecould not find a significant difference for any case prob-ably because of a large inter-individual difference.Results of discriminant analyses showed no significant
differences in the source’s location between any pair ofevents for any cortical source (p > 0.64). The meancoordinates of the source (average of all events) acrosssubjects were as follows: Right -STG (52.7, -12.9, 10.5),Left-STG (-49.8, -16.8, 9.8), Right-PT (51.0, -30.0, 13.0),Left-PT (-52.7, -28.0, 12.7). The mean location of eachsource is shown on MR slices of a standard brain inFigure 3.
DiscussionMemory trace strength determines the amplitude ofchange-related responsesThe present results clearly showed that the single pre-sentation of a sound shaped a memory trace that couldbe used for comparison with a subsequent differentsound as has already been proposed [25]. Under an odd-ball paradigm, so-called fresh-afferent neuronal activitymight help to shape MMN [18]. That is, the repetitionof a standard stimulus leads to adaptation of the cellscontributing to the standard-elicited N1 (attenuated N1)but leaves the deviant-selective cells unadapted(enhanced N1). In the present study, this seems unlikelybecause two pure tones were presented at an even prob-ability. The fact that the PT activity and early part ofthe STG activity did not differ in amplitude amongevents is also consistent with the idea that enhancedactivation in the STG is not due to a different degree ofadaptation of frequency-specific afferents. In an MEGstudy, Maess et al. [26] demonstrated that the late partof the change-related response evoked by a frequencydeviance is based on a cognitive, comparator mechan-ism, which seems to correspond to the enhanced STGactivity in the present study.Our recent study suggested that the temporal repre-
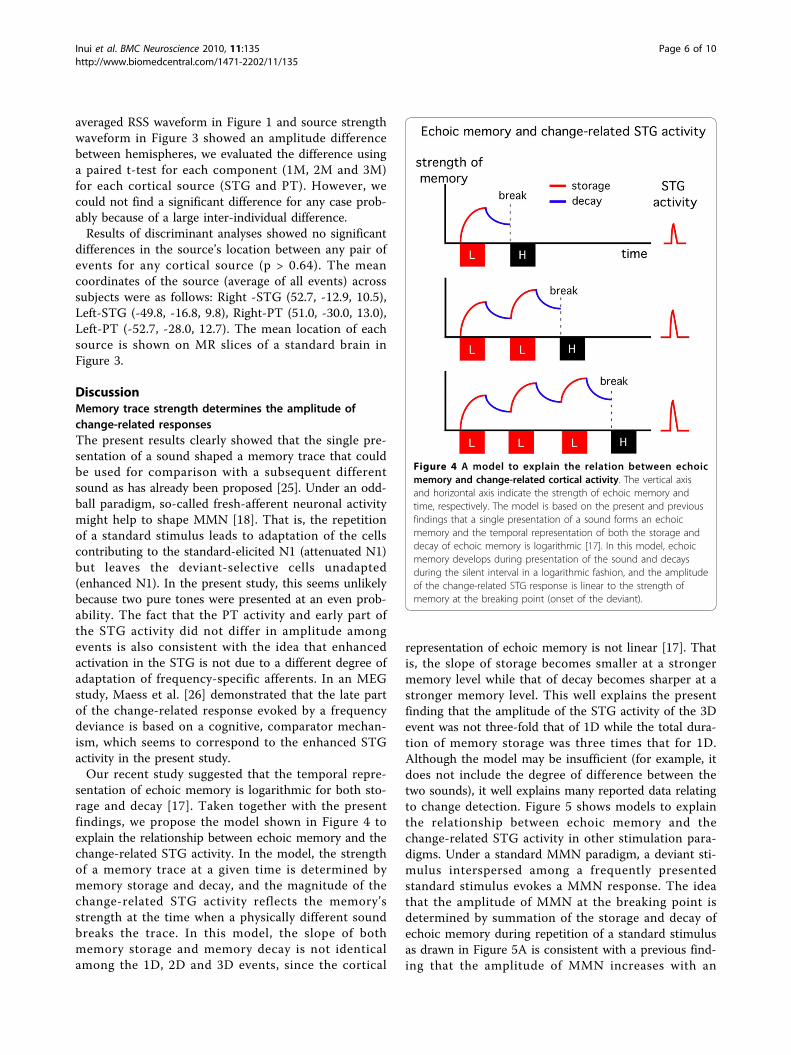
sentation of echoic memory is logarithmic for both sto-rage and decay [17]. Taken together with the presentfindings, we propose the model shown in Figure 4 toexplain the relationship between echoic memory and thechange-related STG activity. In the model, the strengthof a memory trace at a given time is determined bymemory storage and decay, and the magnitude of thechange-related STG activity reflects the memory’sstrength at the time when a physically different soundbreaks the trace. In this model, the slope of bothmemory storage and memory decay is not identicalamong the 1D, 2D and 3D events, since the cortical
representation of echoic memory is not linear [17]. Thatis, the slope of storage becomes smaller at a strongermemory level while that of decay becomes sharper at astronger memory level. This well explains the presentfinding that the amplitude of the STG activity of the 3Devent was not three-fold that of 1D while the total dura-tion of memory storage was three times that for 1D.Although the model may be insufficient (for example, itdoes not include the degree of difference between thetwo sounds), it well explains many reported data relatingto change detection. Figure 5 shows models to explainthe relationship between echoic memory and thechange-related STG activity in other stimulation para-digms. Under a standard MMN paradigm, a deviant sti-mulus interspersed among a frequently presentedstandard stimulus evokes a MMN response. The ideathat the amplitude of MMN at the breaking point isdetermined by summation of the storage and decay ofechoic memory during repetition of a standard stimulusas drawn in Figure 5A is consistent with a previous find-ing that the amplitude of MMN increases with an
Figure 4 A model to explain the relation between echoicmemory and change-related cortical activity. The vertical axisand horizontal axis indicate the strength of echoic memory andtime, respectively. The model is based on the present and previousfindings that a single presentation of a sound forms an echoicmemory and the temporal representation of both the storage anddecay of echoic memory is logarithmic [17]. In this model, echoicmemory develops during presentation of the sound and decaysduring the silent interval in a logarithmic fashion, and the amplitudeof the change-related STG response is linear to the strength ofmemory at the breaking point (onset of the deviant).
Inui et al. BMC Neuroscience 2010, 11:135http://www.biomedcentral.com/1471-2202/11/135
Page 6 of 10
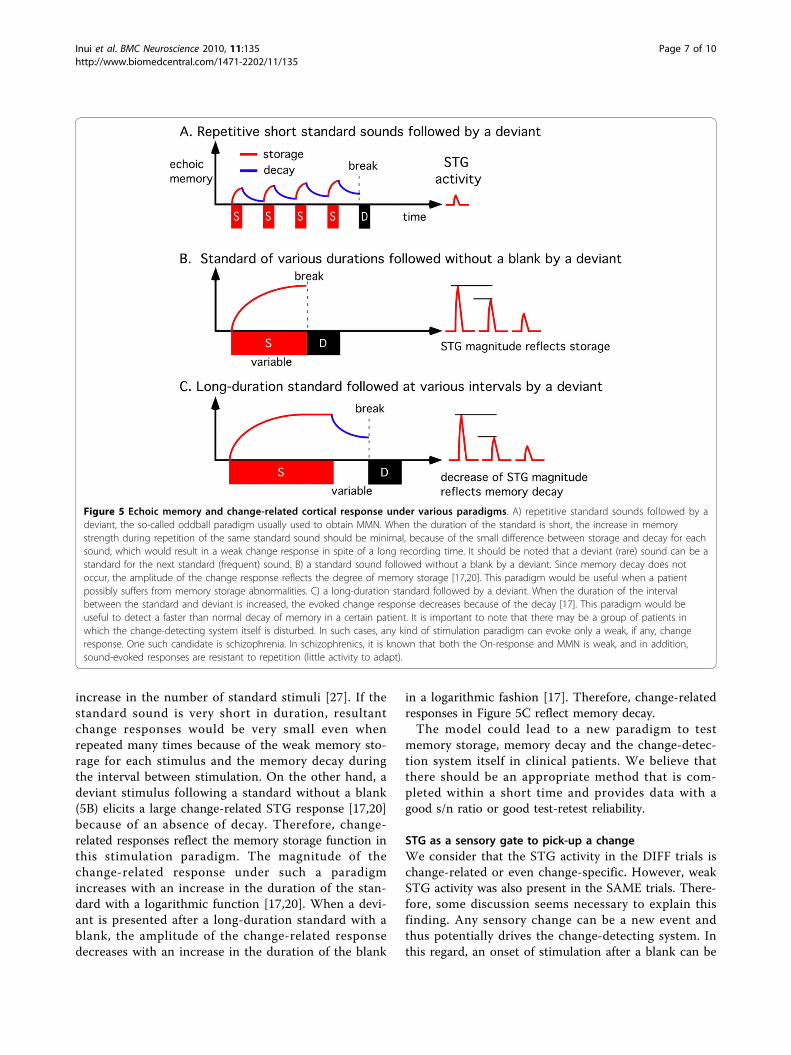
increase in the number of standard stimuli [27]. If thestandard sound is very short in duration, resultantchange responses would be very small even whenrepeated many times because of the weak memory sto-rage for each stimulus and the memory decay duringthe interval between stimulation. On the other hand, adeviant stimulus following a standard without a blank(5B) elicits a large change-related STG response [17,20]because of an absence of decay. Therefore, change-related responses reflect the memory storage function inthis stimulation paradigm. The magnitude of thechange-related response under such a paradigmincreases with an increase in the duration of the stan-dard with a logarithmic function [17,20]. When a devi-ant is presented after a long-duration standard with ablank, the amplitude of the change-related responsedecreases with an increase in the duration of the blank
in a logarithmic fashion [17]. Therefore, change-relatedresponses in Figure 5C reflect memory decay.The model could lead to a new paradigm to test
memory storage, memory decay and the change-detec-tion system itself in clinical patients. We believe thatthere should be an appropriate method that is com-pleted within a short time and provides data with agood s/n ratio or good test-retest reliability.
STG as a sensory gate to pick-up a changeWe consider that the STG activity in the DIFF trials ischange-related or even change-specific. However, weakSTG activity was also present in the SAME trials. There-fore, some discussion seems necessary to explain thisfinding. Any sensory change can be a new event andthus potentially drives the change-detecting system. Inthis regard, an onset of stimulation after a blank can be
Figure 5 Echoic memory and change-related cortical response under various paradigms. A) repetitive standard sounds followed by adeviant, the so-called oddball paradigm usually used to obtain MMN. When the duration of the standard is short, the increase in memorystrength during repetition of the same standard sound should be minimal, because of the small difference between storage and decay for eachsound, which would result in a weak change response in spite of a long recording time. It should be noted that a deviant (rare) sound can be astandard for the next standard (frequent) sound. B) a standard sound followed without a blank by a deviant. Since memory decay does notoccur, the amplitude of the change response reflects the degree of memory storage [17,20]. This paradigm would be useful when a patientpossibly suffers from memory storage abnormalities. C) a long-duration standard followed by a deviant. When the duration of the intervalbetween the standard and deviant is increased, the evoked change response decreases because of the decay [17]. This paradigm would beuseful to detect a faster than normal decay of memory in a certain patient. It is important to note that there may be a group of patients inwhich the change-detecting system itself is disturbed. In such cases, any kind of stimulation paradigm can evoke only a weak, if any, changeresponse. One such candidate is schizophrenia. In schizophrenics, it is known that both the On-response and MMN is weak, and in addition,sound-evoked responses are resistant to repetition (little activity to adapt).
Inui et al. BMC Neuroscience 2010, 11:135http://www.biomedcentral.com/1471-2202/11/135
Page 7 of 10
a new event against the silent background. If this STGactivity (On-STG) depends on the memory trace of thepresence of a previous sound, the On-STG activity inthis study would be very weak because of the very shortinter-trial interval (300 ms), but should be present.Recently, we demonstrated that the onset, offset andchange in frequency of a sound all activate the STG andthe amplitude of activity depends on the duration of thepreceding condition with a logarithmic function [20],suggesting that any auditory change activates the STGthrough a memory-based comparison process. Both theonset and offset of a sound can be regarded as a largedeviation of sound pressure from the preceding baseline.The view that the On-STG activity is a change-relatedresponse is well consistent with the stimulation rate-sensitive nature of the STG activity [28]. Although onemay attribute the decrement of the On-response withstimulus repetition to habituation or adaptation insteadof memory, using these terms to explain the phenom-enon is meaningless if the definition of these terms isthe response decrement itself. Habituation is one of thesimplest forms of memory or learning (for review, see[29,30]). The decrease in On-STG activity with stimulusrepetition, thus echoic memory, probably corresponds toshort-term habituation that has been attributed to pre-synaptic inhibition in studies using Aplysia [30]. Inmammals, there are also studies investigating the phy-siological significance of habituation. For example in therat olfactory system, Kadohisa and Wilson [31] demon-strated that olfactory bulb cells continue to respond to abackground odorant while anterior piriform cortex neu-rons rapidly and almost completely adapt to the back-ground odorant but keep responding to a new odorantpresented in addition to the background odorant. Thesefindings indicate that the anterior piriform cortex actsas a filter driven by changing stimuli. Therefore, habi-tuation allows neurons in the piriform cortex to respondselectively to a change in stimulus, contributing toseparation of the target odorant from the background.Applying these findings in rats to the present study,STG neurons respond to each sound stimulus and‘adapt’ rapidly (weak On-response), responding fully to anew sound (Change-response), therefore the STG worksas a sensory gate to pick-up a change in sound amongstable inputs from lower cortical areas. If adaptationmeans that the cortex stores past sensory information,adaptation can be regarded as one form of memory.
Change-related responses in other sensory modalitiesIn a previous study using electroencephalograms [28],we showed that the main cortical areas sensitive to theinterstimulus interval, that is, which easily adapt, are theSTG for the auditory system, the opercular region forthe tactile and pain systems, and the middle occipital
gyrus (MOG) for the visual system. Given that a corticalarea that adapts to stimulus repetition acts as a sensorygate open to a new event, one can expect these corticalareas to be responsible for the detection of change ineach sensory modality. In fact, recent work from our labdemonstrated that the opercular region [32], MOG[3,33] and STG [19,20] are involved in change detectionfor the respective sensory modality. Activation in areasof the sensory cortex in response to a changing stimulusis consistent with the fact that in general, the sensorycortex is involved in the short-term storage of informa-tion [34]. We believe that future studies in animals willfind neurons in corresponding areas that behave as achange detector like piriform cortex neurons in thepaper by Kadohisa and Wilson [31].
Hemisphere differenceAlthough grand-averaged waveforms showed that righthemisphere responses were larger in amplitude for boththe RSS and source strength waveforms, results of statis-tical analyses showed no significant difference. Oneexplanation might be the large inter-individual differ-ence and small number of subjects in the present study.In a previous study on the mismatch response, righthemisphere dominance was demonstrated [35]. Sincethe present study used a fixed sound pressure level (70dB SPL) for both ears of all the subjects, a subtle differ-ence in the hearing threshold between ears might leadto differences in the right and left hemispheres. To eval-uate the hemispheric difference precisely, careful adjust-ment of the sound pressure level for each ear of eachsubject appears necessary.
ConclusionsOne presentation of a sound is enough to shape a mem-ory trace for comparison with a subsequent physicallydifferent sound and elicits change-related corticalresponses in the STG. The STG works as a real-timesensory gate open to a new event.
MethodsThe experiment was performed on nine (one female andeight males) healthy right-handed volunteers, aged 27-46 years (33 ± 7). The study was approved in advanceby the Ethics Committee of the National Institute forPhysiological Sciences, Okazaki, Japan, and written con-sent was obtained from all the subjects.
Stimulus and recordingsTwo pure tones 300 ms in duration (rise/fall, 5 ms) and800 or 840 Hz in sound frequency were used. We madetwo sound sequences composed of three tones; 840 - 800 -800 Hz (HLL) and 800 - 840 - 840 Hz (LHH) (Figure 6A).The interstimulus interval (ISI) between the tones (from
Inui et al. BMC Neuroscience 2010, 11:135http://www.biomedcentral.com/1471-2202/11/135
Page 8 of 10
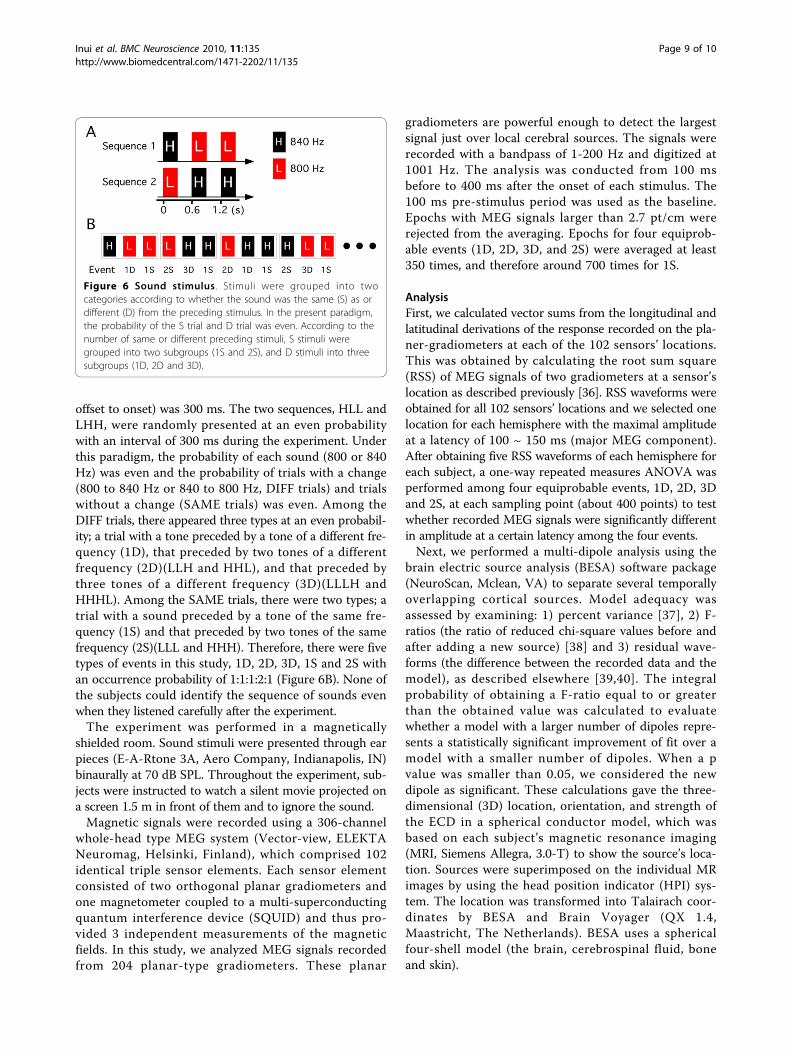
offset to onset) was 300 ms. The two sequences, HLL andLHH, were randomly presented at an even probabilitywith an interval of 300 ms during the experiment. Underthis paradigm, the probability of each sound (800 or 840Hz) was even and the probability of trials with a change(800 to 840 Hz or 840 to 800 Hz, DIFF trials) and trialswithout a change (SAME trials) was even. Among theDIFF trials, there appeared three types at an even probabil-ity; a trial with a tone preceded by a tone of a different fre-quency (1D), that preceded by two tones of a differentfrequency (2D)(LLH and HHL), and that preceded bythree tones of a different frequency (3D)(LLLH andHHHL). Among the SAME trials, there were two types; atrial with a sound preceded by a tone of the same fre-quency (1S) and that preceded by two tones of the samefrequency (2S)(LLL and HHH). Therefore, there were fivetypes of events in this study, 1D, 2D, 3D, 1S and 2S withan occurrence probability of 1:1:1:2:1 (Figure 6B). None ofthe subjects could identify the sequence of sounds evenwhen they listened carefully after the experiment.The experiment was performed in a magnetically
shielded room. Sound stimuli were presented through earpieces (E-A-Rtone 3A, Aero Company, Indianapolis, IN)binaurally at 70 dB SPL. Throughout the experiment, sub-jects were instructed to watch a silent movie projected ona screen 1.5 m in front of them and to ignore the sound.Magnetic signals were recorded using a 306-channel
whole-head type MEG system (Vector-view, ELEKTANeuromag, Helsinki, Finland), which comprised 102identical triple sensor elements. Each sensor elementconsisted of two orthogonal planar gradiometers andone magnetometer coupled to a multi-superconductingquantum interference device (SQUID) and thus pro-vided 3 independent measurements of the magneticfields. In this study, we analyzed MEG signals recordedfrom 204 planar-type gradiometers. These planar
gradiometers are powerful enough to detect the largestsignal just over local cerebral sources. The signals wererecorded with a bandpass of 1-200 Hz and digitized at1001 Hz. The analysis was conducted from 100 msbefore to 400 ms after the onset of each stimulus. The100 ms pre-stimulus period was used as the baseline.Epochs with MEG signals larger than 2.7 pt/cm wererejected from the averaging. Epochs for four equiprob-able events (1D, 2D, 3D, and 2S) were averaged at least350 times, and therefore around 700 times for 1S.
AnalysisFirst, we calculated vector sums from the longitudinal andlatitudinal derivations of the response recorded on the pla-ner-gradiometers at each of the 102 sensors’ locations.This was obtained by calculating the root sum square(RSS) of MEG signals of two gradiometers at a sensor’slocation as described previously [36]. RSS waveforms wereobtained for all 102 sensors’ locations and we selected onelocation for each hemisphere with the maximal amplitudeat a latency of 100 ~ 150 ms (major MEG component).After obtaining five RSS waveforms of each hemisphere foreach subject, a one-way repeated measures ANOVA wasperformed among four equiprobable events, 1D, 2D, 3Dand 2S, at each sampling point (about 400 points) to testwhether recorded MEG signals were significantly differentin amplitude at a certain latency among the four events.Next, we performed a multi-dipole analysis using the
brain electric source analysis (BESA) software package(NeuroScan, Mclean, VA) to separate several temporallyoverlapping cortical sources. Model adequacy wasassessed by examining: 1) percent variance [37], 2) F-ratios (the ratio of reduced chi-square values before andafter adding a new source) [38] and 3) residual wave-forms (the difference between the recorded data and themodel), as described elsewhere [39,40]. The integralprobability of obtaining a F-ratio equal to or greaterthan the obtained value was calculated to evaluatewhether a model with a larger number of dipoles repre-sents a statistically significant improvement of fit over amodel with a smaller number of dipoles. When a pvalue was smaller than 0.05, we considered the newdipole as significant. These calculations gave the three-dimensional (3D) location, orientation, and strength ofthe ECD in a spherical conductor model, which wasbased on each subject’s magnetic resonance imaging(MRI, Siemens Allegra, 3.0-T) to show the source’s loca-tion. Sources were superimposed on the individual MRimages by using the head position indicator (HPI) sys-tem. The location was transformed into Talairach coor-dinates by BESA and Brain Voyager (QX 1.4,Maastricht, The Netherlands). BESA uses a sphericalfour-shell model (the brain, cerebrospinal fluid, boneand skin).
Figure 6 Sound stimulus. Stimuli were grouped into twocategories according to whether the sound was the same (S) as ordifferent (D) from the preceding stimulus. In the present paradigm,the probability of the S trial and D trial was even. According to thenumber of same or different preceding stimuli, S stimuli weregrouped into two subgroups (1S and 2S), and D stimuli into threesubgroups (1D, 2D and 3D).
Inui et al. BMC Neuroscience 2010, 11:135http://www.biomedcentral.com/1471-2202/11/135
Page 9 of 10
A one-way analysis of variance (ANOVA) was used forstatistical comparisons of the latency and amplitude ofeach cortical activity among four equiprobable events,1D, 2D, 3D, and 2S. The statistical significance of thesource’s location among events was assessed by a discri-minant analysis using x, y, and z coordinates as variables.P values less than 0.05 were considered to be significant.
AbbreviationsMEG: magnetoencephalogram; MMN: mismatch negativity; MOG: middleoccipital gyrus; PT: planum temporale; RSS: root sum square; STG: superiortemporal gyrus.
Author details1Department of Integrative Physiology, National Institute for PhysiologicalSciences, Okazaki 444-8585, Japan. 2Multidisciplinary Pain Center, AichiMedical University, Aichi 480-1195, Japan. 3Department of Psychiatry, MieUniversity Graduate School of Medicine, Tsu Mie 514-8507, Japan.
Authors’ contributionsKI contributed to planning the study, data collection and analysis, anddrafting the paper. TU, KY, NO, MN and EM contributed to data collectionand analysis. YT contributed to constructing devices. TK and RK contributedto drafting the paper. All authors read and approved the final manuscript
Received: 28 February 2010 Accepted: 20 October 2010Published: 20 October 2010
References1. Downar J, Crawley AP, Mikulis DJ, Davis KD: A multimodal cortical network
for the detection of changes in the sensory environment. Nat Neurosci2000, 3:277-283.
2. Tanaka E, Kida T, Inui K, Kakigi R: Change-driven cortical activation inmultisensory environments: An MEG study. Neuroimage 2009, 24:464-474.
3. Tanaka E, Inui K, Kida T, Kakigi R: Common cortical responses evoked byappearance, disappearance and change of the human face. BMC Neurosci2009, 10:38.
4. Cowan N: On short and long auditory stores. Psychol Bull 1984,96:341-370.
5. Cowan N: What are the differences between long-term, short-term, andworking memory? Prog Brain Res 2008, 169:323-338.
6. Näätänen R, Winkler I: The concept of auditory stimulus representation incognitive neuroscience. Psychol Bull 1999, 125:826-859.
7. Schröger E: Mismatch negativity. J Psychophysiol 2007, 21:138-146.8. Näätänen R, Jacobsen T, Winkler I: Memory-based or afferent processes in
mismatch negativity (MMN): a review of the evidence. Psychophysiology2005, 42:25-32.
9. Näätänen R, Paavilainen P, Rinne T, Alho K: The mismatch negativity(MMN) in basic research of central auditory processing: a review. ClinNeurophysiol 2007, 118:2544-2590.
10. Picton TW, Alain C, Otten L, Ritter W, Achim A: Mismatch negativity:different water in the same river. Audiol Neurootol 2000, 5:111-139.
11. Kujala T, Tervaniemi M, Schröger E: The mismatch negativity in cognitiveand clinical neuroscience: theoretical and methodological consideration.Biol Psychol 2007, 74:1-19.
12. Jones SJ, Longe O, Vaz Pato M: Auditory evoked potentials to abruptpitch and timbre change of complex tones: electrophysiologicalevidence of ‘streaming’? Electroencephalogr Clin Neurophysiol 1998,108:131-142.
13. Vaz Pato M, Jones SJ: Cortical processing of complex tone stimuli:mismatch negativity at the end of a period of rapid pitch modulation.Brain Res Cogn Brain Res 1999, 7:295-306.
14. Jones SJ, Vaz Pato M, Sprague L: Spectro-temporal analysis of complextones: two cortical processes dependent on retention of sounds in thelong auditory store. Clin Neurophysiol 2000, 111:1569-1576.
15. Hung J, Jones SJ, Vaz Pato M: Scalp potentials to pitch change in rapidtone sequences. A correlate of sequential stream segregation. Exp BrainRes 2001, 140:56-65.
16. Vaz Pato M, Jones SJ, Perez N, Sprague L: Mismatch negativity to singleand multiple pitch-deviant tones in regular and pseudo-randomcomplex tone sequences. Clin Neurophysiol 2002, 113:519-527.
17. Inui K, Urakawa T, Yamashiro K, Otsuru N, Nishihara M, Takeshima Y,Kakigi R: Non-linear laws of echoic memory and auditory changedetection in humans. BMC Neurosci 2010, 11:80.
18. May PJC, Tiitinen H: Mismatch megativity (MMN), the deviance-elicitedauditory deflection, explained. Psychophysiol 2009, 46:1-57.
19. Yamashiro K, Inui K, Otsuru N, Kida T, Kakigi R: Automatic auditory off-response in humans: an MEG study. Eur J Neurosci 2009, 30:125-131.
20. Yamashiro K, Inui K, Otsuru N, Kakigi R: Change-related responses in thehuman auditory cortex: an MEG study. Psychophysiol .
21. Näätänen R, Pakarinen S, Rinne T, Takegata R: The mismatch negativity(MMN): towards the optimal paradigm. Clin Neurophysiol 2004,115:140-144.
22. Kujala T, Lovio R, Lepistö T, Laasonen M, Näätänen R: Evaluation of multi-attribute auditory discrimination in dyslexia with the mismatchnegativity. Clin Neurophysiol 2006, 117:885-893.
23. Pakarinen S, Huotilainen M, Näätänen R: The mismatch negativity (MMN)with no standard stimulus. Clin Neurophysiol 2010, 121:1043-1050.
24. Inui K, Okamoto H, Miki K, Gunji A, Kakigi R: Serial and parallel processingin the human auditory cortex: a magnetoencephalographic study. CerebCortex 2006, 16:18-30.
25. Näätänen R: Selective attention and stimulus processing: reflections inevent-related potentials, magnetoencephalogram and regional cerebralblood flow. In Attention and Performance XI. Edited by: Posner MI, MarinOSM. Erbaum, Hillsdale; 1985:355-373.
26. Messs B, Jacobsen T, Schröger E, Friederici AD: Localizing pre-attentiveauditory memory-based comparison: magnetic mismatch negativity topitch change. Neuroimage 2007, 37:561-571.
27. Matuoka T, Yabe H, Shinozaki N, Sato Y, Hiruma T, Ren A, Hara E, Kaneko S:The development of memory trace depending on the number of thestandard stimuli. Clin EEG Neurosci 2006, 37:223-229.
28. Tanaka E, Inui K, Kida T, Miyazaki T, Takeshima Y, Kakigi R: A transition fromunimodal to multimodal activations in four sensory modalities inhumans: an electrophysiological study. BMC Neurosci 2008, 9:116.
29. Wilson DA, Linster C: Neurobiology of a simple memory. J Neurophysiol2008, 100:2-7.
30. Glanzman DL: Habituation in Aplysia: the Cheshire cat of neurobiology.Neurobiol Learn Mem 2009, 92:147-154.
31. Kadohisa M, Wilson DA: Olfactory cortical adaptation facilitates detectionof odors against background. J Neurophysiol 2006, 95:1888-1896.
32. Yamashiro K, Inui K, Otsuru N, Kida T, Kakigi R: Somatosensory off-responsein humans: an MEG study. Neuroimage 2009, 44:1363-1368.
33. Urakawa T, Inui K, Yamashiro K, Kakigi R: Cortical dynamics of the visualchange detection process. Psychophysiol 2010, 47:905-912.
34. Pasternak T, Greenlee MW: Working memory in primate sensory systems.Nat Rev Neurosci 2005, 6:97-107.
35. Paavilainen P, Alho K, Reinikainen K, Sams M, Näätänen R: Righthemisphere dominance of different mismatch negativities.Electroencephalogr Clin Neurophysiol 1991, 78:466-479.
36. Kida T, Inui K, Wasaka T, Akatsuka K, Tanaka E, Kakigi R: Time-varyingcortical activations related to visual-tactile cross-modal links in spatialselective attention. J Neurophysiol 2007, 97:3585-3596.
37. Hari R, Joutsiniemi S-L, Sarvas J: Spatial resolution of neuromagneticrecords: theoretical calculations in a spherical model. Electroencephalogrclin Neurophysiol 1998, 71:64-72.
38. Supek S, Aine CJ: Simulation studies of multiple dipole neuromagneticsource localization: model order and limits of source resolution. IEEETrans Biomed Eng 1993, 40:529-540.
39. Inui K, Wang X, Tamura Y, Kaneoke Y, Kakigi R: Serial processing in thehuman somatosensory system. Cereb Cortex 2004, 14:851-857.
40. Inui K, Kakigi R: Temporal analysis of the flow from V1 to the extrastriatecortex in humans. J Neurophysiol 2006, 96:775-784.
doi:10.1186/1471-2202-11-135Cite this article as: Inui et al.: Echoic memory of a single pure toneindexed by change-related brain activity. BMC Neuroscience 2010 11:135.
Inui et al. BMC Neuroscience 2010, 11:135http://www.biomedcentral.com/1471-2202/11/135
Page 10 of 10