Embed Size (px)
Citation preview

Efficiency of Sound Radiation from Vibrating Bodies
I. VIBRATION EFFICIENCY
Sound waves are primarily created by the vibration of physical bodies in contact with
the air. The motion of the body causes the air in the immediate vicinity of the body to
also move. The question I will address here is how much of that motion of the air in the
immediate vicinity of the body actually makes it out as sound waves far away from the body,
and what is the distribution of the sound energy in direction far away from the vibrating
body?
We will look at a number of cases, typified by a loudspeaker enclosed in a wall or in a
sound-tight box, a speaker not enclosed, in which sound can reach the listener from both
sides of the vibrating cone of the speaker, and sound emitted by a tuning fork, in which one
has two vibrating sources, for both of which the sound can get to the listener from both
sides of each of the tines of the fork, and in which the two tines are vibrating in opposite
directions at all times.
In each of these cases there are two regimes, the one where the wavelength of the sound
waves produced by the vibrating body is much larger than the dimensions of the vibrating
body, and the other where the dimensions of the body are larger than the wavelength of the
sound that is emitted. For musical instruments, the former is almost always (except for the
highest frequencies of sound emitted by an instrument) the case. The wavelength of sound
at 1kHz (near C two octaves above middle C) is 33 cm, and this is the maximum size of the
radiating area of most musical instruments which play notes that high.
Let us characterize the source of the sound by the velocity v of vibration. If the vibration
is of the simple harmonic type, (ie, looks like a sin wave if we graph the velocity as a function
of time) let us take v as the maximum velocity of the surface vibrating. The energy density
in the vibrating air near the piston I will then take to be 1
2ρv2 where ρis the density of air.
1

The density is a constant ( about 1.2Kg/m3) so the important feature of this energy density
is that it depends on the square of the velocity of the vibrating object. If all of this energy
were carried away from the surface in the escaping sound wave, then the total energy flow
away from the surface would be given by the energy density ( 1
2ρv2) times the area of the
vibrating surface (A) times the velocity of sound (c). This last term is there because after
a second the sound energy that was produced at the beginning of the second would be a
distance c away at the end of that second. Thus the energy density would be spread over a
distance of c away from the speaker. The term A is there because each portion of the area
of the vibrating surface produces its energy.
However, this is not what actually happens. All of the energy produced near the vibrating
surface does not escape. Much of it simply sticks around the vibrating surface and never
escapes. It simply adds to the mass of the vibrating surface. [Note that you noticed this
when you dip a vibrating aluminium pot lid into water. The frequency drops because the
vibrating mass has increased due to the water around the lid vibrating with the lid.] This
is especially true at low frequency. If the wavelength of the sound is much larger than
the dimension of the vibrating surface, most of the energy of vibration of the air near the
vibrating surface does not radiate at all. I will call the fraction of the energy which actually
makes it away from the surface and out into the air as sound the efficiency with which the
sound escapes.
This efficiency depends on a number of factors. It depends on the exact shape of the
vibrating surface. It depends on the surrounds of the vibrating surface (eg whether the
speaker is mounted in a solid wall which extends as a flat wall far from the speaker, or if
it is mounted in a box about the same size as the speaker.) It furthermore depends most
crucially on the whether or not the sound can get to the listener only from one face of the
vibrating object or from more than one. Let me first look at the case where the wavelength
of the sound is much larger than the dimensions of the vibrating object. In the case where
the sound can get out from only one face of the speaker, the efficiency factor is given roughly
2

as the square of the ratio of twice the size of the system divided by wavelength, or(
2Dλ
)2
,
as long as the wavelength is much larger than the diameter of the vibrating system. If on
the other hand the sound can get to the listener from both sides of the vibrating surface,
the efficiency is now approximately given by(
2Dλ
)4
for wavelengths much larger than the
diameter. If one has two vibrating areas in which both sides of each diaphragm emit sound
that can get to the listener and the two vibrate in opposite directions (eg, tuning fork) ,
then the sounds from the two almost cancel, and in this case the efficiency goes as(
2Dλ
)6
.
In all of the above cases on the other hand, for frequencies which are much higher than
those for which the wavelength is about the same as the diameter of the object, (ie, the
wavelengths are much smaller than the size of the object) all of the energy gets out and the
efficiency is unity.
In the intermediate regime, the situation becomes complicated. However as a first ap-
proximation, we can simply take the efficiency as 1 for all frequencies such that λ/2, half the
wavelength, is smaller than D the diameter, and as(
2Dλ
)2
if the wavelength is larger than
the diameter for the case of a simple one sided piston. For the case of a two sided piston, I
will take the expression as 1 for λ/2 < D and as(
2Dλ
)4
for λ > D. For the case with two
vibrating diaphragms, in which they vibrate in opposition to each other, I will take it as
again 1 for λ/2 < D and(
2Dλ
)6
for λ/2 > D.
Note that these expressions are crude approximations, and the actual frequency of tran-
sition can vary depending on the exact shape of the vibrating body, its enclosure, etc..
In the case of the diaphragm for which one can hear the sound from both sides, the
answer depends not only on the diameter of the vibrating diaphragm, but also on how far
the sound has to travel to get to the listener from the back of the diaphragm. Similarly
in the case of two out of phase diaphragms, the distance between the diaphragms is also
important. A better approximation would be to write the expression in this third case as
(
2D
λ
)2 (
2W
λ
)2 (
2L
λ
)2
, where W is the width of the barrier in which the speaker is mounted (ie the distance the
3

sound has to go to get around from the back to the front where the listener is, and L is the
distance between the two radiating ”diaphragms”. However even this expression is a rough
estimate of the efficiency. We however are not carrying out detailed calculations, but are
simply trying to get a feeling for the effects. Thus, for the purposes of this course I will
always use the above crude approximations.
In order to present this data in a more graphical instead of an algebraic fashion, let me
graph the efficiency factor. I will choose to graph it using the dB scale to represent the ratio
of energies (energy actually emitted over energy expected to be emitted based on velocity
near the vibrating body), and will use pitch to represent the frequencies.
Remember that each 10 dB change (on the ′y′ axis) represents a factor of 10 change in
the efficiency. On the ′x′ axis, each change in pitch by one octave represents a change by a
factor of 2 in frequency, and a also a factor of two change in wavelength. (If the frequency
goes up by a factor of 2, the wavelength shortens by a factor of 2). On this scale, we note
that the function(
Dλ
)2
is such that as the wavelength increases by a factor of 2 ( and the
frequency decreases by an octave), the efficiency goes down by a factor of 22 = 4. Looking
on the relative dB scale, we note that a factor of 4 corresponds to approximately 6 dB. Thus
each time the frequency changes by an octave, the efficiency changes by 6 dB. This produces
a graph in which the efficiency rises by 6dB for each octave rise in frequency, as long as the
frequency is low enough.
For high frequencies, the efficiency is unity. Since a ratio of unity corresponds to 0 dB,
the plot of the efficiency on this graph can be obtained as follows. Calculate the frequency
at which half the wavelength equals the diameter. Call this the ”knee” frequency. For
frequencies larger than this knee frequency, plot a horizontal line along the 0 dB line. For
frequencies less than this knee frequency, plot a straight line which falls 6dB for every octave
and goes to 0 dB at the knee frequency. Use this as the approximation to the efficiency for
the sound source with diameter corresponding to half the wavelength at the knee frequency.
I have done this for a particular example of a sound source a plane diaphragm of
diameter 19.3 cm. First we need to calculate the knee frequency. This corresponds
4
to a wavelength equal to twice the diameter, or 38.7cm. This wavelength correspond-
ing to the knee frequency of is 340m/sec.192m
= 880Hz. For frequencies higher than 880 Hz
(ie, A880), the efficiency line is a horizontal line at 0dB. For lower frequencies, the line
must fall by 6dB per octave. We therefor go down one octave from 880Hz, to 440Hz
(or the 3rd A along the pitch axis). Plot a point at this frequency and at -6 dB.
Draw a straight line from the 880Hz-0dB point through this 440Hz -6dB point. We
thus get the plot in figure 1 for the efficiency for this particular vibrating diaphragm.
5

-1 0 1 2 3 4 5 6 7 8 9
Frequency (Hz)
Pitch (A)
10 100 1000
1. Radiation from one side
If we now want to discover with what efficiency this diaphragm will radiate at some
frequency, say 200Hz, we simply read off the graph what the efficiency corresponds to
at 200Hz. In this case it is approximately -12.5dB. Only a fraction of about 1/18 th
6

(12.5dB=10dB+2.5dB which corresponds roughly to a factor of 10×1.8) of the sound energy
of vibration of the air at the diaphragm will actually escape as sound.
It is of course clear that this graph is an approximation. No physical function ever has
sharp corners as this one does at the knee frequency. The true efficiency curve would be a
smooth curve, with no sharp corners. The dotted line represents one possible actual curve.
For a speaker in an infinite flat wall, the curve in addition has wiggles around the knee
frequency. In the next figure 1a is plotted the actual efficiency as a function of frequency
for a flat circular piston in an infinite flat wall. Note that the actual knee frequency is in
fact slightly lower than the approximation we have made. The location of the actual knee
depends on a large number of factors, most important being the shape of the enclosure the
sound source is in. However, we will not worry about this in this course.
7

-5 0
-30
-20
-10
0
Octaves above/below knee
Radiation Efficiency for
circular Piston in a
flat wall.
Sound VelocityKnee Frequency = ___________________2 Diameter
Note that there are also wiggles in the efficiency for frequencies above the knee. On a
dB scale these wiggles are audibly negligible, since they are less than 1dB in amplitude.
These wiggles come about because of interference from the various parts of the speaker in
8

directions off the straight ahead direction.
Note that sharp edges on a speaker also tend to produce wiggles in the response at
frequencies where the size of the box is roughly half a wavelength in size.
If both sides of the speaker are open to the air, so that the sound from the back can get
to the listener, as well as sound from the front, then instead of a 6dB per octave curve for
frequencies below the ”knee” frequency, the efficiency falls at 12dB/octave instead. Ie, since
the efficiency goes as(
Dλ
)4
, if λ increases by a factor of 2, the efficiency drops be a factor
of 24 = 16. But 16=1.6×10 which is 2 dB (for the factor of 1/6) plus 10dB (for the factor
of 10) to give 12dB. Ie, the curve should be drawn so that it rises by 12 dB every time the
pitch changes by an octave, as in figure 2.
9

-1 0 1 2 3 4 5 6 7 8 9
Frequency (Hz)
Pitch (A)
10 100 1000
2. Radiation from two sides
If we have a system like a tuning fork, where there are two vibrating elements both of
which vibrate in opposite directions to each other, then the curve slopes as 18 dB per octave
below the knee frequency. (26 = 64 = 6.4× 10 → 8dB + 10dB = 18dB) This is plotted in
10

figure 3. Note that in order to get most of the curve onto the plot, I have vastly expanded
the range of the dB axis. Instead of going from -30dB to 10dB, it here goes from -120 dB
to 10 dB. Of course again in this case the true curve will be smoother than this one with
its drastic kink, and there will be oscillations in the curve around the knee frequency. But
again these are matters for more detailed study, not for this course where we are trying to
simply get a feel for what is happening. (If you want more details, the course which meets
in our lecture room immediately before ours is one in which the details of acoustics are
calculated mathematically.) Even without straight line approximations, we could improve
things by calculating three ”knee” frequencies- one for the size of the ”piston” (D), one for
the distance around from the back to the front of the piston (W ), and one for the separation
of the two radiating surfaces (L) at each ”knee” frequency, the line changes in its slope,
from 18dB per octave, to 12dB per octave, to 6dB per octave, to the high frequency (small
wavelength) region above all the knees of 0dB. (see figure 4). Again it just isn’t worth it.
11

-1 0 1 2 3 4 5 6 7 8 9
Frequency (Hz)
Pitch (A)
10 100 1000
3. Radiation from four sides
12

-1 0 1 2 3 4 5 6 7 8 9
Frequency (Hz)
Pitch (A)
10 100 1000
4. Radiation from four
sides with different knees
13

II. INTERFERENCE
What causes these effects? In particular, why if one can hear both sides of the diaphragm
is the amount of sound radiated at low frequencies so much less than if you can hear only one
side of the piston? The phenomenon is one called interference. Let us examine this situation
in which one has a vibrating diaphragm and for which both sides of the diaphragm can be
heard. For frequencies much less than the ”knee” frequency, each side of the diaphragm
produces sound. However the sound from the back of the piston is 180o out of phase with
the sound produced by the front. Ie, when the front produces a disturbance with the velocity
of the air in one direction, the back produces one with the velocity and pressure in exactly
the opposite direction. If they were immediately combined, they would completely cancel
and produce no sound whatsoever. However, the sound from the back of the diaphragm has
to travel a slightly greater distance than does the sound from the front if the listener is in
front of the diaphragm. As a result when the sounds from the two sides reach the ear, they
are not exactly opposite in pressure and velocity. When the sound from the front reaches
the ear with a maximum velocity in its oscillation, the sound that reaches the ear from the
back must have left the diaphragm slightly earlier than that from the front, in order to make
up for the extra time it took to travel to the ear. As a result the sound front the back is not
exactly at its minimum (most negative ) velocity, and that sound from the back does not
exactly cancel that from the front. The phase difference is not exactly 180o, and the two
waves do not exactly cancel. The longer the wavelength (ie the lower the frequency) the less
of a difference in phase this small difference in travel time makes, and the more nearly the
waves cancel. This near cancellation of the waves from the different parts of the diaphragm
is called interference. The sounds from the two sides of the diaphragm interfere with each
other, and produce far less sound that one would otherwise expect.
Simialry, the sound from various parts of the speaker can interfer with each other. In
figure 5 we have a speaker in the wall ( so sound only comes from one side) and an ear a
distance away from the speaker at various angles to the speaker. We want to look at the
14

sound getting to the ear from the two points a and b on the speaker. Sound takes time to
travel from the speaker to the ear. If the ear is straight ahead, the sound from both points
has the same distance to travel.(see figure 6) If the two points on the speaker are vibrating
in phase, the sound that gets to the ear will be in phase, and the two sound waves from
these two parts of the speaker will add together. At point at a smaller angle however the
distance from b is larger than from a. The sound getting to the ear from b will be delayed.
In this example I am assuming that the delay is about 1/4 of a period (ie, the difference in
distances is about 1/4 wavelength). The two waves from teh two points do not completely
add together. and the sound will be less than straight ahead. At the larger angle, the
distance from b is even larger than from a. By assumption it is now 1/2 a period difference
in time of arrival. Now the two sounds are completely out of phase and cancel at the ear.
15

speaker
straight ahead
smaller angle
larger angle
16

at speaker
staight ahead from speaker
at smaller angle from straight ahead
at larger angle from straight ahead.
Clearly one must go through this procedure for each part of the speaker to find out how
much sound actually gets to the ear, and how much the various parts of the speaker cancel
each other out. Clearly, if the speaker is larger in diameter than half a wavelength, then the
17

sound delay from any part will be less than half a period, and the sound does not completely
cancel from any two parts of the speaker.
III. DIRECTIONALITY
One of the key idea that can be picked up from the preceding paragraph is what sound
someone would hear it they were placed away from a vibrating diaphragm but were located
in the same plane as the diaphragm. In this case the distance that the sound has to travel to
them from the two sides of the diaphragm are exactly the same. Since the two sides produce
sound of exactly 180o out of phase with each other, and the time taken to get to the ear
from the two sides is exactly the same, the sounds will cancel at the ear. Ie, there will be no
sound emitted in a direction parallel to the diaphragm. However if the observer sits either
behind or in front of the diaphragm, sound will be heard. Ie, the sound emitted from a
vibrating diaphragm, where both sides radiate freely into the air has directional properties
due to interference of the sound coming from the various parts of the oscillating source.
The same is true for the sound coming from a single side of the diaphragm. If the wave-
length of sound is much smaller than the diameter of the oscillating diaphragm, then even
the sounds emitted by different parts of the diaphragm can interfere with each other. Since
the distance sound travels in one period is by definition one wavelength, if the wavelength
of the sound is less than the diameter of the diaphragm, then the time at which the sound
gets to a listener listening off axis of the diaphragm will differ, and can differ by times which
are equal to or even much greater than one period. This means that the sound which gets
to the ear from the different parts of the diaphragm will have very different phase relations.
Some will cancel, some will add and one has to do detailed calculations. The results are
that if the wavelength is of the order of or much less than the diameter of the source, then
the sound coming off is highly directional. Almost all of the sound comes off in the straight
forward direction. In fact roughly, the angle into which most of the sound is radiated is of
the order of 50o λD
. The larger the diaphragm with respect to the wavelength, the narrow
18

this angle is, and the more directional the sound is that comes off the diaphragm. This can
of course be useful at times, but demonstrates that if one wants the sound to only go into
a certain direction one needs a very large radiating size.
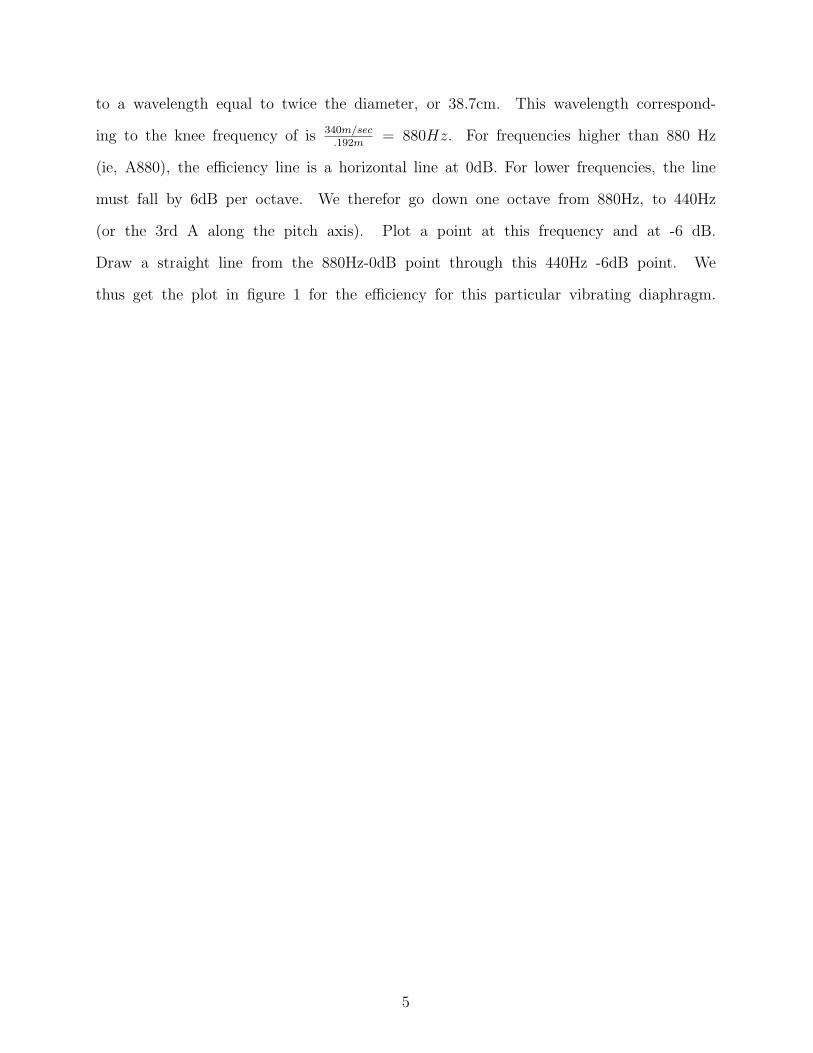
In figure 7 I have plotted the ”dipole” response pattern of a system which radiates
from two sides, and at a frequency much lower than the knee frequency. This plot is
a polar plot. It plots the relative intensity of the sound emitted in various directions.
Note that the sound is a maximum in the zero degree and 180 degree directions, and
goes to zero, as argued, in the directions perpendicular to the motion of the speaker.
19
5. Radiation direction for dipole radiator.
The amount of energy going into certain directions is usually graphed on a type of graph
called a polar diagram. This is not a graph with axes in the usual sense. Instead, one is
trying to represent how much sound is radiated into a certain direction. To do this, one
20

chooses an origin (some point) and from that origin draws straight lines going outwards
from that point in the various directions one is interested in. Then along the line going in a
particular direction of interest, one measure a distance along that line from the central point
corresponding to the magnitude of the energy one wishes to represent on the graph, and puts
a point there. Doing this for all of the directions, and then joining up the points smoothly,
one gets the polar diagram. Figure 8 is one such example. These graphs are almost always
relative graphs. Ie, one does not plot the absolute energy going in any particular direction
but picks some direction (eg straight ahead) as the fiducial direction, and calls the amount
radiated in that direction 1. Ie all of the energies are measured as ratios with the energy
going straight ahead in the denominator.
21

Radiation Distributions
Radiation from Piston in Wall
Vel. sound
2 Diameter
Radiation scaled so
Forward Direction is 1
So let us look at figure 8. In the straight ahead direction (0o), the distance along the line
going straight ahead is of magnitude 1. Along the 45o direction reading along the radius
there, the magnitude is .5, which means only half as much energy gets radiated in the 45o
22

direction as in the forward direction. In the 90o direction, the magnitude is zero, meaning
that no radiation is emitted in that direction. In the 180o direction, the magnitude is again 1,
meaning that just as much radiation is emitted in the backwards direction as in the forwards,
etc. Note that this graph is in fact the graph of the radiation direction for a diaphragm in
which both sides are radiating at frequencies much less than the ”knee” frequency ( wave
length much larger than the diameter of the radiator). This pattern of radiation is known
as the ”dipole” pattern. It is also the pattern of radiation from a violin at frequencies above
about A440 to about 1kHz.
We can now look at the pattern of radiation from a single diaphragm mounted in a wall,
say. Obviously in this case the energy is only radiated in the forward direction, since the
observer cannot be located inside the wall. At low frequencies, the radiation is emitted
almost equally in all directions. As the frequency rises the direction of the radiation emitted
becomes more and more focused. In Figure 6 I have plotted the directionality of the radiation
for three frequencies– half the knee frequency in which case the radiation is essentially
isotropic, twice the knee frequency, in which case the radiation has begun to be beamed in
the forward direction, and 8 times the knee frequency, in which case the radiation is emitted
in a narrow cone straight ahead.
In Figure 9 I have plotted exactly the same radiation from a simple piston in a wall,
but in this case, I have plotted the intensity in dB rather than in the relative intensity.
Here it is easy to see that the radiation pattern becomes ”lobed” at high frequencies, where
directions of no radiation alternate with directions of some (although by far the most goes
into the lobe pointing straight ahead). These lobes and zeros are caused by the interference
of the radiation from the various parts of the diaphragm interfering with each other, and in
some directions it entirely cancels out, while in other directions it partially cancels, but not
entirely. Note that even the largest lobe is about 18dB below the intensity of the straight
ahead radiation, and thus is scarcely noticeable in the polar intensity plot.
23

Radiation Distributions (dB)
Radiation from Piston in
Wall
Vel. sound
2 Diameter
Radiation scaled so
Forward Direction is 0dB
0 -10 -20 -30 -40
One point is that the graphs have all been plotted taking the efficiency of the straight
ahead radiation to be unity. Ie, the intensities plotted have been relative intensities. However
in actual fact, the intensity straight ahead rises by a factor of 4 per octave for all frequencies.
24

Ie, given that the piston vibrates with the same velocity, the intensity straight ahead would
be 16 times higher for the 2fk than for the fk/2, and another 16 times more intense for the
8fk. Ie, a vibrating piston becomes louder and louder right on axis the higher the frequency,
but falls off more and more rapidly as one goes off axis.
Copyright W G Unruh
25