Embed Size (px)
Citation preview

ECMWFSeattle, 6-7 June 2005 slide 1
The role of the Pacificdownstream: Europe
Value of Targeting
Carla Cardinali
Roberto Buizza Graeme KellyJean-Noel Thepaut

ECMWFSeattle, 6-7 June 2005 slide 2
The role of the North Pacific sea for the downstream forecast has been investigated by removing all observations over sea
1.5 month assimilation ECMWF 4D-Var T511T159L60
Compare with O-suite
Targeting studies (March 2005-…) Preliminary results
Value of SVs to detect targeting areas
Ultimately, value of targeting with satellite data
Outline

ECMWFSeattle, 6-7 June 2005 slide 3
Experiment Description: North Pacific OUT
Synop Airep Satob DribuTemp Pilot Satellite Scatt

ECMWFSeattle, 6-7 June 2005 slide 4
The Role of the Pacific
EUROPE LAT 35.000 TO 75.000 LON -12.500 TO 42.500
ROOT MEAN SQUARE ERROR FORECAST
500hPa GEOPOTENTIAL
FORECAST VERIFICATION 12UTC
M'
1DECEMBER
2003
2 3 4 5 6 7 8 9 10 11 12 13 14 15 16 17 18 19 20 21 22 23 24 25 26 27 28 29 30 31 1 2 3 4 5 6 7 8 9 10 11 12 13JANUARY
2004
20
40
60
80
100
120
140
160
180
NoPac T+144Cntrl T+144

ECMWFSeattle, 6-7 June 2005 slide 5
The Role of the Pacific
144 HOUR FORECASTS
AREA=EUROPE TIME=12 DATE=20031201/...
ROOT MEAN SQUARE ERROR FORECAST
500 hPa VECTOR WIND (M/S)
0 10 20 30
NoPac0
10
20
30
Op
er
NoPac is WORSE than Oper at the 5.0% level (t test)NoPac is WORSE than Oper at the 5.0% level (sign test)
43 CASES
MEAN
MAGICS 6.9.1 leda - dac Wed May 18 13:50:27 2005 Verify SCOCAT
144 HOUR FORECASTS
AREA=EUROPE TIME=12 DATE=20031201/...
ROOT MEAN SQUARE ERROR FORECAST
500 hPa GEOPOTENTIAL (M)
0 25 50 75 100 125 150 175 200
NoPac0
25
50
75
100
125
150
175
200
Op
er
diff has too few runs at the 10.0% level (run test)NoPac is WORSE than Oper at the 5.0% level (sign test)
43 CASES
MEAN
MAGICS 6.9.1 leda - dac Wed May 18 13:14:04 2005 Verify SCOCAT

ECMWFSeattle, 6-7 June 2005 slide 6
The Role of the Pacific
144 HOUR FORECASTS
AREA=EUROPE TIME=12 DATE=20031201/...
ROOT MEAN SQUARE ERROR FORECAST
200 hPa VECTOR WIND (M/S)
0 10 20 30
NoPac0
10
20
30
Op
er
43 CASES
MEAN
MAGICS 6.9.1 leda - dac Wed May 18 13:50:27 2005 Verify SCOCAT
144 HOUR FORECASTS
AREA=EUROPE TIME=12 DATE=20031201/...
ROOT MEAN SQUARE ERROR FORECAST
200 hPa GEOPOTENTIAL (M)
0 25 50 75 100 125 150 175 200
NoPac0
25
50
75
100
125
150
175
200
Op
er 43 CASES
MEAN
MAGICS 6.9.1 leda - dac Wed May 18 13:14:04 2005 Verify SCOCAT

ECMWFSeattle, 6-7 June 2005 slide 7
PACIFIC: NoPac forecast error – Oper forecast error at T+24
NormDiff in RMS Averaged over 50 cases

ECMWFSeattle, 6-7 June 2005 slide 8
PACIFIC: NoPac forecast error – Oper forecast error at T+48
NormDiff in RMS Averaged over 50 cases

ECMWFSeattle, 6-7 June 2005 slide 9
PACIFIC: NoPac forecast error – Oper forecast error at T+72
NormDiff in RMS Averaged over 50 cases

ECMWFSeattle, 6-7 June 2005 slide 10
PACIFIC: NoPac forecast error – Oper forecast error at T+96
NormDiff in RMS Averaged over 50 cases

ECMWFSeattle, 6-7 June 2005 slide 11
PACIFIC: NoPac forecast error – Oper forecast error at T+120
NormDiff in RMS Averaged over 50 cases

ECMWFSeattle, 6-7 June 2005 slide 12
PACIFIC: NoPac forecast error – Oper forecast error at T+144
NormDiff in RMS Averaged over 50 cases

ECMWFSeattle, 6-7 June 2005 slide 13
Removing all the observation over the North Pacific slightly deteriorate the day 6-7 forecast over Europe
1.5 month assimilation ECMWF 4D-Var T511T159L60
Compare with O-suite
Observations over North America recover the lack over the Pacific: the impact depends on the synoptic situation
See THORPEX picture
Preliminary Conclusion

ECMWFSeattle, 6-7 June 2005 slide 14

ECMWFSeattle, 6-7 June 2005 slide 15
Targeting studies
The key questions addressed in this study are:
Q1 - What is the value of observations taken in target areas over the ocean, and what is the ‘value’ of SVs at depicting target areas?
Q2 - Is the ‘value’ of observation regional dependent? (in other words, what is the value of observations taken over the Pacific for North-America, and the value of observations taken over the Atlantic for Europe?)
Q3 - What is the ‘value’ of different types of observations?
In particular, what is the scope of targeted satellite observations

ECMWFSeattle, 6-7 June 2005 slide 16
1) Experiment Description: IN
SV
RD
V
10 ToT Energy SVs T63L40 computed every analysis cycle
for 1.5 month
Verification region V and area where SVs have maximum
final-time total energy after 48h.
IN = All Points over Sea removed but in
SV and RD Target-Areas Grid Points = 120
ECMWFSeattle, 6-7 June 2005 slide 17
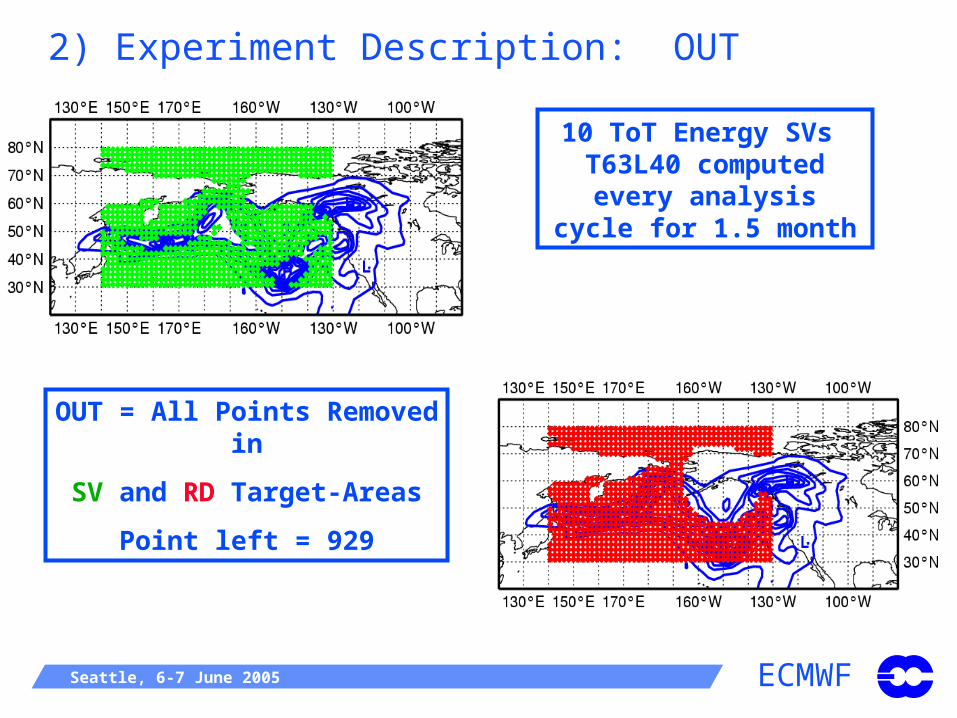
2) Experiment Description: OUT
10 ToT Energy SVs T63L40 computed every
analysis cycle for 1.5 month
OUT = All Points Removed in
SV and RD Target-Areas
Point left = 929

ECMWFSeattle, 6-7 June 2005 slide 18
Experiment Description: Data CoveragePacific OUT
SVIN
RDIN

ECMWFSeattle, 6-7 June 2005 slide 19
Target IN
N.AMER LAT 25.000 TO 60.000 LON -120.000 TO -75.000
ROOT MEAN SQUARE ERROR FORECAST
500hPa GEOPOTENTIAL
FORECAST VERIFICATION 12UTC
M'
1DECEMBER
2003
2 3 4 5 6 7 8 9 10 11 12 13 14 15 16 17 18 19 20 21 22 23 24 25 26 27 28 29 30 31 1 2 3 4 5 6 7 8 9 10 11 12 13JANUARY
2004
5
10
15
20
25
30
35
40
45
SVinPac T+ 48RDinPac T+ 48

ECMWFSeattle, 6-7 June 2005 slide 20
Target OUT
N.AMER LAT 25.000 TO 60.000 LON -120.000 TO -75.000
ROOT MEAN SQUARE ERROR FORECAST
500hPa GEOPOTENTIAL
FORECAST VERIFICATION 12UTC
M'
1DECEMBER
2003
2 3 4 5 6 7 8 9 10 11 12 13 14 15 16 17 18 19 20 21 22 23 24 25 26 27 28 29 30 31 1 2 3 4 5 6 7 8 9 10 11 12 13JANUARY
2004
8
10
12
14
16
18
20
22
24
26
28
SVoutPac T+ 48
RDoutPac T+ 48

ECMWFSeattle, 6-7 June 2005 slide 21
Target IN Target OUT
48 HOUR FORECASTS
AREA=N.AMER TIME=12 DATE=20031201/...
ROOT MEAN SQUARE ERROR FORECAST
850 hPa GEOPOTENTIAL (M)
0 10 20 30 40 50
SVoutPac
0
10
20
30
40
50
RD
ou
tPa
c
diff has too few runs at the .1% level (run test)SVoutPac is WORSE than RDoutPac at the 10.0% level (t test)
51 CASES
MEAN
MAGICS 6.9.1 leda - dac Thu May 26 16:58:23 2005 Verify SCOCAT
48 HOUR FORECASTS
AREA=N.AMER TIME=12 DATE=20031201/...
ROOT MEAN SQUARE ERROR FORECAST
500 hPa GEOPOTENTIAL (M)
0 10 20 30 40 50
SVoutPac
0
10
20
30
40
50
RD
ou
tPa
c
diff has too few runs at the .1% level (run test)SVoutPac is WORSE than RDoutPac at the .5% level (t test)
SVoutPac is WORSE than RDoutPac at the 5.0% level (sign test)
51 CASES
MEAN
MAGICS 6.9.1 leda - dac Thu May 26 16:58:48 2005 Verify SCOCAT
48 HOUR FORECASTS
AREA=N.AMER TIME=12 DATE=20031201/...
ROOT MEAN SQUARE ERROR FORECAST
850 hPa GEOPOTENTIAL (M)
0 10 20 30 40 50
SVinPac
0
10
20
30
40
50
RD
inP
ac
diff has too few runs at the .1% level (run test)SVinPac is BETTER than RDinPac at the .1% level (t test)
SVinPac is BETTER than RDinPac at the .1% level (sign test)
51 CASES
MEAN
MAGICS 6.9.1 leda - dac Thu May 26 17:02:07 2005 Verify SCOCAT
48 HOUR FORECASTS
AREA=N.AMER TIME=12 DATE=20031201/...
ROOT MEAN SQUARE ERROR FORECAST
500 hPa GEOPOTENTIAL (M)
0 10 20 30 40 50
SVinPac
0
10
20
30
40
50
RD
inP
ac
diff has too few runs at the .1% level (run test)diff has too small variance ratio at the 5.0% level (F test)
SVinPac is BETTER than RDinPac at the .1% level (t test)SVinPac is BETTER than RDinPac at the 1.0% level (sign test)
51 CASES
MEAN
MAGICS 6.9.1 leda - dac Thu May 26 17:02:35 2005 Verify SCOCAT

ECMWFSeattle, 6-7 June 2005 slide 22
PACIFIC: SVIN forecast error – RDIN forecast error at T+24
NormDiff in RMS Averaged over 50 cases

ECMWFSeattle, 6-7 June 2005 slide 23
PACIFIC: SVIN forecast error – RDIN forecast error at T+48
NormDiff in RMS Averaged over 50 cases

ECMWFSeattle, 6-7 June 2005 slide 24
PACIFIC: SVIN forecast error – RDIN forecast error at T+72
NormDiff in RMS Averaged over 50 cases

ECMWFSeattle, 6-7 June 2005 slide 25
PACIFIC: SVIN forecast error – RDIN forecast error at T+96
NormDiff in RMS Averaged over 50 cases

ECMWFSeattle, 6-7 June 2005 slide 26
PACIFIC: SVIN forecast error – RDIN forecast error at T+120
NormDiff in RMS Averaged over 50 cases

ECMWFSeattle, 6-7 June 2005 slide 27
PACIFIC: SVIN forecast error – RDIN forecast error at T+144
NormDiff in RMS Averaged over 50 cases
ECMWFSeattle, 6-7 June 2005 slide 28
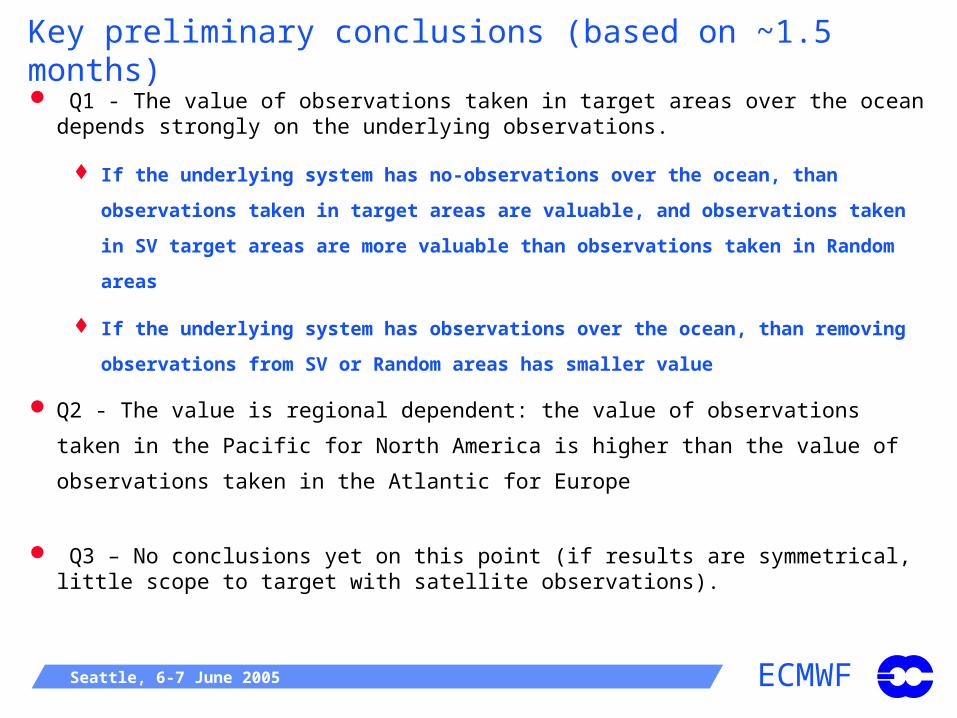
Key preliminary conclusions (based on ~1.5 months) Q1 - The value of observations taken in target areas over the ocean depends
strongly on the underlying observations.
If the underlying system has no-observations over the ocean, than observations
taken in target areas are valuable, and observations taken in SV target areas are
more valuable than observations taken in Random areas
If the underlying system has observations over the ocean, than removing
observations from SV or Random areas has smaller value
Q2 - The value is regional dependent: the value of observations taken in the
Pacific for North America is higher than the value of observations taken in the
Atlantic for Europe
Q3 – No conclusions yet on this point (if results are symmetrical, little scope to target with satellite observations).

ECMWFSeattle, 6-7 June 2005 slide 29
Value of Targeting the Pacific for Europe
EUROPE LAT 35.000 TO 75.000 LON -12.500 TO 42.500
ROOT MEAN SQUARE ERROR FORECAST
500hPa VECTOR WIND
FORECAST VERIFICATION 12UTC
M/S
1DECEMBER
2003
2 3 4 5 6 7 8 9 10 11 12 13 14 15 16 17 18 19 20 21 22 23 24 25 26 27 28 29 30 31 1 2 3 4 5 6 7 8 9 10 11 12 13JANUARY
2004
6
8
10
12
14
16
18
20
22
NoPac T+144Cntrl T+144
SVinPac T+144RDinPac T+144