Embed Size (px)
Citation preview
ORIGINAL PAPER
Ecological drivers of group living in two populationsof the communally rearing rodent, Octodon degus
Luis A. Ebensperger & Raúl Sobrero & Verónica Quirici & Rodrigo A. Castro &
Liliana Ortiz Tolhuysen & Francisco Vargas & Joseph Robert Burger & René Quispe &
Camila P. Villavicencio & Rodrigo A. Vásquez & Loren D. Hayes
Received: 23 March 2011 /Revised: 14 September 2011 /Accepted: 6 October 2011 /Published online: 22 October 2011# Springer-Verlag 2011
Abstract Intraspecific variation in sociality is thought toreflect a trade-off between current fitness benefits and coststhat emerge from individuals' decision to join or leavegroups. Since those benefits and costs may be influencedby ecological conditions, ecological variation remains amajor, ultimate cause of intraspecific variation in sociality.Intraspecific comparisons of mammalian sociality acrosspopulations facing different environmental conditions havenot provided a consistent relationship between ecologicalvariation and group-living. Thus, we studied two popula-tions of the communally rearing rodent Octodon degus todetermine how co-variation between sociality and ecologysupports alternative ecological causes of group living. Inparticular, we examined how variables linked to predationrisk, thermal conditions, burrowing costs, and food avail-
ability predicted temporal and population variation insociality. Our study revealed population and temporalvariation in total group size and group composition thatcovaried with population and yearly differences in ecology.In particular, predation risk and burrowing costs aresupported as drivers of this social variation in degus.Thermal differences, food quantity and quality were notsignificant predictors of social group size. In contrast tobetween populations, social variation within populationswas largely uncoupled from ecological differences.
Keywords Sociality . Predation risk . Burrowing costs .
Food availability . Thermal conditions . Degus
Introduction
Animal social groups range from short-term associationsand aggregations (e.g., foraging or roosting groups) torelatively long-term socially cohesive units (e.g., commu-nally rearing groups) (Parrish et al. 1997; Krause andRuxton 2002). Among the vertebrates, considerable intra-and inter-specific variation in the number and compositionof group members characterizes more socially cohesivegroups (Lott 1991; Maher and Burger 2011). Both sourcesof variation are the raw material for studies aimed atdetermining the functional significance of behavior (Lott1991; Foster and Endler 1999), including sociality (Traviset al. 1995; Spinks et al. 2000; Schradin and Pillay 2005).
Intraspecific variation in sociality is thought to reflect atrade-off between current fitness benefits and costs thatemerge from individuals' decision to join or leave groups.Benefits such as decreased predation risk, decreasedburrowing costs, access to resources, and enhanced ther-moregulation are hypothesized to promote the formation
Communicated by A. Schulte-Hostedde
L. A. Ebensperger (*) : R. Sobrero :V. Quirici : R. A. Castro :L. O. Tolhuysen : F. VargasCentro de Estudios Avanzados en Ecología and Biodiversidad,and Departamento de Ecología, Facultad de Ciencias Biológicas,Pontificia Universidad Católica de Chile,Casilla 114-D,Santiago, Chilee-mail: [email protected]
J. R. Burger : L. D. HayesDepartment of Biology, University of Louisiana at Monroe,Monroe, LA 71203, USA
R. Quispe : C. P. Villavicencio : R. A. VásquezInstituto de Ecología y Biodiversidad, and Departamento deCiencias Ecológicas, Facultad de Ciencias, Universidad de Chile,Santiago, Chile
R. Quispe : C. P. VillavicencioDepartment of Behavioural Neurobiology,Max Planck Institute for Ornithology,Seewiesen, Germany
Behav Ecol Sociobiol (2012) 66:261–274DOI 10.1007/s00265-011-1274-3
and maintenance of social groups (Alexander 1974;Bertram 1978; Ebensperger 2001; Ebensperger and Cofré2001; Ebensperger and Blumstein 2006; Table 1). Fitnesscosts, on the other hand, include increased parasitism andcompetition over resources (Hoogland 1995). Since most, ifnot all, of these benefits and costs may be influencedby ecological conditions, ecological variation remains amajor, ultimate cause of intraspecific variation in sociality(Slobodchikoff 1984; Brashares and Arcese 2002).
Intraspecific comparisons of mammalian sociality inpopulations with different environmental conditions havenot revealed a consistent relationship between ecologicalvariation and group living. For example, group size (themost common measure of sociality) of cercopithecoidprimates increases in populations under high predation risk(Hill and Lee 1998; see also Hass and Valenzuela 2002). Incontrast, the size and composition of mongoose socialgroups is not different in populations with differentpredation regimes (Clutton-Brock et al. 1999). Similarly,the size of social groups has been noted to increase with thepatchiness of food resources and overall abundance andquality of food across some populations of rodents andungulates (Travis et al. 1995; Brashares and Arcese 2002),but not others (Spinks et al. 2000). Johnson et al. (2002)found no relationship between the thermal environment (amain determinant of energy expenditure) and the size ofsocial groups across populations of badgers (Meles meles)throughout Europe. While these findings contrast withstudies of single populations in rodents where the extentof grouping tracks changes in ambient temperature (West1977; Stapp et al. 1991; Edelman and Koprowski 2007),they support other studies (e.g., Getz and McGuire 1997),suggesting that social group size is not influenced byfluctuations in ambient temperature. Regarding reduced
costs of burrow construction, burrow digging has beenassociated to the evolution of sociality across neotropical(Ebensperger and Cofré 2001; Ebensperger and Blumstein2006) and African hystricognath rodents (Jarvis et al.1994). However, it is far from clear whether environmentaldifferences linked to energy expenditure or burrow diggingunderlies social variety within species.
Model species, hypotheses, and predictions
We first determined how variation in sociality tracksdifferences in ecological conditions in two populations ofthe communally rearing rodent Octodon degus. We then usethis information to examine how this co-variation supportsalternate, non-mutually exclusive hypotheses for the causesof group living. Degus are diurnal, medium-sized rodents(ca. 180 g) that feed mostly on the green leaves of grassesand forbs and breed generally once per year (Ebenspergerand Hurtado 2005b; Quirici et al. 2010). Degus are pluralbreeders with communal care of offspring (Brown 1987;Solomon and Getz 1997; Silk 2007), i.e., 1–5 males and 1–8 multiple lactating females share underground nests andrear their litters communally (Ebensperger et al. 2002,2004, 2007; Hayes et al. 2009).
Single population studies indicate that predation riskinfluences the size of foraging groups, and that these groupsin turn affect the ability of degus to detect approachingpredators (Vásquez 1997; Ebensperger and Wallem 2002;Ebensperger et al. 2006). These results suggest thatpredation risk predisposes degus to live in social groups.Given that in these animals (1) survival increases wheneverdaytime or crepuscular predators are experimentally ex-cluded (Meserve et al. 1983), and (2) communally nestingindividuals (i.e., members of same social group) tend to
Table 1 Functional hypotheses for group living that were examined in Octodon degus (for a discussion of specific mechanisms associated to eachhypothesis, see Ebensperger (2001))
Functional hypothesis Predictions
Between population Within population
Group living decreasespredation risk
Larger social groups in the population with more frequent predatorsightings
Larger social groups in the population where distance from burrows usedby social groups to the nearest shrub (protective cover) is greater
Group size increases with distance fromburrows used to the nearest shrub cover
Greater density of burrow openings in burrows used by larger socialgroups
Density of burrow openings increaseswith group size
Group living decreasesthermoregulation cost
Larger social groups in the population facing lower ambient temperature
Group living decreasescosts of nest/refugebuilding
Larger social groups in the population facing harder soil conditions (i.e.,higher digging costs)
Group size increases with increasing soilhardness
Group living enhancesforaging efficiency
Larger social groups in the population holding a greater abundance orquality of food
Group size increases with increasingabundance of food
262 Behav Ecol Sociobiol (2012) 66:261–274
forage and be active on the same patches during day time(Ebensperger et al. 2004; Soto-Gamboa 2004), we consid-ered predation risk to increase with the frequency ofpredators active during day time. In addition, shrubs areknown to provide overhead, protective cover to degus(Ebensperger and Hurtado 2005a), implying that predationrisk would decrease in areas with greater shrub cover(Vásquez et al. 2002). Thirdly, predation risk increases withdistance to the nearest burrow opening in degus (Lagos etal. 2009). Thus, we considered predation risk also todecrease with density of burrow openings per burrowsystem (i.e., abundance of safe havens). Based on theseconsiderations, we conducted between- and within-population comparisons to test five predictions linked tothe predation risk hypothesis (Table 1).
Besides an influence of predators, laboratory studiessuggest that degus reduce their energy expenditure throughhuddling (Canals et al. 1989), supporting the hypothesisthat thermal conditions influence sociality (Madison 1984;Koprowski 1998). This hypothesis predicts that (1) groupsize tracks ambient temperature conditions, with largergroups during cold periods and smaller groups duringwarmer periods, and that (2) larger groups occur inpopulations experiencing colder ambient temperatures thanin populations experiencing warmer ambient temperatures.We used population contrasts to test the latter prediction(Table 1).
Some features of degus suggest that burrows could beanother social driver. Members of social groups share avariable number of burrow systems, which include nestsites for rearing their offspring communally (Ebensperger etal. 2004; Soto-Gamboa 2004), and larger social groups usemore burrow systems than do smaller groups (Hayes et al.2009). Degus, which are diurnally active, use theseunderground burrows to escape and hide from predators(Vásquez et al. 2002; Lagos et al. 2009) and avoid extremethermal conditions (Kenagy et al. 2002). The observationsthat degus experience increased energetic costs of diggingwith increasing soil hardness (Ebensperger and Bozinovic2000a) and coordinate their digging activity support thehypothesis that digging costs contribute to degu sociality(Ebensperger and Bozinovic 2000b). Thus, two predictionslinked to a “nest/refuge building” hypothesis were exam-ined (Table 1).
Food resources are thought to be a major cause ofsociality (e.g., Wrangham 1980; Travis et al. 1995;Brashares and Arcese 2002). Groups may form becauseindividuals congregate near more abundant and higherquality food resources or benefit from cooperative forag-ing in harsh environments (Ebensperger 2001). Althoughdegus occur in a wide range of habitat types with differentfood conditions, no one has examined the potential effectsof food abundance and quality on degu sociality. Thus, we
tested two predictions for the potential impact of foodabundance and quality at burrow systems used by degus(Table 1).
Methods
Study populations
We examined two degu populations located 400 km apart intwo habitats with extreme differences in environmentalconditions: Estación Experimental Rinconada de Maipú(33˚23′S, 70˚31′W, altitude 495 m) (hereafter Rinconada)and at the Bocatoma Los Molles (30˚45′S, 70˚15′W,altitude 2,600 m) (hereafter Los Molles). While both studyareas are characterized by a Mediterranean climate withcold, wet winters and warm, dry summers (di Castri andHajek 1976), the high altitude area at Los Molles providesdegus with a potentially more stressful environment interms of lower ambient temperature than the low altitudearea at Rinconada (Quispe et al. 2009). Given that noempirical data on ambient temperature were available forLos Molles, we used a multiple regression model withlatitude and altitude as predictors (R2=0.74, F=38.2, P<0.001; Houston and Hartley 2003; Houston 2006) andestimated that mean annual temperature for Rinconadaand Los Molles were 14.0°C and 9.4°C, respectively.Mean monthly temperatures recorded 5–10 km north ofRinconada (i.e., the Pudahuel weather station, 33°23′S,70°47′W, 475 m of altitude) indicated a mean annualtemperature of 14.3°C at this site, suggesting that ourmethod of estimation was reasonably accurate. The twopopulations differed in other relevant attributes, includ-ing vegetation. A preliminary study conducted in 2006revealed greater variability in the dry mass of herbs atLos Molles (coefficient of variation, CV=1.30) than atRinconada (CV=0.83), indicating that vegetative forageused by degus is more patchy at the former site. Whilethe suit of known degu predators was similar in bothsites, burrowing owls (Athene cunicularia), the lessergrison (Galictis cuja), and snakes (Phylodryas chamisso-nis) were seen only at Rinconada. In contrast, mountaincaracaras (Phalcoboenus megalopterus) and variablehawks (Buteo polyosoma) were seen exclusively at LosMolles. Overall, predators were more frequently sighted atRinconada than at Los Molles. In addition, shrubbyvegetation near burrows that can be used by degus asrefuge was more abundant at Los Molles, further implyinglower predation risk. The study was conducted in bothpopulations during 2007 and 2008, during the periodwhen females are in late pregnancy or lactating (i.e.,September–October at Rinconada; November–Decemberat Los Molles).
Behav Ecol Sociobiol (2012) 66:261–274 263
Determination of social groups
Degus are diurnally active and remain in underground burrowsovernight (Kenagy et al. 2002; Ebensperger et al. 2004). Thus,the main criterion used to assign degus to social groups wasthe sharing of burrow systems during night time (Ebenspergeret al. 2004). The sharing of burrow systems was establishedby means of (1) night-time telemetry, and (2) burrow trappingin September–October (Rinconada) and in November–December (Los Molles). During burrow trapping, we defineda burrow system as a group of burrow openings surroundinga central location where individuals were repeatedly foundduring night time telemetry and usually spanning 1–3 m indiameter (Fulk 1976; Hayes et al. 2007). The total number ofburrow systems trapped per year at Rinconada was 32 in2007 and 43 in 2008. These burrows were trapped an averageof 31.4±1.2 days in 2007 and 45.3±1.6 days in 2008. Thenumber of traps (model 201 Tomahawk, Tomahawk LiveTrap Company, Tomahawk, Wisconsin, USA) used per day ateach burrow system averaged 9.7±0.2 traps in 2007 and 8.0±0.0 traps in 2008. The total number of burrow systemstrapped per year at Los Molles was 7 in 2007 and 8 in 2008.These burrows were trapped for 30 days in 2007, and 21 daysin 2008. The number of traps used per day at each burrowsystem averaged 17.1±3.5 traps in 2007 and 19.5±0.3 trapsin 2008. The total area examined in Rinconada during 2007and 2008 reached 0.61 and 2.16 ha, respectively. The areaexamined at Los Molles reached 0.92 ha in 2007 and 1.10 hain 2008. Population differences linked to number of burrowsystems examined, number of animals radio-collared, andsocial groups examined reflected major differences in overallabundance of degus.
In both populations, traps were set prior to theemergence of adults during morning hours (06:00 h). After1.5 h, traps were checked and closed until the next trappingevent. We determined the identity, location, sex, body mass(to 0.1 g), and reproductive condition (whether a femalehad a perforated vagina, was pregnant, or lactating) of alldegus. Adults weighing greater than 170 g were fitted with8 g (BR radio-collars, AVM Instrument Co., Colfax,California, USA) or 7–9 g radio-transmitters (RI-2D,Holohil Systems Limited, Carp, Ontario, Canada andSOM-2190A, Wildlife Materials Incorporated, Murphys-boro, Illinois, USA) with unique pulse frequencies.
During night-time telemetry, females were radio-trackedto their burrows. Previous studies at Rinconada confirmedthat night time locations represent nest sites where degusremain underground (Ebensperger et al. 2004). Locationswere determined once per night approximately 1 h aftersunset using an LA 12-Q receiver (for radio collars tuned to150.000–151.999 MHz frequency; AVM Instrument Co.,USA) and a hand held, 3-element Yagi antenna (AVMinstrument Co.). Ultimately, there were n=34 and n=21
radio-collared individuals from Rinconada with sufficientdata to assign group membership in 2007 and 2008,respectively. Animals from Rinconada were located onaverage 18.3±4.2 nights per individual in 2007 and 16.0±0.9 nights per individual in 2008. At Los Molles, there weren=14 radio-collared individuals with sufficient data toassign group membership in both years. Degus from LosMolles were located 20.8±0.5 nights per individual in 2007and 14.6±0.4 nights per individual in 2008. This effort hasbeen shown to be sufficient in determining group member-ship (Hayes et al. 2009).
The determination of group composition required thecompilation of a symmetric similarity matrix of pairwiseassociation of the burrow locations of all adult degus duringtrapping and telemetry (see Whitehead 2008). We deter-mined the association (overlap) between any two individ-uals by dividing the number of evenings that theseindividuals were captured at or tracked with telemetry tothe same burrow system by the number of evenings thatboth individuals were trapped or tracked with telemetry onthe same day (Ebensperger et al. 2004). To determine socialgroup composition, we conducted a hierarchical clusteranalysis of the association matrix in SOCPROG software(Whitehead 2009). We confirmed the fit of data with thecophenetic correlation coefficient, a correlation between theactual association indices and the levels of clustering in thediagram. Under this procedure, values above 0.8 indicatethat hierarchical cluster analysis has provided an effectiverepresentation of the data (Whitehead 2008). We chosemaximum modularity criteria (Newman 2004) to cut off thedendrogram and define social groups.
Ecological variables
To examine the influence of ecological conditions onsociality, we used both between- and within-populationcomparisons. Ecological conditions included predation risk,abundance, and quality of food resources and soil hardness.
Given that natural predation on small mammals isdifficult to measure, we quantified predation risk indirectly.At each population, we conducted scan sampling fromfixed vantage points (two per population) located 50–100 mfrom where degus were active to record sightings ofpredators known to prey on degus. Every 30 min, the sameobserver recorded every predator observed over the entirearea during a 20-min circular sweep. Observations wereconducted during morning (07:30 to 12:00 h) and afternoonhours (17:00–19:30 h), i.e., when degus were observedaboveground. A total of 40 scan samplings were conductedat Rinconada during 2007 and 2008. The number of scansamplings conducted at Los Molles during 2007 and 2008was 20 and 36, respectively. Data were standardized topredator sightings per hour.
264 Behav Ecol Sociobiol (2012) 66:261–274
Predation risk was also estimated based on the density ofburrow openings and distance of burrow systems to thenearest shrub (Rinconada, 33 in 2008, 38 in 2008; LosMolles, 9 each year). Density of burrow openings (numberper square meter) at each burrow system was determined byquantifying the number of burrow openings in the circulararea encompassing a 9-m radius from the center of burrowsystems. The distance (meter) to nearest tree or shrub(cover) was estimated for each burrow system with a 100-mmeasuring tape.
To track changes in the abundance of primary food(Quirici et al. 2010), we collected samples of green herbs at3 and 9 m from the center of each burrow system. Inparticular, we randomly chose one location at 3 m and 1 at9 m in the north, east, south, or west directions. At each ofthese two sampling points, we placed a 250×250-mmquadrant and removed the aboveground parts of all greenherbs found. Samples were immediately stored inside 2 kgcapacity paper bags. In the laboratory, we oven-dried eachplant sample at 60°C for 72 h to determine its dry mass(biomass in grams) (Ebensperger and Hurtado 2005b). Datafrom 3 to 9 m sampling points were averaged per burrowsystem and standardized to gram per square meter forsubsequent analysis (sample sizes described as above). Weused the same sample pattern to record soil penetrability asan index of soil hardness (Lacey and Wieczorek 2003). Soilpenetrability was recorded with the use of a hand-held soilcompaction meter (Lang Penetrometer Inc., Gulf Shores,AL, USA).
To compare quality of primary foods, we collectedsamples of green herbaceous vegetation (within 250×250 mm quadrants) at random points throughout the studyarea where degus were regularly seen foraging. Twoindicators of food quality, insoluble and soluble fibercontent, were determined by standard chemical analysis atthe Instituto de Nutrición y Tecnología de los Alimentos(Universidad de Chile, Santiago, Chile). Dietary fiberrepresents a barrier to the extraction of soluble nutrientsfrom cells and is difficult to digest by non-ruminants (VanSoest 1982). Lab studies revealed that degus minimize fiberintake when given a choice of high-fiber and low-fiberfoods supporting the hypothesis that dietary fiber is not apreferred dietary component (Veloso and Bozinovic 1993;Bozinovic 1995). The total number of plant samplesexamined at Rinconada was 4 and 6 during 2007 and2008, respectively. These numbers were 6 and 7, respec-tively, at Los Molles.
Degu abundance
We used data from burrow trapping to calculate theabundance of degus with a closed population withheterogeneity in captures model (Keesing 1998; Ribble
and Stanley 1998; Cooch and White 2008; Moorhouse andMacdonald 2008), a method that controls for differences inthe trappability of individuals in the population. Given thatthe model used rests on the assumption of closedpopulation (no emigration, immigration, death or birth),we restricted this analysis to the first 11 days of eachburrow trapping session at each population and year ofstudy. These analyses were performed using the MARKsoftware, release 5.1 (White and Burnham 1999).
Statistical analysis
Throughout the analysis, social groups determined at eachpopulation each year were used as independent replicates.The assumption of temporal independence of these repli-cates is valid in degus since annual turnover of adultmembers within groups is extremely high (Ebensperger etal. 2009). We verified the assumptions of normal distribu-tion and homogeneity of variance with the use of Shapiro-Wilks and Cochran tests, respectively.
To examine the effects of population and year of studyon sociality measures (total group size, number of femalesper group, number of males per group) we first tested fourpossible ANOVA models on each measure: (1) populationby year interactive model, (2) population and year maineffects model, (3) population only model, and (4) year onlymodel. The best fit model was determined based on AkaikeInformation Criterion (AIC) (Akaike 1974). In particular,the model selected had the lowest AIC value, delta AIC<2,Akaike weight approaching 0.90 or higher, and evidenceratios close to 1 (Burnham and Anderson 2002; Symondsand Moussalli 2011; for a complete treatment of modelselection, see Anderson 2008). We then took the best fitmodel in each case and reported main and/or interactiveeffects. We used the same approach to examine populationand year of study variation in ecological conditions. Inthese analyses, the number of females per social group,abundance of food and density of burrow openings weresquared root transformed. In contrast, the number of malesper social group, predator sightings, and soil hardness couldnot be normalized.
Within each population and year, we used multipleregressions to determine the extent to which ecologicalmeasures (square root transformed density of burrowopenings, distance to the nearest shrub, square root trans-formed abundance of food) predicted total group size andnumber of females per social. Associations between soilhardness and other ecological measures (density of burrowopenings, distance from burrows to the nearest shrub,abundance of food) and the number of males per socialgroup within sites were examined with bivariate, Spearmanrank correlations. Soil hardness and the number of malesper social group could not be normalized.
Behav Ecol Sociobiol (2012) 66:261–274 265
We followed Nakagawa and Foster (2004) in reportingthe size of statistical effects and P values, instead ofreporting post hoc (retrospective) power analysis. Weconsidered equation 1 in Levine and Hullett (2002) toreport eta-squared values (η2) as estimates of size effects.Data are provided as means±SE. Population and eareffects on sociality and ecological variables were con-ducted using the R 2.4.1 software (R Development CoreTeam 2006). Within population and year of study,analyses were conducted using Statistica 9.0 (StatSoftInc., Tulsa, Oklahoma, USA).
Results
Abundance of degus
During both years, the abundance of degus was greater atRinconada than in Los Molles. In 2007, there were 57±12and 24±4 adults at Rinconada and Los Molles, respectively.In 2008, there were 61±9 and 33±1 adults at Rinconadaand Los Molles, respectively.
Social groups examined
At Rinconada, we monitored 42 females and 14 males, and30 females and 6 males during 2007 and 2008, respectively.We were able to identify a total of 8 social groups in 2007and 9 groups in 2008. At Los Molles, we monitored 13
females and 2 males, and 26 females and 6 males in 2007and 2008, respectively. These animals allowed us toidentify a total of four social groups in 2007 and six groupsin 2008. Across populations and years, social groups werecomposed of 4.1±0.4 females and 1.0±0.2 males. Socialgroups at Rinconada included 4.2±0.5 females and 1.2±0.2males. At Los Molles, social groups included 3.9±0.6females and 0.8±0.3 males.
Population and year of study variation in sociality
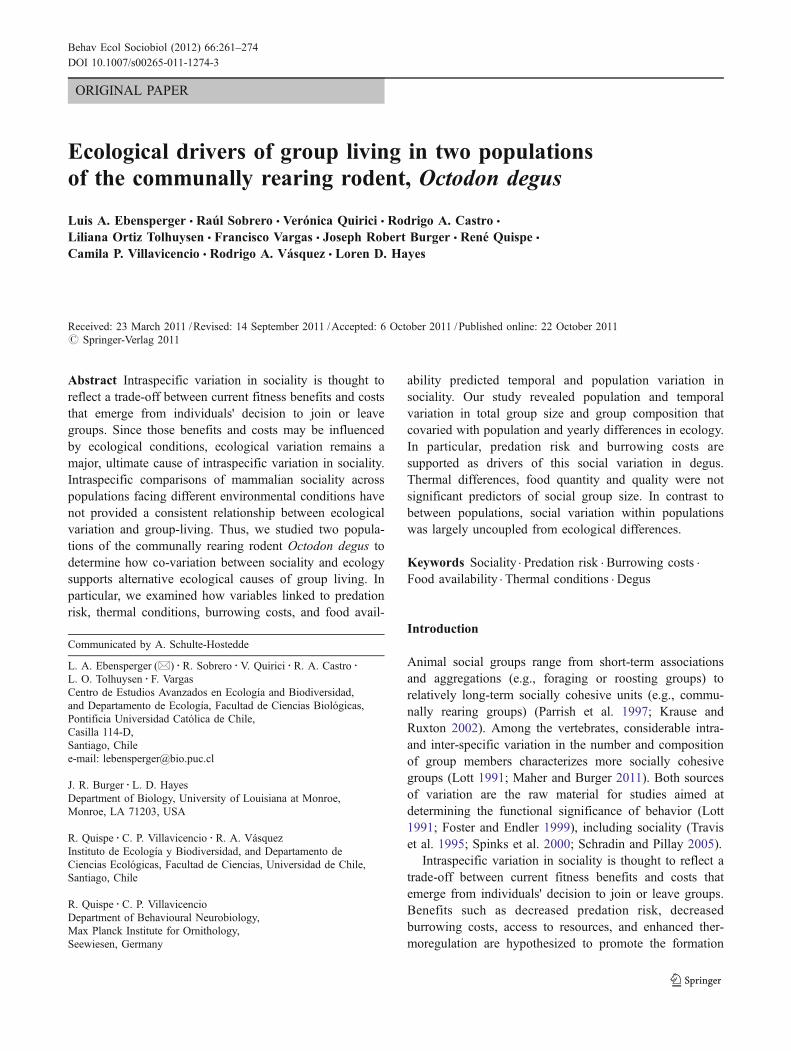
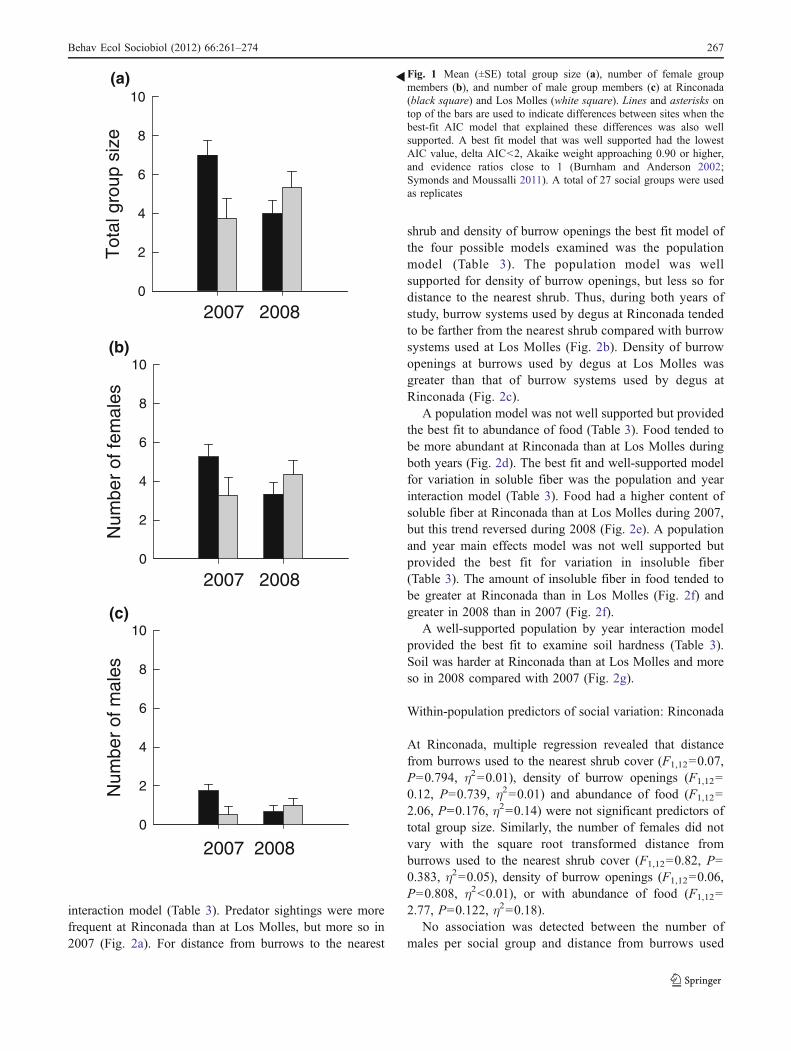
For total group size, number of females and number ofmales the best fit model of the four possible modelsexamined with AIC criteria was the population and yearinteraction model (Table 2). The population and yearinteraction model was well supported for total group size,but less so for the number of females and males. Thus,groups at Rinconada were larger than those from LosMolles in 2007 but not in 2008 (Fig. 1a). The number ofadult females per group tended to be larger at Rinconadathan at Los Molles during 2007 but not in 2008 (Fig. 1b).Similarly, groups at Rinconada tended to have more malesthan social groups at Los Molles during 2007 but notduring 2008 (Fig. 1c).
Population and year of study ecological differences
The best fit and well-supported model for variation in thenumber of predators sighted was the population by year
Table 2 AIC values of the four possible best-fit models explaining between-site differences in total group size, number of females per group, andnumber of males per group
Variable examined and model Number of parameters AIC Delta AIC AIC weight Evidence ratio
Total group size
Population×year 3 121.45 0.00 0.81 1.00
Population+year 2 127.11 5.66 0.05 0.06
Population 1 127.48 6.03 0.04 0.05
Year 1 125.60 4.15 0.12 0.13
Number of females
Population×year 3 115.12 0.00 0.40 1.00
Population+year 2 117.54 2.42 0.12 0.30
Population 1 116.86 1.74 0.17 0.42
Year 1 115.68 0.56 0.31 0.76
Number of males
Population×year 3 76.41 0.00 0.56 1.00
Population+year 2 79.51 3.10 0.12 0.21
Population 1 79.52 3.11 0.12 0.21
Year 1 78.37 1.96 0.21 0.38
Italicized values indicate the best-fit and well supported model for each variable. Values in bold indicate the best-fit yet not well supported modelfor each variable. A best fit model that was well supported had the lowest AIC value, delta AIC<2, Akaike weight approaching 0.90 or higher,and evidence ratios close to 1 (Burnham and Anderson 2002; Symonds and Moussalli 2011)
266 Behav Ecol Sociobiol (2012) 66:261–274
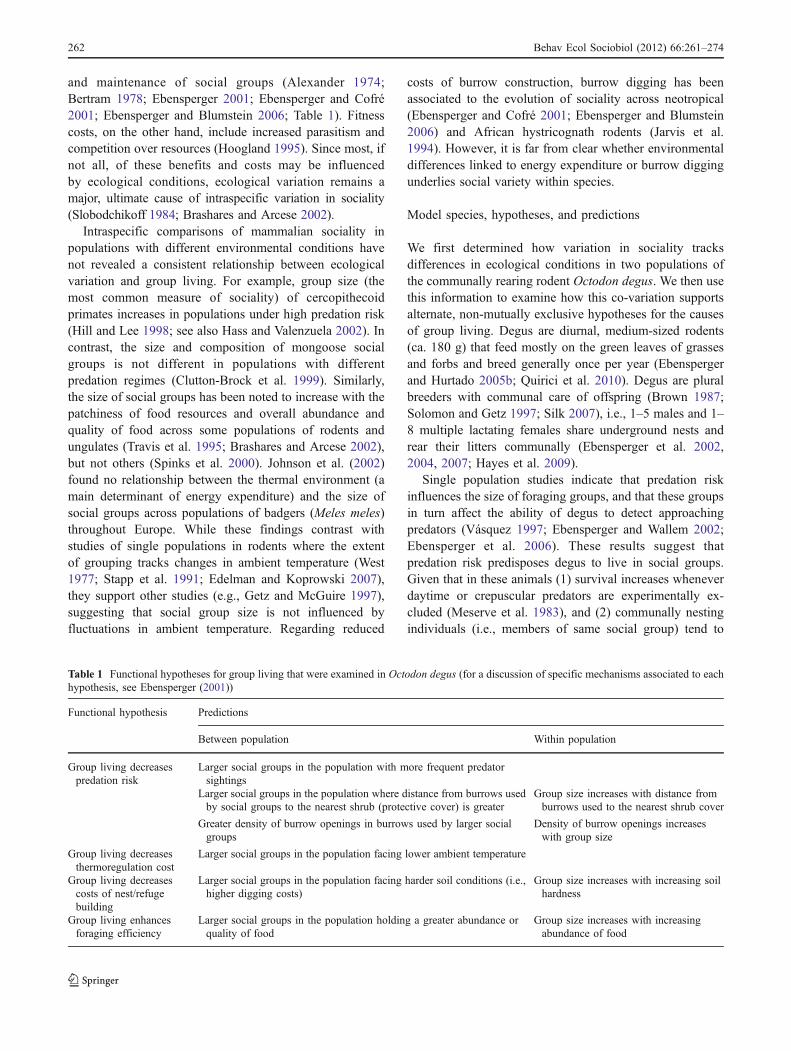
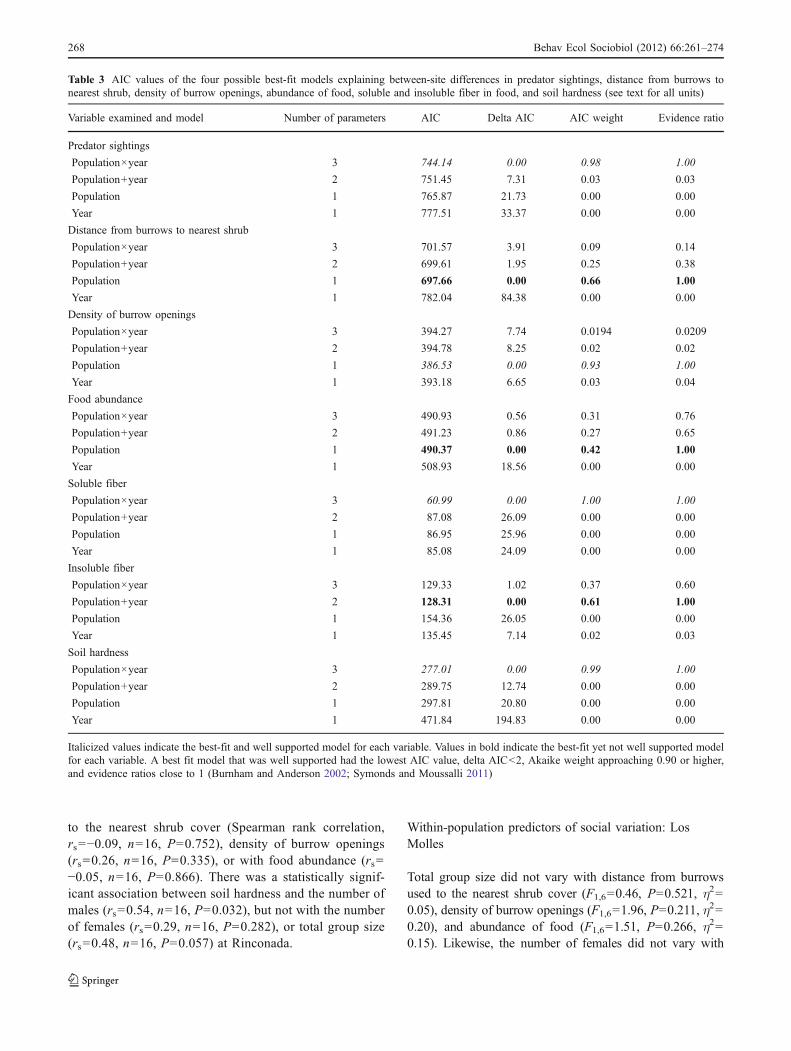
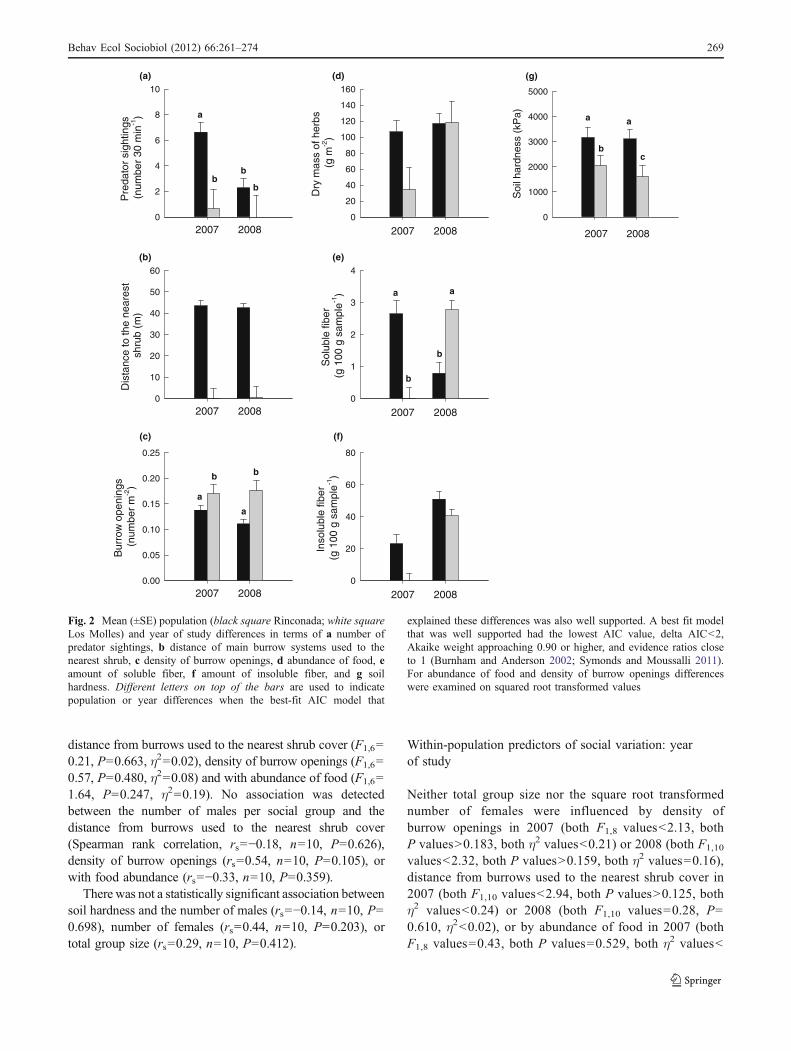
interaction model (Table 3). Predator sightings were morefrequent at Rinconada than at Los Molles, but more so in2007 (Fig. 2a). For distance from burrows to the nearest
shrub and density of burrow openings the best fit model ofthe four possible models examined was the populationmodel (Table 3). The population model was wellsupported for density of burrow openings, but less so fordistance to the nearest shrub. Thus, during both years ofstudy, burrow systems used by degus at Rinconada tendedto be farther from the nearest shrub compared with burrowsystems used at Los Molles (Fig. 2b). Density of burrowopenings at burrows used by degus at Los Molles wasgreater than that of burrow systems used by degus atRinconada (Fig. 2c).
A population model was not well supported but providedthe best fit to abundance of food (Table 3). Food tended tobe more abundant at Rinconada than at Los Molles duringboth years (Fig. 2d). The best fit and well-supported modelfor variation in soluble fiber was the population and yearinteraction model (Table 3). Food had a higher content ofsoluble fiber at Rinconada than at Los Molles during 2007,but this trend reversed during 2008 (Fig. 2e). A populationand year main effects model was not well supported butprovided the best fit for variation in insoluble fiber(Table 3). The amount of insoluble fiber in food tended tobe greater at Rinconada than in Los Molles (Fig. 2f) andgreater in 2008 than in 2007 (Fig. 2f).
A well-supported population by year interaction modelprovided the best fit to examine soil hardness (Table 3).Soil was harder at Rinconada than at Los Molles and moreso in 2008 compared with 2007 (Fig. 2g).
Within-population predictors of social variation: Rinconada
At Rinconada, multiple regression revealed that distancefrom burrows used to the nearest shrub cover (F1,12=0.07,P=0.794, η2=0.01), density of burrow openings (F1,12=0.12, P=0.739, η2=0.01) and abundance of food (F1,12=2.06, P=0.176, η2=0.14) were not significant predictors oftotal group size. Similarly, the number of females did notvary with the square root transformed distance fromburrows used to the nearest shrub cover (F1,12=0.82, P=0.383, η2=0.05), density of burrow openings (F1,12=0.06,P=0.808, η2<0.01), or with abundance of food (F1,12=2.77, P=0.122, η2=0.18).
No association was detected between the number ofmales per social group and distance from burrows used
(a)
2007 2008
Tot
al g
roup
siz
e
0
2
4
6
8
10
(b)
2007 2008
Num
ber
of fe
mal
es
0
2
4
6
8
10
(c)
2007 2008
Num
ber
of m
ales
0
2
4
6
8
10
�Fig. 1 Mean (±SE) total group size (a), number of female groupmembers (b), and number of male group members (c) at Rinconada(black square) and Los Molles (white square). Lines and asterisks ontop of the bars are used to indicate differences between sites when thebest-fit AIC model that explained these differences was also wellsupported. A best fit model that was well supported had the lowestAIC value, delta AIC<2, Akaike weight approaching 0.90 or higher,and evidence ratios close to 1 (Burnham and Anderson 2002;Symonds and Moussalli 2011). A total of 27 social groups were usedas replicates
Behav Ecol Sociobiol (2012) 66:261–274 267
to the nearest shrub cover (Spearman rank correlation,rs=−0.09, n=16, P=0.752), density of burrow openings(rs=0.26, n=16, P=0.335), or with food abundance (rs=−0.05, n=16, P=0.866). There was a statistically signif-icant association between soil hardness and the number ofmales (rs=0.54, n=16, P=0.032), but not with the numberof females (rs=0.29, n=16, P=0.282), or total group size(rs=0.48, n=16, P=0.057) at Rinconada.
Within-population predictors of social variation: LosMolles
Total group size did not vary with distance from burrowsused to the nearest shrub cover (F1,6=0.46, P=0.521, η
2=0.05), density of burrow openings (F1,6=1.96, P=0.211, η
2=0.20), and abundance of food (F1,6=1.51, P=0.266, η2=0.15). Likewise, the number of females did not vary with
Table 3 AIC values of the four possible best-fit models explaining between-site differences in predator sightings, distance from burrows tonearest shrub, density of burrow openings, abundance of food, soluble and insoluble fiber in food, and soil hardness (see text for all units)
Variable examined and model Number of parameters AIC Delta AIC AIC weight Evidence ratio
Predator sightings
Population×year 3 744.14 0.00 0.98 1.00
Population+year 2 751.45 7.31 0.03 0.03
Population 1 765.87 21.73 0.00 0.00
Year 1 777.51 33.37 0.00 0.00
Distance from burrows to nearest shrub
Population×year 3 701.57 3.91 0.09 0.14
Population+year 2 699.61 1.95 0.25 0.38
Population 1 697.66 0.00 0.66 1.00
Year 1 782.04 84.38 0.00 0.00
Density of burrow openings
Population×year 3 394.27 7.74 0.0194 0.0209
Population+year 2 394.78 8.25 0.02 0.02
Population 1 386.53 0.00 0.93 1.00
Year 1 393.18 6.65 0.03 0.04
Food abundance
Population×year 3 490.93 0.56 0.31 0.76
Population+year 2 491.23 0.86 0.27 0.65
Population 1 490.37 0.00 0.42 1.00
Year 1 508.93 18.56 0.00 0.00
Soluble fiber
Population×year 3 60.99 0.00 1.00 1.00
Population+year 2 87.08 26.09 0.00 0.00
Population 1 86.95 25.96 0.00 0.00
Year 1 85.08 24.09 0.00 0.00
Insoluble fiber
Population×year 3 129.33 1.02 0.37 0.60
Population+year 2 128.31 0.00 0.61 1.00
Population 1 154.36 26.05 0.00 0.00
Year 1 135.45 7.14 0.02 0.03
Soil hardness
Population×year 3 277.01 0.00 0.99 1.00
Population+year 2 289.75 12.74 0.00 0.00
Population 1 297.81 20.80 0.00 0.00
Year 1 471.84 194.83 0.00 0.00
Italicized values indicate the best-fit and well supported model for each variable. Values in bold indicate the best-fit yet not well supported modelfor each variable. A best fit model that was well supported had the lowest AIC value, delta AIC<2, Akaike weight approaching 0.90 or higher,and evidence ratios close to 1 (Burnham and Anderson 2002; Symonds and Moussalli 2011)
268 Behav Ecol Sociobiol (2012) 66:261–274
distance from burrows used to the nearest shrub cover (F1,6=0.21, P=0.663, η2=0.02), density of burrow openings (F1,6=0.57, P=0.480, η2=0.08) and with abundance of food (F1,6=1.64, P=0.247, η2=0.19). No association was detectedbetween the number of males per social group and thedistance from burrows used to the nearest shrub cover(Spearman rank correlation, rs=−0.18, n=10, P=0.626),density of burrow openings (rs=0.54, n=10, P=0.105), orwith food abundance (rs=−0.33, n=10, P=0.359).
There was not a statistically significant association betweensoil hardness and the number of males (rs=−0.14, n=10, P=0.698), number of females (rs=0.44, n=10, P=0.203), ortotal group size (rs=0.29, n=10, P=0.412).
Within-population predictors of social variation: yearof study
Neither total group size nor the square root transformednumber of females were influenced by density ofburrow openings in 2007 (both F1,8 values<2.13, bothP values>0.183, both η2 values<0.21) or 2008 (both F1,10
values<2.32, both P values>0.159, both η2 values=0.16),distance from burrows used to the nearest shrub cover in2007 (both F1,10 values<2.94, both P values>0.125, bothη2 values<0.24) or 2008 (both F1,10 values=0.28, P=0.610, η2<0.02), or by abundance of food in 2007 (bothF1,8 values=0.43, both P values=0.529, both η2 values<
(b)
2007 2008
Dis
tanc
e to
the
near
est
shru
b (m
)
0
10
20
30
40
50
60
(d)
2007 2008
Dry
mas
s of
her
bs
(g m
-2)
0
20
40
60
80
100
120
140
160
(a)
2007 2008
Pre
dato
r si
ghtin
gs
(num
ber
30 m
in-1
)
0
2
4
6
8
10
a
bb
b
(c)
2007 2008
Bur
row
ope
ning
s (n
umbe
r m
-2)
0.00
0.05
0.10
0.15
0.20
0.25
a
a
b b
(e)
2007 2008
Sol
uble
fibe
r (g
100
g s
ampl
e-1)
0
1
2
3
4
a a
b
b
(f)
2007 2008
Inso
lubl
e fib
er
(g 1
00 g
sam
ple-1
)
0
20
40
60
80
(g)
2007 2008
Soi
l har
dnes
s (k
Pa)
0
1000
2000
3000
4000
5000
a a
bc
Fig. 2 Mean (±SE) population (black square Rinconada; white squareLos Molles) and year of study differences in terms of a number ofpredator sightings, b distance of main burrow systems used to thenearest shrub, c density of burrow openings, d abundance of food, eamount of soluble fiber, f amount of insoluble fiber, and g soilhardness. Different letters on top of the bars are used to indicatepopulation or year differences when the best-fit AIC model that
explained these differences was also well supported. A best fit modelthat was well supported had the lowest AIC value, delta AIC<2,Akaike weight approaching 0.90 or higher, and evidence ratios closeto 1 (Burnham and Anderson 2002; Symonds and Moussalli 2011).For abundance of food and density of burrow openings differenceswere examined on squared root transformed values
Behav Ecol Sociobiol (2012) 66:261–274 269

0.03) or 2008 (both F1,10 values<2.22, both P values<0.167, both η2 values<0.15).
The number of males increased with soil hardness in2007 (rs=0.81, n=12, P=0.001), but not in 2008 (rs=−0.19, n=14, P=0.505). There were no statisticallysignificant associations between soil hardness and totalgroup size (rs=0.45, n=12, P=0.143) or the number offemales (rs=0.17, n=12, P=0.600) in 2007. Likewise, norelationships were found between soil hardness and totalgroup size (rs=−0.14, n=14, P=0.633), or the number offemales (rs=−0.04, n=14, P=0.901) in 2008.
Discussion
General findings
Our study revealed population and temporal variation intotal group size and possibly, on the number of males persocial group in degus. These population and yearly differ-ences covaried with population and yearly differences inpredation risk and soil hardness. While the size andcomposition of social groups was variable within popula-tion and year of study, we found little evidence ofcovariation between ecology and degu sociality at thisscale. The only ecological variable to influence group sizewithin populations was soil hardness, which was linked tothe number of males per group during 1 year of the studyand in only one population (Rinconada).
Sociality and predation risk
Abundant evidence from single population studies onvertebrates and invertebrates generally supports that indi-viduals in groups experience decreased predation risk bymeans of several mechanisms (Ebensperger 2001; Krauseand Ruxton 2002; Ebensperger and Blumstein 2006).Together, this evidence suggests that decreasing predationrisk is one major factor that maintains group living in somespecies. Our study revealed that both total group size andpossibly the number of males per social group were largerat Rinconada compared to Los Molles in 2007 but not in2008. Qualitatively, this population by year interactionmirrored variation in predation risk. The observation that(1) predators were more frequently sighted (in 2007), (2)burrow systems of social groups tended to be far fromoverhead cover, and (3) there was a lower density ofopenings at Rinconada indicated that this site represented ariskier habitat to degus compared with Los Molles. We notethat population and year of study variation in socialityseemed less fine tuned to population and year differences indistance from burrow systems to the nearest shrub coverand density of burrow openings than to the frequency of
predators sighted. However, yearly variation in socialgroups might be expected to reflect relatively short-termvariation in response to predators per se. The temporal scaleto which burrow density and distance to the nearest shrubcover varies is probably longer compared with fluctuationsin predator abundance. Both burrow construction (orexpansion) and reproduction and growth of native shrubstakes years (Ebensperger and Hurtado 2005b).
While long-term data sets are needed to examine other,long-term adjustments in degu social groups, previousevidence further supports a role for predators influencingdegu sociality. Degus forage in larger groups when in moreexposed patches (without overhead cover), and largergroups are more efficient in detecting an approachingpredator (Ebensperger and Wallem 2002; Vásquez et al.2002; Ebensperger et al. 2006). Regarding a broadercontext, variation in sociality observed in this study is alsoconsistent with predation playing a role during theevolution of sociality across neotropical caviomorphs(Ebensperger and Blumstein 2006) and other mammals(Hill and Lee 1998; Brashares et al. 2000; Gygax 2002;Caro et al. 2004).
We cannot completely rule out that predators trackeddegu abundance. The greater frequency of predator sight-ings at Rinconada may have resulted from predatorsvisiting more areas with more abundant prey. Larger socialgroups at Rinconada could in turn be the result of higherdegu abundance, as has been reported in numerousvertebrates, including social rodents (e.g., Wolff 1994;Lucia et al. 2008). However, several observations suggestthat degu sociality is not density dependent. First, whiledegu abundance was similarly high in 2008 compared with2007 at Rinconada, the number of predators sightedincreased 2.9 times in the area, implying that more frequentpredator visits were not simply the direct consequence ofmore abundant degu prey. Secondly, there is no evidence sofar that density influences the size and composition of degusocial groups in Rinconada (Ebensperger et al. 2011).Finally, degu groups form not only as a result of delayeddispersal of offspring and adult fidelity, but also as theconsequence of offspring dispersal and immigration ofadults (Ebensperger et al. 2009) resulting in groups thatlack kin structure (Quirici et al. 2011). These observationsare in contrast to the expected mechanisms of groupformation (delayed dispersal) and group composition(extended families) expected when groups form as a resultof high population density (Emlen 1995; Ebensperger andHayes 2008).
Sociality and social thermoregulation
Degus at Los Molles faced generally cooler thermalconditions compared with degus at Rinconada, implying
270 Behav Ecol Sociobiol (2012) 66:261–274
that individuals were subjected to greater maintenance costsat Los Molles. Our observation that social groups werelarger at Rinconada than Los Molles suggests that socialgroup formation and maintenance is not driven by socialthermoregulation. These findings depart from studies ofsingle populations or comparisons of multiple populationsin mammals (mostly rodents) where the extent of groupingtracks changes in ambient temperature (West 1977; Madison1984; Stapp et al. 1991; Edelman and Koprowski 2007;Taraborelli and Moreno 2009). However, our results are inagreement with studies on voles (Getz and McGuire 1997)and badgers (Johnson et al. 2002) in which group size isuncoupled from ambient temperatures. Understanding whysome social mammals respond differently to ambienttemperature conditions will be crucial to predicting howmajor environmental perturbations such as climate changewill affect social species.
Sociality and nest/refuge building
Group living has been linked to life in long-lasting,expandable nests (Alexander 1991). Since constructingand maintaining these structures, including burrows, isenergetically costly (Lovegrove 1989; Ebensperger andBozinovic 2000a), animals may be forced to live in groupsto share their use or minimize such energetic cost (Arnold1990; Powell and Fried 1992). Indeed, active burrowdigging has been linked to the evolution of group-livingof New World histricognath rodents (Ebensperger andCofré 2001; Ebensperger and Blumstein 2006). Evidenceof a functional connection between group-living and nest/refuge construction in degus remains equivocal. On the onehand, our observations that soil was harder and groups werelarger at Rinconada than Los Molles are consistent with thishypothesis. These findings add to previous studies in whichdegus in groups coordinate their digging and remove moresoil per capita than solitary degus (Ebensperger andBozinovic 2000b). In contrast, within-population analysesdid not lend strong support to a functional connectionbetween group-living and nest/refuge construction. Soilhardness was not correlated with the number of females andtotal group size in both populations. There was only a weaklink between soil hardness and the number of males pergroup. In degus, care provided by males has no immediatefitness effects to offspring (Ebensperger et al. 2010). Ourresults suggest the possibility that males play a moreimportant role in the maintenance of burrows, a hypothesisworthy of further testing.
Sociality and food resources
Feeding habits may predispose some organisms to adoptsocial life (Rolland et al. 1998; Beauchamp 2002) through
several mechanisms (Ebensperger 2001; Krause and Ruxton2002), most of which predict the size of social groups toincrease with increasing abundance, quality and patchinessof food resources (Wrangham 1980; Travis et al. 1995;Brashares and Arcese 2002; Verdolin 2007). While groupswere larger at Rinconada, the possibility that preferred foodstracked this social trend and were more abundant atRinconada than at Los Molles was not well supported.These results provide weak (if any) support to a link betweenfood abundance and sociality in degus. Likewise, ourobservation that the content of soluble fiber was greater atRinconada during 2007 but not 2008 and the content ofinsoluble fiber was higher at Rinconada during both years,did not lend complete support to this possibility. Similarly tofood quality, patchiness of food does not seem to be acontributing factor either. Based on 16 randomly sampledquadrants (250×250 mm) at Los Molles and 36 quadrants atRinconada in 2006, we noted that variation (CV) of preferredfood resources was higher at Los Molles than at Rinconada(Ebensperger and Hayes, unpublished results). This pattern isthe opposite of that expected if sociality results fromfood patchiness (Travis et al. 1995). Taken together, ourdata provide negligible support to variation in foodconditions as drivers of variation in degu social groupsbetween populations.
Within-population variation in ecology
In contrast to between-populations variation, within-population variation in ecology scarcely predicted anyvariation in the size or composition of degu social groups.The generally small effect sizes detected, coupled with non-statistically significant comparisons suggests a general lackof ecologically meaningful differences instead of a lack ofstatistical power to detect such effects. More generally,however, these data suggest that social variation in degus isuncoupled from ecological differences when quantifiedwithin local populations.
Concluding remarks
Our study revealed (1) moderate between- and within-population variation in the size and composition of degusocial groups and (2) extensive between- and moderatewithin-population variation in ecological conditions. Vari-ation in ecology between populations supported thehypotheses that predation risk, food abundance, and thecosts of burrow digging, but not thermal conditions andfood quality, are drivers of social variation in degus.Within-population variation in ecology supported in partonly one hypothesis—costs of nest/refuge building—andthus, was a not a strong predictor of variation in degusociality. Overall, the between- and within-population
Behav Ecol Sociobiol (2012) 66:261–274 271

comparisons of this study provided a test of multiplehypotheses for the ecological causes of degu sociality.However, comparisons of more populations and acrossmore years are needed to determine the impact ofintraspecific variation in ecology and that of periodic(interannual) disturbances (e.g., El Nino) on degusociality. As suggested previously (Ebensperger 2001),these future studies need to consider that no single factorseems responsible for driving sociality in present daypopulations.
Acknowledgements We are indebted to the Universidad de Chile,particularly to J. D. García (former) and to M. Orellana Reyes(current) Field Station Administrators, for providing the facilitiesduring field work at Estación Experimental Rinconada de Maipú.Likewise, we appreciate ENDESA-Chile (especially to W. Araya) thatallowed us access and facilities to conduct field work at Los Molleshydroelectrical power plant. Climatic data were gathered from theDirección Meteorológica de Chile. We thank R. Pozo, G. Soto, and D.Medina for field assistance and C. Latorre for helping to estimatethermal conditions at our study sites. Two anonymous reviewersprovided useful insights on a previous version of this article. Fundingwas provided by FONDECYT grant #1060499 to LAE by NationalScience Foundation grants #0553910 and #0853719 and LouisianaBoard of Regents Research and Development grant (LEQSF 2007-09-RD-A-39) to LDH and by the Institute of Ecology and Biodiversity(grants ICM-P05-002, and PBF-23-CONICYT-Chile) to RAV. Otherfunding sources were the Program 1 of Centro de Estudios Avanzadosen Ecología and Biodiversidad (FONDAP 1501–001), the AmericanSociety of Mammalogists, and Sigma Xi. RS was funded by ascholarship from CONICYT (Chilean Government). This study wasapproved by the ULM Institutional Animal Use and Care Committeeand adhered to U.S. and Chilean laws (permit 1-58/2005 [2711] by theServicio Agrícola y Ganadero, Chile.
References
Akaike H (1974) A new look at the statistical model identification.IEEE T Automat Contr 19:716–723
Alexander RD (1974) The evolution of social behavior. Annu RevEcol Syst 5:325–383
Alexander RD (1991) Some unanswered questions about naked mole-rats. In: Sherman PW, Jarvis JUM, Alexander RD (eds) Thebiology of the naked mole-rat. Princeton, Princeton UniversityPress, pp 446–465
Anderson DR (2008) Model based inference in the life sciences: aprimer on evidence. Springer, USA
Arnold W (1990) The evolution of marmot sociality: I. Why disperselate? Behav Ecol Sociobiol 27:229–237
Beauchamp G (2002) Higher-level evolution of intraspecific flock-feeding in birds. Behav Ecol Sociobiol 51:480–487
Bertram BCR (1978) Living in groups: predators and prey. In:Krebs JR, Davies NB (eds) Behavioural ecology: andevolutionary approach. Blackwell Scientific Publications,Oxford, pp 64–96
Bozinovic F (1995) Nutritional energetics and digestive responses ofan herbivorous rodent (Octodon degus) to different levels ofdietary fiber. J Mammal 76:627–637
Brashares JS, Arcese P (2002) Role of forage, habitat and predation inthe behavioral plasticity of a small African antelope. J Anim Ecol71:626–638
Brashares JS, Garland T Jr, Arcese P (2000) Phylogenetic analysis ofcoadaptation in behavior, diet, and body size in the Africanantelope. Behav Ecol 11:452–463
Brown JL (1987) Helping and communal breeding in birds: ecologyand evolution. Princeton University Press, USA
Burnham KP, Anderson DR (2002) Model selection and multimodelinference, 2nd edn. Springer, New York
Canals M, Rosenmann M, Bozinovic F (1989) Energetics andgeometry of huddling in small mammals. J Theor Biol141:181–189
Caro TM, Graham CM, Stoner CJ, Vargas JK (2004) Adaptivesignificance of antipredator behaviour in artiodactyls. AnimBehav 67:205–228
Clutton-Brock TH, Gaynor D, McIlrath GM, Maccoll AD, Kansky R,Chadwick P, Manser M, Skinner JD, Brotherton PNM (1999)Predation, group size and mortality in a cooperative mongoose,Suricata suricatta. J Anim Ecol 68:672–683
Cooch E, White G (2008) Program Mark: a gentle introduction.Seventh edition. http://www.phidot.org/software/mark/index.html
di Castri F, Hajek E (1976) Bioclimatología de Chile. PontificiaUniversidad Católica de Chile, Santiago
Ebensperger LA (2001) A review of the evolutionary causes of rodentgroup-living. Acta Theriol 46:115–144
Ebensperger LA, Blumstein DT (2006) Sociality in New Worldhystricognath rodents is linked to predators and burrow digging.Behav Ecol 17:410–418
Ebensperger LA, Bozinovic F (2000a) Energetics and burrowingbehaviour in the semifossorial degu, Octodon degus (Rodentia:Octodontidae). J Zool (Lond) 252:179–186
Ebensperger LA, Bozinovic F (2000b) Communal burrowing in thehystricognath rodent, Octodon degus: a benefit of sociality?Behav Ecol Sociobiol 47:365–369
Ebensperger LA, Cofré H (2001) On the evolution of group-living inthe New World cursorial hystricognath rodents. Behav Ecol12:227–236
Ebensperger LA, Hayes LD (2008) On the dynamics of rodent socialgroups. Behav Process 79:85–92
Ebensperger LA, Hurtado MJ (2005a) On the relationship betweenherbaceous cover and vigilance activity of degus (Octodondegus). Ethology 111:593–608
Ebensperger LA, Hurtado MJ (2005b) Seasonal changes in the timebudget of degus, Octodon degus. Behaviour 142:91–112
Ebensperger LA, Wallem PK (2002) Grouping increases the ability ofthe social rodent, Octodon degus, to detect predators when usingexposed microhabitats. Oikos 98:491–497
Ebensperger LA, Veloso C, Wallem PK (2002) Do female deguscommunally nest and nurse their pups? J Ethol 20:143–146
Ebensperger LA, Hurtado MJ, Soto-Gamboa M, Lacey EA, Chang AT(2004) Communal nesting and kinship in degus (Octodon degus).Naturwissenschaften 91:391–395
Ebensperger LA, Hurtado MJ, Ramos-Jiliberto R (2006) Vigilanceand collective detection of predators in degus (Octodon degus).Ethology 112:879–887
Ebensperger LA, Hurtado MJ, León C (2007) An experimentalexamination of the consequences of communal versus solitarybreeding on maternal condition and the early postnatal growthand survival of degu, Octodon degus, pups. Anim Behav 73:185–194
Ebensperger LA, Chesh AS, Castro RA, Ortiz Tolhuysen L,Quirici V, Burger JR, Hayes LD (2009) Instability rulessocial groups in the communal breeder rodent Octodon degus.Ethology 15:540–554
Ebensperger LA, Ramírez-Otarola N, León C, Ortiz ME, Croxatto HB(2010) Early fitness consequences and hormonal correlates ofparental behaviour in the social rodent, Octodon degus. PhysiolBehav 101:509–517
272 Behav Ecol Sociobiol (2012) 66:261–274
Ebensperger LA, Chesh AS, Castro RA, Ortiz Tolhuysen L, Quirici V,Burger JR, Sobrero R, Hayes LD (2011) Burrow limitations andgroup living in the communally rearing rodent, Octodon degus. JMammal 92:21–30
Edelman AJ, Koprowski JL (2007) Communal nesting in asocialAbert's squirrels: the role of social thermoregulation and breedingstrategy. Ethology 113:147–154
Emlen ST (1995) An evolutionary theory of the family. Proc NatlAcad Sci USA 92:8092–8099
Foster SA, Endler JA (1999) Geographic variation in behavior:perspectives on evolutionary mechanisms. Oxford UniversityPress, New York
Fulk GW (1976) Notes on the activity, reproduction, and socialbehavior of Octodon degus. J Mammal 57:495–505
Getz LL, McGuire B (1997) Communal nesting in prairie voles(Microtus ochrogaster): formation, composition, and persistenceof communal groups. Can J Zool 75:525–534
Gygax L (2002) Evolution of group size in the superfamilyDelphinoidea (Delphinidae, Phocoenidae and Monodontidae): aquantitative comparative analysis. Mammal Rev 32:295–314
Hass CC, Valenzuela D (2002) Anti-predator benefits of group livingin white-nosed coatis (Nasua narica). Behav Ecol Sociobiol51:570–578
Hayes LD, Chesh AS, Ebensperger LA (2007) Ecological predictorsof range areas and use of burrow systems in the diurnal rodent,Octodon degus. Ethology 113:155–165
Hayes LD, Chesh AS, Castro RA, Ortiz Tolhuysen L, Burger JR,Bhattacharjee J, Ebensperger LA (2009) Fitness consequences ofgroup living in the degu Octodon degus, a plural breeder rodentwith communal care. Anim Behav 78:131–139
Hill RA, Lee PC (1998) Predation risk as an influence on group size incercopithecoid primates: implications for social structure. J Zool(Lond) 245:447–456
Hoogland JL (1995) The black-tailed prairie dog: social life of aburrowing mammal. University of Chicago Press, Chicago
Houston J (2006) Variability of precipitation in the Atacamadesert: its causes and hydrological impact. Int J Climatol26:2181–2198
Houston J, Hartley AJ (2003) The central Andean west-sloperainshadow and its potential contribution to the origin ofhyper-aridity in the Atacama desert. Int J Climatol 23:1453–1464
Jarvis JUM, O’Riain MJ, Bennett NC, Sherman PW (1994)Mammalian eusociality: a family affair. Trends Ecol Evol 9:47–51
Johnson DDP, Jetz W, Macdonald DW (2002) Environmentalcorrelates of badger social spacing across Europe. J Biogeogr29:411–425
Keesing F (1998) Ecology and behavior of the pouched mouse,Saccostomus mearnsi, in central Kenya. J Mammal 79:919–931
Kenagy GJ, Nespolo RF, Vásquez RA, Bozinovic F (2002) Daily andseasonal limits of time and temperature to activity of degus. RevChil Hist Nat 75:567–581
Koprowski JL (1998) Conflict between the sexes: a review of socialand mating systems of the tree squirrels. In: Steele MA, MerrittJF, Zegers DA (eds) Ecology and evolutionary biology of treesquirrels. Virginia Museum of Natural History, Special Publica-tion 6:33–41
Krause J, Ruxton GD (2002) Living in groups. Oxford UniversityPress, Oxford
Lacey EA, Wieczorek JR (2003) Ecology of sociality in rodents: actenomyid perspective. J Mammal 84:1198–1211
Lagos PA, Meier A, Ortiz Tolhuysen L, Castro RA, Bozinovic F,Ebensperger LA (2009) Flight initiation distance is differentiallysensitive to the costs of staying and leaving food patches in asmall-mammal prey. Can J Zool 87:1016–1023
Levine TR, Hullett CR (2002) Eta squared, partial eta squared, andmisreporting of effect size in communication research. HumCommun Res 28:612–625
Lott DF (1991) Intraspecific variation in the social systems of wildvertebrates. Cambridge University Press, Cambridge
Lovegrove BG (1989) The cost of burrowing by the social mole rats(Bathyergidae) Cryptomys damarensis and Heterocephalusglaber: the role of soil moisture. Physiol Zool 62:449–469
Lucia KE, Keane B, Hayes LD, Lin YK, Schaefer RF, Solomon NG(2008) Philopatry in prairie voles: an evaluation of the habitatsaturation hypothesis. Behav Ecol 19:774–783
Madison DM (1984) Group nesting and its ecological and evolution-ary significance in overwintering microtine rodents. In: MerrittJF (ed) Winter ecology of small mammals. Carnegie Museum ofNatural History, Special Publication 10: 267–274
Maher C, Burger JR (2011) Intraspecific variation in space use, group size,and mating systems of caviomorph rodents. J Mammal 92:54–64
Meserve PL, Martin RE, Rodriguez J (1983) Feeding ecology of twoChilean caviomorphs in a central Mediterranean savanna. JMammal 64:322–325
Moorhouse TP, Macdonald DW (2008) What limits male range sizesat different population densities? Evidence from three popula-tions of water voles. J Zool (Lond) 274:395–402
Nakagawa S, Foster TM (2004) The case against retrospectivestatistical power analyses with an introduction to power analysis.Acta Ethol 7:103–108
Newman MEJ (2004) Analysis of weighted networks. Phys Rev E70:056131
Parrish JK, Hamner WM, Prewitt CT (1997) Introduction—fromindividuals to aggregations: unifying properties, global frame-work, and the holy grails of congregation. In: Parrish JK, HamnerWM (eds) Animal groups in three dimensions. CambridgeUniversity Press, Cambridge, pp 1–13
Powell RA, Fried JJ (1992) Helping by juvenile pine voles (Microtuspinetorum), growth and survival of younger siblings, and theevolution of pine vole sociality. Behav Ecol 3:325–333
Quirici V, Castro RA, Ortiz Tolhuysen L, Chesh AS, Burger JR,Miranda E, Cortés A, Hayes LD, Ebensperger LA (2010)Seasonal variation in the range areas of the diurnal rodentOctodon degus. J Mammal 91:458–466
Quirici V, Faugeron S, Hayes LD, Ebensperger LA (2011) Theinfluence of group size on natal dispersal in the communallyrearing and semifossorial rodent, Octodon degus. Behav EcolSociobiol 65:787–798
Quispe R, Villavicencio CP, Cortés A, Vásquez RA (2009) Inter-population variation in hoarding behaviour in degus, Octodondegus. Ethology 115:465–474
R Development Core Team (2006) R: a language and environment forstatistical computing. R Foundation for Statistical Computing,Vienna
Ribble DO, Stanley S (1998) Home ranges and social organization ofsyntopic Peromyscus boylli and P. truei. J Mammal 79:932–941
Rolland C, Danchin E, de Fraipont M (1998) The evolution ofcoloniality in birds in relation to food, habitat, predation, and lifehistory traits: a comparative analysis. Am Nat 151:514–529
Schradin C, Pillay N (2005) Intraspecific variation in the spatial andsocial organization of the African striped mouse. J Mammal86:99–107
Silk JB (2007) The adaptive value of sociality in mammalian groups.Phil Trans R Soc Lond B 362:539–559
Slobodchikoff CN (1984) The ecology of social behaviour. AcademicPress, Inc, San Diego
Solomon NG, Getz LL (1997) Examination of alternative hypothesesfor cooperative breeding in rodents. In: Solomon NG, French JA(eds) Cooperative breeding in mammals. Cambridge UniversityPress, Cambridge, pp 199–230
Behav Ecol Sociobiol (2012) 66:261–274 273
Soto-Gamboa M (2004) formación y estabilidad de estructurassociales en micromamíferos, su regulación hormonal y laimportancia de las interacciones entre machos. Ph.D. Disserta-tion, Pontificia Universidad Católica de Chile
Spinks AC, Bennett NC, Jarvis JUM (2000) Comparative patterns ofphilopatry and dispersal in two common mole-rat populations:implications for the evolution of mole-rat sociality. J Anim Ecol69:224–234
Stapp P, Pekins PJ, MautzWW (1991)Winter energy expenditure and thedistribution of southern flying squirrels. Can J Zool 69:2548–2555
Symonds MRE, Moussalli A (2011) A brief guide to model selection,multimodel inference and model averaging in behavioural ecologyusingAkaike's information criterion. Behav Ecol Sociobiol 65:13–21
Taraborelli P, Moreno P (2009) Comparing composition of socialgroups, mating system and social behaviour in two populationsof Microcavia australis. Mamm Biol 74:15–24
Travis SE, Slobodchikoff CN, Keim P (1995) Ecological anddemographic effects on intraspecific variation in the socialsystem of prairie dogs. Ecology 76:1794–1803
Van Soeste IJ (1982) Nutritional ecology of the ruminant. CornellUniversity Press, Ithaca
Vásquez RA (1997) Vigilance and social foraging in Octodon degus(Rodentia: Octodontidae) in central Chile. Rev Chil Hist Nat70:557–563
Vásquez RA, Ebensperger LA, Bozinovic F (2002) The influence ofhabitat on travel speed, intermittent locomotion, and vigilance ina diurnal rodent. Behav Ecol 13:182–187
Veloso C, Bozinovic F (1993) Dietary and digestive constraints onbasal energy metabolism in a small herbivorous rodent. Ecology74:2003–2010
Verdolin JL (2007) Resources, not male mating strategies, are adeterminant of social structure in Gunnison's prairie dogs(Cynomys gunnisoni). Behaviour 144:1361–1382
West SD (1977) Midwinter aggregation in the red-backed vole,Clethrionomys rutilus. Can J Zool 55:1404–1409
White GC, Burnham KP (1999) Program MARK: survival estimationfrom populations of marked animals. Bird Stud 46(Suppl):120–138
Whitehead H (2008) Analyzing animal societies: quantitativemethods for vertebrate social analysis. Chicago UniversityPress, Chicago
Whitehead H (2009) SOCPROG programs: analyzing animal socialstructures. Behav Ecol Sociobiol 63:765–778
Wolff JO (1994) Reproductive success of solitarily and commu-nally nesting white-footed and deer mice. Behav Ecol 5:206–209
Wrangham RW (1980) An ecological model of female-bonded primategroups. Behaviour 75:262–300
274 Behav Ecol Sociobiol (2012) 66:261–274