Embed Size (px)
Citation preview

ECOLOGICAL FOOTPRINT ANALYSIS AS A TOOL FOR ENVIRONMENTAL EDUCATION
Abstract
Ecological footprint (EF) analysis calculates the energy and resource
needs of a population in terms of the land and water area required to sustain that
population (Wackernagel and Rees 1996, Ferguson 2002, Wackernagel et al.
2002). This paper provides background information on ecological footprinting,
especially as it relates to environmental education; curriculum ideas for teaching
about environmental sustainability and resource use; and a classroom tool for
calculating students’ ecological footprints. Humanity’s use of Earth’s resources is
not fixed in space or time; resource needs vary within and among countries, and
as our global population grows there will be fewer available resources to support
billions more people. Ecological footprint calculators such as the one presented
here can be used as a hands-on method for exploring the connections among
resource consumption, environmental sustainability, and global ecosystem
processes.
130

Introduction
The past 100 years have been a time of unprecedented anthropogenic
environmental changes in North America. These include dramatic expansion of
urban and suburban areas and roadways, conversion of much of the continent’s
native prairie into cropland, impacts from extractive industries such as mining
and timber harvesting, increasing use of ground and surface waters for
agriculture and municipalities, and reduction in air quality resulting from fuel
emissions. Urban populations have also grown increasingly dependent on
importation of goods (food, clothing, building materials, automobiles, fuel, and
sometimes water) from domestic and international sources, reducing the self-
sufficiency of individuals, communities, and nations. As the Earth’s population
increases its inhabitants will place even greater demands on renewable and non-
renewable resources. Estimations and projections suggest that the global
population has increased from 2.5 billion people in 1950 to 6.1 billion in 2000,
and may reach 8.9 billion by 2050 (United Nations 2004) (Figure 4.1). The global
community is challenged now, and will continue to struggle, to balance human
needs against those of other organisms.
Ecological footprint (EF) analysis is a quantitative method for assessing
humanity’s impact on the environment. Ecological footprint analysis incorporates
biology, earth science, economics, and geography into a measurement tool that
addresses the ways in which our levels of resource consumption affect Earth’s
abiotic and biotic resources, and influence global sustainability. The EF method
is used to address such key questions as: What is the carrying capacity of the
131

planet? Are we living within it? What is the relationship among population, the
environment, and sustainability? How can we live well, while reducing our impact
on the environment? Within the United States most children and adults have
heard or read about some aspect of environmental sustainability, perhaps related
to recycling, improved automotive fuel efficiency, or monitoring of water and air
quality. Ecological footprinting brings many of the diverse elements of
sustainability together - people, land, water, and air - and facilitates improved
understanding of the Earth as a complex system. Residents of the United States
have an especially compelling reason to evaluate their resource use, because
the U.S. per capita footprint is the largest in the world (Wackernagel et al. 1997).
This paper describes ecological footprint analysis as a tool for ecology
education in upper elementary and middle school grades. Although a number of
science and policy research papers exist based on this and related concepts
(Hall and Clover 1997, Wackernagel and Yount 2000, Ferguson 2002,
Sanderson et al. 2002, Wackernagel et al. 2002, DeFries et al. 2004, Imhoff et al.
2004), very few papers explicitly address the role of EF analysis in education or
provide an education framework for teachers (Venetoulis 2001, Camill 2002,
Todd 2003, Schumaker-Chadde et al. 2004). As increasing emphasis is placed
on issues of global concern including declining natural resources, population
pressure, urbanization and land cover change, and increasing atmospheric CO2
and associated climate trends, the understanding of human contributions to
these processes is a timely lesson for tomorrow’s environmental stewards.
132

The EF concept provides a powerful tool for helping students understand
the relationships between resource consumption and ecological sustainability.
Through EF analysis students can explore such topics as community planning,
resource conservation, global change, landscape ecology, energy balance, food
webs, and carrying capacity. Curricula built around EF analysis can be used to
meet national science content standards for scientific inquiry and investigation,
life science, science and technology, and science in social perspectives, enabling
teachers to incorporate ecology topics into their teaching schedule while still
meeting national guidelines and education requirements.
Ecological footprint calculators can help students understand human
contributions to global change, and effects of those changes on global
ecosystem processes. The EF tool provides a method for objectively evaluating
resource-related issues, and integrates math, social studies, geography, and
ecology into science teaching in an authentic and enriching manner. Helping
students understand their resource use and its relationship to ecological
sustainability at local, regional, and global scales may encourage innovation of
alternative, more ecologically sustainable practices and ultimately reduce the flux
of energy into and waste out of households, schoolyards, and communities.
The following sections of this paper include background on EF concepts,
two take-home activities for students that provide a hands-on introduction to EF
methods (Appendix A), and an ecological footprint calculator designed
specifically for use with upper elementary and middle school students (Appendix
B). I provide information on how and where ecological footprinting activities tie in
133
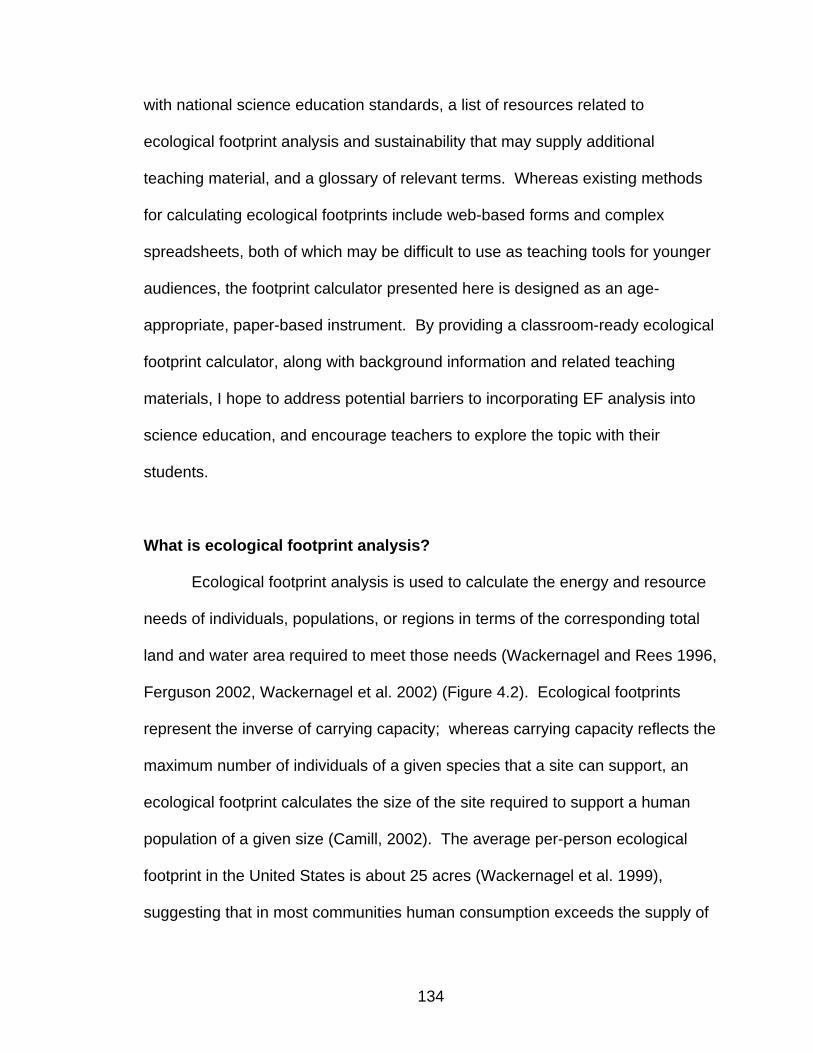
with national science education standards, a list of resources related to
ecological footprint analysis and sustainability that may supply additional
teaching material, and a glossary of relevant terms. Whereas existing methods
for calculating ecological footprints include web-based forms and complex
spreadsheets, both of which may be difficult to use as teaching tools for younger
audiences, the footprint calculator presented here is designed as an age-
appropriate, paper-based instrument. By providing a classroom-ready ecological
footprint calculator, along with background information and related teaching
materials, I hope to address potential barriers to incorporating EF analysis into
science education, and encourage teachers to explore the topic with their
students.
What is ecological footprint analysis?
Ecological footprint analysis is used to calculate the energy and resource
needs of individuals, populations, or regions in terms of the corresponding total
land and water area required to meet those needs (Wackernagel and Rees 1996,
Ferguson 2002, Wackernagel et al. 2002) (Figure 4.2). Ecological footprints
represent the inverse of carrying capacity; whereas carrying capacity reflects the
maximum number of individuals of a given species that a site can support, an
ecological footprint calculates the size of the site required to support a human
population of a given size (Camill, 2002). The average per-person ecological
footprint in the United States is about 25 acres (Wackernagel et al. 1999),
suggesting that in most communities human consumption exceeds the supply of
134
local natural capital, resulting in the necessary importation of goods and
exportation of waste products.
The ecological footprint of a given individual, community, region, or nation
is not fixed in time, but can be reduced through implementation of more
sustainable resource use and waste production practices. As with human
demand, nature’s supply of resources varies through time and is influenced by
changes in land use (urbanization, deforestation), climate (drought), and natural
disasters (flooding, forest fires). These changes underscore the need for
adoption of more sustainable practices, because they reduce the supply of
available biologically productive land, a loss that must be countered by a
reduction in demand to avoid “ecological overshoot” (Wackernagel et al. 2002).
A number of studies have estimated that although the total human population
accounts for about 0.5% of the biomass of heterotrophic organisms on Earth,
humans appropriate as much as 39% of the total food energy available on land
(Vitousek et al. 1986, Rojstaczer et al. 2001, Imhoff et al. 2004). A recent
analysis comparing humanity’s demand to the supply of natural capital
demonstrates that between 1961 and 1999 our use of Earth’s resources
increased from 70% to 120%, indicating that we have exceeded the global
carrying capacity of our planet (Wackernagel et al. 2002) (Figure 4.3). Add to
this scenario predictions for a global population of 8.9 million by A.D. 2050, and
we are confronted with the possibility that our current appropriation of Earth’s
natural capital is likely to have catastrophic effects on global ecosystem
processes in the decades to come. The good news is that ecological footprint
135

analysis provides both the diagnosis and the cure for ecological overshoot, and
can be used as a compass for directing our efforts toward global sustainability.
The EF concept was widely introduced in 1996 in the book Our Ecological
Footprint: Reducing Human Impact on the Earth (Wackernagel and Rees 1996),
in which the authors describe and quantify the impact of individuals on global
ecological space in terms of the flux of resources into and waste out of
communities. The authors envisioned EF analysis as a planning tool useful for
exploring relationships between resource use and ecological sustainability. The
original EF concept was also suggested as a method to “translate sustainability
concerns into public action,” because built into its metrics are solutions for
reducing ecological footprints at multiple scales, from individual to community to
national. By design EF calculators allow users to evaluate the impact of their
personal resource consumption on global sustainability, and iteratively modify a
set of behaviors to reduce or increase their ecological footprint.
Ecological footprints are calculated by estimating the amount of land area
needed to support an individual’s consumption of resources within five main
categories: food, housing, transportation, consumer goods, and services
(Wackernagel and Rees 1996). Simple mathematical equations are used to
quantify resource consumption in terms of the total land area required to produce
those goods and services consumed, including energy land (for fossil fuel
production), consumed land (urban areas), used land (gardens, cropland,
pasture, and managed forests), and limited availability land (non-managed
forests and non-productive land such as ice caps or deserts). Because these
136

land area types are not uniformly distributed across the landscape, ecological
footprints typically encompass a far greater patch of land than the area
immediately surrounding a particular city or region. Translated into simple terms,
this means that most of us depend on goods and services that come from
outside the boundaries of the communities in which we live (are imported), and
the size of our ecological footprint proportionally reflects the degree to which we
rely on these non-local goods and services. Ecological footprints differ
significantly by country, from 1.25 acres per person in Bangladesh to 25.75 acres
per person in the United States (Wackernagel et al. 1997) (Table 4.1).
Ecological footprint calculators use four basic equations to estimate
individual and population footprints. They are:
(1) c = total consumption/population size
where c is the average annual individual consumption of specific goods and
services, measured in kilograms per capita and population size is the number of
persons living within the community, region, or country of interest. Aggregate
regional or national data on energy, food, and forest products production and
consumption and census or other demographic data are used to parameterize
this initial equation.
(2) aai = ci/pi
where aa is an estimation of the land area appropriated per capita for the
production of each major consumption item (i), and p is the average annual
productivity or yield of that land area expressed in kilograms/hectare.
137

(3) ef = Σ aai
i = 1 to n
where ef is the individual or per capita ecological footprint and Σ aai is the
summation of all ecosystem areas appropriated by that individual’s annual
consumption of goods and services.
(4) EFpopulation = N(ef)
where N is the population size within the city, region, or country of interest.
In simple terms, an individual’s consumption of goods and services is
computed as a fraction of the population total consumption within a region of
interest, translated into a spatial accounting of the amount of land area required
to support that individual’s consumption at an annual time step. This mass-to-
area translation is calculated separately for various classes or categories of
goods and services, and a final summation estimates the total land area or
resource basin an individual requires for all of his/her resource needs (consumed
food; fossil fuels used in transportation, food processing, and heating; waste
disposal). To calculate the ecological footprint for a family, school, or community
we multiply an individual’s EF estimate by the size of the population of interest.
This final computation assumes that all individuals within the population of
interest share similar lifestyles in terms of resource consumption and waste
production.
Ecological footprint calculators are available via the Internet and typically
include questions related to food consumption, waste production, transportation,
and housing (Redefining Progress 2002). Examples of such questions are:
138
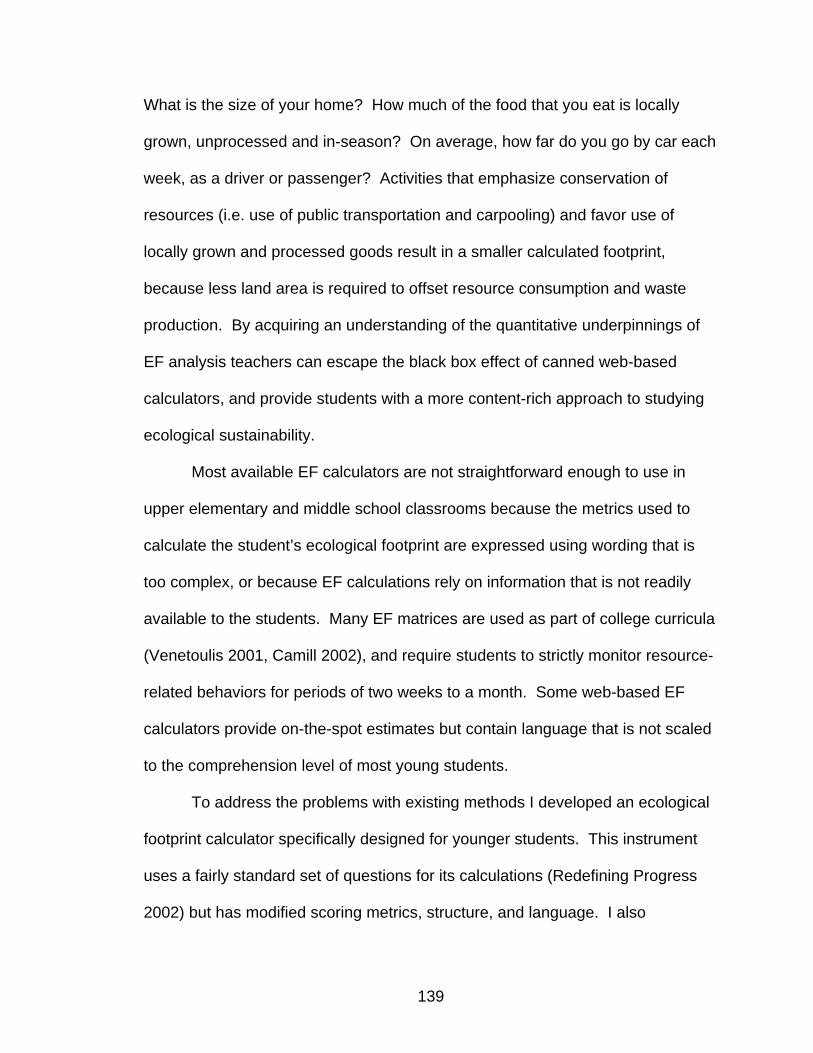
What is the size of your home? How much of the food that you eat is locally
grown, unprocessed and in-season? On average, how far do you go by car each
week, as a driver or passenger? Activities that emphasize conservation of
resources (i.e. use of public transportation and carpooling) and favor use of
locally grown and processed goods result in a smaller calculated footprint,
because less land area is required to offset resource consumption and waste
production. By acquiring an understanding of the quantitative underpinnings of
EF analysis teachers can escape the black box effect of canned web-based
calculators, and provide students with a more content-rich approach to studying
ecological sustainability.
Most available EF calculators are not straightforward enough to use in
upper elementary and middle school classrooms because the metrics used to
calculate the student’s ecological footprint are expressed using wording that is
too complex, or because EF calculations rely on information that is not readily
available to the students. Many EF matrices are used as part of college curricula
(Venetoulis 2001, Camill 2002), and require students to strictly monitor resource-
related behaviors for periods of two weeks to a month. Some web-based EF
calculators provide on-the-spot estimates but contain language that is not scaled
to the comprehension level of most young students.
To address the problems with existing methods I developed an ecological
footprint calculator specifically designed for younger students. This instrument
uses a fairly standard set of questions for its calculations (Redefining Progress
2002) but has modified scoring metrics, structure, and language. I also
139

developed two take-home activities that give students hands-on experience with
evaluating their use of resources, and effects of these practices on global
sustainability. I suggest that teachers direct students to complete these activities
at home before introducing the ecological footprint calculator in the classroom,
because the activities are designed to engage student interest and investment in
EF concepts. Exploration of global sustainability, ecosystem processes, and
resource consumption needs not be confined to the activities presented here.
The following sections present curriculum ideas, a list of relevant resources, and
suggestions for ways in which ecological footprint analysis can be used to meet
national standards for science content, that may be useful for teachers who wish
to integrate EF analysis with existing curricula.
Implementing ecological footprint analysis in the classroom
In an education context the ecological footprint concept is a useful tool for
helping students to visualize the global natural resource base required to support
individuals, families, and communities. Through EF analysis students can
calculate their resource needs, compare these footprints with national and global
average ecological footprints, and identify and implement practices and programs
at the household, school and community levels to reduce dependence on non-
sustainable goods and services. Ecological footprint analysis allows students to
engage in an active, authentic learning process through which they are made
aware of their contributions to the global ecological balance, and their ability to
define and enact changes to improve our planet’s environment. Critical
140

ecological issues related to EF analysis include global warming, habitat
fragmentation, and air and water quality, because the human appropriation of
natural resources results in reduced and/or poorer quality resources for other
organisms and natural communities. Other related ecology topics include food
webs, ecosystem interactions, carrying capacity, and energy balance; teachers
can effectively draw analogy among our requirements for food, housing,
transportation, goods and services as expressed in the ecological footprint
concept, and similar requirements in natural systems.
To introduce ideas related to resource consumption and sustainability, ask
students to list their basic needs. For humans as well as most terrestrial
organisms, these are air, food, shelter, and water. What other needs do students
have that consume resources? Are these resources finite or infinite, renewable or
non-renewable? Although many students understand the fuel costs of
automobiles, they may not be aware of associated mining and manufacturing
costs. Conversely, students probably have an understanding of the land costs
associated with growing grain crops used to produce cereal and bread products,
but they may not account for water and fertilizer used in the growing process, or
fuel costs of transporting crops from fields to manufacturing plants to markets.
Concept maps can be used to help students understand the relationships
between human needs and ecosystem goods and services. As mentioned
above, food production requires the input of many hundreds of resources
including soil, water, microorganisms, atmospheric gases, plant material, metals
used to make machines to harvest and process food, petroleum products to drive
141

those machines, and trees to absorb carbon emissions. Although not all system
inputs can be easily identified, major requirements can be accounted for using an
illustrated concept map. Using this method students develop a flowchart diagram
for a particular food they eat, that shows the resource inputs required to produce
and deliver that food item from farm to table. Rather than limit these diagrams to
obvious primary inputs to the system (e.g. water, fuel, grass) students should
consider secondary inputs such as those listed above.
One goal of ecological footprint analysis is to emphasize direct and
indirect resource costs associated with our lifestyles, some of which we may not
realize or may take for granted. Most of us rely to some degree on dry goods,
food products, and energy resources that are imported, either from different
regions of the United States or from other countries. In addition to the resource
costs of growing, manufacturing, and extracting these products there are
transportation costs associated with their importation. Similarly we are
profoundly reliant on non-renewable energy resources (fossil fuels) to support
our lifestyles, but may not be aware of some of the ecological implications of this
dependence. The two take-home activities in Appendix A help students to
evaluate the monetary, energy, and ecological costs inherent in typical American
households, including use of inefficient incandescent bulbs and reliance on
imported clothing and food items. After completing these activities students
should have a better understanding of their personal contribution to global
sustainability, be able to suggest some ways to reduce their resource
142

consumption, and have the foundation knowledge required to understand and
implement ecological footprint analysis.
The EF calculator in Appendix B provides students with an estimate of the
amount of land area required to offset their use of food, housing, transportation,
and consumer goods and services, and to account for waste production. The EF
calculator returns the number of global acres needed, plus a calculation for the
“number of Earths” necessary to support the student’s lifestyle. The resource
costs associated with the typical American lifestyle have reached global
overshoot, but are offset by practices in less developed nations, where
individuals typically use far fewer resources.
Teachers are encouraged to help students understand and implement
mechanisms for reducing resource consumption. Students can use the EF
calculator to make predictions about which lifestyle choices result in smaller or
larger footprints, and iteratively test their predictions by modifying their quiz
answers. Some lifestyle changes may be relatively easy to make, and some may
be unreasonable - there are often inherent tradeoffs between meeting human
needs for goods and services and achieving goals for ecological sustainability,
including economic, social, and efficiency costs associated with reducing
demand on natural capital (DeFries et al. 2004).
A place-based approach to teaching about resource use and its
relationship to ecosystems will provide students with a meaningful context for
understanding EF concepts. Place-based approaches focus on local
environmental and resource management issues (e.g. noxious weed invasion,
143

urban expansion, mining, logging, or water quality and availability). Because
many of these issues are widely debated in popular media and local and state
government forums, students may already possess useful background
knowledge of and/or direct experience with relevant ecosystem components.
The issues mentioned above influence regional sustainability in different ways:
through reduction of available “useful land,” decreased landscape productivity,
and through removal or contamination of renewable and non-renewable
resources. As ecological degradation progresses through time and the amount
of biologically productive land within a region decreases, ecological sustainability
depends on implementation of resource-conserving strategies that reduce the
ecological footprint of populations within that region. The ecological footprint
calculator can be used to focus attention on the relationships between local
ecological issues and resource conservation; in effect, to develop a conceptual
understanding of ecology as a system in which flows of energy and waste exist at
multiple scales and affect and are affected by actions at each of these scales.
Explaining resource sustainability and consumption in a familiar context
gives students the tools and understanding necessary for implementing practices
that favor sustainability and reduce ecological footprints at multiple scales. As
part of the lesson students can be asked to brainstorm things they can do at
home, school, or within the community to limit resource consumption, and
implement those changes over a period of time. Several examples of student-
driven conservation and sustainability programs exist in the literature, and
provide good models for teachers interested in implementing similar programs
144

(Grant and Littlejohn 2001b, 2001a, Dunn Foundation 2002, Michigan State
University Extension 2002, Chadde et al. 2004).
Additional information, lesson plans, and curricula related to ecological
footprints and environmental sustainability are listed in the Resources section of
this paper. There are a growing number of organizations devoted to promoting
these ideas, including:
Redefining Progress (http://www.redefiningprogress.org/)
Earth Day Network (http://www.earthday.net/)
Creative Change Educational Solutions (http://www.creativechange.net/
Facing the Future (http://www.facingthefuture.org/)
These organizations provide curriculum ideas, detailed lesson plans, and teacher
training materials useful for implementing environmental education in the
classroom.
Ecological footprint analysis and the national science education standards
National science education standards are designed to help students attain
scientific literacy, and call for student exposure to a “rich array” of learning
materials and inquiry-based learning focused on critical thinking and application
of the scientific method of observation, prediction, and hypothesis testing
(National Research Council 1996). Teachers can use EF analysis to teach key
ecology concepts and address current issues, while still meeting national
standards for science education. A review of the national science education
standards shows that ecological footprint analysis clearly fits within a number of
the broad content categories and can be used to teach specific skills prescribed
145

by the standards (Table 4.2). The content standards met through classroom
implementation of the EF quiz and suggested extension ideas include science as
inquiry, life science, science and technology, and science in social perspectives.
Ecological footprint analysis can be used to fulfill prescribed learning goals and
skills within each of the relevant content standards, for upper elementary and
middle school students.
Conclusions
As tomorrow’s environmental stewards, the current cohort of elementary
and middle school students must obtain knowledge and skills necessary to make
informed decisions, evaluate information, and think critically about issues of
global concern. Ecological footprint analysis can be one useful tool for providing
the foundation for an ecologically literate citizenry, who possess basic knowledge
of the interconnectedness of human populations, natural resources, and natural
communities that is fundamental to understanding today’s environmental and
ecological challenges. By participating in EF activities students can develop an
awareness of their importance within the global ecology as producers and
consumers, and as citizens who can make lifestyle changes to promote resource
conservation and sustainability.
Population and resource use trends suggest that our demands on Earth’s
natural capital will increase, requiring new technological solutions, practices, and
attitudes to avoid catastrophic ecological overshoot. Exploration of the ecological
footprint concept gives students the ability to participate in decision-making and
146

cost-benefit analysis, and design strategies or programs by which they can make
changes at the individual, school, or community scale. Ecological footprint
analysis can be used to introduce and reinforce key concepts in ecology
including energy balance, food webs, and carrying capacity; many of the same
cost-benefit tradeoffs that influence our decisions are also present within natural
systems, and non-human species are also subject to population pressures and
resource limitations.
By addressing some of the obvious barriers to introducing ecological
footprint analysis in primary and middle school classrooms I hope to encourage
teachers to explore this and related concepts with their students. In particular, a
place-based approach which emphasizes local environmental or ecological
issues may provide a compelling context for learning, and offer an arena in which
students can make lifestyle changes to promote sustainable communities. The
ecological footprint quiz presented here may also encourage teachers to include
ecological footprint analysis as part of their science curriculum, because it is
scaled to favor younger users, is easily administered, and can be integrated into
the curriculum as part of the nationally-prescribed science content.
The list of resources for teachers contained in this paper is inclusive but
by no means exhaustive. Many additional curriculum units, activities, lessons,
and papers related to resource sustainability and community planning exist that
may provide valuable material for teachers and students, although, as
mentioned, few explicitly address the use of ecological footprint calculators in the
classroom. Since the introduction of the ecological footprint concept in 1996, it
147

has grown in application to include research in ecology, economics, public policy,
and planning, community land-use and sustainability projects, environmental
analysis and conservation studies, and education. Continued use of ecological
footprint analysis to teach about resource sustainability and conservation
promotes a community of ecologically-aware students, who will already be
conversant with EF concepts when they encounter them as older students or
adults. The development of lessons or curricula focused on use of ecological
footprint calculators in the classroom is a critical step in establishing the
effectiveness of ecological footprint analysis as a tool for environmental
education.
148

Resources for Teachers
Web-based Ecological Footprint Calculators
Redefining Progress http://www.redefiningprogress.org/
Adventures with Bobbie Bigfoot http://www.kidsfootprint.org/index.html Data sources for Ecological Footprint calculations
Food and Agriculture Organization (FAO) of the United Nations http://faostat.fao.org/
United Nations Development Program (UNDP) http://hdr.undp.org/statistics/data/
World Resources Institute EarthTrends Environmental Information Portal http://earthtrends.wri.org/
Worldwatch Institute http://www.worldwatch.org/
Supplemental information for the Ecological Footprint Quiz
Information on green building techniques http://www.greenhomebuilding.com/
EPA’s Fuel Economy Guides, 2000-2006 http://www.fueleconomy.gov/feg/FEG2000.htm
Five Things Your Community Can Do To Reduce Its Ecological Footprint http://www.regionalprogress.org/StepstoSustainability.pdf
Ecological Footprints of Nations Report, 2004
http://www.rprogress.org/newpubs/2004/footprintnations2004.pdf
Ecological Footprint FAQs http://www.rprogress.org/newprojects/ecolFoot/faq/index.html#accuracy3
Curriculum Links
Looks Count! Community Planning, Natural Resource Protection and the Visual Environment: An Interdisciplinary Middle School Curriculum Unit for Social Studies, Language Arts, Math, Science, and Art. http://wupcenter.mtu.edu/education/land_use/
This Land is Your Land by Michigan State University Extension: Land use curriculum
materials designed to help students understand the importance and practice of wise land use. http://www.msue.msu.edu/
Redefining Progress K-12 Lesson Plans
http://www.redefiningprogress.org/newprograms/sustIndi/education/k-12lessonplans.shtml
Creative Change Educational Solutions http://www.creativechange.net/
Facing the Future http://www.facingthefuture.org/
Earth Day Network http://www.earthday.net/
149

Glossary of terms
Abiotic – nonliving components of the environment, including light, climate, atmosphere, rocks, and minerals. Acre - 4,840 square yards. One hectare contains 2.47 acres, or 10,000 square meters. An acre is approximately the size of an American football field, not counting its end zones. Anthropogenic – caused by humans. Autotrophic – an organism capable of synthesizing its own food from inorganic substances, using light or chemical energy. Green plants, algae, and certain bacteria are autotrophs. Available biological capacity - the amount of biologically productive space that is available for human use. Biotic – of or having to do with life or living organisms. Carrying capacity – the maximum number of individuals that a given area can support without detrimental effects. Ecological footprint - a measure of the amount of productive land and water an individual, city, country, or the world requires to produce all the resources it consumes and to absorb all the waste it generates, using prevailing technology. Ecological overshoot - when human demand exceeds nature’s supply at the local, national, or global scale. Ecology – the study of the relationships between organisms and their environment. Energy balance - the state in which the total energy intake equals total energy need. Flux – flow. Food chain - A succession of organisms in an ecological community that constitutes a continuation of food energy from one organism to another as each consumes a lower member and in turn is preyed upon by a higher member. Food web - An organism that cannot synthesize its own food and is dependent on complex organic substances for nutrition.
150

Global warming - an increase in the near surface temperature of the Earth. Global warming has occurred in the distant past as the result of natural influences, but the term is today most often used to refer to the warming some scientists predict is occurring as a result of increased anthropogenic emissions of greenhouse gases. Greenhouse effect - the effect of the Earth's atmosphere, due to certain gases, in trapping heat from the sun; the atmosphere acts like a greenhouse. Greenhouse gases - gases that trap the heat of the sun in the Earth's atmosphere, producing the greenhouse effect. The two major greenhouse gases are water vapor and carbon dioxide. Lesser greenhouse gases include methane, ozone, chlorofluorocarbons, and nitrogen oxides. Heterotrophic - an organism that cannot synthesize its own food and is dependent on complex organic substances for nutrition.
Natural capital - the stock of natural assets that yield goods and services on a continuous basis. Main functions include resource production (such as fish, timber or cereals), waste assimilation (such as CO2 absorption or sewage decomposition) and life support services (biodiversity, water cleansing, climate stability).
Non-renewable resources – materials that exist in finite amounts and cannot be replenished, such as fossil fuels or metals.
Productivity - a measurement of biological production per acre per year. A typical indicator of biological productivity is the annual biomass accumulation of an ecosystem.
Renewable resources – materials that can be replaced through natural processes; examples are solar energy or trees. Sink – an area in which more resources are used than are produced. Source – an area in which more resources are produced than are used. Sustainability – living within the carrying capacity of the Earth’s life support systems.
151

References
Camill, P. 2002. Watch your step: the impacts of personal consumption on the
environment. Journal of College Science Teaching 32:29-35.
Chadde, J., J. Dunstan, and L. Rulison. 2004. Looks Count! An Interdisciplinary
Middle School Unit for Social Studies, Language Arts, Math, Science, and
Art. in. Western Upper Penninsula Center for Science, Mathematics, and
Envionmental Education, Houghton.
DeFries, R. S., J. A. Foley, and G. P. Asner. 2004. Land-use choices: balancing
human needs and ecosystem function. Frontiers in Ecology and
Environment 2:249-257.
Dunn Foundation. 2002. Viewfinders Too: Exploring Community Appearance. in.
The Dunn Foundation, Warwick.
Ferguson, A. R. B. 2002. The assumptions underlying eco-footprinting.
Population and Environment 23:303-313.
Global Footprint Network. 2005. National Footprint and Biocapacity Accounts,
2005 Edition.
Grant, T., and G. Littlejohn, editors. 2001a. Greening School Grounds: Creating
Habitats for Learning. Green Teachers, Toronto.
Grant, T., and G. Littlejohn, editors. 2001b. Teaching About Climate Change:
Cool Schools Tackle Global Warming. Green Teachers, Toronto.
Hall, B. L., and D. E. Clover. 1997. The future begins today - nature as teacher
in environmental adult popular education. Futures 29:737-747.
Imhoff, M. L., L. Bounoua, T. Ricketts, C. Loucks, R. Harriss, and W. T.
Lawrence. 2004. Global patterns in human consumption of net primary
production. Nature 429:870-873.
Michigan State University Extension. 2002. This Land is Your Land. in. Michigan
State University Extension, Kent County.
National Research Council. 1996. National Science Education Standards.
National Academy Press, Washington, D.C.
152
Redefining Progress. 2002. Ecological Footprint Quiz. in. Redefining Progress,
San Francisco.
Rojstaczer, S., S. M. Sterling, and N. J. Moore. 2001. Human appropriation of
photosynthesis products. Science 294:2549-2552.
Sanderson, E. W., M. Jaith, M. A. Levy, K. H. Redford, A. V. Wannebo, and G.
Woolmer. 2002. The human footprint and the last of the wild. BioScience
52:891-904.
Schumaker-Chadde, J., J. Klipp, and A. Crouch. 2004. Looks count for
communities. Science Scope:18-23.
Todd, K. 2003. Are you bigfoot? Sierra 88:40-44.
United Nations. 2004. World Population to 2300. United Nations Department of
Economic and Social Affairs, Population Division, New York.
Venetoulis, J. 2001. Assessing the ecological impact of a university: the
ecological footprint for the University of Redlands. International Journal of
Sustainability in higher Education 2:180-196.
Vitousek, P. M., P. Ehrlich, A. Ehrlich, and P. M. Matson. 1986. Human
appropriation of the products of photosynthesis. BioScience 36:368-373.
Wackernagel, M., L. Onisto, P. Bello, A. C. Linares, I. S. L. Falfan, J. M. Garcia,
A. I. S. Guerrero, and M. G. S. Guerrero. 1999. National natural capital
accounting with the ecological footprint concept. Ecological Economics
29:375-390.
Wackernagel, M., L. Onisto, A. C. Linares, I. S. L. Falfan, J. M. Garcia, A. I. S.
Guerrero, and M. G. S. Guerrero. 1997. Ecological footprints of nations:
how much nature do they use? How much nature do they have?
International Council for Local Environmental Initiatives, Toronto.
Wackernagel, M., and W. Rees. 1996. Our Ecological Footprint. New Society
Publishers, Gabriola Island, B.C.
Wackernagel, M., N. B. Shulz, D. Deumling, A. C. Linares, M. Jenkins, V. Kapos,
C. Monfreda, J. Loh, N. Myers, R. Norgaard, and J. Randers. 2002.
Tracking the ecological overshoot of the human economy. Proceedings of
the National Academy of Sciences 99:9266-9271.
153

Wackernagel, M., and J. D. Yount. 2000. Footprints for sustainability: the next
steps. Environment, Development and Sustainability 2:21-42.
154

Table 4.1 Ecological footprints of nations in acres per capita (Data source: Wackernagel et al. 1997)
Country Ecological Footprint Available Capacity Ecological Overshoot Argentina 9.75 11.50 1.75 Australia 22.50 35.00 12.50 Austria 10.25 7.75 -2.50 Bangladesh 1.25 0.75 -0.50 Belgium 12.50 3.25 -9.25 Brazil 7.75 16.75 9.00 Canada 19.25 24.00 4.75 Chile 6.25 8.00 1.75 China 3.00 2.00 -1.00 Colombia 5.00 10.25 5.25 Costa Rica 6.25 6.25 0.00 Czech Rep 11.25 10.00 -1.25 Denmark 14.75 13.00 -1.75 Egypt 3.00 0.50 -2.50 Ethiopia 2.00 1.25 -0.75 Finland 15.00 21.50 6.50 France 10.25 10.50 0.25 Germany 13.25 4.75 -8.50 Greece 10.25 3.75 -6.50 Hong Kong 15.25 0.00 -15.25 Hungary 7.75 5.25 -2.50 Iceland 18.50 54.25 35.75 India 2.00 1.25 -0.75 Indonesia 3.50 6.50 3.00 Ireland 14.75 16.25 1.50 Israel 8.50 0.75 -7.75 Italy 10.50 3.25 -7.25 Japan 10.75 2.25 -8.50 Jordan 4.75 0.25 -4.50 Korea, Rep 8.50 1.25 -7.25 Malaysia 8.25 9.25 1.00 Mexico 6.50 3.50 -3.00 Netherlands 13.25 4.25 -9.00 New Zealand 19.00 51.00 32.00 Nigeria 3.75 1.50 -2.25 Norway 15.50 15.75 0.25 Pakistan 2.00 1.25 -0.75 Peru 4.00 19.25 15.25 Philippines 3.75 2.25 -1.50 Poland, Rep 10.25 5.00 -5.25 Portugal 9.50 7.25 -2.25 Russian Federation 15.00 9.25 -5.75 Singapore 18.00 0.25 -17.75 South Africa 8.00 3.25 -4.75 Spain 9.50 5.50 -4.00 Sweden 14.75 17.50 2.75 Switzerland 12.50 4.50 -8.00 Thailand 7.00 3.00 -4.00 Turkey 5.25 3.25 -2.00 United Kingdom 13.00 4.25 -8.75 United States 25.75 16.75 -9.00 Venezuela 9.50 6.75 -2.75 WORLD 7.00 5.25 -1.75
155

Table 4.2 Tie-ins between ecological footprint analysis and the National Science Education Content Standards (National Research Council 1996). National Science Education Standard Skills Base Grade
Level A: SCIENCE AS INQUIRY
Ask a question about objects, organisms, or events K-4
Communicate investigations and explanations K-4
Identify questions and concepts that guide scientific investigations 5-8
Use technology to gather, analyze, and interpret data 5-8
Develop descriptions, explanations, and models 5-8
Abilities necessary for scientific inquiry
Use mathematics in all aspects of scientific inquiry 5-8
C: LIFE SCIENCE Basic needs of organisms K-4
Characteristics of organisms Behavior of organisms and their environmental contexts K-4
Interdependence of organisms K-4 Response of organisms to environmental change K-4 Organisms and their environments Human dimensions of environmental change K-4
Regulation and behavior An organism’s behavior evolves through adaptation to its environment 5-8
Populations and ecosystems Matter, energy and organization in living systems 5-8
E: SCIENCE AND TECHNOLOGY Invention of tools and techniques to solve scientific problems K-4
Technological solutions have side effects, and carry costs, risks and provide benefits, and have constraints
5-8 Understanding about science and technology
Perfectly designed solutions do not exist; all solutions have tradeoffs and unintended consequences
5-8
F: SCIENCE IN PERSONAL AND SOCIAL PERSPECTIVES
Characteristics and changes in populations Changes in population density over time and across the landscape K-4
Basic characteristics of resources K-4 Types of resources Resource limitations and conservation K-4
Science and technology in local challenges Effects of inventions, ideas, and ways of solving problems K-4
Populations, resources, and environments Causes of environmental degradation and effects of overpopulation on the environment
5-8
Natural hazards Human activities can induce resource-related hazards 5-8
Risks and benefits Individuals can use systemic approaches to thinking critically about risks and benefits 5-8
156

6.1
7.9
8.9
2.5
4.1
0
1
2
3
4
5
6
7
8
9
10
1950 1975 2000 2025 2050
Year
Wor
ld p
opul
atio
n (b
illio
ns)
Projected
Actual
Figure 4.1 Actual (1950-2000) and projected (2000-2050) world population in billions of people (Data source: United Nations 2004).
Figure 4.2 Ecological footprint (From Zero Waste Services,http://www.zerowaste.ca/)157

0.0
0.2
0.4
0.6
0.8
1.0
1.2
1.4
1961 1971 1981 1991 2001
Year
Num
ber o
f Ear
ths
Humanity's Total Ecological Footprint
Earth's biological capacity
Figure 4.3 Ecological overshoot, 1961-2002. The dashed line represents the Earth’s biological capacity, and the shaded region is resource use relative to that capacity, demonstrating that by 2002 global overshoot equaled about 120% of Earth’s available resources. (Data source: Global Footprint Network 2005).
158

APPENDIX A
159
Change a Bulb – Save a Watt!
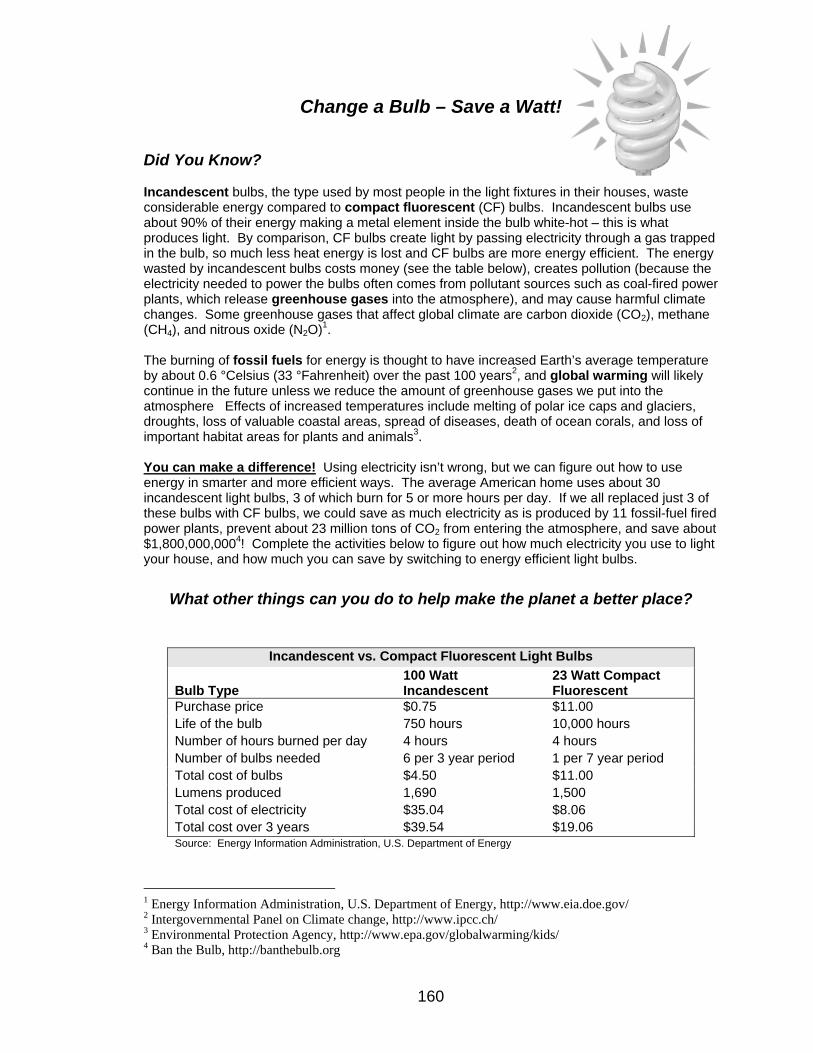
Did You Know? Incandescent bulbs, the type used by most people in the light fixtures in their houses, waste considerable energy compared to compact fluorescent (CF) bulbs. Incandescent bulbs use about 90% of their energy making a metal element inside the bulb white-hot – this is what produces light. By comparison, CF bulbs create light by passing electricity through a gas trapped in the bulb, so much less heat energy is lost and CF bulbs are more energy efficient. The energy wasted by incandescent bulbs costs money (see the table below), creates pollution (because the electricity needed to power the bulbs often comes from pollutant sources such as coal-fired power plants, which release greenhouse gases into the atmosphere), and may cause harmful climate changes. Some greenhouse gases that affect global climate are carbon dioxide (CO2), methane (CH4), and nitrous oxide (N2O)1. The burning of fossil fuels for energy is thought to have increased Earth’s average temperature by about 0.6 °Celsius (33 °Fahrenheit) over the past 100 years2, and global warming will likely continue in the future unless we reduce the amount of greenhouse gases we put into the atmosphere Effects of increased temperatures include melting of polar ice caps and glaciers, droughts, loss of valuable coastal areas, spread of diseases, death of ocean corals, and loss of important habitat areas for plants and animals3. You can make a difference! Using electricity isn’t wrong, but we can figure out how to use energy in smarter and more efficient ways. The average American home uses about 30 incandescent light bulbs, 3 of which burn for 5 or more hours per day. If we all replaced just 3 of these bulbs with CF bulbs, we could save as much electricity as is produced by 11 fossil-fuel fired power plants, prevent about 23 million tons of CO2 from entering the atmosphere, and save about $1,800,000,0004! Complete the activities below to figure out how much electricity you use to light your house, and how much you can save by switching to energy efficient light bulbs.
What other things can you do to help make the planet a better place?
Incandescent vs. Compact Fluorescent Light Bulbs
Bulb Type 100 Watt Incandescent
23 Watt Compact Fluorescent
Purchase price $0.75 $11.00 Life of the bulb 750 hours 10,000 hours Number of hours burned per day 4 hours 4 hours Number of bulbs needed 6 per 3 year period 1 per 7 year period Total cost of bulbs $4.50 $11.00 Lumens produced 1,690 1,500 Total cost of electricity $35.04 $8.06 Total cost over 3 years $39.54 $19.06 Source: Energy Information Administration, U.S. Department of Energy
1 Energy Information Administration, U.S. Department of Energy, http://www.eia.doe.gov/ 2 Intergovernmental Panel on Climate change, http://www.ipcc.ch/ 3 Environmental Protection Agency, http://www.epa.gov/globalwarming/kids/ 4 Ban the Bulb, http://banthebulb.org
160

Collect Data
1. Record the number of light bulbs in each room of your house. Halogen bulbs use more energy than incandescent bulbs, and must be counted three times. If you already use compact fluorescent bulbs in some of your light fixtures, do not count these.
2. Calculate the total number of non-CF bulbs in your house by adding all the numbers in
the first column of your data sheet. Calculate the total number of hours each day you use these bulbs by adding the numbers in the second column of your data sheet. Multiply these two totals together to calculate the total hours of operation for all the non-CF bulbs in your house. You will use this information later in the exercise.
Number of bulbs in each room
Number of hours used each day
Living Room
Dining Room
Family Room
Kitchen
Bedrooms
Bathrooms
Hallways
Basement
Garage
Outside
Other
Total number of non-CF bulbs in your house = ________
Total number of hours used each day = ________
Total hours of operation (number of bulbs x number of hours used each day) = ________
“Watts” Your Use? What would happen if you replaced all the incandescent or halogen light bulbs in your house with compact fluorescent (CF) bulbs? Use the questions below to figure out how much energy you would save in a year. 1. Each energy-efficient compact fluorescent bulb saves 55 watts. How many watt-hours could
you save each day by changing to CF bulbs?
_______ WATT-HOURS SAVED EACH DAY = _______ TOTAL HOURS
USED EACH DAY X 55 WATTS
161

2. Your utility company measures your electricity use in kilowatt-hours (look at your utility bill).
How many kilowatt-hours each day would you save by switching to CF bulbs?
_______ KILOWATT-
HOURS SAVED EACH DAY
= _______ WATT-HOURS SAVED EACH DAY ÷ 1000
3. How many kilowatt hours would you save in a year by switching to CF bulbs?
_______ KILOWATT-
HOURS SAVED EACH YEAR
= _______KILOWATT-
HOURS SAVED EACH DAY
X 365
4. By using less electricity we produce less carbon dioxide (CO2), a greenhouse gas, and every kilowatt hour you save keeps about 2 pounds of CO2 from entering the atmosphere. How much CO2 will you keep out of the atmosphere in a year by changing to CF bulbs?
_______ POUNDS OF CO2
SAVED EACH YEAR
= _______KILOWATT-
HOURS SAVED EACH YEAR
X 2
5. How much money will your family save in a year by switching to CF bulbs? Look on your utility bill to find the amount you pay per kilowatt-hour. The information on your bill should look something like this:
meaning that you pay 9.5¢ per kilowatt-hour. If you don’t know how much your utility company charges, use the rate for Denver, 8.9¢ per kilowatt-hour.
_______ AMOUNT OF
MONEY SAVED EACH YEAR
= _______KILOWATT-
HOURS SAVED EACH YEAR
X COST PER KILOWATT-
HOUR
162

Map Your Use!
Did You Know? Most of us rely on and use dry goods (clothing, cars, books, etc.) and food products that are imported (brought in from outside our region, state, or country). In addition to the resources and raw materials used to grow, process, and manufacture these products money and energy are required to import them to your local stores. Burning fossil fuels for energy to power the trains, airplanes, ships, and trucks that transport goods around the world releases carbon dioxide (CO2), a greenhouse gas, into the atmosphere. The buildup of atmospheric CO2 over the past 100 years has increased global average temperatures by about 0.6 °Celsius (33 °Fahrenheit)5, causing melting of polar ice caps and glaciers, droughts, loss of valuable coastal areas, spread of diseases, death of ocean corals, and loss of important habitat areas for plants and animals6. You can make a difference! Buying imported food and clothing isn’t wrong, but we can figure out how to use energy in smarter and more efficient ways. The average American car releases about 1 pound of CO2 for every mile driven,7 and larger, less-efficient vehicles (trucks, airplanes, ships) release even more CO2. Can you think of some things you can do to reduce resource costs associated with your clothing and food needs? Complete the activities below to figure out where your food and clothing comes from, and how much CO2 was released in transporting it to your local store. Instructions
3. Mark the approximate location of the place where you live on the attached Clothing and Food maps.
4. Choose three pieces of clothing from your closet or dresser, and use the sewn-in tags to
find out where those items were manufactured. Use the data sheet to record a description of each item (ex. “T-shirt,” “jeans”), and locate and mark its place of manufacture on the Clothing map. If the tag lists more than one location (ex. “Fabric made in U.S.A., assembled in El Salvador) mark and label both locations on the map.
5. Choose three packaged food items from your pantry or refrigerator, and use the
packaging to find out where those products were manufactured. Record a description of each item (ex. “cheese,” “Cheerios”) in the data sheet. Locate and mark its place of manufacture on the Food map.
6. Using a ruler and the scale bar underneath each map, calculate the distance from each
of the marked points to the place where you live, and record that distance in the data sheet in the Distance column.
Suggested materials
• World map or atlas • Pencil • Ruler
5 Intergovernmental Panel on Climate change, http://www.ipcc.ch/ 6 Environmental Protection Agency, http://www.epa.gov/globalwarming/kids/ 7 Energy Information Administration, U.S. Department of Energy, http://www.eia.doe.gov/
163

Collect Data
Item description Distance
My Closet
Item description Distance
My Kitchen
Total clothing import distance = ________ miles
Total food import distance = ________ miles
Clothing + food import distance = ________ miles
Compute Your Use Assume that for each mile your clothing and food travel from where they were made to your local store 1 pound of CO2 is released (this is a conservative estimate because larger vehicles release more CO2). How many pounds of CO2 were released in importing the clothing and food listed in your data sheet?
_______ POUNDS OF CO2 RELEASED = _______ TOTAL IMPORT
MILES X 1 POUND CO2
What other things can you do to help make the planet a better place?
164

Clothing Map
Food Map
165 165

APPENDIX B
166

YOUR ECOLOGICAL FOOTPRINT A QUIZ TO HELP YOU UNDERSTAND YOUR IMPACT ON THE EARTH
Have you ever wondered about the amount of resources it takes to support your
lifestyle? Your lifestyle is everything about you: the food you eat, the places you
shop, the house you live in, the cars you or your parents drive, and the things
you throw away. This quiz estimates how much productive land and water is
needed to grow your food, produce building materials, heat, and water for your
house, manufacture and power your cars, and account for the trash and waste
you produce. After taking this quiz you'll be able to compare the resources you
use to the total available amount on this planet (in global acres), and figure out
ways that you can reduce your impact on the Earth.
INSTRUCTIONS
1. For each numbered question find the answer that best describes you
2. Fill in the answer in the labeled boxes on your score sheet
3. Use the score sheet to calculate your footprint for each section (Food, Goods, Shelter, Mobility)
4. To find your total ecological footprint transfer the scores for each section into the boxes in the TOTAL ECOLOGICAL FOOTPRINT grid and calculate your total footprint using the equations provided
**Note: For some sections you will have to multiply or divide your scores by other numbers
SUGGESTED MATERIALS
1. Pencil
2. Calculator
167
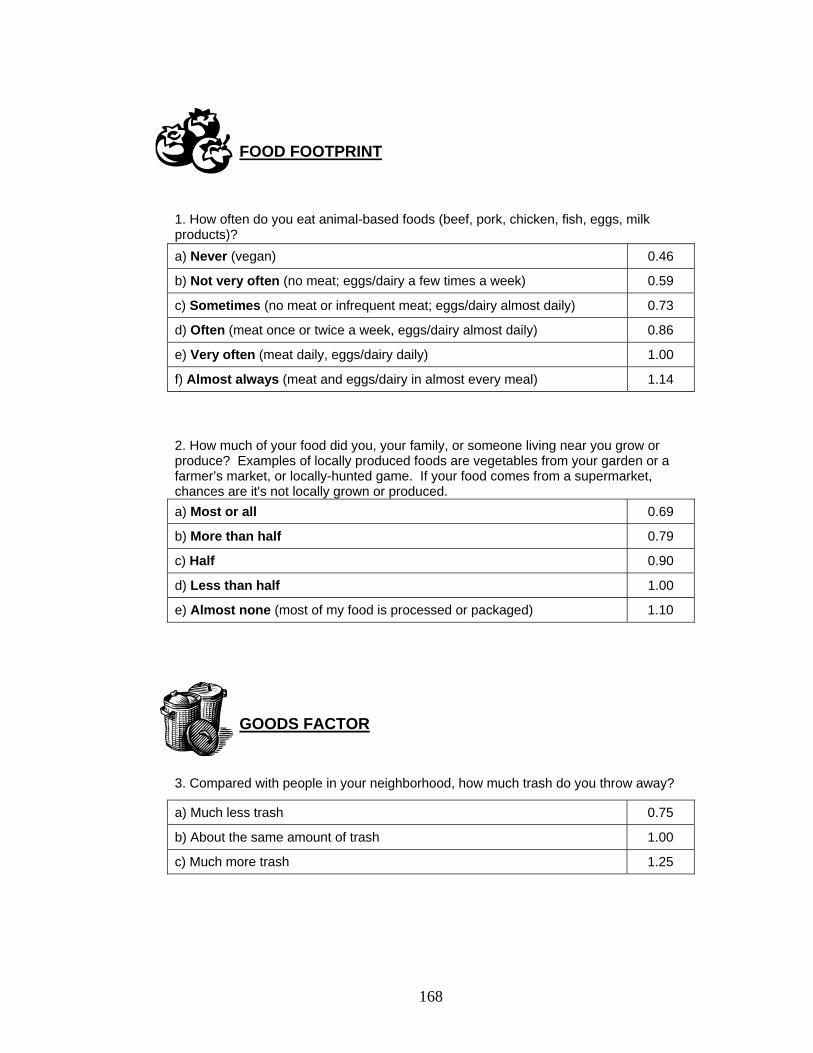
FOOD FOOTPRINT
1. How often do you eat animal-based foods (beef, pork, chicken, fish, eggs, milk products)? a) Never (vegan) 0.46
b) Not very often (no meat; eggs/dairy a few times a week) 0.59
c) Sometimes (no meat or infrequent meat; eggs/dairy almost daily) 0.73
d) Often (meat once or twice a week, eggs/dairy almost daily) 0.86
e) Very often (meat daily, eggs/dairy daily) 1.00
f) Almost always (meat and eggs/dairy in almost every meal) 1.14
2. How much of your food did you, your family, or someone living near you grow or produce? Examples of locally produced foods are vegetables from your garden or a farmer’s market, or locally-hunted game. If your food comes from a supermarket, chances are it's not locally grown or produced. a) Most or all 0.69
b) More than half 0.79
c) Half 0.90
d) Less than half 1.00
e) Almost none (most of my food is processed or packaged) 1.10
GOODS FACTOR
3. Compared with people in your neighborhood, how much trash do you throw away?
a) Much less trash 0.75
b) About the same amount of trash 1.00
c) Much more trash 1.25
168

SHELTER FOOTPRINT
4. Which describes your home?
a) Green-design home (powered by sun or wind; made of recycled materials; energy efficient design and appliances) 0.50
b) Multistory apartment building 0.80
c) Free-standing house 1.00
5. What is the size of your home? (The average U.S. house size is 1,700 square feet.)
a) 500 square feet or smaller (studio apartment; no bedrooms, 1 bath) 0.30
b) 500-1,000 square feet (1 bedroom, 1 bath) 0.60
c) 1,000-1,500 square feet (2 bedrooms, 1 bath) 0.90
d) 1,500-1,900 square feet (2 bedrooms, 2 baths) 1.30
e) 1,900-2,500 square feet (3 bedrooms, 2 baths) 1.50
f) 2,500 square feet or larger (4 bedrooms, 2 baths or larger) 1.90
6. Does your house have energy efficient features (solar panels, compact fluorescent light bulbs, or EnergyStar appliances)?
a) All energy efficient features 0.70
b) Some energy efficient features 0.85
c) No energy efficient features 1.00
7. How many people live in your house, including you? a) Seven or more 7.00
b) Six 6.00
c) Five 5.00
d) Four 4.00
e) Three 3.00
f) Two 2.00
g) One 1.00
169

MOBILITY FOOTPRINT
Car Travel Subtotal
8. On average, how many miles do you travel each week in a car (as a driver or a passenger)? a) 0 miles 0.00
b) 1 - 100 miles 0.12
c) 101 - 200 miles 0.55
d) 201 - 300 miles 1.00
e) 301 - 400 miles 1.43
f) More than 400 miles 1.91
9. How fuel efficient is your car? (or estimate the average fuel efficiency of the cars you ride in.) a) I don't travel by car 0.00
b) Very fuel efficient (More than 50 mpg: hybrid gas-electric cars) 0.31
c) Fuel efficient (35-50 mpg: compact and sub-compact cars) 0.46
d) Somewhat fuel efficient (25-34 mpg: midsize cars and wagons) 0.65 e) Not very fuel efficient (15-24 mpg: smaller sport utility vehicles and trucks) 0.98
f) Not fuel efficient at all (fewer than 15 mpg: full-sized trucks, vans, and SUVs) 1.54
10. How often do you ride in a car with someone else (carpool)?
a) I don't travel by car 0.00
b) Almost always 0.50
c) Very often (about 75% of the time) 0.60
d) Often (about 50% of the time) 0.75
e) Sometimes (about 25% of the time) 1.00
f) Almost never 1.50
170
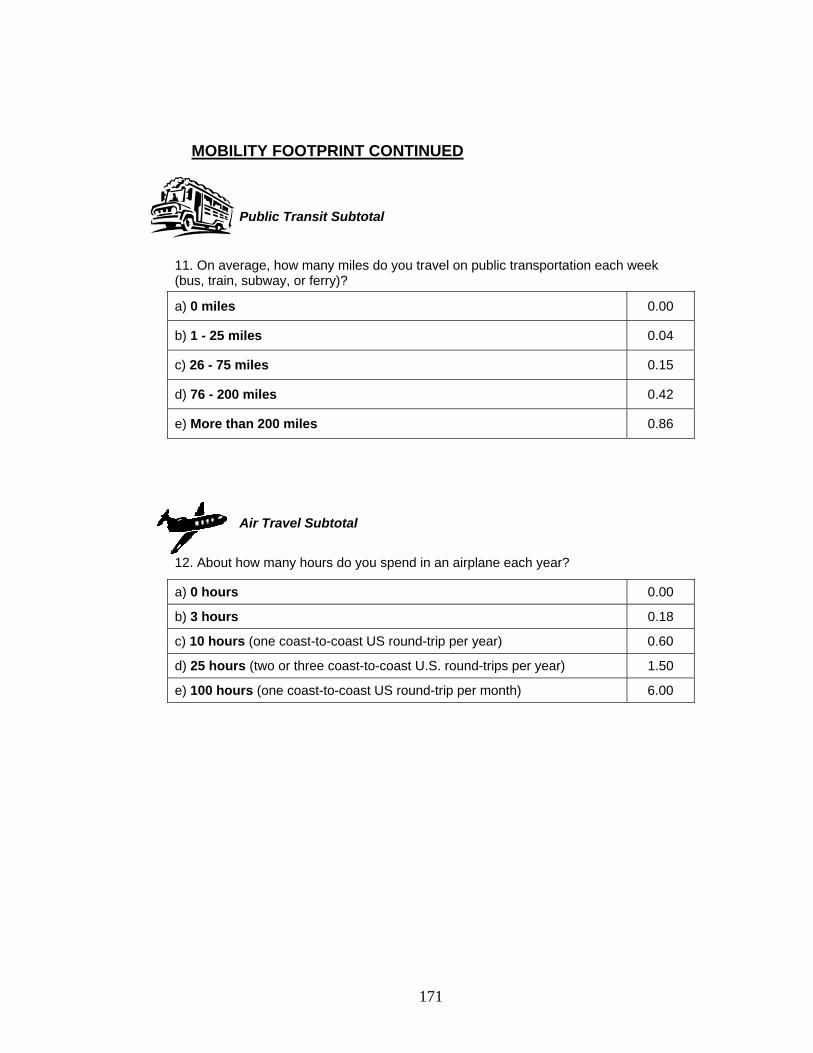
MOBILITY FOOTPRINT CONTINUED Public Transit Subtotal
11. On average, how many miles do you travel on public transportation each week (bus, train, subway, or ferry)?
a) 0 miles 0.00
b) 1 - 25 miles 0.04
c) 26 - 75 miles 0.15
d) 76 - 200 miles 0.42
e) More than 200 miles 0.86
Air Travel Subtotal
12. About how many hours do you spend in an airplane each year?
a) 0 hours 0.00
b) 3 hours 0.18
c) 10 hours (one coast-to-coast US round-trip per year) 0.60
d) 25 hours (two or three coast-to-coast U.S. round-trips per year) 1.50
e) 100 hours (one coast-to-coast US round-trip per month) 6.00
171
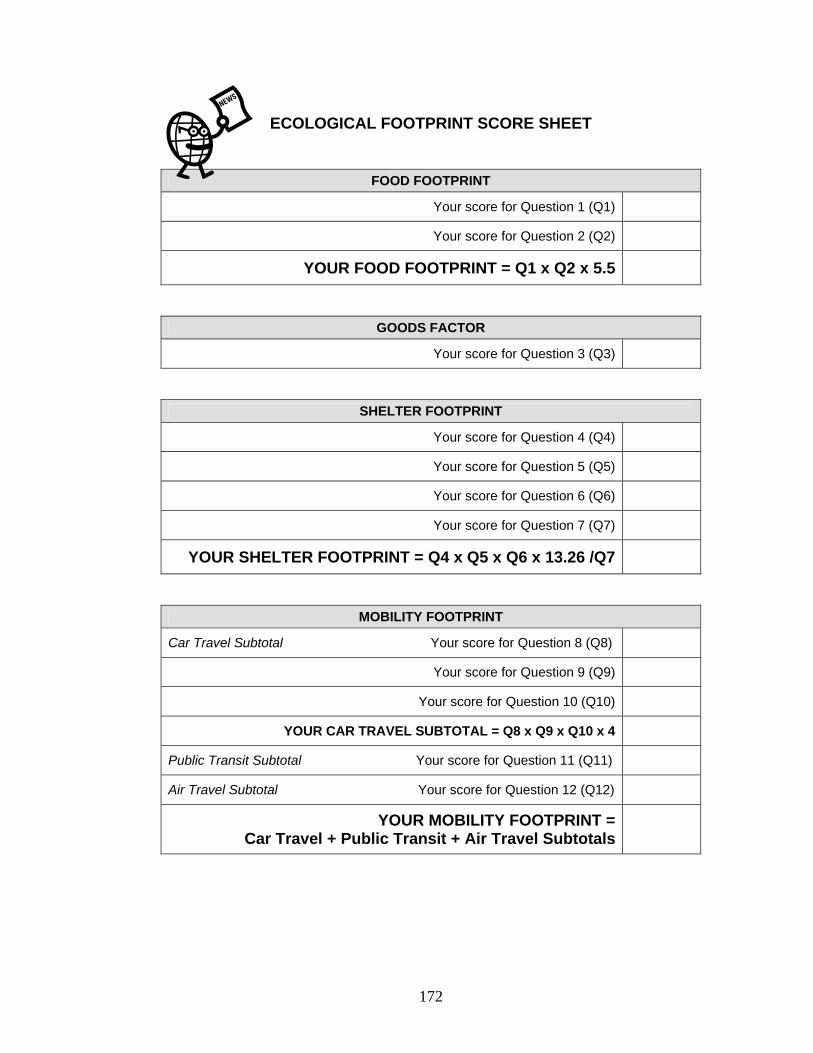
ECOLOGICAL FOOTPRINT SCORE SHEET
FOOD FOOTPRINT
Your score for Question 1 (Q1)
Your score for Question 2 (Q2)
YOUR FOOD FOOTPRINT = Q1 x Q2 x 5.5
GOODS FACTOR
Your score for Question 3 (Q3)
SHELTER FOOTPRINT
Your score for Question 4 (Q4)
Your score for Question 5 (Q5)
Your score for Question 6 (Q6)
Your score for Question 7 (Q7)
YOUR SHELTER FOOTPRINT = Q4 x Q5 x Q6 x 13.26 /Q7
MOBILITY FOOTPRINT
Car Travel Subtotal Your score for Question 8 (Q8)
Your score for Question 9 (Q9)
Your score for Question 10 (Q10)
YOUR CAR TRAVEL SUBTOTAL = Q8 x Q9 x Q10 x 4
Public Transit Subtotal Your score for Question 11 (Q11)
Air Travel Subtotal Your score for Question 12 (Q12)
YOUR MOBILITY FOOTPRINT = Car Travel + Public Transit + Air Travel Subtotals
172

TOTAL ECOLOGICAL FOOTPRINT
(1) FOOD FOOTPRINT
(2) SHELTER FOOTPRINT
(3) MOBILITY FOOTPRINT
(4) GOODS FACTOR
(5) SHELTER + MOBILITY: Add (2) + (3)
(6) GOODS & SERVICES: Multiply (4) x (5) x .9
Total Ecological Footprint = (1) + (2) + (3) + (6)
Your total ecological footprint is the number of global acres needed to provide for
your food, housing, transportation, and to account for the amount of waste you
produce.
To calculate the number of earths needed to support your lifestyle, divide YOUR
TOTAL FOOTPRINT by 4.5, the number of acres available for each person
worldwide.
The average ecological footprint in the United States is 25 acres per person. Is your
footprint higher or lower than the national average?
Because the worldwide footprint is dependent on the number of people (population)
alive today, when the population increases the amount of land available for each
person decreases. Look at the population graph below and predict how this will
affect the number of acres of land available worldwide over time.
Earth's Projected Population Assuming Current Growth Rate
0
10
20
30
40
50
2000 2025 2050 2075 2100 2125 2150
Year
Popu
latio
n (b
illio
ns)
Data source: Redefining Progress http://www.redefining progress.org
173