Embed Size (px)
Citation preview
Ecological Interface Design for MilitaryCommand and ControlKevin B. BennettShannon M. PoseyWright State UniversityLawrence G. ShattuckNaval Postgraduate School
ABSTRACT: The authors use the cognitive systems engineering framework to design andevaluate an interface for military command and control. They discuss analytic tools andprinciples of this framework and provide concrete examples (e.g., work domain analy-ses for U.S. Army tactical operations at the battalion level). They also discuss principlesof ecological interface design, including direct perception, direct manipulation, andthe perception-action loop. The translation between work domain analyses and thespecific characteristics of the interface are made explicit. The authors describe thepotential for this interface to support effective decision making and problem solving,including links with naturalistic decision-making approaches. Evaluations of the inter-face have been positive and are described briefly. Actual or potential applications ofthis research include both specific interface design strategies for military commandand control and general interface design principles for this category of work domain.
Introduction
THE DISCIPLINE OF HUMAN FACTORS AND ERGONOMICS EMERGED AS A DIRECT RESULT OF
problems encountered in military systems during World War II. Advances in tech-nology (e.g., radar and sonar) created new capabilities and opportunities. Thebenefits that these technologies produced were accompanied by occasional failures—some subtle, some spectacular. This brought the need to consider the higher-order“human-machine system” sharply into focus. Technology has advanced at anexponential rate since World War II; military contexts continue to be a breedingground for technological innovation.
Cognitive systems engineering (CSE; Rasmussen, Pejtersen, & Goodstein,1994) is a framework for system design that was originally conceived to deal withthe demands presented by a different category of work domain: process control(e.g., power plants). CSE provides an overarching framework for design compris-ing concepts and analytic tools that can be used to guide system development andto leverage technology. The analytic tools (abstraction and aggregation hierarchies;decision ladder) provide templates for developing models of the domain con-straints and decision-making activities within those constraints. The products of
ADDRESS CORRESPONDENCE TO: Kevin B. Bennett, Department of Psychology, 335 Fawcett Hall, WrightState University, Dayton, OH 45435, [email protected]. Visit the JCEDM Online Companion athttp://cedm.webexone.com.
Journal of Cognitive Engineering and Decision Making, Volume 2, Number 4, Winter 2008, pp. 349–385.DOI 10.1518/155534308X377829. © 2008 Human Factors and Ergonomics Society. All rights reserved. 349
these analyses define the information content that is needed and the contexts inwhich this information will be used. The conceptual distinctions between skill-,rule-, and knowledge-based behaviors provide an efficient way to think abouthuman constraints. These distinctions define the range of behaviors that need tobe supported and the types of information that will be needed. Overall, CSEallows informed decisions to be made with regard to the interface resources (con-trols and displays) that are needed to support work in a domain.
A number of research programs applying the CSE approach to military sys-tems have appeared in recent years (Burns, Bisantz, & Roth, 2004; Burns, Bryant,& Chalmers, 2005; Naikar, Moylan, & Pearce, 2006; Potter, Elm, Roth, Gualtieri,& Easter, 2002; Potter, Gualtieri, & Elm, 2003; Rasmussen, 1998). In this article,we describe another research program with that goal. The CSE approach wasapplied to the design of a command-and-control interface to support mobileArmy decision makers during tactical operations. A virtual ecology was developedthat allows Army decision makers to perceive critical situational factors directly(direct perception), as opposed to reasoning about them. This virtual ecology alsoallows Army decision makers to act directly on objects in the interface to executecontrol input (direct manipulation).
The overall goal was to transform the interaction requirements associated withdecision making and problem solving during tactical operations from cognitive activ-ities (requiring limited-capacity resources such as working memory) to perceptual-motor activities (using powerful and virtually unlimited perceptual resources).Concrete examples of the application of the CSE approach and the virtual ecologythat it produced will be provided. We begin with a description of the workdomain analyses that were performed.
Cognitive Systems Engineering
A fundamental premise of the CSE approach is that a detailed understandingof the work domain is crucial. A number of work domain analyses were con-ducted on Army tactical operations at the battalion level and below. These analy-ses were completed in cooperation with a large number of subject matter experts,including project investigators themselves (a colonel and two majors), active dutypersonnel (e.g., battalion commanders, intelligence officers, and Army ROTC cadre),and Army Research Laboratory personnel (participants in the Advanced DecisionArchitectures Collaborative Technology Alliance Consortium). Army publicationswere also consulted; commanders (brigade and battalion) were observed duringlarge-scale field exercises. The overall results indicate that the scope, complexity,and severity of the challenges presented by this domain are staggering. Thisdomain possesses all classical dimensions of complex, dynamic work domains,including complexity, inherent risk, dynamics, uncertainty, and more (e.g., anintelligent adversary). Specific findings will be organized in terms of the analytictools of CSE: the abstraction hierarchy, the aggregation hierarchy, and the deci-sion ladder.
350 Journal of Cognitive Engineering and Decision Making / Winter 2008
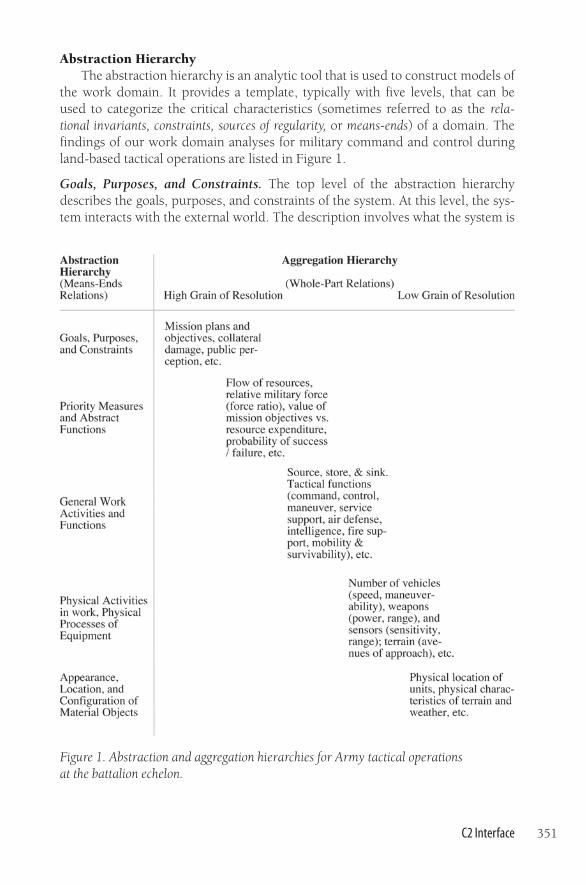
Abstraction HierarchyThe abstraction hierarchy is an analytic tool that is used to construct models of
the work domain. It provides a template, typically with five levels, that can beused to categorize the critical characteristics (sometimes referred to as the rela-tional invariants, constraints, sources of regularity, or means-ends) of a domain. Thefindings of our work domain analyses for military command and control duringland-based tactical operations are listed in Figure 1.
Goals, Purposes, and Constraints. The top level of the abstraction hierarchydescribes the goals, purposes, and constraints of the system. At this level, the sys-tem interacts with the external world. The description involves what the system is
C2 Interface 351
Figure 1. Abstraction and aggregation hierarchies for Army tactical operations at the battalion echelon.
ultimately designed to accomplish (i.e., goals) and the usefulness of that system interms of what it provides to the external world (i.e., purposes). It also describesrestrictions on how the system may achieve those goals (i.e., constraints) thatoriginate from the external world.
An Army battalion’s purpose is to conduct tactical land-based warfare opera-tions. General goals are set by the mission objectives that are obtained from theunit above (i.e., division/brigade). A commander and his or her staff will developmission statements that further specify these goals; the mission statement is ulti-mately translated into more specific goals in the form of operation orders for lower-level units. An important component of these mission plans is the commander’sintent (see more detailed description in the decision-making section that follows).Overall, the goal is to achieve mission objectives through efficient execution.
There are several outside, real-world constraints on the ways in which thesegoals should be accomplished. The resources of the battalion (e.g., equipment,personnel) are finite and valuable; their expenditure must be minimized. Tacticaloperations must comply with military laws (e.g., the Geneva Convention) thatspecify how these operations should be conducted (i.e., rules of engagement).Military personnel and the civil population must be protected to the extent possi-ble; collateral damage should be minimized. Activities should comply with locallaws and customs to the extent possible. Political and public opinion must beenhanced.
Priority Measures and Abstract Functions. The next level down in the hierarchydescribes the intended proper functioning of the system. The description at thislevel involves the flow of resources (e.g., information, money, or resources)through the system in terms of a “general causal network” that is governed byphysical or conventional laws. This can be thought of as a measure of internalconsistency: When the system is functioning properly, domain resources do notjust disappear inexplicably—they flow through the system in an orderly fashion.
The primary abstract function for tactical operations is the property of combatpower (see also Potter et al., 2002). Combat power is the military “force” or poten-tial that can be applied by a unit at a particular location and a particular point intime. Combat power is determined by a variety of factors, including tangible(e.g., the number and type of equipment, personnel, ammunition) and intangible(e.g., morale, leadership, initiative) resources. Combat power is a fluctuating com-modity: Resources are continually flowing into (e.g., logistic reinforcements) andout of (e.g., expended in tactical engagements) the system.
The priority measures at this level include several important considerationsand difficult trade-offs. How valuable or important is the strategic objective interms of higher-order initiatives? How many of the finite resources must beexpended to achieve that objective? What is the probability of success given thecommitment of these resources?
General Work Activities and Functions. The middle level of the hierarchy pro-vides a description of the general functions or activities that must be implemented
352 Journal of Cognitive Engineering and Decision Making / Winter 2008
by the system. These functions are independent of the physical mechanismsthrough which they are implemented. They are the fundamental defining aspectsof the system; they are general descriptions of the capabilities of the system thatallow it to do what it is supposed to do.
Descriptions at this level are extensive for a battalion, including maneuver(e.g., position forces, control terrain), fire support (field artillery, close air support,electronic warfare), air defense (protect from enemy aircraft and missile attacks),intelligence (collect information about enemy, weather, geography, etc.), mobility andsurvivability (eliminate obstacles impeding movement, establish protected fightingpositions), and combat service support (arm, fuel, and fix equipment; logistics).Communication is a general function that cuts across all others. The workdomain analyses reported here, however, focus on the general functions andactivities of command and control. Command includes establishing commanderintent, visualizing future battlefield states, formulating concepts of operations,assigning missions, ranking priorities, allocating resources, conducting risk assess-ments, monitoring current status, and anticipating change. Control includes com-puting requirements, defining limits, allocating means, monitoring status andperformance, projecting change, and developing specific instructions from gen-eral guidance.
Physical Activities in Work, Physical Processes of Equipment. This is the highestlevel in the hierarchy that describes actual physical properties of the system. Thedescription at this level comprises the physical characteristics or activities that areneeded to implement the general functions of the system. At this level, control ofthe system is accomplished, measurement of system variables occurs, and physi-cal functioning of the system is described (e.g., what is connected to what?).
The resources and activities of the battalion at this level are extensive. Onecritical type of information at this level includes the functional characteristics ofthe battlefield equipment. The primary vehicles for friendly forces are the Abramstank and the Bradley fighting vehicle. Each of these two combat vehicles has func-tional specifications that include maximum speed, maximum traversable slope,cruising range, weapons (weapon type, number of weapons, destructive power,disruptive power, range), vulnerability/armor, radiation signatures, ammunitioncapacity, crew requirements, and so on. Other types of equipment include artillery,mortar, sensors, helicopters, communications, unmanned aerial vehicles (UAVs),and so forth. This equipment has important functional characteristics. The equip-ment of the enemy also possesses a similar set of functional characteristics; the dif-ferences between friendly and enemy forces in terms of these functionalcharacteristics play an important role in tactical operations. Functional aspects ofthe terrain (e.g., avenues of approach) fall at this level.
Appearance, Location, and Configuration of Material Objects. The lowest levelin the abstraction hierarchy provides information about the physical makeup ofthe system. What are the physical measurements of a system component? What isthe color of a component? Where is the component located in space? What are the
C2 Interface 353
component’s physical dimensions? The physical characteristics of the battlefieldplay an especially critical role in land-based tactical operations. A primary consid-eration is the battlefield terrain; this places a very stringent set of constraints onwhat can and cannot be done. For example, mountains and rivers are natural bar-riers inhibiting movement. Knowledge with regard to the physical location offriendly and enemy troops, equipment, weapons, and sensors is critical. Physicalfactors associated with the weather are also important (e.g., the presence of cloudscan interfere with the provision of close air support).
Aggregation HierarchyA complementary analytic tool is the aggregation hierarchy, which is used to
provide models of the “part-whole” structure of a domain: the different grains ofresolution (from coarse to fine) that need to be considered. Unlike with the abstrac-tion hierarchy, there is not a specific number of categories that are typicallyacceptable for the aggregation hierarchy. One dimension of aggregation in the bat-talion can be seen in Figure 1 (coarser levels on the left; finer levels on the right).A second dimension, not listed in Figure 1, is the hierarchical organizational struc-ture of the battalion. A battalion is typically composed of three to six units thatconstitute lower-echelon levels (in this article, we assume four: Companies A, B,C, and D). Each company is further divided into three units at a lower echelonlevel (i.e., first, second, and third platoons). Finally, each platoon consists of a spe-cific configuration of combat vehicles, resources, and personnel.
Summary. The abstraction and aggregation hierarchies provide templates for dis-covering the behavior-shaping constraints of a domain. The models that resultprovide alternative categories of information, relationships between categories,and alternative grains of resolution that a practitioner will need to consider whencompleting work in the domain. From a design perspective, these analytic toolsprovide a structured approach for a designer to determine the informational con-tent that needs to be present in the displays.
Skill-, Rule-, and Knowledge-Based BehaviorThe second fundamental set of system constraints is introduced by the cogni-
tive agents who make decisions in the domain. Some of these constraints will arisefrom the specific skills and knowledge that characterize the targeted user popula-tion. For example, users of general information retrieval systems (e.g., the WorldWide Web) will span the range of possible skills and knowledge. In contrast, com-manders and leaders are reasonably homogeneous in terms of their specificknowledge: They are highly trained in the domain, the procedures to be followed,the tools at their disposal, and so forth. Another source of constraints includesgeneral capabilities and limitations of the human cognitive agents. Rasmussen(1983) has characterized these general capabilities as three modes of behavior (orcontrol): skill, rule, and knowledge based.
Skill-based behavior involves high-capacity sensory-motor activities that areexecuted without conscious control. Rule-based behavior involves the recognition
354 Journal of Cognitive Engineering and Decision Making / Winter 2008
of stereotypical situations and the execution of effective procedures that are basedon prior experience. Knowledge-based behavior occurs when the agent is facedwith situations that have not been encountered previously (i.e., problem solving).An interface needs to provide support for all three behavioral modes. However,the order of preference is skill-, then rule-, and finally knowledge-based behavior:Whenever possible, the goal is to allow the user to exercise powerful perception-action skills to the fullest extent possible. These points will be revisited specifi-cally for the RAPTOR interface in later sections.
Military Decision-Making Process (or Analytic Process)Classic explanations of decision making have viewed it as a highly analytic
and cognitively intensive activity. Goals are reasonably well defined, and alterna-tives are carefully weighed and deliberately prioritized in terms of the probabilityof success. The work domain analyses indicated that this conceptualization corre-sponds very closely to the initial stages of planning for Army tactical operations.The Army refers to this as the military decision-making process (MDMP), and ithas been the traditional focus within the military.
The MDMP will be described using the decision ladder, a CSE analytic toolthat provides a template to model critical aspects of decision making in complex,dynamic domains (see Figure 2). The rectangular boxes in this diagram representvarious types of activities, the circles represent states of knowledge that arise fromthese activities, and the solid arrows represent the transitions between activitiesand states of knowledge. As its name implies, the MDMP is a fairly lengthy processthat occurs prior to the actual onset of a tactical engagement. Figure 2 provides asummary of the MDMP. The traditional labels for states and activities in the deci-sion ladder (e.g., Rasmussen et al., 1994) have been refined to reflect the militarydomain (see Rasmussen, 1998). Note also that the dashed arrows in this figure donot represent transitions. Instead, they (and the associated text) provide moredetailed annotations of the activities or states of knowledge in the decision ladder.
Situation Analysis. Decision making formally begins with a mission statementreceived from a higher echelon. An enormous amount of information is gatheredbefore and during a tactical operation. The activities and products of the situationanalysis phase (i.e., the left leg of the decision ladder in Figure 2) provide a neces-sary foundation for both effective initial planning and subsequent execution. Theraw data available are staggering. For example, extremely detailed informationabout friendly combat resources (e.g., the inner temperature of an individualartillery gun’s bore or the gallons of gas in an individual vehicle) can be obtainedin near real time.
As has been noted previously (Woods, 1991), a fundamental problem is toconvert these raw data into meaningful information. A partial listing of informa-tion products that are routinely prepared by Army personnel during data analy-sis/conditioning is shown in Figure 2. These products include the essentialelements of friendly information (EEFI; how to prevent the enemy from seeingme); the friendly forces information requirements (FFIR; how I see myself); the
C2 Interface 355
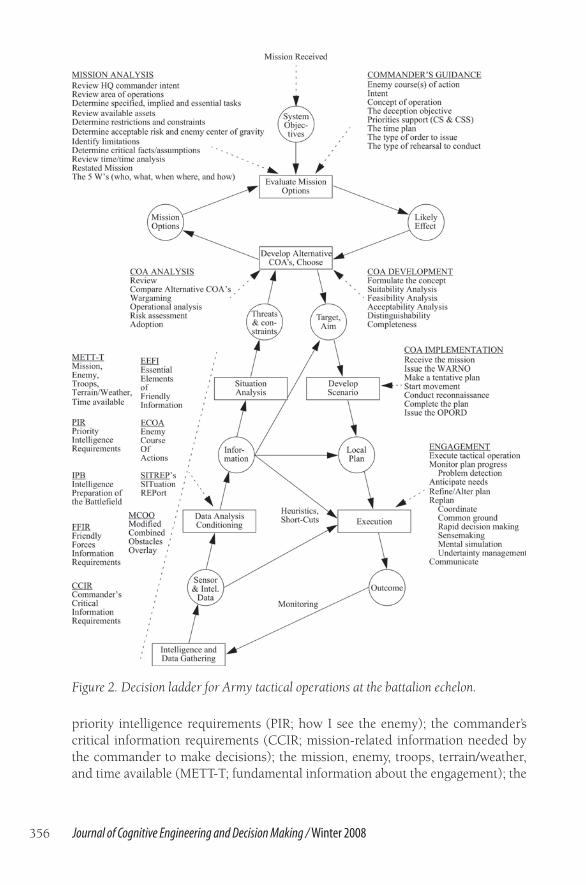
priority intelligence requirements (PIR; how I see the enemy); the commander’scritical information requirements (CCIR; mission-related information needed bythe commander to make decisions); the mission, enemy, troops, terrain/weather,and time available (METT-T; fundamental information about the engagement); the
356 Journal of Cognitive Engineering and Decision Making / Winter 2008
Figure 2. Decision ladder for Army tactical operations at the battalion echelon.
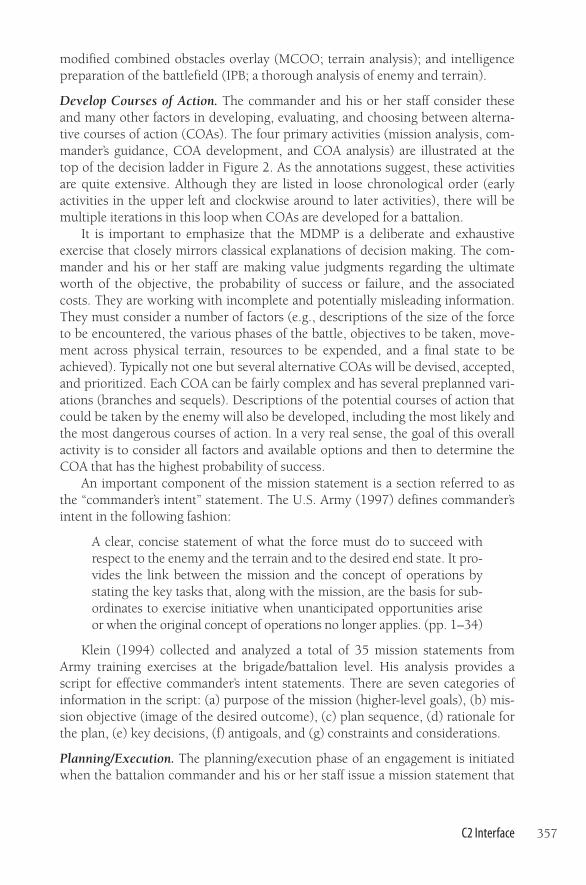
modified combined obstacles overlay (MCOO; terrain analysis); and intelligencepreparation of the battlefield (IPB; a thorough analysis of enemy and terrain).
Develop Courses of Action. The commander and his or her staff consider theseand many other factors in developing, evaluating, and choosing between alterna-tive courses of action (COAs). The four primary activities (mission analysis, com-mander’s guidance, COA development, and COA analysis) are illustrated at thetop of the decision ladder in Figure 2. As the annotations suggest, these activitiesare quite extensive. Although they are listed in loose chronological order (earlyactivities in the upper left and clockwise around to later activities), there will bemultiple iterations in this loop when COAs are developed for a battalion.
It is important to emphasize that the MDMP is a deliberate and exhaustiveexercise that closely mirrors classical explanations of decision making. The com-mander and his or her staff are making value judgments regarding the ultimateworth of the objective, the probability of success or failure, and the associatedcosts. They are working with incomplete and potentially misleading information.They must consider a number of factors (e.g., descriptions of the size of the forceto be encountered, the various phases of the battle, objectives to be taken, move-ment across physical terrain, resources to be expended, and a final state to beachieved). Typically not one but several alternative COAs will be devised, accepted,and prioritized. Each COA can be fairly complex and has several preplanned vari-ations (branches and sequels). Descriptions of the potential courses of action thatcould be taken by the enemy will also be developed, including the most likely andthe most dangerous courses of action. In a very real sense, the goal of this overallactivity is to consider all factors and available options and then to determine theCOA that has the highest probability of success.
An important component of the mission statement is a section referred to asthe “commander’s intent” statement. The U.S. Army (1997) defines commander’sintent in the following fashion:
A clear, concise statement of what the force must do to succeed withrespect to the enemy and the terrain and to the desired end state. It pro-vides the link between the mission and the concept of operations bystating the key tasks that, along with the mission, are the basis for sub-ordinates to exercise initiative when unanticipated opportunities ariseor when the original concept of operations no longer applies. (pp. 1–34)
Klein (1994) collected and analyzed a total of 35 mission statements fromArmy training exercises at the brigade/battalion level. His analysis provides ascript for effective commander’s intent statements. There are seven categories ofinformation in the script: (a) purpose of the mission (higher-level goals), (b) mis-sion objective (image of the desired outcome), (c) plan sequence, (d) rationale forthe plan, (e) key decisions, (f) antigoals, and (g) constraints and considerations.
Planning/Execution. The planning/execution phase of an engagement is initiatedwhen the battalion commander and his or her staff issue a mission statement that
C2 Interface 357
is conveyed to lower-echelon leaders. This represents movement down the rightleg of the decision ladder in Figure 2. The mission statement is complete in thesense that critical information is specified (see previous section). However, thismission statement (and the associated COA) should not be confused with a planfor the engagement. The guidance it contains is fairly general in nature and quiteshort (76–200 words; Klein, 1993). It is the responsibility of the lower-echeloncommanders (in this case, the company commanders) to determine the details ofhow the mission gets accomplished. The lower-level commanders interpret thehigher-level commander’s intent and generate the specific details that are requiredto fill in the mission plan. This division of responsibility and authority provides aninteresting contrast to that in military organizations where plans are implementedprimarily in a top-down manner (i.e., the former Soviet Union).
Thus, the primary goal of the next stage of activity (develop scenario) is toimplement the COA through the development of a mission plan. The resultingmission plans can be quite detailed and complex. Each course of action mightinclude mission goals, detailed plans for lower-level units (e.g., routes of ingressand egress, activities, synchronization points), levels of enemy resistance expected,and acceptable levels of resource expenditures. The mission plan is then commu-nicated to lower-level units (i.e., companies and platoons) for execution throughan operation order (OPORD; see Figure 2).
Intuitive Decision Making (or Naturalistic Decision Making)The next activity is to execute the plan (see the bottom of the right leg in
Figure 2). There is a need, obviously, for decision making and problem solving atthis stage. However, the deliberate, analytic processes used prior to an engagement(i.e., MDMP) are too time-consuming for use during the actual engagement. This isprimarily due to the combination of extreme time pressure and uncertainty thatoccur (i.e., the “fog” of war). The Army recently has recognized a second categoryof decision making. Although initially referred to as the combat decision-makingprocess, it is now referred to as “intuitive” decision making (U.S. Army, 2003).
This distinction parallels recent developments in the decision-making litera-ture, generally referred to as naturalistic decision making. An excellent example isrecognition primed decisions (RPDs; Klein, 1989a). In the first stage of RPD,experts are believed to use perceptual cues, in conjunction with their prior experi-ence, to determine how prototypical a particular case is (e.g., how is this case sim-ilar, or dissimilar, to those that I have encountered before?). Thus, the emphasis ison recognition (as opposed to analytic decomposition). This is followed by a “situ-ational assessment” phase that involves establishing goals, looking for critical per-ceptual cues, developing expectancies about how upcoming events shouldunfold, and identifying typical actions that have proved successful for similar situ-ations in the past.
Contrary to the classical view of decision making, RPD views experts as satis-ficing, not optimizing. Experts do not generate and evaluate all possible solutions.Essentially, viable alternatives are considered in a serial fashion until one that has
358 Journal of Cognitive Engineering and Decision Making / Winter 2008
the potential to work is found. Before implementing a potential solution, expertswill normally engage in a form of “mental simulation” where each step in thepotential solution is checked for its potential to succeed or fail. Thus, experts gen-erate and evaluate only a few “good” alternative solutions and are looking for thefirst solution that has a good chance of working.
The goal at the onset of a tactical engagement will be to complete the missionaccording to the plan (or set of plans) that was developed. During the executionphase, the primary locus of control shifts from higher-level commanders to lower-level leaders and troops who are fighting the battle. Ultimately, lower-level leaderswill base their actions on their understanding of the current battlefield situationand the commander’s intent, as expressed in the mission’s operation order. Plansoften need to be revised, especially when there is an intelligent adversary. In fact,changes to a mission plan are probably the norm rather than the exception. Achange may be as simple as a minor modification of the current COA. A minormodification is defined as one in which the alterations to the plan involve nochanges in goal priorities and no additional changes in coordination betweenunits. These minor modifications will occur spontaneously.
In other cases, entirely new mission plans must be developed. We will refer tothis as replanning. Under these circumstances, leaders might well be trying to deter-mine what the appropriate goal should be, given the current context. In essence,commanders are forced to reenter the problem-solving activities at the top of thedecision ladder, where values and priorities must be considered and traded off andnew courses of action must be determined. As mentioned previously, it is verylikely that commanders will not be searching for an optimal solution but rather willbe considering a very small number of potential solutions that could work.
It is also important to note that replanning efforts may not always be neededas a result of the failure of a current plan or the lack of appropriate branches orsequels. In fact, replanning might be needed because the plan is succeeding farbetter than expected: New opportunities are recognized, but substantial changesin the original plans are needed to seize them. A Warfighter exercise at Ft. Drumprovided a particularly interesting example along these lines: A new COA wasneeded for friendly forces because the original plan was working too well (enemyresistance was far less than expected) as opposed to failing. In this case, the origi-nal mission goals and plans were changed to seize an opportunity that was pre-sented. The new COA maximized their combat power, took advantage of theirearlier successes, and allowed them to take an alternative objective quickly.
The final observation regarding replanning is that this is a course of eventsthat commanders do not undertake lightly. If replanning is required, that meansthat the initial understanding of the ways in which the tactical engagement wouldunfold was incorrect. A commander and his or her staff now need to “go back tothe drawing board” to try to do a better job than the first time around. This will besomewhat more difficult because there will be greater time pressure. A decision toissue new operations orders also entails a great deal of overhead activity (e.g.,communicating new mission plans to all units).
C2 Interface 359
Ecological Interface Design
The work domain analyses described in the previous section form the founda-tion for effective interface design. Ecological interface design (EID; Rasmussen &Vicente, 1990; Vicente & Rasmussen, 1990) is a term that has been used todescribe the translation of these findings into specific designs. As its name implies,EID is inspired by Gibson’s (e.g., Gibson, 1966) work. Rasmussen et al. (1994) statethat “in Gibson’s terms, the designer must create a virtual ecology, which maps therelational invariants [i.e., the behavior-shaping constraints] of the work systemonto the interface in such a way that the user can read the relevant affordances foractions” (p. 129). This will be referred to as direct perception.
Gibson (e.g., 1966) also emphasized that successful interaction with the natu-ral environment depends on a dynamic and continuous “perception-action loop.”This translates into an additional component of ecological interfaces: Resourcesshould be provided that allow users to utilize “high-capacity sensori-motor” skills(Rasmussen, 1986, p. 112) to execute actions. This corresponds to the familiarconcept of direct manipulation.
Direct perception, direct manipulation, and an intact perception-action loop areprinciples that form the foundation of effective interface design. The implementa-tion of these three principles (i.e., the design strategy) will depend on the generalcharacteristics of the underlying work domain. Rasmussen and his colleagues(1994) have developed a continuum for categorizing domains. At one end of a con-tinuum are domains in which the unfolding events arise from the physical structureand functionality of the system itself (e.g., process control). In these “law-driven”domains, highly trained and frequent users respond to demands that are created bythe domain. At the opposite end of the continuum are “intent-driven” domains,where the unfolding events arise from the user’s intentions, goals, and needs (e.g.,information search and retrieval). Users typically interact with these systems on amore casual basis, and their skills, training, and knowledge are more heterogeneous.
The interface design strategy that will be successful for a particular domain isdetermined by the domain’s location on this continuum. The CSE literature hasprovided excellent examples of design strategies for domains that fall at either endof the continuum. The most effective design strategy for law-driven domains is todevelop analogical, geometrical forms that reflect the constraints of the domain(e.g., Vicente, 1991). The most effective design strategy for intent-driven domainsis to develop spatial metaphors (e.g., the desktop metaphor) that relate interactionrequirements to more familiar concepts and activities (e.g., Pejtersen, 1992). Thedesign strategy (or perhaps strategies) appropriate for domains that fall in themiddle of this continuum is less clear. These domains (e.g., hospitals, offices,manufacturing plants; Rasmussen et al., 1994) are characterized by the presenceof both law-driven constraints and intent-driven constraints.
Military command and control is a good example of this domain category.Law-driven constraints arise from an extensive technological core (e.g., weaponry,sensors, communications). However, there are also intent-driven constraints. The
360 Journal of Cognitive Engineering and Decision Making / Winter 2008
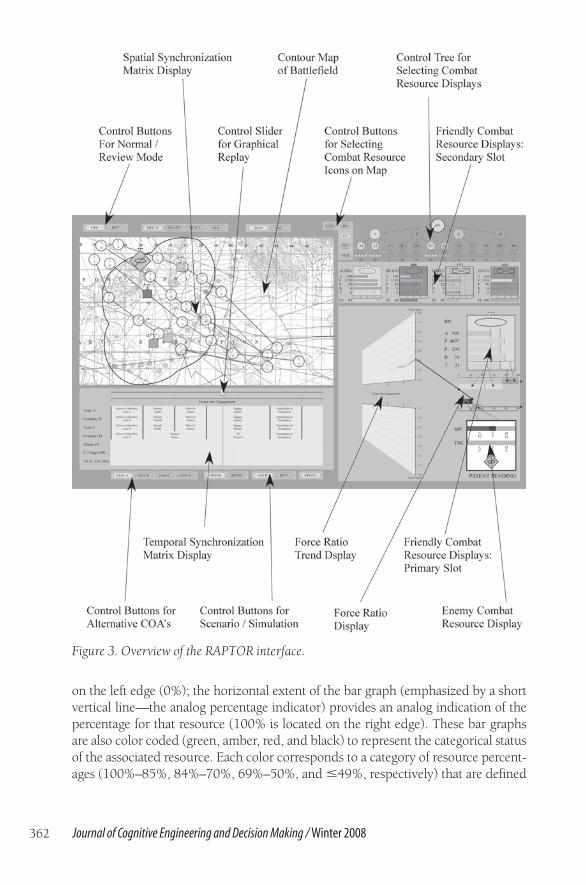
difference in intentions between friendly and enemy forces is by far the most obvi-ous example. However, intent also plays a substantial role within a military organ-ization. For example, during tactical engagements, lower-level leaders base theiractions on an interpretation of the commander’s intent statement in missionorders (e.g., Klein, 1994). The RAPTOR (representation aiding portrayal of tacti-cal operations resources) interface represents one solution to the challenges pre-sented by this category of domain. An overview of this interface is provided inFigure 3. The discussion of this interface will be organized according to the princi-ples of direct perception and direct manipulation.
Direct Perception
The fundamental goal in achieving direct perception is to develop graphicalrepresentations that provide effective mappings between the constraints of thework domain and the constraints of the perceiver. One dimension of this mappingis the extent to which information from all levels of the abstraction hierarchy arerepresented in the displays (i.e., does the virtual ecology provide the informationthat is needed to make effective decisions?). A second dimension of this mappingis the extent to which the displays encode this information using a visual currency(e.g., emergent features or metaphors) that can be used effectively (i.e., can theagent pick up the information that has been encoded into the representation?).
Creating effective graphical representations for a domain is a substantial designchallenge that requires consideration of visual forms, domain constraints, process-ing capabilities, and limitations of the human visual system, creativity, and art.The major displays in the RAPTOR interface will be described now, beginning withadditional details of the work domain analysis that are relevant to its design.
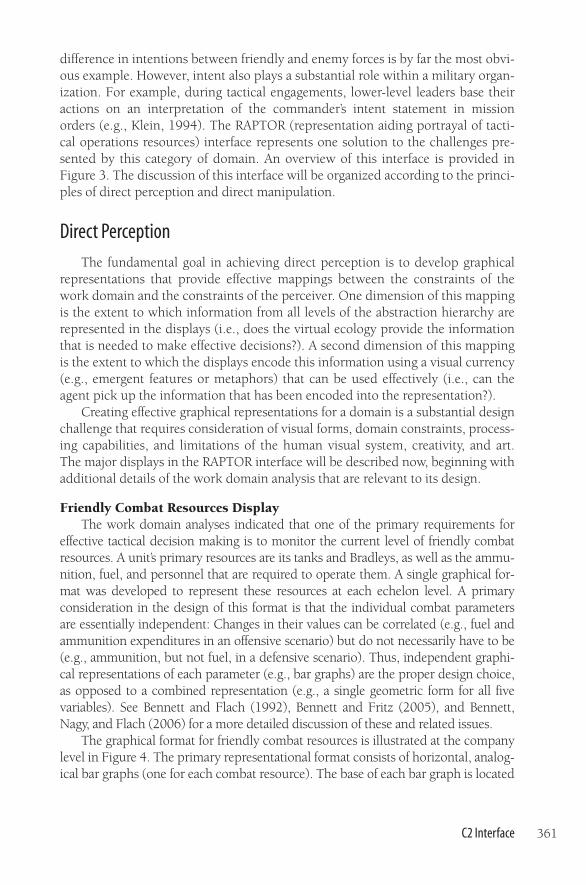
Friendly Combat Resources DisplayThe work domain analyses indicated that one of the primary requirements for
effective tactical decision making is to monitor the current level of friendly combatresources. A unit’s primary resources are its tanks and Bradleys, as well as the ammu-nition, fuel, and personnel that are required to operate them. A single graphical for-mat was developed to represent these resources at each echelon level. A primaryconsideration in the design of this format is that the individual combat parametersare essentially independent: Changes in their values can be correlated (e.g., fuel andammunition expenditures in an offensive scenario) but do not necessarily have to be(e.g., ammunition, but not fuel, in a defensive scenario). Thus, independent graphi-cal representations of each parameter (e.g., bar graphs) are the proper design choice,as opposed to a combined representation (e.g., a single geometric form for all fivevariables). See Bennett and Flach (1992), Bennett and Fritz (2005), and Bennett,Nagy, and Flach (2006) for a more detailed discussion of these and related issues.
The graphical format for friendly combat resources is illustrated at the companylevel in Figure 4. The primary representational format consists of horizontal, analog-ical bar graphs (one for each combat resource). The base of each bar graph is located
C2 Interface 361
on the left edge (0%); the horizontal extent of the bar graph (emphasized by a shortvertical line—the analog percentage indicator) provides an analog indication of thepercentage for that resource (100% is located on the right edge). These bar graphsare also color coded (green, amber, red, and black) to represent the categorical statusof the associated resource. Each color corresponds to a category of resource percent-ages (100%–85%, 84%–70%, 69%–50%, and �49%, respectively) that are defined
362 Journal of Cognitive Engineering and Decision Making / Winter 2008
Figure 3. Overview of the RAPTOR interface.
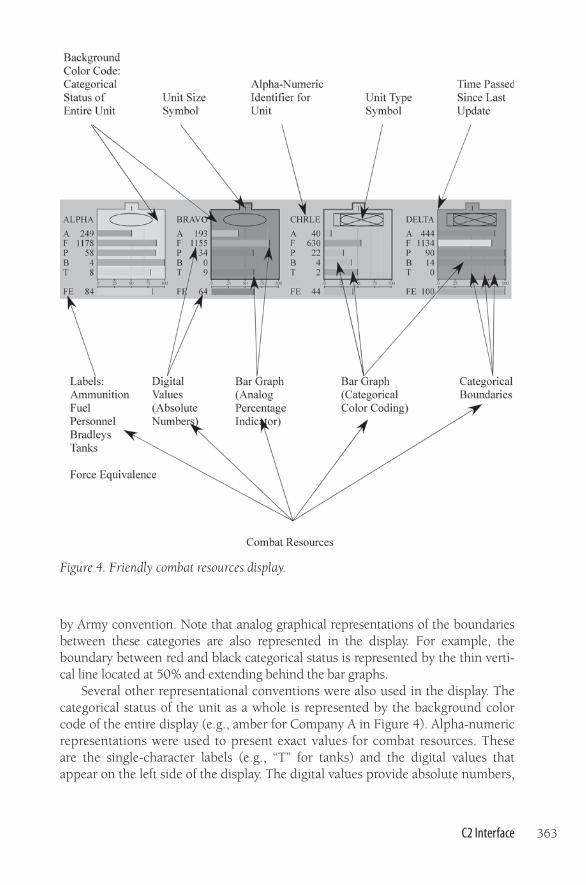
by Army convention. Note that analog graphical representations of the boundariesbetween these categories are also represented in the display. For example, theboundary between red and black categorical status is represented by the thin verti-cal line located at 50% and extending behind the bar graphs.
Several other representational conventions were also used in the display. Thecategorical status of the unit as a whole is represented by the background colorcode of the entire display (e.g., amber for Company A in Figure 4). Alpha-numericrepresentations were used to present exact values for combat resources. Theseare the single-character labels (e.g., “T” for tanks) and the digital values thatappear on the left side of the display. The digital values provide absolute numbers,
C2 Interface 363
Figure 4. Friendly combat resources display.
not percentages. Additional information regarding the unit’s name, size, type,and the amount of time since the last update of information in the display is alsoincorporated.
In summary, three kinds of encoding conventions are used in this display: cat-egorical, analog, and alphanumeric. Together, these representations provide com-manders and leaders with support for a variety of informational needs. Thecategorical color coding is probably the most salient information in the display; itsupports commanders in “spot-checking” or loosely monitoring the overall statusof the unit or a combat parameter. The analog bar graphs provide more preciserepresentations of each combat resource. More important, they provide analoggraphical representations that are particularly useful in determining patterns andrelationships (e.g., the value of parameters relative to each other or to bound-aries). Finally, the digital values provide support when precise values are needed(e.g., when providing other personnel with “slant” summary reports).
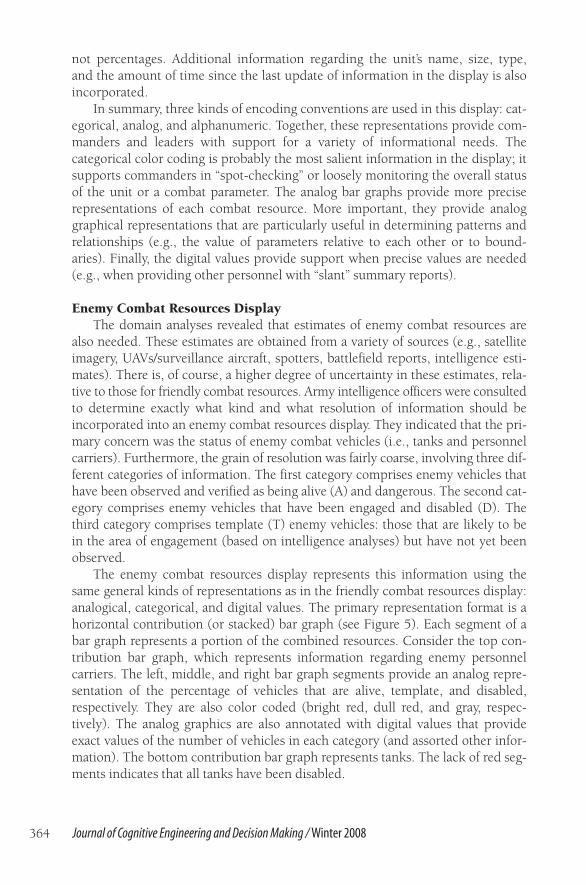
Enemy Combat Resources DisplayThe domain analyses revealed that estimates of enemy combat resources are
also needed. These estimates are obtained from a variety of sources (e.g., satelliteimagery, UAVs/surveillance aircraft, spotters, battlefield reports, intelligence esti-mates). There is, of course, a higher degree of uncertainty in these estimates, rela-tive to those for friendly combat resources. Army intelligence officers were consultedto determine exactly what kind and what resolution of information should beincorporated into an enemy combat resources display. They indicated that the pri-mary concern was the status of enemy combat vehicles (i.e., tanks and personnelcarriers). Furthermore, the grain of resolution was fairly coarse, involving three dif-ferent categories of information. The first category comprises enemy vehicles thathave been observed and verified as being alive (A) and dangerous. The second cat-egory comprises enemy vehicles that have been engaged and disabled (D). Thethird category comprises template (T) enemy vehicles: those that are likely to bein the area of engagement (based on intelligence analyses) but have not yet beenobserved.
The enemy combat resources display represents this information using thesame general kinds of representations as in the friendly combat resources display:analogical, categorical, and digital values. The primary representation format is ahorizontal contribution (or stacked) bar graph (see Figure 5). Each segment of abar graph represents a portion of the combined resources. Consider the top con-tribution bar graph, which represents information regarding enemy personnelcarriers. The left, middle, and right bar graph segments provide an analog repre-sentation of the percentage of vehicles that are alive, template, and disabled,respectively. They are also color coded (bright red, dull red, and gray, respec-tively). The analog graphics are also annotated with digital values that provideexact values of the number of vehicles in each category (and assorted other infor-mation). The bottom contribution bar graph represents tanks. The lack of red seg-ments indicates that all tanks have been disabled.
364 Journal of Cognitive Engineering and Decision Making / Winter 2008
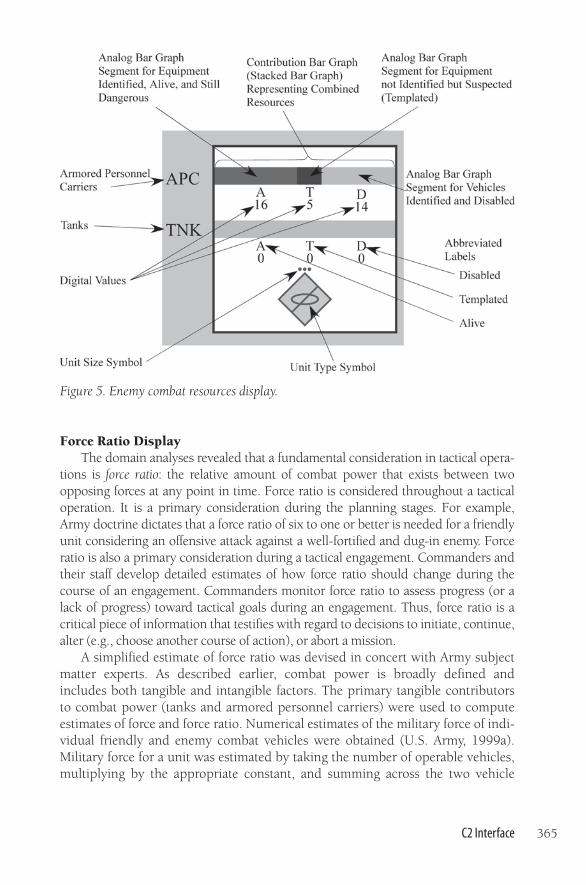
Force Ratio DisplayThe domain analyses revealed that a fundamental consideration in tactical opera-
tions is force ratio: the relative amount of combat power that exists between twoopposing forces at any point in time. Force ratio is considered throughout a tacticaloperation. It is a primary consideration during the planning stages. For example,Army doctrine dictates that a force ratio of six to one or better is needed for a friendlyunit considering an offensive attack against a well-fortified and dug-in enemy. Forceratio is also a primary consideration during a tactical engagement. Commanders andtheir staff develop detailed estimates of how force ratio should change during thecourse of an engagement. Commanders monitor force ratio to assess progress (or alack of progress) toward tactical goals during an engagement. Thus, force ratio is acritical piece of information that testifies with regard to decisions to initiate, continue,alter (e.g., choose another course of action), or abort a mission.
A simplified estimate of force ratio was devised in concert with Army subjectmatter experts. As described earlier, combat power is broadly defined andincludes both tangible and intangible factors. The primary tangible contributorsto combat power (tanks and armored personnel carriers) were used to computeestimates of force and force ratio. Numerical estimates of the military force of indi-vidual friendly and enemy combat vehicles were obtained (U.S. Army, 1999a).Military force for a unit was estimated by taking the number of operable vehicles,multiplying by the appropriate constant, and summing across the two vehicle
C2 Interface 365
Figure 5. Enemy combat resources display.
types. This numerical estimate will be referred to as force equivalence, primarilyto retain the distinction between it and the broader concept of power. An estimateof the force ratio between two opposing forces was obtained by dividing the largerof the two force equivalences by the smaller. A future goal is to devise more com-prehensive estimations of force equivalence (including, for example, artillery, avia-tion, and morale).
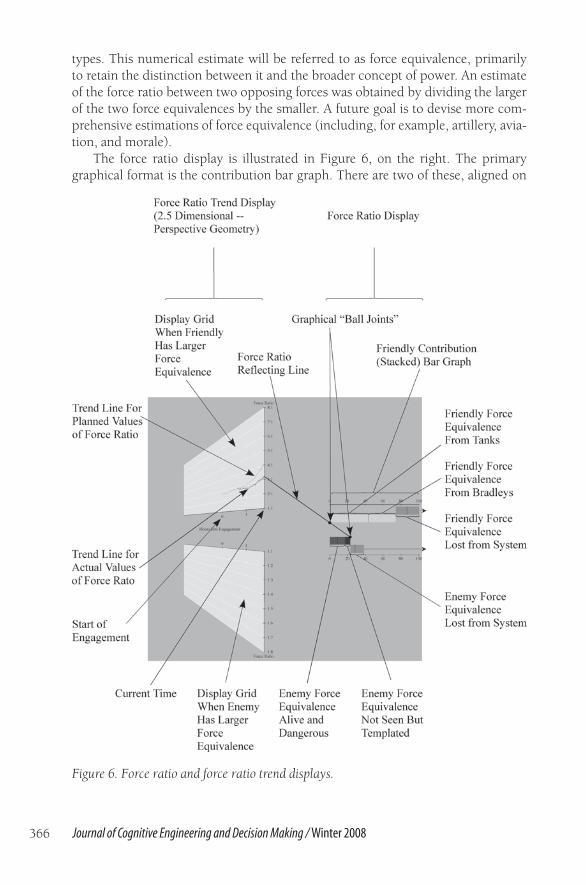
The force ratio display is illustrated in Figure 6, on the right. The primarygraphical format is the contribution bar graph. There are two of these, aligned on
366 Journal of Cognitive Engineering and Decision Making / Winter 2008
Figure 6. Force ratio and force ratio trend displays.

the left-hand side with the origin of the axes; one is for friendly force equivalence(top), and one is for enemy force equivalence (bottom). The friendly contributionbar graph contains two segments on the left (tanks and Bradleys, respectively).These segments represent the force equivalence of current, available resources andare color coded according to the resource’s categorical status. The two segmentson the right (offset vertically and upward) represent disabled tanks and Bradleys(i.e., the military force has exited the system). The enemy contribution bar graphhas four segments on the left: enemy tanks and personnel carriers that are alive(left two segments) and enemy tanks and personnel carriers that are in the tem-plate (right two segments). The two segments on the right (lower, offset) representdisabled vehicles.
Unlike the two previous displays (friendly and enemy resources), the two vari-ables (force equivalence) being represented in this display interact in a lawfulfashion to define a higher-order property (force ratio). This relationship is empha-sized by the force ratio reflecting line, which connects the force ratio and the forceratio trend displays in Figure 6. This line is connected to the two bar graphs, asemphasized by the graphical “ball joints” (Vicente, 1991). The reflecting lineintersects the scale of the force ratio trend display at the exact spot that corre-sponds to the current value of the force ratio. This is ensured by the followinggeometrical properties. Changes in the horizontal extent of the smaller bar graph(the enemy bar graph in Figure 6) push (or pull) the endpoint of the line, therebychanging its orientation. Changes in the horizontal extent of the larger bar graph(the friendly bar graph in Figure 6) push (or pull) the force ratio trend display (theleft graph in Figure 6) toward the force ratio display.
This is an example of a “configural” display that produces “emergent features.”Emergent features are higher-order visual properties that arise from the interactionof lower-level graphical elements (Bennett & Flach, 1992; Bennett & Fritz, 2005;Bennett et al., 2006). The most salient emergent feature produced by the forceratio display is the orientation of the force ratio connecting line (see Figure 6),which dynamically changes as a function of the relationship between friendly andenemy force equivalence. Emergent features can be very salient to the observer;they can provide very powerful decision support when mapped properly into thedomain’s semantics. This is the appropriate design choice when variables interactin a lawful fashion, as is the case for the force ratio display.
An example of the dynamic behavior of this display over time is provided inFigure 7. A fundamentally different configuration is illustrated. The enemy forceequivalence is initially greater than the friendly force equivalence (see Figure 7a).Therefore, the force reflecting line is now anchored at the bottom right corner ofthe friendly bar graph and the upper left corner of the enemy bar graph; the dis-tance from the force ratio and the trend display is equivalent to the length of theenemy bar graph (alive and template segments). Figure 7b illustrates the effect ofsubstantial losses incurred by the enemy approximately 1 hr later. The enemyforce ratio is substantially smaller but still greater than the friendly force ratio; theforce ratio trend display has been drawn successively closer as a result.
C2 Interface 367
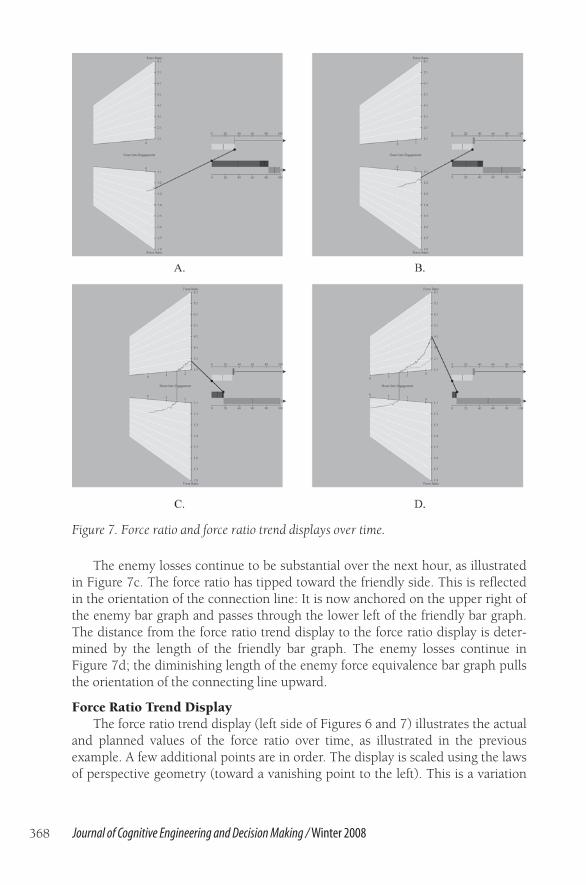
The enemy losses continue to be substantial over the next hour, as illustratedin Figure 7c. The force ratio has tipped toward the friendly side. This is reflectedin the orientation of the connection line: It is now anchored on the upper right ofthe enemy bar graph and passes through the lower left of the friendly bar graph.The distance from the force ratio trend display to the force ratio display is deter-mined by the length of the friendly bar graph. The enemy losses continue inFigure 7d; the diminishing length of the enemy force equivalence bar graph pullsthe orientation of the connecting line upward.
Force Ratio Trend DisplayThe force ratio trend display (left side of Figures 6 and 7) illustrates the actual
and planned values of the force ratio over time, as illustrated in the previousexample. A few additional points are in order. The display is scaled using the lawsof perspective geometry (toward a vanishing point to the left). This is a variation
368 Journal of Cognitive Engineering and Decision Making / Winter 2008
Figure 7. Force ratio and force ratio trend displays over time.
of the time tunnel design technique (Bennett, Payne, & Walters, 2005; Bennett &Zimmerman, 2001; Hansen, 1995) that produces substantial savings in displayreal estate. Trend lines for both actual value and planned values of the force ratiocan be plotted on the display grids. These trend lines provide several emergentfeatures that should be useful to commanders. The trend lines are an analog repre-sentation of the values of the planned and actual force ratios over time. This his-torical trace specifies both the direction and the rate of change for the force ratioacross the engagement. The degree of spatial separation between the planned andactual trend lines provides an analog property that visually specifies discrepancyfrom the plan (an important consideration identified in the domain analyses).This visual property could serve as an early warning that alternative courses ofaction need to be considered or replanning needs to be initiated.
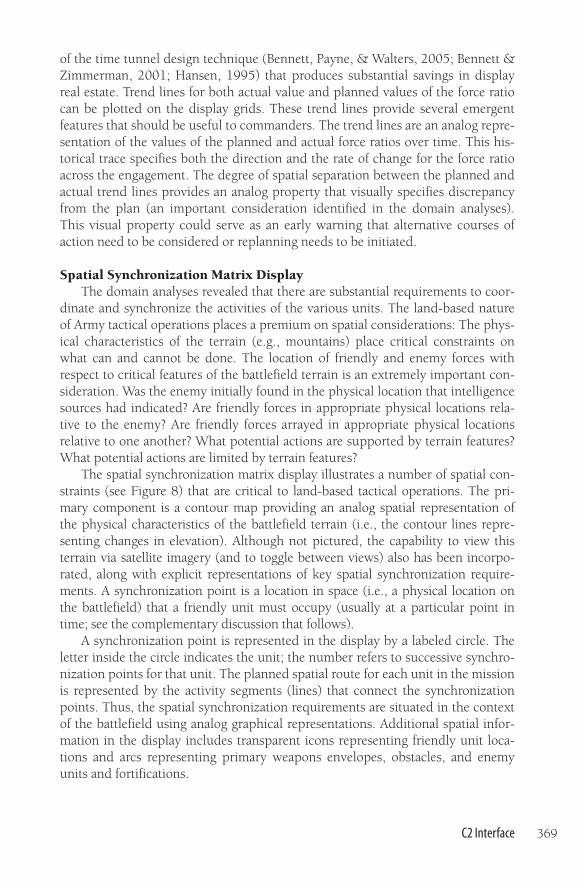
Spatial Synchronization Matrix DisplayThe domain analyses revealed that there are substantial requirements to coor-
dinate and synchronize the activities of the various units. The land-based natureof Army tactical operations places a premium on spatial considerations: The phys-ical characteristics of the terrain (e.g., mountains) place critical constraints onwhat can and cannot be done. The location of friendly and enemy forces withrespect to critical features of the battlefield terrain is an extremely important con-sideration. Was the enemy initially found in the physical location that intelligencesources had indicated? Are friendly forces in appropriate physical locations rela-tive to the enemy? Are friendly forces arrayed in appropriate physical locationsrelative to one another? What potential actions are supported by terrain features?What potential actions are limited by terrain features?
The spatial synchronization matrix display illustrates a number of spatial con-straints (see Figure 8) that are critical to land-based tactical operations. The pri-mary component is a contour map providing an analog spatial representation ofthe physical characteristics of the battlefield terrain (i.e., the contour lines repre-senting changes in elevation). Although not pictured, the capability to view thisterrain via satellite imagery (and to toggle between views) also has been incorpo-rated, along with explicit representations of key spatial synchronization require-ments. A synchronization point is a location in space (i.e., a physical location onthe battlefield) that a friendly unit must occupy (usually at a particular point intime; see the complementary discussion that follows).
A synchronization point is represented in the display by a labeled circle. Theletter inside the circle indicates the unit; the number refers to successive synchro-nization points for that unit. The planned spatial route for each unit in the missionis represented by the activity segments (lines) that connect the synchronizationpoints. Thus, the spatial synchronization requirements are situated in the contextof the battlefield using analog graphical representations. Additional spatial infor-mation in the display includes transparent icons representing friendly unit loca-tions and arcs representing primary weapons envelopes, obstacles, and enemyunits and fortifications.
C2 Interface 369
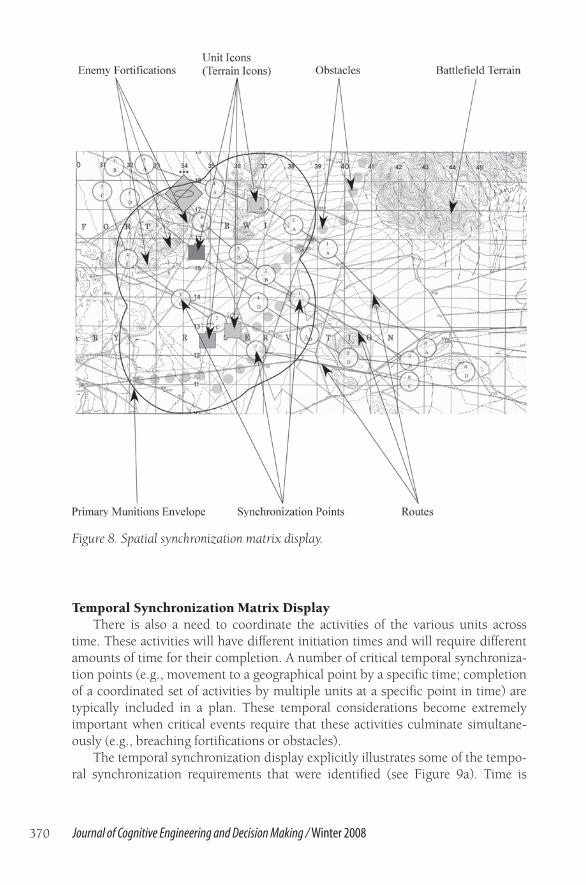
Temporal Synchronization Matrix DisplayThere is also a need to coordinate the activities of the various units across
time. These activities will have different initiation times and will require differentamounts of time for their completion. A number of critical temporal synchroniza-tion points (e.g., movement to a geographical point by a specific time; completionof a coordinated set of activities by multiple units at a specific point in time) aretypically included in a plan. These temporal considerations become extremelyimportant when critical events require that these activities culminate simultane-ously (e.g., breaching fortifications or obstacles).
The temporal synchronization display explicitly illustrates some of the tempo-ral synchronization requirements that were identified (see Figure 9a). Time is
370 Journal of Cognitive Engineering and Decision Making / Winter 2008
Figure 8. Spatial synchronization matrix display.
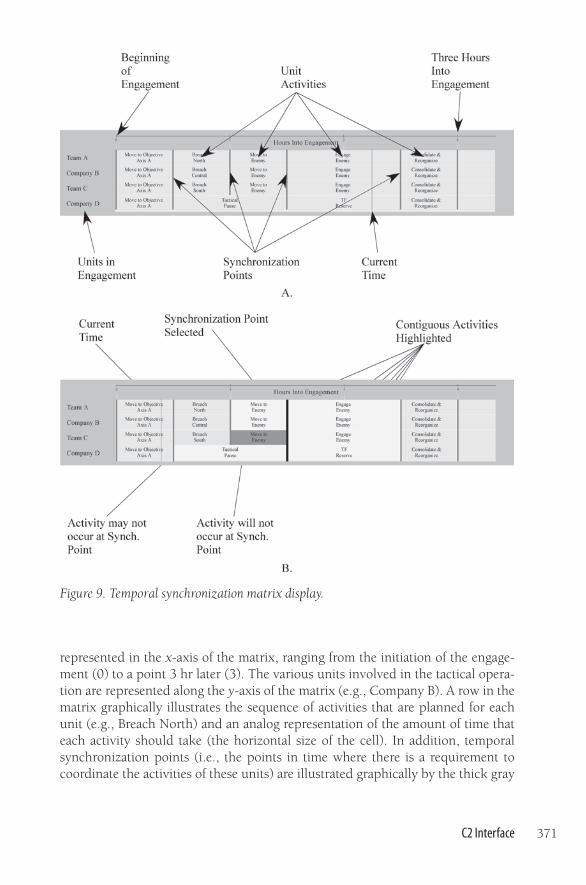
represented in the x-axis of the matrix, ranging from the initiation of the engage-ment (0) to a point 3 hr later (3). The various units involved in the tactical opera-tion are represented along the y-axis of the matrix (e.g., Company B). A row in thematrix graphically illustrates the sequence of activities that are planned for eachunit (e.g., Breach North) and an analog representation of the amount of time thateach activity should take (the horizontal size of the cell). In addition, temporalsynchronization points (i.e., the points in time where there is a requirement tocoordinate the activities of these units) are illustrated graphically by the thick gray
C2 Interface 371
Figure 9. Temporal synchronization matrix display.
lines that run vertically through the display. The present time in the engagement isillustrated by the thin vertical line.
Visual changes in the display indicate the status of various activities withregard to their associated temporal synchronization requirements. For example, inFigure 9b, Team C’s activity of “Breach South” has been highlighted by a change ofcolor (yellow in the actual display). This indicates that this unit is in danger of notcompleting the activity on time. Similarly, the next activity for the same unit(“Move to Enemy”) has also been highlighted (red in the actual display). This indi-cates that the unit will not complete the activity on time (e.g., the unit cannottravel fast enough to reach the destination by the designated time).
Summary. Synchronization requirements are currently represented by an alpha-numeric table in the operations order for a mission, which is clearly not a particu-larly effective representation. The spatial and temporal matrices provide analoggraphical representations of the constraints that are related to these synchroniza-tion requirements. Although these two displays have been described separately,critical events often need to be synchronized in both space and time simultane-ously. Therefore, these two displays have been designed to work together in acomplementary fashion. For example, positioning the cursor over one of the twodisplays will produce visual rollover effects in the associated symbol in the otherdisplay: If the leader places the cursor over a synchronization point in the tempo-ral synchronization matrix, then the corresponding visual information is high-lighted in the spatial synchronization display.
Plan Review Mode and DisplaysThe work domain analyses included the observation of Army commanders
who were participating in large-scale training exercises. Prior to these observa-tions, it was fully expected that commanders and leaders would monitor theprogress of a mission. What came as a surprise was the extent to which that wastrue. In practical terms, commanders were often observed to ask the same funda-mental question—“Where am I relative to plan?”—in a variety of different waysand with respect to a variety of different resources. Thus, commanders monitorednot just the actual status of combat resources but the actual status within the con-text of planned mission activities and resource expenditures. Commanders andleaders need to monitor planned and actual progress in terms of space, time,objectives, resources, goals, intentions, and courses of action for both friendly andenemy forces to make informed command-and-control decisions. At the presenttime, there is very little computerized support to assist leaders in this regard.
A “Plan Review” interface mode was developed to meet this need. This modecan be toggled on and off by pointing and clicking on the “REV” button (upper leftcorner in Figure 3). Two primary changes occur (see Figure 10). The first changeinvolves the spatial synchronization matrix display. A plan icon will appear for anyactual unit icon that is on the map (see the icons with a black “X” in Figure 10a).Each plan icon represents the planned physical location and the planned categori-cal strength of combat power (indicated by color coding) for a unit. Deviations
372 Journal of Cognitive Engineering and Decision Making / Winter 2008
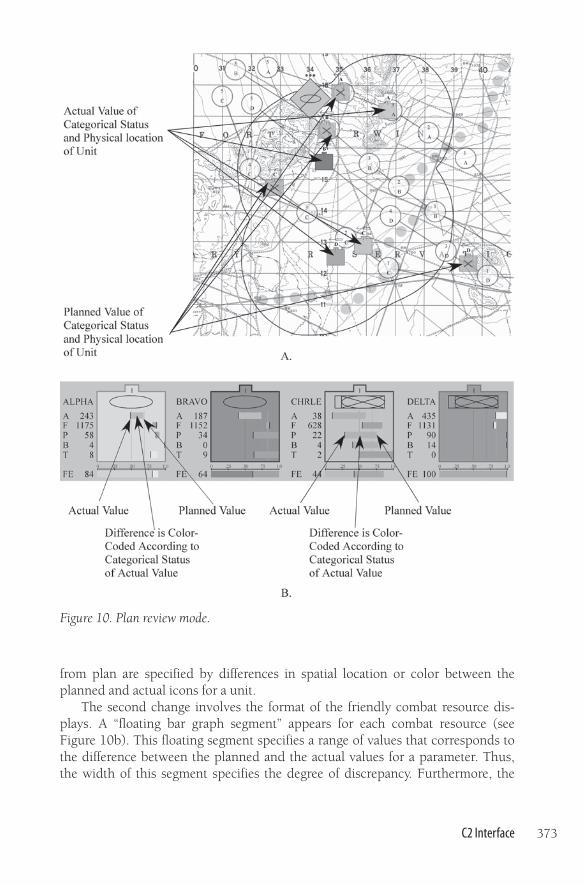
from plan are specified by differences in spatial location or color between theplanned and actual icons for a unit.
The second change involves the format of the friendly combat resource dis-plays. A “floating bar graph segment” appears for each combat resource (seeFigure 10b). This floating segment specifies a range of values that corresponds tothe difference between the planned and the actual values for a parameter. Thus,the width of this segment specifies the degree of discrepancy. Furthermore, the
C2 Interface 373
Figure 10. Plan review mode.
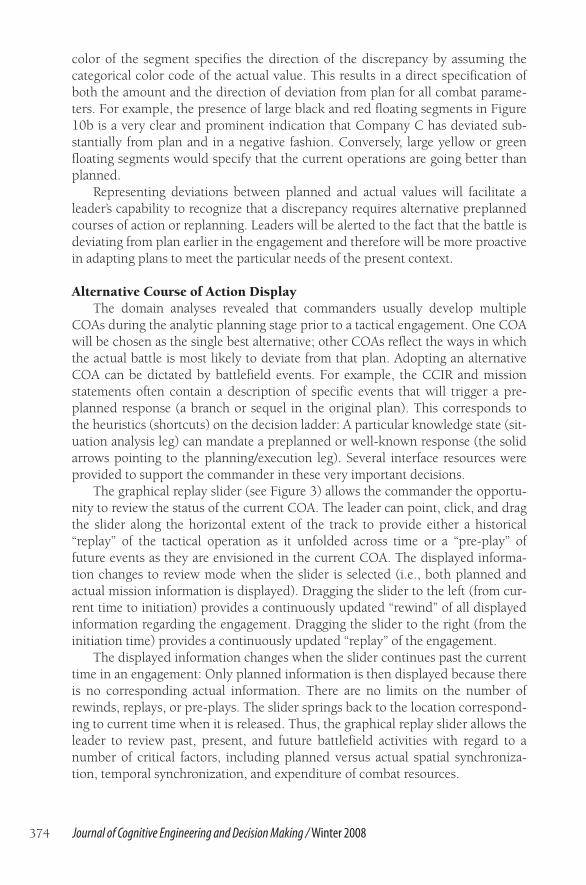
color of the segment specifies the direction of the discrepancy by assuming thecategorical color code of the actual value. This results in a direct specification ofboth the amount and the direction of deviation from plan for all combat parame-ters. For example, the presence of large black and red floating segments in Figure10b is a very clear and prominent indication that Company C has deviated sub-stantially from plan and in a negative fashion. Conversely, large yellow or greenfloating segments would specify that the current operations are going better thanplanned.
Representing deviations between planned and actual values will facilitate aleader’s capability to recognize that a discrepancy requires alternative preplannedcourses of action or replanning. Leaders will be alerted to the fact that the battle isdeviating from plan earlier in the engagement and therefore will be more proactivein adapting plans to meet the particular needs of the present context.
Alternative Course of Action DisplayThe domain analyses revealed that commanders usually develop multiple
COAs during the analytic planning stage prior to a tactical engagement. One COAwill be chosen as the single best alternative; other COAs reflect the ways in whichthe actual battle is most likely to deviate from that plan. Adopting an alternativeCOA can be dictated by battlefield events. For example, the CCIR and missionstatements often contain a description of specific events that will trigger a pre-planned response (a branch or sequel in the original plan). This corresponds tothe heuristics (shortcuts) on the decision ladder: A particular knowledge state (sit-uation analysis leg) can mandate a preplanned or well-known response (the solidarrows pointing to the planning/execution leg). Several interface resources wereprovided to support the commander in these very important decisions.
The graphical replay slider (see Figure 3) allows the commander the opportu-nity to review the status of the current COA. The leader can point, click, and dragthe slider along the horizontal extent of the track to provide either a historical“replay” of the tactical operation as it unfolded across time or a “pre-play” offuture events as they are envisioned in the current COA. The displayed informa-tion changes to review mode when the slider is selected (i.e., both planned andactual mission information is displayed). Dragging the slider to the left (from cur-rent time to initiation) provides a continuously updated “rewind” of all displayedinformation regarding the engagement. Dragging the slider to the right (from theinitiation time) provides a continuously updated “replay” of the engagement.
The displayed information changes when the slider continues past the currenttime in an engagement: Only planned information is then displayed because thereis no corresponding actual information. There are no limits on the number ofrewinds, replays, or pre-plays. The slider springs back to the location correspond-ing to current time when it is released. Thus, the graphical replay slider allows theleader to review past, present, and future battlefield activities with regard to anumber of critical factors, including planned versus actual spatial synchroniza-tion, temporal synchronization, and expenditure of combat resources.
374 Journal of Cognitive Engineering and Decision Making / Winter 2008
The commander also may review the alternative COAs and their fit with thecurrent context. An alternative COA can be made visible temporarily in both thetemporal and spatial matrix displays by positioning the cursor over the appropri-ate button at the bottom of the interface (see Figure 3). Graphical representationsof the new COA replace those of the old COA; elements of the new COA that aredifferent from the old COA will be highlighted in red. This allows the leader toreview an alternative COA in light of current spatial, temporal, and resource con-straints. Moving the cursor away from the button results in the reappearance ofthe original COA. If a leader decides that an alternative course of action is moreappropriate, then this decision can be implemented by clicking on the button(and then verifying that choice). This will initiate the process of communicatingthis change in plan to lower-level units.
Direct Manipulation
Direct manipulation has been discussed extensively in the human-computerinteraction literature. Hutchins, Hollan, and Norman (1986) provided an earlyand influential analysis. Their explanation of direct manipulation was, to a largedegree, couched in terms of technology:
There is a feeling of involvement directly with a world of objects ratherthan of communicating with an intermediary. . . . Actions apply to theobjects, observations are made directly upon those objects. . . . Inputand output languages of the interface . . . [are] interreferential, allow-ing an input expression to incorporate or make use of a previous out-put expression. This is essential for creating the illusion that one isdirectly manipulating the objects of concern. . . . It is because an inputexpression can contain a previous output expression that the user feelsthe output expression is the thing itself and that the operation isapplied directly to the thing itself. This is exactly the concept of “inter-referential I/O.” . . . From this perspective direct manipulation willoccur when the display interface and the control interface have beenmerged together. (pp. 114–115)
Consider a simple example of direct manipulation: dragging an icon into thetrash bin. The object in the task domain (a computer file) is represented by “out-put” in the interface (its icon). The desired command input (deleting the file) isachieved through direct manipulation of the output icon (i.e., point, click, drag,release). Compare this with deleting a file through a command line interface (e.g.,“del unwantedfile.doc [return]”). This command is a request for action that is for-warded to an intermediary (the computer). The object of interest is not being actedupon directly; the manipulation is quite indirect. Similarly, it is important to notethat interaction via a pull-down menu does not constitute direct manipulation: Themenu, not the object, is being manipulated, and it remains a request for action tobe completed by an intermediary.
C2 Interface 375
CSE and EID provide a complementary interpretation of direct manipulationrelative to that proposed by Hutchins et al. (1986). This perspective draws on theoriginal insights of Gibson (e.g., 1966). Human interaction with the real world ischaracterized by powerful perception-action skills. Consider the manipulation ofreal-world objects. An observer sees an object of interest in the real world andreaches for it (i.e., initiates an action). The observer continuously monitors theprogress of the hand/arm toward the object (perception) and continuously cor-rects the trajectory of the hand (action) so that it eventually intercepts the target.This is an example of an open-loop system that relies critically on a feedback loop.In the case of human interaction with the world, this feedback loop is referred toas the perception-action loop (or cycle). Successful completion (grasping theobject) depends on continuous space-time signals that keep the perception-actionloop intact.
From this perspective, the goal of interface design is to build a virtual ecologythat maintains an intact perception-action loop. Thus, dragging an icon into thetrash can involves continuous space-time signals (graphical representations of bothobject and target that are physically located in the display space), skill-basedbehaviors (e.g., visual perception and action), and an intact perception-action loop(user monitors progress toward goal and adjusts movements based on discrepan-cies from goal). In contrast, the continuous space-time signals are missing with acommand line or a pull-down menu; the perception-action loop is broken, notintact. The interface resources that were designed to support direct manipulation(i.e., provide an intact perception-action loop) in RAPTOR will now be described.
Synchronization PointsThe spatial and temporal synchronization matrix displays provide simple
examples of direct manipulation. The visual representations of the synchroniza-tion points in the temporal matrix (i.e., the bold vertical lines in Figure 9a) can bemanipulated directly to adjust the timing of activities. For example, if one unit islagging behind and is clearly not going to make a synchronization point on time(as illustrated in Figure 9b), the leader can point, click, and drag the appropriatevertical line to the right, thereby establishing a later synchronization time.Similarly, a leader can point, click, and drag the graphical representations of thespatial synchronization points (i.e., the circles in Figure 8) to alter the point inspace to which a unit maneuvers. These actions constitute the minor modificationof an existing plan. Ultimately, these modifications could be made visible inshared displays to facilitate communication and thereby the synchronization ofactivities across various units.
Levels of Aggregation. As previously mentioned, a critical requirement in tacticaloperations is to track the status of friendly combat resources. These data arenumerous and complex: Five combat resources (tanks, Bradleys, fuel, ammuni-tion, personnel) exist at a number of different levels, ranging from battalion (1),companies (4), and platoons (12), all the way down to individual vehicles and sol-diers. The simultaneous display of this information is simply not an option, and
376 Journal of Cognitive Engineering and Decision Making / Winter 2008
interface resources that allow a leader to selectively focus at different levels had tobe devised. A related design consideration places additional constraints on thepresentation of this information. We initially reasoned that the best option wouldbe to present combat resources on the battlefield itself (i.e., present resource levelsin the context of terrain features that further restrict potential activities). However,our initial attempts at doing so were rejected by Army subject matter expertsbecause critical terrain information was obstructed. Thus, the requirement totrack friendly combat resources introduced a number of trade-offs and compro-mises; direct manipulation played an important role in the design solution.
Tree ControlThe design solution involved two spatially dedicated areas for the display of
detailed friendly combat resources that were located off the contour map and con-trol mechanisms to change their level of aggregation. As illustrated in Figure 3,one large friendly resource display is presented in a primary slot, and severalsmaller resource displays are presented in a secondary slot. The primary controlmechanism for changing the level of aggregation in these displays is the tree con-trol (see top right portion of Figure 3). The visual appearance of this control mir-rors the hierarchical structure of friendly units, ranging from the battalion at thetop (BN) to individual tanks and Bradleys at the bottom (the symbols at the bot-tom are standard Army representations for tanks and Bradleys; U.S. Army, 1999b).The nodes of the tree are color coded to reflect the categorical status of the unit orvehicle.
The tree control works in the following manner. Pointing and clicking on anode in the tree replaces all current displays (both primary and secondary slots)with the set of displays associated with that node. Consider the configurationillustrated in Figure 3 (battalion display in the primary slot and company dis-plays in the secondary slot). If the leader pointed and clicked on a companynode, then the company-level resource display would appear in the primary slotand the platoon-level resource displays would appear in the secondary slot. If theleader had clicked on a node at the bottom of the tree, then the resources for anindividual vehicle would have occupied the primary slot and information regard-ing the soldiers in that vehicle (e.g., hydration level, core temperature, sidearmammunition) would have occupied the secondary slot. Thus, with one mouseclick, the leader can change the level of aggregation for the detailed display offriendly resources from the battalion level to the level of an individual soldier oranywhere in between.
Terrain Icon ControlsThe design solution outlined in the previous section does not address an
important consideration: the physical location of units, vehicles, and personnel onthe battlefield terrain. Small transparent “terrain” icons were developed to meetthis need; they are placed unobtrusively on the terrain map (see Figures 3 and 8).The lower left corner of an icon corresponds to the physical location of a soldier,vehicle, or unit. These terrain icons also provide some additional information
C2 Interface 377
(e.g., alphanumeric label, unit size indicator, and color coding for overall categori-cal status of the unit).
Avoiding clutter was a primary goal because Army personnel often mentionedthat the presence of too many unit/vehicle icons on electronic battlefield maps is aprimary drawback of existing systems. Therefore, control mechanisms were devisedto allow commanders to change levels of aggregation. The default configurationhas the four company icons on the contour map (see Figure 3). Pointing andclicking on any combat resource display in the primary or secondary slots wouldplace that unit’s terrain icon on the map and remove all others. Sets of terrainicons at a particular level of aggregation can be implemented via the control but-tons located next to the tree control (see Figure 3). For example, pointing andclicking on the “PLT” button places the 12 platoon icons on the map and removesall other terrain icons.
Nodes of the tree control structure can also be selected and manipulated toplace more selective sets of terrain icons on the map. Finally, a leader can “drilldown” within any terrain icon currently on the terrain map: Pointing and clickingon an icon replaces it with all icons at the next level down in the tree structure. Forexample, clicking on a company terrain icon replaces it with the three platoonicons for that company. All other terrain icons are not altered (i.e., they remainpresent). Finally, the simultaneous change of both the terrain icons and the combatresource displays can be achieved by pressing the “LNK” control button. This set-ting produces simultaneous changes in both the resource displays and the terrainicons (i.e., the resource displays in the primary and secondary slots are alwayspresent on the map). These interface resources allow almost any desired configura-tion of displayed information to be achieved within a mouse click or two.
Summary. RAPTOR embraces direct manipulation to the fullest extent. There isno command line; there are no pull-down menus. All potential actions by thecommander are executed directly on objects in the interface. Normally, this willinvolve the direct manipulation of the objects of interest in the interface. Buttonpresses may supersede direct manipulation but only under circumstances wheredirect manipulation would impose cumbersome interaction requirements. Thus,the virtual ecology merges displays and controls, provides continuous space-timesignals, and ensures an intact perception-action loop.
Support for Skill-, Rule-, and Knowledge-Based Behaviors
A fundamental assertion of CSE and EID is that interface resources should beprovided to support skill-, rule-, and knowledge-based modes of behavior. Theresources, provided by the RAPTOR interface that supports each mode, will besummarized in this section. Although each category will be discussed separately, itis important to note that the same interface resource (e.g., a display) can providesupport for all three modes of behavior. Rasmussen (1983) makes this clear: “Thedistinction between the perception of information as signals/signs/symbols [i.e.,
378 Journal of Cognitive Engineering and Decision Making / Winter 2008
skill-/rule-/knowledge-based behavior] is generally not dependent on the form inwhich the information is presented but rather on the context in which it is per-ceived, i.e., upon the intentions and expectations of the perceiver” (p. 260).
Skill-Based BehaviorThe fundamental goal of interface design is to leverage powerful and natural
human skills of perception (e.g., obtaining visual information) and action (e.g.,manipulating objects). Stated alternatively, the interface should be designed so thatdomain practitioners are required to use limited-capacity mental capabilities (e.g.,mental calculations that require working memory) only when it is absolutely nec-essary. The previous sections describing the RAPTOR interface in terms of directperception, direct manipulation, and the perception-action loop provide a detailedaccount of the resources that were designed to support these skill-based behaviors.
Rule-Based BehaviorEffective displays should also provide graphical representations that produce a
rich set of signs to support rule-based behavior. A properly designed interface willconvey the current state of a domain directly to the practitioner through its spa-tiotemporal behavior, thus providing support for the recognition of prototypicalsystem states. In turn, a properly designed interface will suggest the actions that areappropriate (i.e., shortcuts on the decision ladder), at least to expert agents whohave learned the actions and the associated perceptual cues (Rasmussen, 1983).
Consider one example involving the enemy combat resource display (seeFigure 5). Imagine that the display indicates that a large percentage of enemyvehicles have remained in the template category late into the course of an engage-ment. The critical display feature (i.e., the middle segment remaining large) servesas an explicit sign specifying a dangerous possibility: The enemy may well beengaged in a feint maneuver (i.e., the larger enemy unit that is supposed to behere is actually poised to wreak havoc elsewhere). An experienced commanderwould see the perceptual cues provided by the display and realize that a sequenceof activities to test that possibility would need to be performed. Other examples ofvisual cues providing support for rule-based behavior include the following dis-crepancies between planned and actual values: force ratio over time (force ratiotrend display; see Figures 6 and 7), physical locations of units (spatial synchro-nization matrix in review mode; see Figure 10), timing of activities and events(temporal synchronization matrix; see Figure 9), resource levels (friendly combatresources displays in review mode; see Figure 10), and general progress (alterna-tive COA displays).
Thus, the displays in RAPTOR provide a rich set of signs that facilitate aleader’s ability to recognize prototypical situations and that suggest appropriateactions (e.g., further investigations to clarify the situation, the adoption of pre-planned branches or sequels, or the need for more extensive replanning). Leaderswill be alerted to the fact that the battle is deviating from plan earlier in theengagement and will therefore be more proactive in their reactions to meet theparticular needs of the present context.
C2 Interface 379
Knowledge-Based BehaviorWhen plans fail or need to be revised substantially, as is often the case with an
intelligent adversary, commanders and leaders are faced with novel situations (i.e.,circumstances outside of those considered prior to the engagement) and willtherefore be engaged in problem solving. Lewis et al. (2004) summarize observa-tions on knowledge-based behaviors in tactical operations:
Replanning [problem solving] draws on a variety of cognitive activitiesthat emerge in naturalistic settings. . . . It draws on problem detection(to determine that a plan needs to be modified), coordination (toensure the teamwork needed in modifying the plan), common ground(to ensure that the units involved do not hold conflicting views of thesituation), rapid decision making (to judge whether, when and how torevise the plan), sensemaking (to appraise the affordances of friendlyforces in a dynamic setting), mental simulation (to gauge if the revisedplan is likely to be effective), and uncertainty management (to handlethe confusion of modifying a plan in progress). (p. 7)
To support these activities, the displays should provide symbolic representa-tions of critical information at all levels in the abstraction hierarchy. These dis-plays will serve as external models that allow critical constraints and relationshipsto be perceived directly, thereby providing the graphical explanations that are nec-essary for effective problem solving. This symbolic content at each level of theabstraction hierarchy will be briefly described for the RAPTOR interface. Theseare graphical representations of the information listed in Figure 1. The tangibleinformation at the level of goals, purposes, and constraints (highest level in thehierarchy) are mission plans and objectives.
The spatial matrix, temporal matrix, and alternative COA displays containexplicit representations of plans; all other displays contain implicit representa-tions in terms of planned versus actual progress. The primary representations atthe level of abstract function and priority measures are the force ratio and theforce ratio trend displays. These displays show the ebb and flow of military force(as estimated by force equivalence) for friendly and enemy forces. The level ofgeneral functions and activities, to some degree, is implicitly represented in allaspects of the interface because the overall goal is to support the general func-tions of command and control (primarily). There are numerous representationsof information at the level of physical processes and activities. The friendly andenemy combat resource displays represent measured values of combat parame-ters (e.g., tanks, Bradleys, ammunition, fuel, and personnel). Other informationat this level includes the weapons envelope for the primary munitions of bothfriendly and enemy vehicles and a variety of unit-related information (i.e., iden-tification, type, and size symbols). Information at the lowest level of the abstrac-tion hierarchy (physical form and configuration) includes the physicalcharacteristics of the battlefield terrain and the physical location of a unit on thisterrain.
380 Journal of Cognitive Engineering and Decision Making / Winter 2008
It should be noted, however, that the RAPTOR interface does not containmany sources of information that would be critical to a commander and his or hertroops during tactical engagements. Critical elements of the terrain could be rep-resented more effectively (e.g., its impact on routes of travel). The weather exerts atremendous effect on tactical operations, and it is simply not addressed in RAP-TOR. Similarly, information required to support major battle operations systemsoutside of command and control (i.e., maneuver, fire support, air defense, intelli-gence, mobility and survivability, and combat service support) are not provided.
Evaluation
Several formal evaluations of the RAPTOR interface have been conductedusing qualitative simulations of tactical engagements and Army personnel. Forexample, Talcott, Bennett, Martinez, Shattuck, and Stansifer (2007) comparedtwo interfaces (an early version of RAPTOR and a laboratory version of an existingArmy interface) for their capability to support leaders in obtaining informationregarding friendly combat resources. Fifteen statistical comparisons between thesetwo interfaces (main effects or simple main effects) were significant, and all ofthem favored the RAPTOR interface. Several similar controlled laboratory experi-ments have also provided empirical results indicating that the RAPTOR interfaceis more effective than existing interfaces.
Another experiment was conducted to investigate the impact of RAPTOR dis-plays on more complicated aspects of decision making. Sixteen officers from theUnited States Military Academy participated in the study. Fifteen of these partici-pants had previous experience with battalion-level tactical operation centers. Twoversions of RAPTOR were developed: an enhanced version and a baseline version(without the force ratio, force ratio trend, and review mode). Participants assumedthe role of battalion commander and viewed a dynamic, authentic scenario (eitheroffensive or defensive) using one of the two interfaces. The scenario was paused atsix different points that coincided with critical events. During each pause, the par-ticipants were required to complete two questions. The participants were firstrequested to “Please verbally describe the situation as you understand it.” The par-ticipants were then asked, “What actions, if any, would you take at this time?”
It was found that participants who used the enhanced RAPTOR interface exhib-ited a greater tendency to produce references to plans and operations orders. Twiceas many references to mission plans were made by those participants using theenhanced interface (52) than those using the baseline interface (26). Substantiallymore references to the mission operations order were also made by participants usingthe enhanced version (24 vs. 15). The participants offered enthusiastic support forboth versions of RAPTOR, as indicated by the selected quotes listed as follows:
“From a visual standpoint very helpful.”
“I could see that my reserve was falling behind from where they weresupposed to be. That spatial relationship helped a lot.”
C2 Interface 381
“It was very clear watching the battle . . . where I needed to change mypriorities of fire . . . where we were having success and where theywere having success.”
“I could see that decision . . . the display made that decision abun-dantly clear to me.”
“Much more useful than some of the other interfaces I’ve . . . used . . .in Iraq.”
Conclusions
There is a tremendous need for the interface to provide effective decision sup-port for military command and control during tactical operations. Military per-sonnel are subjected to work conditions that can have a serious impact on theircapability to perform in an effective manner. They experience sleep deprivationand extreme physical fatigue. They also experience high degrees of stress, wherethe stakes can involve life or death. It is under these conditions that the benefits ofthe CSE and EID approach (the leveraging of powerful perception-action skillsduring decision making and problem solving) are likely to be magnified. Klein(1989b) reiterates these sentiments for command-and-control interfaces from theperspective of naturalistic decision making:
We must insist that the designers of these systems have appropriaterespect for the expertise of proficient operators and ensure that their sys-tems and interfaces do not compromise this expertise. We must findways to present operators with displays that will make situation assess-ment easier and more accurate. We also want displays that will make iteasier for operators to assess options in order to discover potential prob-lems. In other words, we want to build decision support systems thatenhance recognitional as well as analytical decision strategies. (p. 64)
We believe that the RAPTOR interface, developed from the CSE and EIDdesign framework, represents a good start toward meeting these requirements.The principles of direct perception, direct manipulation, and the perception-action loop have been applied to the development of an interface that should con-tribute to lifting the “fog of war” by allowing leaders literally to “see” constraints,opportunities, and solutions directly in the interface and to act upon them.Leaders are likely to have better understandings of the dynamic and stressful con-ditions arising in the battlefield and should therefore make faster and more effec-tive decisions. Efforts to assess these potential benefits are ongoing. Dynamicscenarios and intelligent adversaries are being developed using a commercial sim-ulator. The goal is to obtain more objective and domain-defined measures of per-formance (e.g., lives and resources saved).
The interface design strategies used in RAPTOR are directly relevant forresearchers developing military decision support. The general approach and the
382 Journal of Cognitive Engineering and Decision Making / Winter 2008
principles of design that have emerged are useful for all application domains thatfall within this general category (i.e., both intent- and law-driven sources of con-straints). For example, see Talcott et al. (2007) for a brief discussion of these prin-ciples applied to flexible manufacturing. A patent application has been filed forthe RAPTOR interface.
Acknowledgments
We thank Silas G. Martinez and Christopher P. Talcott, Army officers whowere investigators during the initial phases of this research project. We also thankJohn Graham, Gregory Fenton, and the officers at the United States MilitaryAcademy who contributed to an extensive evaluation of the interface. The officersof the 4th Brigade, 85th Division (Training Support) generously volunteered theirtime on an earlier evaluation. We also thank the numerous Army officers and civil-ian researchers who provided their valuable input and feedback during the designof the RAPTOR interface. This work was supported through participation in theAdvanced Decision Architectures Collaborative Technology Alliance Consortium,sponsored by the U.S. Army Research Laboratory under Cooperative AgreementDAAD19-01-2-0009.
References
Bennett, K. B., & Flach, J. M. (1992). Graphical displays: Implications for divided attention,focused attention, and problem solving. Human Factors, 34, 513–533.
Bennett, K. B., & Fritz, H. I. (2005). Objects and mappings: Incompatible principles of displaydesign: A critique of Marino and Mahan. Human Factors, 47, 131–137.
Bennett, K. B., Nagy, A. L., & Flach, J. M. (2006). Visual displays. In G. Salvendy (Ed.),Handbook of human factors and ergonomics (3rd ed., pp. 1191–1221). New York: Wiley.
Bennett, K. B., Payne, M., & Walters, B. (2005). An evaluation of a “time tunnel” display formatfor the presentation of temporal information. Human Factors, 47, 342–359.
Bennett, K. B., & Zimmerman, J. (2001). A preliminary investigation of the time tunnels displaydesign technique. Displays, 22(5), 183–199.
Burns, C. M., Bisantz, A. M., & Roth, E. M. (2004). Lessons from a comparison of work models:Representational choices and their implications. Human Factors, 46, 711–727.
Burns, C. M., Bryant, D. B., & Chalmers, B. A. (2005). Boundary, purpose and values in workdomain models: Models of naval command and control. IEEE Transactions on Systems, Manand Cybernetics Part A, 35, 603–616.
Gibson, J. J. (1966). The senses considered as perceptual systems. Boston: Houghton Mifflin.Hansen, J. P. (1995). An experimental investigation of configural, digital, and temporal informa-
tion on process displays. Human Factors, 37, 539–552.Hutchins, E. L., Hollan, J. D., & Norman, D. A. (1986). Direct manipulation interfaces. In D. A.
Norman & S. W. Draper (Eds.), User centered system design (pp. 87–124). Hillsdale, NJ:Erlbaum.
Klein, G. A. (1989a). Recognition-primed decisions. Advances in Man-Machine Systems Research,5, 47–92.
Klein, G. A. (1989b, May). Strategies of decision making. Military Review, pp. 56–64.
C2 Interface 383
Klein, G. A. (1993). Characteristics of commander’s intent statements (Tech. Rep., ContractsMDA903-90-C-0032 and MDA903-92-C-0098). Arlington, VA: U.S. Army Research Institutefor the Behavioral and Social Sciences.
Klein, G. A. (1994). A script for the commander’s intent statement. In A. H. Levis & I. S. Levis(Eds.), Science of command and control: Part III. Coping with change (pp. 75–86). Fairfax, VA:AFCEA International Press.
Lewis, R., Klein, G. A., Klinger, D., Thunholm, P., Bennett, K. B., Smith, P. J., et al. (2004).Preliminary account of replanning in the Army unit of action command post. Adelphi, MD:Collaborative Technology Alliances, Advanced Decision Architectures, U.S. Army ResearchLaboratory.
Naikar, N., Moylan, A., & Pearce, B. (2006). Analysing activity in complex systems with cogni-tive work analysis: Concepts, guidelines, and case study for control task analysis.Theoretical Issues in Ergonomics Science, 7, 371–394.
Pejtersen, A. M. (1992). The Bookhouse: An icon based database system for fiction retrieval inpublic libraries. In B. Cronin (Ed.), The marketing of library and information services 2(pp. 572–591). London: ASLIB.
Potter, S. S., Elm, W. C., Roth, E. M., Gualtieri, J. W., & Easter, J. R. (2002). Using intermediatedesign artifacts to bridge the gap between cognitive analysis and cognitive engineering. InM. McNeese & M. A. Vidulich (Eds.), Cognitive systems engineering in military aviation envi-ronments: Avoiding cogminutia fragmentosa! (pp. 137–168). Wright Patterson Air Force Base,OH: Human Systems Information Analysis Center.
Potter, S. S., Gualtieri, J. W., & Elm, W. C. (2003). Case studies: Applied cognitive work analysisin the design of innovative decision support. In E. Hollnagel (Ed.), Cognitive task design(pp. 653–677). New York: Erlbaum.
Rasmussen, J. (1983). Skills, rules, and knowledge; signals, signs, and symbols; and other dis-tinctions in human performance models. IEEE Transactions on Systems, Man, and Cybernetics,SMC-13, 257–266.
Rasmussen, J. (1986). Information processing and human-machine interaction: An approach to cogni-tive engineering. New York: Elsevier.
Rasmussen, J. (1998). Ecological interface design for complex systems: An example: SEAD-UAV sys-tems (No. EOARD-Contract: F61708-97-W0211). Smorum, Denmark: HURECON.
Rasmussen, J., Pejtersen, A. M., & Goodstein, L. P. (1994). Cognitive systems engineering. NewYork: Wiley.
Rasmussen, J., & Vicente, K. J. (1990). Ecological interfaces: A technological imperative in hightech systems? International Journal of Human-Computer Interaction, 2, 93–111.
Talcott, C. P., Bennett, K. B., Martinez, S. G., Shattuck, L., & Stansifer, C. (2007). Perception-action icons: An interface design strategy for intermediate domains. Human Factors, 49,120–135.
U.S. Army. (1997). Field Manual (FM) No. 101-5-1: Operational terms and graphics. Washington,DC: Headquarters Department of the Army.
U.S. Army. (1999a). Battle Book/ST 100-3. Ft. Leavenworth, KS: U.S. Army Command &General Staff College.
U.S. Army. (1999b). Department of Defense Interface Standard (MIL-STD) No. 2525B: Commonwarfighting symbology. Washington, DC: Headquarters Department of the Army.
U.S. Army. (2003). Field Manual (FM) No. 6-0: Mission command: Command and control of Armyforces. Washington, DC: Department of the Army.
Vicente, K. J. (1991). Supporting knowledge-based behavior through ecological interface design(No. EPRL-91-02). Urbana-Champaign: Engineering Psychology Research Laboratory,Department of Mechanical Engineering, University of Illinois.
384 Journal of Cognitive Engineering and Decision Making / Winter 2008

Vicente, K. J., & Rasmussen, J. (1990). The ecology of human-machine systems II: Mediating“direct perception” in complex work domains. Ecological Psychology, 2, 207–249.
Woods, D. D. (1991). The cognitive engineering of problem representations. In G. R. S. Weir &J. L. Alty (Eds.), Human-computer interaction and complex systems (pp. 169–188). London:Academic Press.
Kevin B. Bennett is a professor of psychology at Wright State University, Dayton, Ohio. Hereceived a PhD from The Catholic University of America. He is a Fellow of the Human Factorsand Ergonomics Society and an editorial board member of Human Factors. His researchinterests are in human-computer interaction, and he is coauthoring a book, Display andInterface Design: Subtle Science, Exact Art.
Shannon M. Posey is a doctoral candidate in the Department of Psychology, HumanFactors, at Wright State University, Dayton, Ohio. She holds an MS in human factors and anM.S. in counseling psychology. Her dissertation examines the efficacy of a prototype inter-face design as well as the impact of uncertainty representations on decision making in thecomplex, dynamic domain of military command and control.
Lawrence G. Shattuck is a senior lecturer and co-director of the Human Systems IntegrationProgram at the Naval Postgraduate School. He received his PhD in cognitive systems engi-neering from The Ohio State University in 1995. He is a retired U.S. Army Colonel with30 years of military service.
C2 Interface 385


![Military Resistance 8K26 Killed by Command[1]](https://img.pdfslide.net/doc/110x75/577d340b1a28ab3a6b8c7e76/military-resistance-8k26-killed-by-command1.jpg)