Embed Size (px)
Citation preview
Ecological interface design for the condenser subsystems of a boiling water reactor
N. Lau, G. A. Jamieson
Department of Mechanical and Industrial Engineering, University of Toronto, 5 King’s College
Road, Toronto, Ontario, Canada, M5S3G8 Abstract Empirical evidence for the performance benefits of Ecological Interface Design (EID) in industrial settings is in short supply. A simulator study is initiated to determine the potential benefits that EID would bring to the nuclear industry. This paper discusses the ecological interface for the condenser subsystems developed to enable this experiment. The design product and anticipated benefits of the ecological interface are described to exemplify the application of EID in the nuclear domain. Keywords: control room, ecological interface design, work domain analysis
1. Introduction Ecological Interface Design (EID), a framework for designing human computer interfaces for complex systems, claims to enhance operator diagnostic performance by specifying information requirements and perceptual features based on formative work analysis and attention to categorizations of human cognitive performance [1]. Although several proof-of-concept designs have been reported for different domains (see [2,3]), the majority of the empirical evidence supporting these claims has been collected using low fidelity simulators that are only marginally representative of industrial settings (see [4]). The paucity of representative studies might impede the adoption of EID in more conservative or heavily regulated industries such as nuclear power. Given that many nuclear power plants (NPPs) around the world are in the process of modernizing their control rooms, empirical evidence regarding the practical benefits that EID might bring to the nuclear industry is invaluable. The Norwegian Institute for Energy Technology (IFE), University of Waterloo (UW), and University of Toronto (UT) have initiated a study to evaluate the EID framework within the HAlden Man-Machine LABoratory (HAMMLAB) using the HAMlab BOiling water reactor simulator (HAMBO). HAMBO is a full-scale simulation of a 1300MW Swedish boiling water reactor plant.
In Proceedings of the 27th Annual Conference of the Canadian Nuclear Society (no pagination). Toronto: Canadian Nuclear Society

As a first step in this investigation, we have developed ecological interfaces for the secondary side of HAMBO. The design responsibility for the ecological interfaces was distributed among the three participating institutions by dividing the secondary side into three sections – turbine [5], condenser, and feedwater subsystems. In this paper, we discuss the design and potential benefits of the ecological interface for the condenser subsystems.
2. The Ecological Interface Design Framework The EID framework [1] specifies a two-stage analysis and design process. The first stage is the Work Domain Analysis (WDA) - a formative work analysis that should lead to a psychologically relevant and physically accurate representation of the work domain. A WDA, commonly consisting of Abstraction Hierarchy (AH) and Part-Whole (PW) models, is a structured framework for discovering domain constraints and invariants as well as parameters that should be contained in the interface [1,3,6]. The AH is a multilevel knowledge representation framework characterized by structural means-ends links between levels (see Figure 1). Structural means-ends links can be conceptualized as ‘why, what and how’ connections amongst entities at adjacent levels of the system representation. Each level of the AH represents the structures (what) of the work domain in a different perspective with the level above and below explaining the purpose (why) and means (how) related to the structures [6]. In process control, an AH typically consists of five levels (Figure 1): Functional Purpose (FP), Abstract Function (AFn), Generalized Function (GFn), Physical Function (PFn), and Physical Form (PFm) [3].
Figure 1: Five-level abstraction hierarchy with the what, why, and how characterization. Adapted
from FIG 7.10 in [6].
For example, in making hot coffee, one of the structures in the AFn level is the first law of thermodynamics as the FP and GFn levels illustrate the purpose is hot coffee and the means is heating, respectively. The different representations of the same domain and their relationships between each other reveal domain invariants and constraints relevant to human information
In Proceedings of the 27th Annual Conference of the Canadian Nuclear Society (no pagination). Toronto: Canadian Nuclear Society

processing. The PW model focuses on documenting the physical connections as well as the physical components, or their aggregates (as units or subsystems). The AH and PW models complete the formative work analysis that permits EID to account for unanticipated events, which are neglected by event-based methods (e.g. task analysis) and/or operator perspectives (e.g. user-centred design) [1]. The second stage of EID involves mapping the identified parameters, constraints, and invariants onto perceptual forms that capitalize on innate human capabilities. These capabilities are described by the Skills, Rules, and Knowledge (SRK) taxonomy. SRK divides human information processing into three qualitative, distinct levels of cognitive control: Skill-Based Behaviour (SBB) that is marked by sensory-motor performance in the absence of conscious control (e.g. walking); Rule-Based Behaviour (RBB) that is marked by the use of “stored rules” derived empirically from prior successful experience (e.g. following a procedure faithfully); and Knowledge-Based Behaviour (KBB) that is marked by conscious processing of information through the application of abstract knowledge (e.g. solving mathematical problems) [7]. In general, cognitive demand increases from SBB to KBB. EID informs the selection of perceptual forms that facilitate the appropriate level of cognitive control for different monitoring and problem-solving activities [1].
3. Work Domain Analysis The WDA of the condenser subsystems produced seven models within the five-level AH at three levels of decomposition (Table 1). The first level of decomposition describes the functioning of the condenser subsystems as a whole with respect to the plant; the second level examines the subsystems with respect to one another; and the third level explores the components within each subsystem. An analyst having no prior knowledge of NPP operation took approximately three person-months to complete the analysis. In addition, a process expert spent ten person-days supporting the analysis work (i.e. half day/week).
Table 1: Products of the work domain analysis of the condenser subsystems.
Level of Decomposition
Number of Abstraction Hierarchies
Number of Part-Whole Models
I 1 1 II 1 1 III 5 5
The PW descriptions were constructed before developing the corresponding AH because PW information was readily available in simulator documentation and piping and instrumentation diagrams. Furthermore, the component information drawn from PW model often informs the PFn level of the AH. Hence, the AHs were also built from the bottom to the top level. Given the PFn level, the GFn level was determined by identifying the processes afforded by the components. The GFn level, likewise, provided starting points for the AFn level by directing the investigation of the first principles that governed the relevant processes. The AFn levels was the most time-consuming to complete because domain invariants are difficult for the novice analyst to learn and verify. Information for building the AFn and GFn levels were acquired from plant
In Proceedings of the 27th Annual Conference of the Canadian Nuclear Society (no pagination). Toronto: Canadian Nuclear Society

documentations, interviews with process experts, and literature research. The FP level was completed last based on plant documentation and verification of process experts. The PF level was absent from the AHs because physical description of the components is not meaningful in a simulator environment. Note that the process of building the AHs differs from the procedure recommended by [3] that suggests to start with the FP level at the top, to continue with the PFn and PFm levels at the bottom, and to finish with the AFn and GFn levels in the middle. In this paper, only the AH and PW at the first level of decomposition are described to demonstrate how such analysis leads to domain invariants pertinent to interface design. To exemplify the true values of the full WDA, a selection of the important domain invariants that are depicted by the final ecological interface are also presented.
The Part-Whole Model The PW decomposition (Figure 2), shows the physical connections amongst the subsystems. For the condenser subsystems, the PW model illustrates how exhaust or bypass steam enters the Condenser and Vacuum System (461), which outputs condensate and off-gases. The condensate is consumed by the Condensate System (462) while the off-gases are treated by the Re-combiner System (348), Off-gas Delay System (341), and Off-Gas Filter System (349). The Condenser and Vacuum System (461) is cooled by seawater circulated by the Main Cooling System (441). The PW models serve as the basis for designing mimic diagrams for this interface to communicate pertinent information on the physical components and their connections of the condenser subsystems.
The Abstraction Hierarchy The AH (Figure 3) depicts system structures further with representations that include higher-order functional information absent in the PW models. At the lowest level, the PFn includes all the physical components similar to the PW model. The level above, the GFn represents the set of processes afforded by the subsystems at the PFn. This level shows, for example, that the cooling seawater is being pumped as a fluid heat sink, thereby facilitating the condensation and vacuum generation processes. The exhaust or bypass steam is condensed for the condensate system. In addition, steam is being supplied to generate suction for the extraction of off-gases. Off-gasses are then treated through chemical reactions, radioactive decay, and adsorption before being vented into the atmosphere. These processes are governed by laws of physical science as recorded in the AFn level. In the process control domain, this level is often characterized by the conservations of mass and energy, illustrating why the processes in the GFn are relevant in acquiring stable operations as well as electricity generation. As most of the processes are related to heat transfer, the field of thermodynamics is particularly applicable. The treatment of off-gasses is largely related to nuclear physics. Due to limited simulator fidelity for some of the processes, the Off-gas Delay System (341) and Off-gas Filter System (349) were excluded from the final interface. At the highest level, the functional purposes of the condenser sub-systems is to condense steam most efficiently with the least amount of pollution. The FP can be used to assess the completeness of the lower levels by verifying that all of the functional purposes can be supported through structural means-ends links.
In Proceedings of the 27th Annual Conference of the Canadian Nuclear Society (no pagination). Toronto: Canadian Nuclear Society

Figure 2: Part-whole model of the condenser subsystems at level 1 decomposition.
Figure 3: Abstraction hierarchy of the condenser subsystems at level 1 decomposition.
In Proceedings of the 27th Annual Conference of the Canadian Nuclear Society (no pagination). Toronto: Canadian Nuclear Society
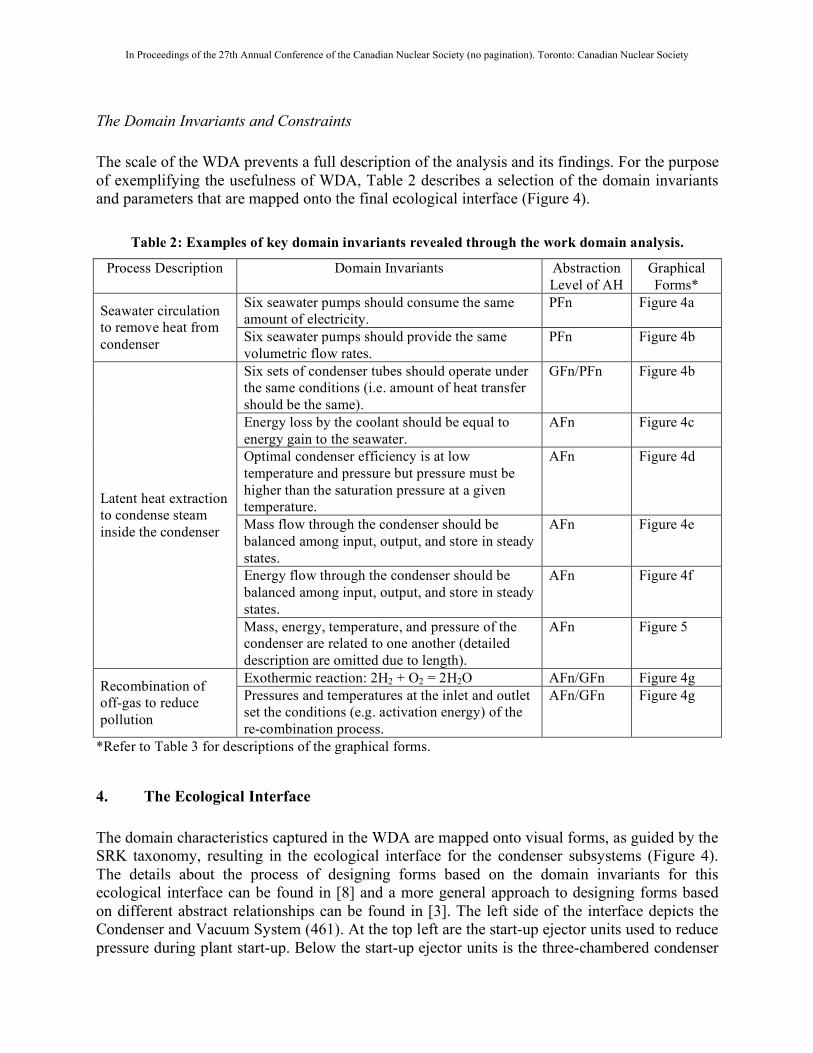
The Domain Invariants and Constraints The scale of the WDA prevents a full description of the analysis and its findings. For the purpose of exemplifying the usefulness of WDA, Table 2 describes a selection of the domain invariants and parameters that are mapped onto the final ecological interface (Figure 4).
Table 2: Examples of key domain invariants revealed through the work domain analysis.
Process Description Domain Invariants Abstraction Level of AH
Graphical Forms*
Six seawater pumps should consume the same amount of electricity.
PFn Figure 4a Seawater circulation to remove heat from condenser Six seawater pumps should provide the same
volumetric flow rates. PFn Figure 4b
Six sets of condenser tubes should operate under the same conditions (i.e. amount of heat transfer should be the same).
GFn/PFn Figure 4b
Energy loss by the coolant should be equal to energy gain to the seawater.
AFn Figure 4c
Optimal condenser efficiency is at low temperature and pressure but pressure must be higher than the saturation pressure at a given temperature.
AFn Figure 4d
Mass flow through the condenser should be balanced among input, output, and store in steady states.
AFn Figure 4e
Energy flow through the condenser should be balanced among input, output, and store in steady states.
AFn Figure 4f
Latent heat extraction to condense steam inside the condenser
Mass, energy, temperature, and pressure of the condenser are related to one another (detailed description are omitted due to length).
AFn Figure 5
Exothermic reaction: 2H2 + O2 = 2H2O AFn/GFn Figure 4g Recombination of off-gas to reduce pollution
Pressures and temperatures at the inlet and outlet set the conditions (e.g. activation energy) of the re-combination process.
AFn/GFn Figure 4g
*Refer to Table 3 for descriptions of the graphical forms.
4. The Ecological Interface The domain characteristics captured in the WDA are mapped onto visual forms, as guided by the SRK taxonomy, resulting in the ecological interface for the condenser subsystems (Figure 4). The details about the process of designing forms based on the domain invariants for this ecological interface can be found in [8] and a more general approach to designing forms based on different abstract relationships can be found in [3]. The left side of the interface depicts the Condenser and Vacuum System (461). At the top left are the start-up ejector units used to reduce pressure during plant start-up. Below the start-up ejector units is the three-chambered condenser
In Proceedings of the 27th Annual Conference of the Canadian Nuclear Society (no pagination). Toronto: Canadian Nuclear Society

Figure 4: Ecological interface for the condenser subsystems.
In Proceedings of the 27th Annual Conference of the Canadian Nuclear Society (no pagination). Toronto: Canadian Nuclear Society

embedded with three pressure trend graphs and level trend graphs. Directly below the condenser are the mass balance, energy balance, and pressure-temperature graph of the condenser, integrated as a complex graphical element. To the left of the condenser (i.e. pressure and level trend graphs) are the regular ejector units with two identical graphics to monitor valve operations. The top and bottom of the right side are allocated to the Re-combiner System and the Main Cooling System, respectively. The two re-combiners are monitored with two pressure-temperature graphs while the cooling process using seawater is depicted by six temperature-volume graphs. In between the pressure-temperature graph of the condenser and the Main Cooling System is another energy balance, in which the left and right bars represent energy loss from the steam and energy gain to the seawater, respectively.
Graphical Forms for Domain Information The condenser ecological interface consists of graphical forms depicting the domain invariants listed in Table 2 that are relevant for monitoring and problem solving. Table 3 describes the anticipated benefits of the graphical forms in reducing cognitive effort.
Table 3: Functions and conceptual benefits of the graphical forms in the ecological interface.
Graphical Form*
Description and Function* Conceptual Benefits
Figure 4a Six connected bar graphs depict the electricity consumptions of the six seawater pumps. These should be the same under normal operations. Abnormal operations (i.e. unequal consumption) break the formation of a horizontal line that depicts normal operations across the six pumps, as exemplified by the second pump from the right.
• Distinguish normal from abnormal system states with the emergent feature of connecting lines (SBB) rather than multiple comparisons of numerical values (KBB)
• Single out abnormal equipment in the set or illustrate abnormal operations for the entire set.
Figure 4b Six adjacent, two-dimensional graphs depict temperatures (vertical axis) versus flow rates (horizontal axis) at the inlets and outlets of six sets of condenser tubes. These should have the same values under normal conditions. The inlet and outlet measurements of the seawater temperature and flow rate are connected with a line such that line angle indicates the degree of mass flow change (with a vertical line indicating no change) and line length indicates the extent of heat transfer. The six lines should look exactly the same in normal conditions. Malfunctions of the condenser or seawater pumps violate this symmetry, as exemplified by the fourth line from the right.
• Illustrate extent of heat transfer with lengths of lines (SBB) rather than multiple comparisons of numerical values (KBB).
• Single out abnormal equipment in the set or illustrate abnormal operations of entire set.
In Proceedings of the 27th Annual Conference of the Canadian Nuclear Society (no pagination). Toronto: Canadian Nuclear Society

Graphical Form*
Description and Function* Conceptual Benefits
Figure 4c The connected bar graphs depict the energy transfer inside the condenser that should be balanced in steady states. The bar at left represents the heat loss from steam and the bar at right represent heat gain to seawater. The line connecting the two bar graphs forms an emergent feature that conveys whether energy lost by steam are equal to energy gained by seawater.
• Provide an unambiguous indicator of the stability of the heat transfer process inside the condenser using a single variable.
• Distinguish normal from abnormal system states.
• Indicate changes in heat transfer efficiency with angles of a line (SBB) rather than numerical computation (KBB).
Figure 4d This graph depicts the actual states, expected values, and constraints of the condensate temperature and condenser pressure. The white dot and the blue diamond depict the actual and expected values respectively. The saturation curve (i.e. grey diagonal line) is superimposed on the graph to depict the ecological constraint. The pressure and temperature should never go below the saturation curve as condensate in the condenser would evaporate due to the low pressure, resulting in loss of coolant. There is also one vertical and one horizontal line in the centre of the graph depicting the alarm limit for temperature and pressure, respectively.
• Illustrate deviation of the actual from the expected values spatially (SBB) rather than arithmetic computation (KBB).
• Provide appropriate context (domain constraints) for the temperature and pressure indicators.
Figure 4e A mass balance depicts mass flows through the condenser that should be balanced under normal conditions. The coolant inflow and outflow of the condenser are represented by the two connected bar graphs at the top and bottom, respectively. The vertical bar graph in the center represents the amount of condensate reservoir in the hotwell. The angles of the line connecting the two bar graphs perceptually illustrate the rate of change for the condensate reservoir, with the vertical line illustrating zero rate of change. The reservoir level depicts the buffer condensate available for the feedwater system. In steady states, the inflow and outflow should be equal assuming the mass reservoir is unchanged.
• Illustrate future changes in reservoir volume with angles of lines (SBB) rather than arithmetic computation (KBB).
• Illustrate robustness of the system in maintaining coolant flows. (e.g. Low inflow rate and condensate reservoir with high outflow rate could project a plant shutdown due to lack of coolant for the feedwaters system.)
• Distinguish normal from abnormal system states.
In Proceedings of the 27th Annual Conference of the Canadian Nuclear Society (no pagination). Toronto: Canadian Nuclear Society

Graphical Form*
Description and Function* Conceptual Benefits
Figure 4f This graphical form depicts the energy flows through the condenser that should be balanced under normal conditions. The energy inflow and outflow of the condenser are represented by the two connected bar graphs at the top and bottom, respectively. The vertical bar graph in the center represents the energy stored in the condensate in the hotwell. The angles of the connecting line of the two bar graphs perceptually illustrate the rate of change for the energy reservoir, with the vertical line illustrating zero rate of change. Steady state is depicted by a balance of energy input and output, assuming that the energy reservoir is unchanged.
• Illustrate robustness of the system cooling with a bar graph (SBB) rather than arithmetic computation for energy (KBB). (e.g. High-energy reservoir suggests cooling problems that could take a substantial amount of time to resolve.)
• Provide an unambiguous indicator of the stability of the condensation process in thermodynamic terms (i.e. heat balance).
Figure 4g This graphic is a re-combiner tank containing a pressure-temperature graph that illustrates the measurements and constraints at the inlet and outlet for the recombination process. The normal operating region in terms of pressure and temperature at both the inlet and outlet points are marked (with two rectangles) inside the re-combiner tanks. Because recombination of oxygen and hydrogen is exothermic, the line connecting the inlet and outlet measurements becomes an indicator of recombination reaction rate.
• Provide estimate on the extent of exothermic reaction with lengths of a line (SBB) rather than arithmetic computation (KBB).
• Provide appropriate context (domain constraints) for the temperature and pressure measurements at the inlet and outlet.
Figure 5 This graphical unit is composed of the mass balance (Figure 4e), energy balance (Figure 4d), and temperature-pressure graph (Figure 4f) of the condenser to depict system states based on the domain relationships of the four parameters. The black line connecting the energy reservoir to the white dot of the graph illustrates the relationships between the energy, temperature and pressure. The length of this black line is an indicator of condenser efficiency. As the condenser gains efficiency, indicated through low temperature and pressure (i.e., as the white dot moves downward and to the left on the graph), the black line increases in length. The blue line connecting the blue diamond and energy reservoir shows the ideal energy level based on the expected temperature and pressure (i.e. blue diamond). The blue line also marks the energy reservoir target where the black energy line should be located. Large deviations between the black and blue line could be a major concern as stable shift between energy states is usually slow.
• Illustrate condenser efficiency with lengths of lines (SBB) rather than numerical computation (KBB).
• Illustrate the connections between two representations of the condenser in operations. (i.e. AFn representation in terms of mass and energy and GFn representation in terms of temperature and pressure).
*Reference Table 2 for a subset of domain invariants discovered through the full WDA.
In Proceedings of the 27th Annual Conference of the Canadian Nuclear Society (no pagination). Toronto: Canadian Nuclear Society

Figure 5: Condenser efficiency display unit, integrating mass balance, energy balance, and
pressure-temperature graph of the condenser.
5. Conclusion The research work described here, in conjunction with similar efforts for the turbine [5] and feedwater subsystems, exemplifies the application of EID in the nuclear domain. We have illustrated how WDA reveals relevant domain characteristics that are theoretically necessary to support effective monitoring and diagnosis. We have also demonstrated how the SRK taxonomy guides the design of visual forms that convey domain characteristics in such a way that violations of invariants and constraints are perceptually salient. Prior empirical results [2,4] have shown that this approach supports early detection and more complete diagnosis of abnormal events. The interface has been implemented in a full-scope BWR simulator has undergone user testing with licensed crews. Thus, work demonstrates that EID can be meaningfully applied at a level representative of nuclear plant operations in industry. Despite the highly representative nature of this work, there remain several limitations. First, the scope of the study is restricted to the secondary side of the plant. Developing ecological interfaces for the subsystems in the primary side remains an outstanding research challenge. Second, the simulator environment permits the use of substantially more information than is
In Proceedings of the 27th Annual Conference of the Canadian Nuclear Society (no pagination). Toronto: Canadian Nuclear Society

currently being sensed or derived in the plant (see [3] for a discussion). Producing the information to populate the interface would require additional sensors and/or derivation of higher-order properties. The expected tradeoff between performance increases enabled by the additional information and the associated cost and reliability concerns must be addressed by future research as well. The anticipated benefits of the ecological interface for the condenser subsystems described here are based on theory. An experiment has been conducted that employed licensed power plant operators using the ecological interfaces in HAMBO to determine whether these anticipated benefits are realized in practice. Data analysis is in progress. If successful, the experiment would provide the first empirical support for the claim that EID can scale up to industry-level applications and continue to deliver the performance benefits that, to date, have been primarily observed in laboratory settings.
6. Acknowledgement This research was supported through a grant from the Natural Science and Engineering Research Council. We are indebted to Christer Nihlwing of IFE for his technical support in providing detailed descriptions and explanations about the workings of the BWR simulator. We thank Jon Kvalem, of IFE, for his effort in making this collaboration possible. We also thanked Nick Dinadis, Jordanna Kwok, Catherine Burns, Alf Ove Braseth, Robin Welch, and Øsytein Veland for their insightful feedback on the interface design.
7. References [1] K. J. Vicente, and J. Rasmussen, “Ecological interface design: theoretical foundation,” IEEE
Transactions on Systems, Man & Cybernetics, vol. SMC-22, no 4, pp. 589-606, Jul./Aug. 1992.
[2] K. J. Vicente, “Ecological interface design: progress and challenges,” Human Factors, vol. 44, no. 1, pp. 62-78, 2002.
[3] C. M. Burns, and J. R. Hajdukiewicz, Ecological Interface Design. Washington, D. C.: CRC Press, 2004.
[4] G. A. Jamieson, “Empirical evaluation of an industrial application of ecological interface design”, Proceedings of the 46th Annual Meeting of the Human Factors and Ergonomics Society, Baltimore, Maryland, pp. 536-540, Sept. 2002.
[5] J. Kwok, and C. M. Burns, “Ecological interface design for the turbine subsystems of a boiling water reactor,” Sixteenth World Congress on Ergonomics, in press.
[6] K. J. Vicente, Cognitive Work Analysis. Manwah, NJ: LEA, 1999. [7] J. Rasmussen, “Skills, Rules, and Knowledge; Signals, Signs, and Symbols, and Other
Distinctions in Human Performance Models,” IEEE Transactions on Systems, Man & Cybernetics, vol. SMC-13, no. 3, pp. 257-266, 1983.
[8] N. Lau, and G. A. Jamieson, “Ecological interface design for the condenser subsystems of a boiling water reactor,” Sixteenth World Congress on Ergonomics, in press.
In Proceedings of the 27th Annual Conference of the Canadian Nuclear Society (no pagination). Toronto: Canadian Nuclear Society