Embed Size (px)
Citation preview

Ecological Monitoring: Association of Private Nature Reserves
(Timbavati, Umbabat, Klaserie, Balule and Thornybush)
AfrEcology
Dr. Mike Peel (Pr.Sci. Nat.)
Animal Production Institute: Livestock Business Division
Seventeenth Joint Report: 2019v2

2
TABLE OF CONTENTS
TABLE OF CONTENTS 2
ACKNOWLEDGEMENTS 3
EXPANDED SUMMARY 4
RAINFALL 6
THE VEGETATION 11
Grass 11
Trees 23
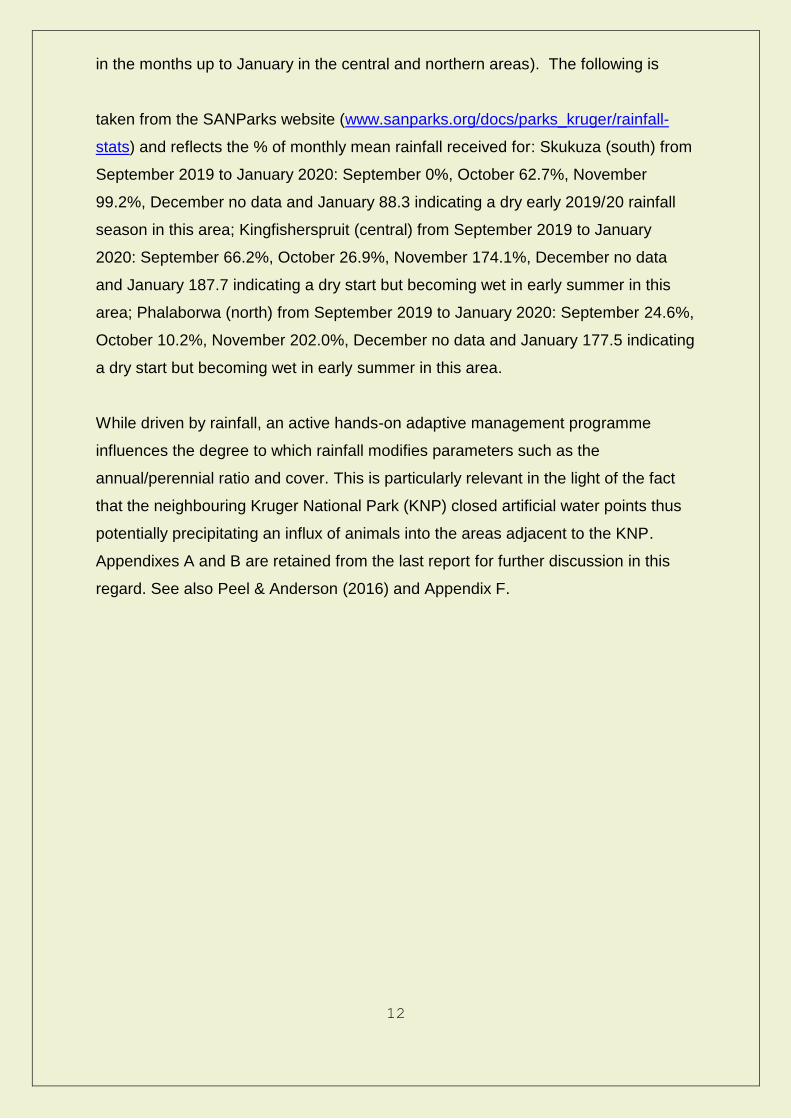
Elephant impact 27
THE ANIMAL COMPONENT 34
Energy flows and sustainability on APNR 51
FAECAL ANALYSIS 54
REFERENCES AND OTHER READING 64
Appendix A – Proposal relating to animal management in response to current
Drought 67
Appendix B – Lowveld Protected Areas: To Manage or Not to Manage 88
Appendix C – Game count figures for APNR 94
Appendix D – Correspondence relating to game removals in the APNR for 2018 95
Appendix E – Forms for sex and age determination 102
Appendix F – Peer reviewed articles relating to the recent drought in the Lowveld 104
3
ACKNOWLEDGEMENTS
For their support in 2019 we thank in particular the landowners, committee and
management staff of the APNR, in particular the chairpersons Andy Payne, Sharon
Haussmann, Chris van der Sande, Theo van Wyk and Wayne Jackaman and Wardens
Colin Rowles, Ian Nowak, Bryan Havemann, Edwin Pierce and Tom Coetzee and many
others who assisted us in completing the work (in particular Almero Bosch, John Llewellyn,
Henry Hibbett, Craig Spencer, Paul Allin for providing specific information). We at ARC-API
look forward to a continued association with the APNR.
A note: we often look at the report and see a bar graph relating to for example the mean
proportion of perennial grasses in a reserve. The number of individual data points
measured for the calculation of the mean proportion of perennial grasses for the BNR for
2019 was 12 391 individual measurements!
The project team working on the APNR includes:
Mike Peel
Lukas Manaka
Dalton Masia
Theresa MacDonald
Sweetness Myeni

4
EXPANDED SUMMARY
This report is the seventeenth joint “annual ecological audit” for the landowners of the
APNR (Association of Private Nature Reserves). 2019 marked 30 years since the initiation
of the ‘Savanna Ecosystem Dynamics Project’ and a number of reserves in the APNR have
been part of the project since the start in 1989. The general background to the study,
methods used, and initial results and discussion can be obtained from the reports dating
back to 1989/90 (see reference list in this document).
To recap, the objective of the monitoring programme is to determine the current situation
and trends in the resources of the Lowveld (some 450 000ha). This includes the
measurement and description of plant species composition and structure, and the
quantification of the relations between various aspects of the vegetation, management
practices (e.g. animal number and types, stocking rates, fire and bush clearing), soils,
rainfall, other climatic variables, the woody/herbaceous ratio and the faecal analysis
programme. This report is presented as an expanded summary.
As discussed in the previous report, the process of Adaptive Planning as laid down by the
Department of Environmental Affairs and Tourism for setting norms and standards for
National Protected Area has been integrated into a comprehensive management plan for
the APNR. Besides the legal requirements in terms of the National Environment
Management: Protected Areas Act No. 57 of 2003 (NEM: PAA), such a Management Plan
serves several important purposes.
This includes the following:
1. It adds value to the reserve and its individual constituent properties as an integrated
concept with clearly defined objectives and approaches. This guarantees continuity;
2. A well-articulated plan assists with obtaining the necessary permits and authorisations
from the relevant Nature Conservation and Environmental authorities;
3. The Management Plan assists in the yearly planning (and budgeting) of veld
management tasks.
We are involved in the final preparation of management plans for each of the APNR
reserves (Klaserie - complete, Timbavati - complete, Umbabat, Balule and Thornybush). In

5
addition, Sandringham, Selati, Greater Makalali Pidwa Game Reserve and Karongwe plans
are at an advanced stage of development. These plans are in line with the plans for all of
the conservation areas forming the Greater Limpopo Transfrontier Conservation Area
(GLTFCA) as is the Sabi Sand Wildtuin (SSW) plan. We have completed Management
Plans for the Kapama Game Reserve, Fleur de Lys Game Reserve, Blue Canyon Game
Conservancy, MalaMala Game Reserve, joint SSW-MalaMala plan, Eden Nature Reserve
(Nelspruit), Penryn College (Nelspruit/White River), Hans Merensky Estate (Phalaborwa),
Raptors View and Longmere (Ridgemere) Estate. All plans now require that they are
brought into line with the GLTFCA requirements.
Due to the prolonged dry phase we are experiencing, I retain three important reports for the
APNR: “GRAZING SITUATION AND OFFTAKES 2016: APNR FOR CONSIDERATION:
CHAIRMEN AND WARDENS APNR (v8) - 12/04/16 – to Klaserie, Balule, Umbabat and
Timbavati Representatives” (kept in for completeness this year as we experience the
effects of the extended drought); and “MANAGING HERBIVORE BIOMASS IN THE
ASSOCIATION OF PRIVATE NATURE RESERVES (APNR): WITH SPECIAL
REFERENCE TO ELEPHANT (LOXODONTA AFRICANA)” - Dr Mike Peel & Dr Jeremy
Anderson May 2016 (Final September 2016v5). The latter was circulated to 28 external
reviewers and the authors in turn answered all respondents. The report proved to be a
large undertaking that yielded lively and challenging debate, and four versions were drafted
before the final fifth version was presented to Mr Mike Anderson. Mr. Anderson is thanked
by the authors for the even-handed manner in which he dealt with this highly contentious
issue. Through no fault of the latter the constructive discussion around elephant
management with a diversity of interested parties was unfortunately halted during 2018.
The offtakes correspondence can be found in latest version of “APNR Offtake Assessment
– Appendix D”.
6
RAINFALL
The importance of extreme rainfall seasons (particularly very dry or very wet), are important
in driving these systems. Note that with the changes in weather/climate patterns that are
predicted (and indeed appear to be happening) the projection is that rainfall in these semi-
arid savannas will become less predictable and more variable. It could be that we are going
to experience greater variability and extremes in rainfall with ‘wetter wet seasons’ and ‘drier
dry seasons’. Such variation in annual rainfall in this area puts a premium on good
grass/herb cover to avoid increased runoff and erosion and silting up of rivers during
extreme events.
The observed effect of rainfall on the vegetation is discussed under the vegetation section
of this report. The importance of careful management is emphasised as this allows for
hazards (normally drought related) to be avoided and opportunities (following favourable
seasons) to be grasped. A drought is defined as being a rainfall season in which less than
75% of the mean annual rainfall is received (I am looking at other ways of assessing rainfall
patterns – see Appendix F). From the latter, it can be said that: KPNR suffered drought
conditions in 2014/15 and 2015/16, a dry 2016/17, a drought in 2017/18 and a dry 2018/19;
UPNR suffered dry conditions in 2014/15, a drought in 2015/16 followed by a dry 2016/17,
a drought in 2017/18 and a dry 2018/19; TPNR suffered dry conditions in 2014/15, drought
conditions in 2015/16, dry 2016/17 and 2017/18 seasons and a wet 2018/19 season; BNR
suffered a dry 2014/15, a drought in 2015/16, a dry 2016/17, a dry 2017/18 and a close to
expected 2018/19; TNR suffered drought conditions in 2014/15 and 2015/16, a close to
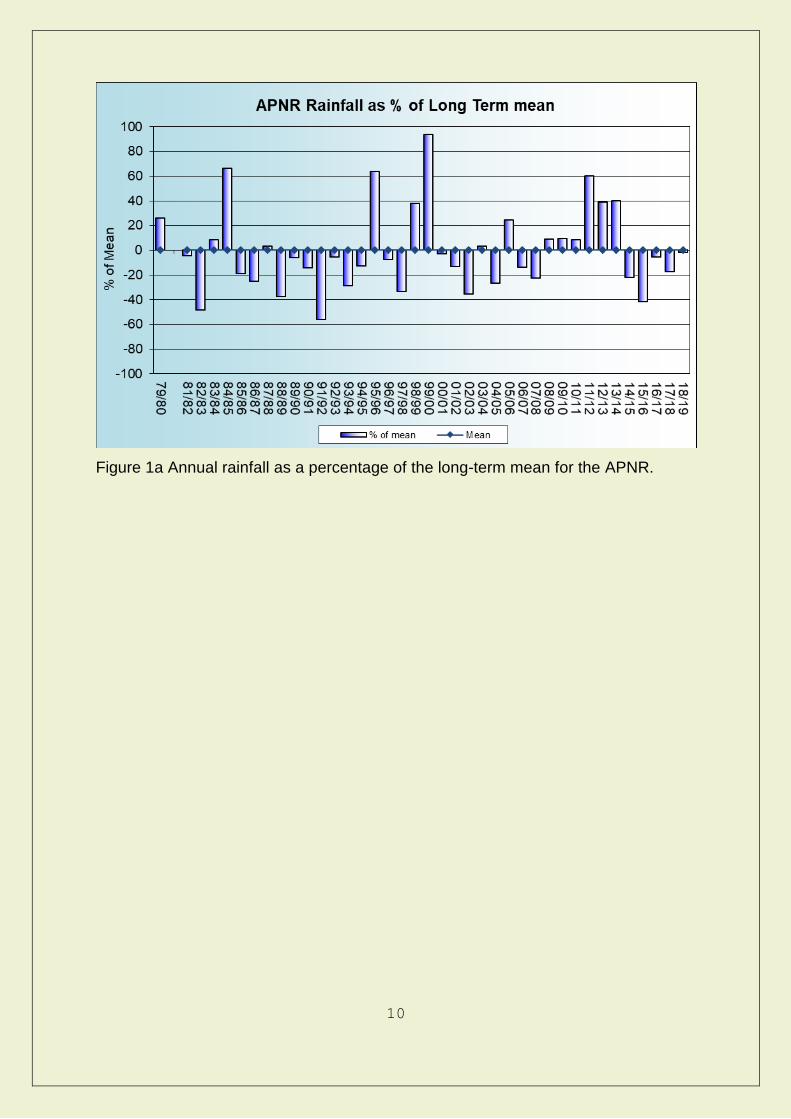
expected 2016/17, a dry 2017/18 and a close to expected 2018/19 (Table 1 and Figure 1a).
The six years prior to 2014/15 were favourable in the APNR as a whole, dominated by
close to mean and wet years (2011/12 to 2013/14 very wet) (Figure 1a and Figure 1b) and
this has had an important but diminishing lag effect on the current condition of the APNR
rangelands (see vegetation section).
7
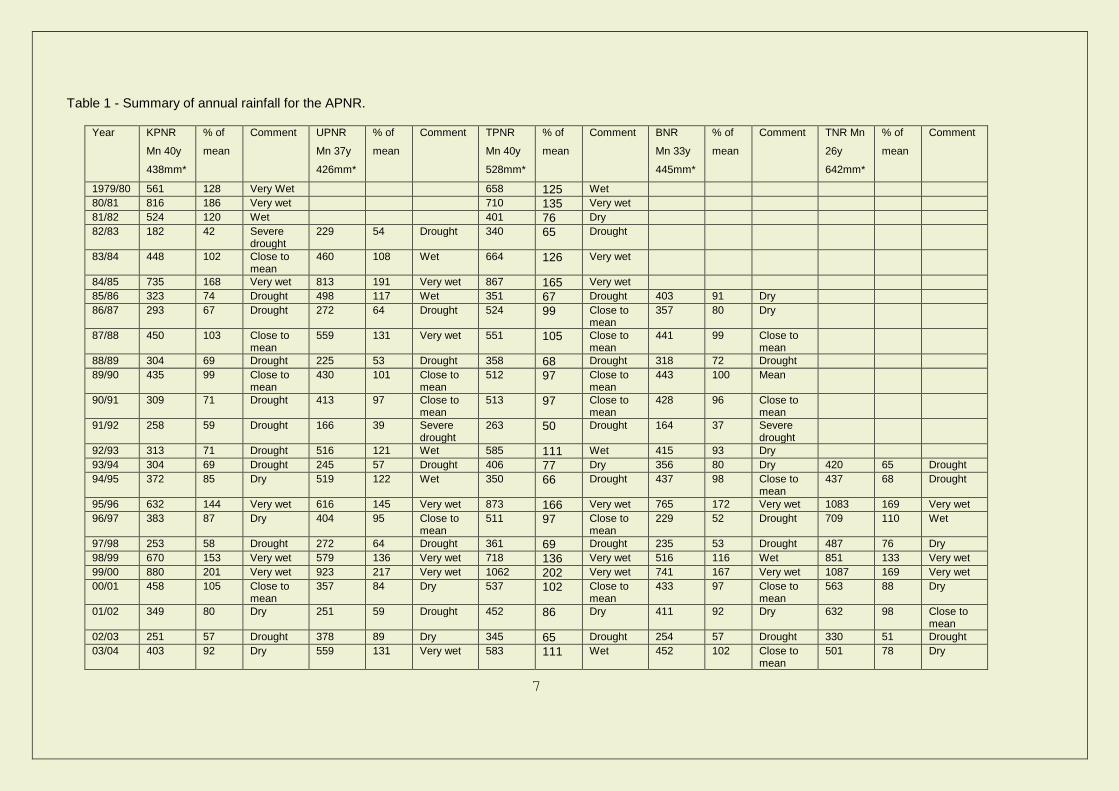
Table 1 - Summary of annual rainfall for the APNR.
Year KPNR
Mn 40y
438mm*
% of
mean
Comment UPNR
Mn 37y
426mm*
% of
mean
Comment TPNR
Mn 40y
528mm*
% of
mean
Comment BNR
Mn 33y
445mm*
% of
mean
Comment TNR Mn
26y
642mm*
% of
mean
Comment
1979/80 561 128 Very Wet 658 125 Wet
80/81 816 186 Very wet 710 135 Very wet
81/82 524 120 Wet 401 76 Dry
82/83 182 42 Severe drought
229 54 Drought 340 65 Drought
83/84 448 102 Close to mean
460 108 Wet 664 126 Very wet
84/85 735 168 Very wet 813 191 Very wet 867 165 Very wet
85/86 323 74 Drought 498 117 Wet 351 67 Drought 403 91 Dry
86/87 293 67 Drought 272 64 Drought 524 99 Close to mean
357 80 Dry
87/88 450 103 Close to mean
559 131 Very wet 551 105 Close to mean
441 99 Close to mean
88/89 304 69 Drought 225 53 Drought 358 68 Drought 318 72 Drought
89/90 435 99 Close to mean
430 101 Close to mean
512 97 Close to mean
443 100 Mean
90/91 309 71 Drought 413 97 Close to mean
513 97 Close to mean
428 96 Close to mean
91/92 258 59 Drought 166 39 Severe drought
263 50 Drought 164 37 Severe drought
92/93 313 71 Drought 516 121 Wet 585 111 Wet 415 93 Dry
93/94 304 69 Drought 245 57 Drought 406 77 Dry 356 80 Dry 420 65 Drought
94/95 372 85 Dry 519 122 Wet 350 66 Drought 437 98 Close to mean
437 68 Drought
95/96 632 144 Very wet 616 145 Very wet 873 166 Very wet 765 172 Very wet 1083 169 Very wet
96/97 383 87 Dry 404 95 Close to mean
511 97 Close to mean
229 52 Drought 709 110 Wet
97/98 253 58 Drought 272 64 Drought 361 69 Drought 235 53 Drought 487 76 Dry
98/99 670 153 Very wet 579 136 Very wet 718 136 Very wet 516 116 Wet 851 133 Very wet
99/00 880 201 Very wet 923 217 Very wet 1062 202 Very wet 741 167 Very wet 1087 169 Very wet
00/01 458 105 Close to mean
357 84 Dry 537 102 Close to mean
433 97 Close to mean
563 88 Dry
01/02 349 80 Dry 251 59 Drought 452 86 Dry 411 92 Dry 632 98 Close to mean
02/03 251 57 Drought 378 89 Dry 345 65 Drought 254 57 Drought 330 51 Drought
03/04 403 92 Dry 559 131 Very wet 583 111 Wet 452 102 Close to mean
501 78 Dry
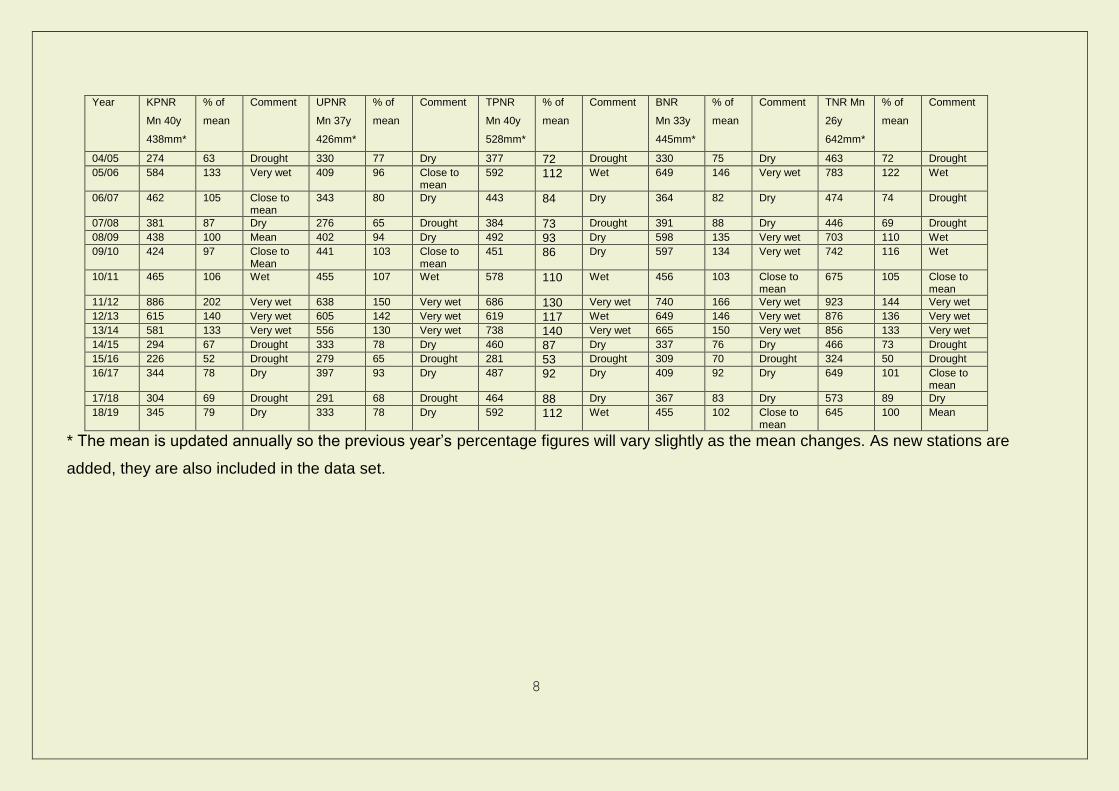
8
Year KPNR
Mn 40y
438mm*
% of
mean
Comment UPNR
Mn 37y
426mm*
% of
mean
Comment TPNR
Mn 40y
528mm*
% of
mean
Comment BNR
Mn 33y
445mm*
% of
mean
Comment TNR Mn
26y
642mm*
% of
mean
Comment
04/05 274 63 Drought 330 77 Dry 377 72 Drought 330 75 Dry 463 72 Drought
05/06 584 133 Very wet 409 96 Close to mean
592 112 Wet 649 146 Very wet 783 122 Wet
06/07 462 105 Close to mean
343 80 Dry 443 84 Dry 364 82 Dry 474 74 Drought
07/08 381 87 Dry 276 65 Drought 384 73 Drought 391 88 Dry 446 69 Drought
08/09 438 100 Mean 402 94 Dry 492 93 Dry 598 135 Very wet 703 110 Wet
09/10 424 97 Close to Mean
441 103 Close to mean
451 86 Dry 597 134 Very wet 742 116 Wet
10/11 465 106 Wet 455 107 Wet 578 110 Wet 456 103 Close to mean
675 105 Close to mean
11/12 886 202 Very wet 638 150 Very wet 686 130 Very wet 740 166 Very wet 923 144 Very wet
12/13 615 140 Very wet 605 142 Very wet 619 117 Wet 649 146 Very wet 876 136 Very wet
13/14 581 133 Very wet 556 130 Very wet 738 140 Very wet 665 150 Very wet 856 133 Very wet
14/15 294 67 Drought 333 78 Dry 460 87 Dry 337 76 Dry 466 73 Drought
15/16 226 52 Drought 279 65 Drought 281 53 Drought 309 70 Drought 324 50 Drought
16/17 344 78 Dry 397 93 Dry 487 92 Dry 409 92 Dry 649 101 Close to mean
17/18 304 69 Drought 291 68 Drought 464 88 Dry 367 83 Dry 573 89 Dry
18/19 345 79 Dry 333 78 Dry 592 112 Wet 455 102 Close to mean
645 100 Mean
* The mean is updated annually so the previous year’s percentage figures will vary slightly as the mean changes. As new stations are
added, they are also included in the data set.

9
Figure 1 Annual rainfall for APNR and mean (from north to south).
10
Figure 1a Annual rainfall as a percentage of the long-term mean for the APNR.
11
THE VEGETATION
The monitoring results are discussed and presented graphically in Figures 2 to 12
and in Tables 2 to 6. A discussion of the results follows in the text. Vegetation
changes on APNR are thus tracked and a further strength of the monitoring
programme is the capacity to also compare vegetation condition with other reserves
in the area. We compare important vegetation parameters among APNR and three
other reserves in the area.
Grass
Figures 2 to 4 illustrate the trends in important grass parameters. The generally
favourable trend in perennial composition continued with a return to nearer normal
rainfall conditions in 2016/17 and 2018/19: KPNR (above mean), UPNR (above
mean), TPNR (above mean), TNR (mean) with only BNR declining (above mean).
In terms of perennial cover (distance) measures, there was a general across the
board improvement indicating that the perennial grass tufts were closer together but
with only TPNR and TNR better than the mean across the APNR (but still an
improving situation). Perennial cover (tuft size) yielded mixed results with
improvement only measured in the KPNR which was also the only PA with a tuft size
greater than the mean, the UPNR stable (at the mean), BNR stable (below the
mean) and declines in the TPNR (at the mean) and TNR (below the mean). These
findings are in line with expectations, a generally improved perennial component in
2018/19 with grasses closer together (improved distance measure) yet smaller
(establishing and smaller tufts). The latter highlights the lag effect of the close to
expected 2016/17 rainfall season and buoyed by a close to mean/favourable
2018/19 rainfall season.
Overall therefore the ‘wetter’ south (TPNR and TNR) has higher proportions of
perennial grasses and a better cover than the drier north (BNR, KPNR and UPNR).
The prevailing conditions suggest that the perennial composition and cover in the
APNR will at least be maintained (the degree of change depending on the 2019/20
season, which has been variable, tending to the dry side in the south but improving
12
in the months up to January in the central and northern areas). The following is
taken from the SANParks website (www.sanparks.org/docs/parks_kruger/rainfall-
stats) and reflects the % of monthly mean rainfall received for: Skukuza (south) from
September 2019 to January 2020: September 0%, October 62.7%, November
99.2%, December no data and January 88.3 indicating a dry early 2019/20 rainfall
season in this area; Kingfisherspruit (central) from September 2019 to January
2020: September 66.2%, October 26.9%, November 174.1%, December no data
and January 187.7 indicating a dry start but becoming wet in early summer in this
area; Phalaborwa (north) from September 2019 to January 2020: September 24.6%,
October 10.2%, November 202.0%, December no data and January 177.5 indicating
a dry start but becoming wet in early summer in this area.
While driven by rainfall, an active hands-on adaptive management programme
influences the degree to which rainfall modifies parameters such as the
annual/perennial ratio and cover. This is particularly relevant in the light of the fact
that the neighbouring Kruger National Park (KNP) closed artificial water points thus
potentially precipitating an influx of animals into the areas adjacent to the KNP.
Appendixes A and B are retained from the last report for further discussion in this
regard. See also Peel & Anderson (2016) and Appendix F.

13
Figure 2 Percentage perennial grasses present on APNR and rainfall. 12 391
individual measurements for the 18/19 bar for just the BNR.

14
Table 2 Perennial grass composition trends within the APNR (refer Figure 2).
APNR overall
General Comment 2018/19; and Comment Long term
Increase – Moderate-high proportion of perennial grasses; moderate-
high
KPNR 29y Increase – Moderate-high proportion of perennial grasses; moderate-
high
UPNR 28y Increase – Moderate-high proportion of perennial grasses; moderate-
high
TPNR 28y Increase – High proportion of perennial grasses; high
BNR 30y Decline – Moderate-low proportion of perennial grasses; moderate-
low
TNR 25y Stable – High; high

15
Figure 3 Mean distance to perennial grasses on APNR and rainfall.
16
Figure 4 Mean tuft diameter of perennial grasses on APNR and rainfall.

17
Table 3 Perennial grass cover trends in the APNR (refer Figure 3 and Figure 4).
APNR overall
General Comment 2018/19; and Long term; Distance measure (top), tuft measure (bottom)
Improvement - Low; Low
Decline – Moderate-high; Moderate-high
KPNR 25y Improvement – Low; Low
Improvement – High; Moderate
UPNR 25y Improvement – Low; Low
Stable – High; High
TPNR 26y Improvement – Moderate-low; Moderate-low
Decline – High; High
BNR 25y Stable - Low; Low Stable – Low; Moderate-low
TNR 25y Improvement – Moderate; Moderate
Decline – Moderate; Moderate-high

18
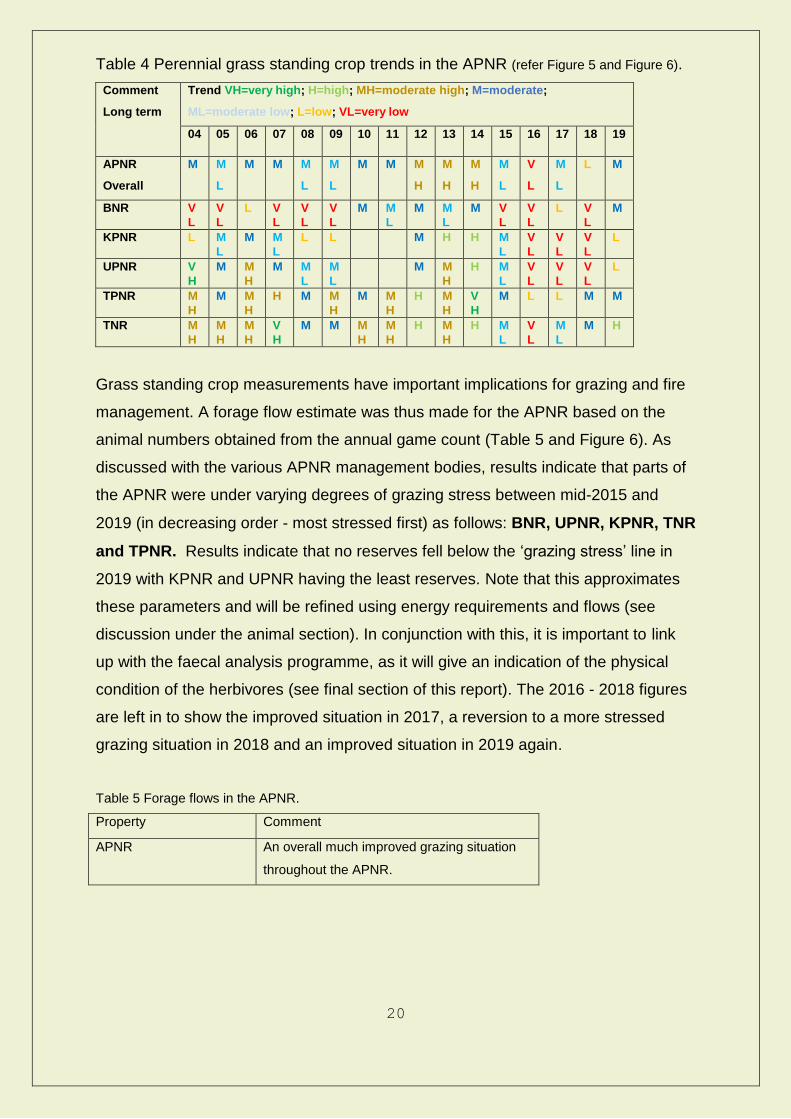
Grass standing crop is a function of herbaceous production and represents the
portion of production that remains after utilisation (Figure 5 and Table 4). The grass
standing crop at the end of the 2018/19 - summer season was moderate for the
APNR overall. For the individual reserves the following: KPNR (low); UPNR (low);
TPNR (moderate), BNR (moderate) and TNR (high).

19
Figure 5 Grass standing crop on APNR and rainfall.
20
Table 4 Perennial grass standing crop trends in the APNR (refer Figure 5 and Figure 6).
Comment
Long term
Trend VH=very high; H=high; MH=moderate high; M=moderate;
ML=moderate low; L=low; VL=very low
04 05 06 07 08 09 10 11 12 13 14 15 16 17 18 19
APNR
Overall
M M
L
M M M
L
M
L
M M M
H
M
H
M
H
M
L
V
L
M
L
L M
BNR V
L
V
L
L V
L
V
L
V
L
M M
L
M M
L
M V
L
V
L
L V
L
M
KPNR L M
L
M M
L
L L M H H M
L
V
L
V
L
V
L
L
UPNR V
H
M M
H
M M
L
M
L
M M
H
H M
L
V
L
V
L
V
L
L
TPNR M
H
M M
H
H M M
H
M M
H
H M
H
V
H
M L L M M
TNR M
H
M
H
M
H
V
H
M M M
H
M
H
H M
H
H M
L
V
L
M
L
M H
Grass standing crop measurements have important implications for grazing and fire
management. A forage flow estimate was thus made for the APNR based on the
animal numbers obtained from the annual game count (Table 5 and Figure 6). As
discussed with the various APNR management bodies, results indicate that parts of
the APNR were under varying degrees of grazing stress between mid-2015 and
2019 (in decreasing order - most stressed first) as follows: BNR, UPNR, KPNR, TNR
and TPNR. Results indicate that no reserves fell below the ‘grazing stress’ line in
2019 with KPNR and UPNR having the least reserves. Note that this approximates
these parameters and will be refined using energy requirements and flows (see
discussion under the animal section). In conjunction with this, it is important to link
up with the faecal analysis programme, as it will give an indication of the physical
condition of the herbivores (see final section of this report). The 2016 - 2018 figures
are left in to show the improved situation in 2017, a reversion to a more stressed
grazing situation in 2018 and an improved situation in 2019 again.
Table 5 Forage flows in the APNR.
Property Comment
APNR An overall much improved grazing situation
throughout the APNR.

21
Figure 6 Projected forage flows on APNR for winter (from top) 2016, 2017, 2018 and
2019.
22
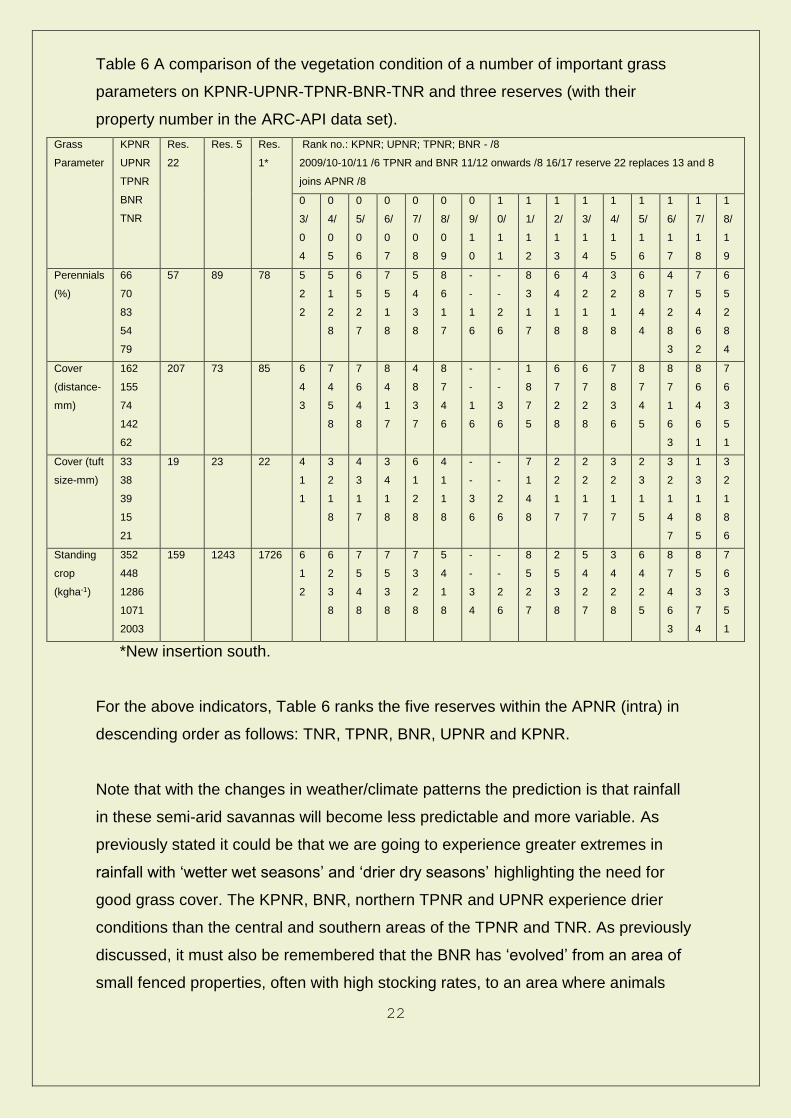
Table 6 A comparison of the vegetation condition of a number of important grass
parameters on KPNR-UPNR-TPNR-BNR-TNR and three reserves (with their
property number in the ARC-API data set).
Grass
Parameter
KPNR
UPNR
TPNR
BNR
TNR
Res.
22
Res. 5 Res.
1*
Rank no.: KPNR; UPNR; TPNR; BNR - /8
2009/10-10/11 /6 TPNR and BNR 11/12 onwards /8 16/17 reserve 22 replaces 13 and 8
joins APNR /8
0
3/
0
4
0
4/
0
5
0
5/
0
6
0
6/
0
7
0
7/
0
8
0
8/
0
9
0
9/
1
0
1
0/
1
1
1
1/
1
2
1
2/
1
3
1
3/
1
4
1
4/
1
5
1
5/
1
6
1
6/
1
7
1
7/
1
8
1
8/
1
9
Perennials
(%)
66
70
83
54
79
57 89 78 5
2
2
5
1
2
8
6
5
2
7
7
5
1
8
5
4
3
8
8
6
1
7
-
-
1
6
-
-
2
6
8
3
1
7
6
4
1
8
4
2
1
8
3
2
1
8
6
8
4
4
4
7
2
8
3
7
5
4
6
2
6
5
2
8
4
Cover
(distance-
mm)
162
155
74
142
62
207 73 85 6
4
3
7
4
5
8
7
6
4
8
8
4
1
7
4
8
3
7
8
7
4
6
-
-
1
6
-
-
3
6
1
8
7
5
6
7
2
8
6
7
2
8
7
8
3
6
8
7
4
5
8
7
1
6
3
8
6
4
6
1
7
6
3
5
1
Cover (tuft
size-mm)
33
38
39
15
21
19 23 22 4
1
1
3
2
1
8
4
3
1
7
3
4
1
8
6
1
2
8
4
1
1
8
-
-
3
6
-
-
2
6
7
1
4
8
2
2
1
7
2
2
1
7
3
2
1
7
2
3
1
5
3
2
1
4
7
1
3
1
8
5
3
2
1
8
6
Standing
crop
(kgha-1)
352
448
1286
1071
2003
159 1243 1726 6
1
2
6
2
3
8
7
5
4
8
7
5
3
8
7
3
2
8
5
4
1
8
-
-
3
4
-
-
2
6
8
5
2
7
2
5
3
8
5
4
2
7
3
4
2
8
6
4
2
5
8
7
4
6
3
8
5
3
7
4
7
6
3
5
1
*New insertion south.
For the above indicators, Table 6 ranks the five reserves within the APNR (intra) in
descending order as follows: TNR, TPNR, BNR, UPNR and KPNR.
Note that with the changes in weather/climate patterns the prediction is that rainfall
in these semi-arid savannas will become less predictable and more variable. As
previously stated it could be that we are going to experience greater extremes in
rainfall with ‘wetter wet seasons’ and ‘drier dry seasons’ highlighting the need for
good grass cover. The KPNR, BNR, northern TPNR and UPNR experience drier
conditions than the central and southern areas of the TPNR and TNR. As previously
discussed, it must also be remembered that the BNR has ‘evolved’ from an area of
small fenced properties, often with high stocking rates, to an area where animals

23
move freely (water notwithstanding) in response to resource availability. The
provision of artificial water however results in water dependent animals remaining in
areas that they would normally have vacated during certain times of the year. This
situation is widespread throughout the APNR. The effect of high impact herbivore
species such as elephant must be considered as declines in the grass layer indicate
that while rainfall drives the system, grazing pressure can ultimately compromise the
composition and vigour (distance and tuft) of the individual grass plants. Grass
standing crop measurements have important implications for grazing and fire
management. Therefore, in addition to animal number manipulation, the judicious
use of fire, bush thinning and the rotation of water points should be used to manage
herbivore distribution and impact. Please read the ‘drought’ reportv8 compiled in this
regard (Appendix A and Appendix B) and the ‘elephant’ report (under separate
cover). I attach two peer reviewed papers that the author of this report was involved
in which addresses the issue of rangeland response in this area to the drought
(“Drought amnesia: lessons from protected areas in the eastern Lowveld of South
Africa.” Mike JS Peel & Izak P Smit (2020) and “Megaherbivore response to
droughts under different management regimes: lessons from a large African
savannah”. Izak PJ Smit, Mike JS Peel, Sam M Ferreira, Cathy Greaver & Danie J
Pienaar (2020) – Appendix F).
Trees
Woody density varies across the different areas, with fluctuations broadly
corresponding to ‘wet’ (decreased density –with an increase in competition with the
perennial grass component) and ‘dry’ (increase in density). The long-term tree
densities and canopy cover indicate a general gradual decline (Figures 7 and 8). In
the various reserves the following (Figures 7 and 8): KPNR - density relatively stable
since early 2000’s with increases in dry periods; long term canopy cover fluctuating
in a 10% range since the late 1990’s); UPNR – density relatively stable since early
2000’s with increases in dry periods; canopy fluctuating in a 5% range since the late
1990’s; TPNR – long term declines in density but relatively stable since late 1990’s;
gradual decline in canopy cover since 2012/13; BNR long term relatively stable
density but increases in last two years (related also to increased number of sites);
stable canopy to 2011/12 then marked decline in cover; TNR long term slight
increase in density but marked increases since 2014/15; stable canopy to 2016/17

24
then marked decline in cover (elephant?). The above illustrates the fluctuations one
would expect within the tree layer. Given the climatic and concerns of the
perceived/real impact of elephant, we have started an in-depth analysis of tree
density and cover for the entire study area and results will be reported on as they
are analysed and interpreted.

25
Figure 7 Mean woody densities on APNR and rainfall.

26
Figure 8 Mean tree canopy cover on APNR and rainfall.
27
Elephant impact
When we examine the 2007 to 2019 results we note two things: the overall density
of elephant has increased over time in the APNR (Figure 9) (TNR included from
2017). The increases were initially gradual but with a sharp increase from 2014,
reaching a high in the APNR combined in 2018 (largely due to the TNR situation
where, as expected there was an influx of elephant with the removal of the fence
with the TPNR) and returning to 2014 levels in 2019 (despite continued high
elephant numbers in the TNR).
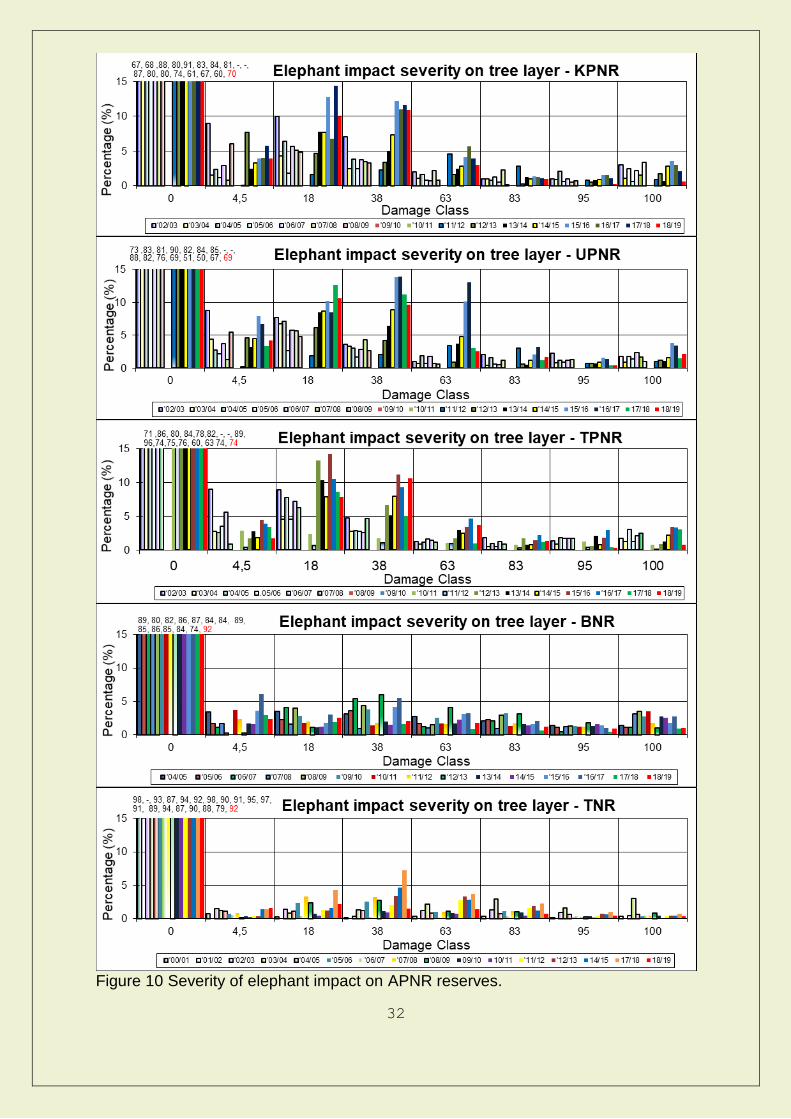
The severity of elephant impact (Figure 10), ranked on a seven-point scale indicates
that the percentage of trees NOT impacted upon was:
KPNR 70% (previous 60% - mean 77%) indicating an decrease but still relatively
high impact – mortality 0.6% (previous 2.1%);
UPNR 69% (previous 67% - mean 75%) indicating continued high levels of impact –
mortality 2.2% (previous 1.5%);
TPNR 74% (previous 77% - mean 78%) indicating a continued relatively high level of
impact – mortality decline 0.8% (previous 3.1% and 3.3% respectively);
BNR 88% (previous 91% - mean 85%) indicating a similar impact to 2018 – mortality
1% (previous 0.9% and 2.7%);
TNR 92% (previous 79% - mean 91%) indicating a decrease in impact – mortality
0.4 (previous 0.7% and 1.4% respectively).
There was a continued generally high level of impact in the lower severity classes
(4.5% to 63% impact) (particularly in the KPNR, UPNR and TNR) indicating a
continued increase in usage although at lower degrees of impact.
Some further discussion on the above two paragraphs is presented. The higher total
impact in the KPNR and UPNR and the higher levels of impact in the 4.5% to 63%
classes correlates with the lower grass standing crop in these areas (compare to
BNR, normally low grass standing crop but in 2019 a markedly higher than mean
grass standing crop – and less elephant impact). Of further interest is the fact that
the UPNR has a lighter elephant density than the rest of the reserves but a much
higher bull density supporting the idea that males generally have a greater impact on
the tree layer (≈ percentage bulls: UPNR 37.7%, KPNR 5.7%, TPNR 11.1%, BNR
28
8.9% (from count done using the same method as other reserves in the APNR) and
TNR 10.5%). The TPNR and TNR have lower impact despite having relatively high
elephant densities (particularly TNR very high) but higher grass standing crop and
lower impact. TPNR extends over an area that covers the drier north and wetter
south so it would be useful to look at his areas as two regions, drier and wetter).
The data also indicate that, due to food shortages in certain areas, the animals
are moving through the veld relatively quickly in search of food and not
staying in a specific area for any length of time – reflected by the peaks in the
lower usage classes. Increases in impact and mortality generally coincide with
elephants focussing on the woody component in dry years due to poorer grass
species composition, cover and yield and a concomitant increased impact on the
tree layer.
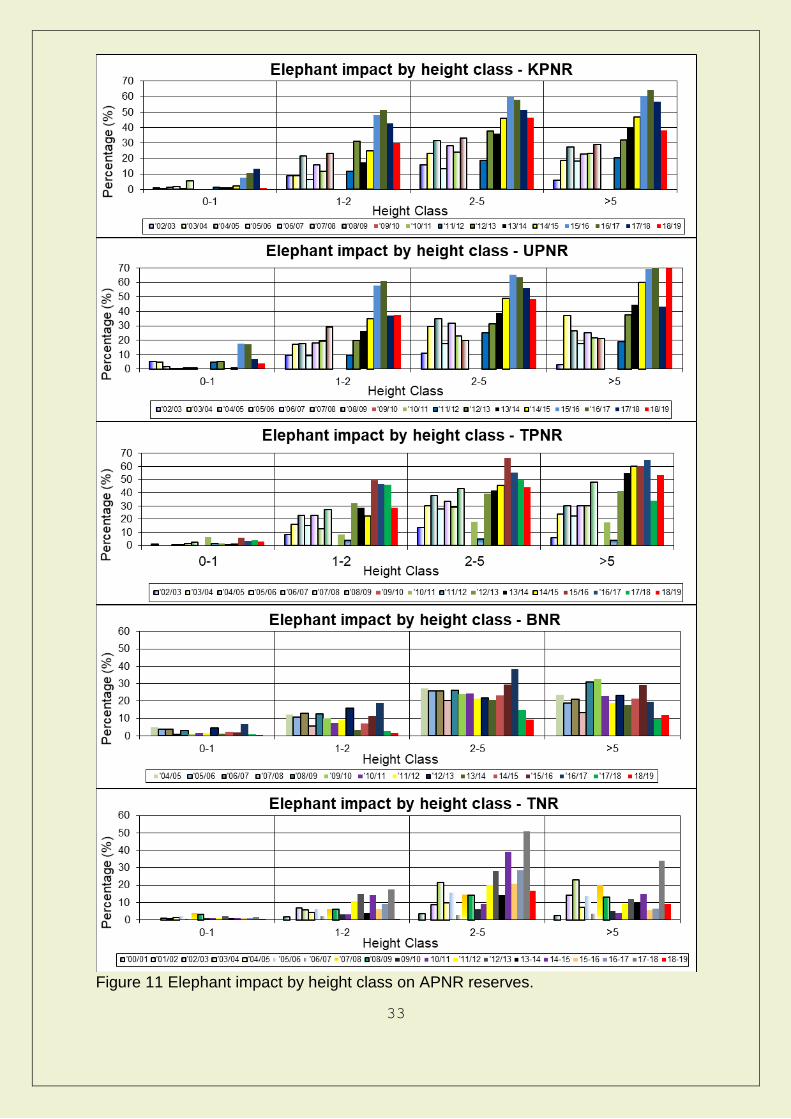
In terms of percentage damage per height class Figure 11 indicates a continued
selection within the 2-5m and >5m classes but with a continued selection for the 2.1-
5m classes in particular. The continued selection for shorter height classes (1.1-2m
height class in particular) supports the statement that due to food shortages, the
animals are moving through the veld relatively quickly in search of food and not
staying in a specific area for any length of time while also selecting shorter height
classes. The latter is amplified in the areas with lower grass standing crop thus
supporting the argument given in the above paragraph. For the specific reserves
when compared to the mean:
KPNR - General decline in impact across height classes: 1.1-2m class: 30%
(previous 43%, 51% - mean 24%); 2.1-5m class: stable 46% (previous 51%, 58% -
mean 35%); >5m class: 38% (previous 57%, 64% - mean 34%);
UPNR – stable: 1.1-2m class 38% (previous 37%, 61% - mean 27%); 2.1-5m class
49% (previous 56%, 65% - mean 36%) indicating a continued high impact; >5m
class 70% (previous 43%, 76% - mean 38%) indicating an increased and very high
impact;
BNR – relatively stable: 1.1-2m class 1.5% (previous 2.7%, 19% - mean 9%); 2.1-
5m class 9% (previous 15%, 38% - mean 24%); >5m class 12% (previous 10%,
20% - mean 21%);
TPNR 1.1-2m class 29% (previous 46%, 47% - mean 25%); 2.1-5m class 44%
(previous 49%, 55% - mean 36%) indicating a continued high impact; >5m class:
29
55% (previous 34%, 65% - mean 36%) indicating a continued high impact;
TNR 1.1-2m class 0.6% (previous 17%, 9% - mean 7%) indicating a steep decrease
in impact in this class; 2.1-5m class 17% (previous 51%, 28% - mean 18%)
indicating selection for this height class but a steep decline; >5m class 9% (previous
34%, 7% - mean 9%) indicating a steep decline (improving grass layer).
These results further support the thinking that, due to food shortages, the animals
are moving through the veld relatively quickly in search of food and not staying in a
specific area for any length of time. This parameter is monitored, as homogenisation
of structure is not desirable (e.g. all small trees or all large trees present and nothing
in between).
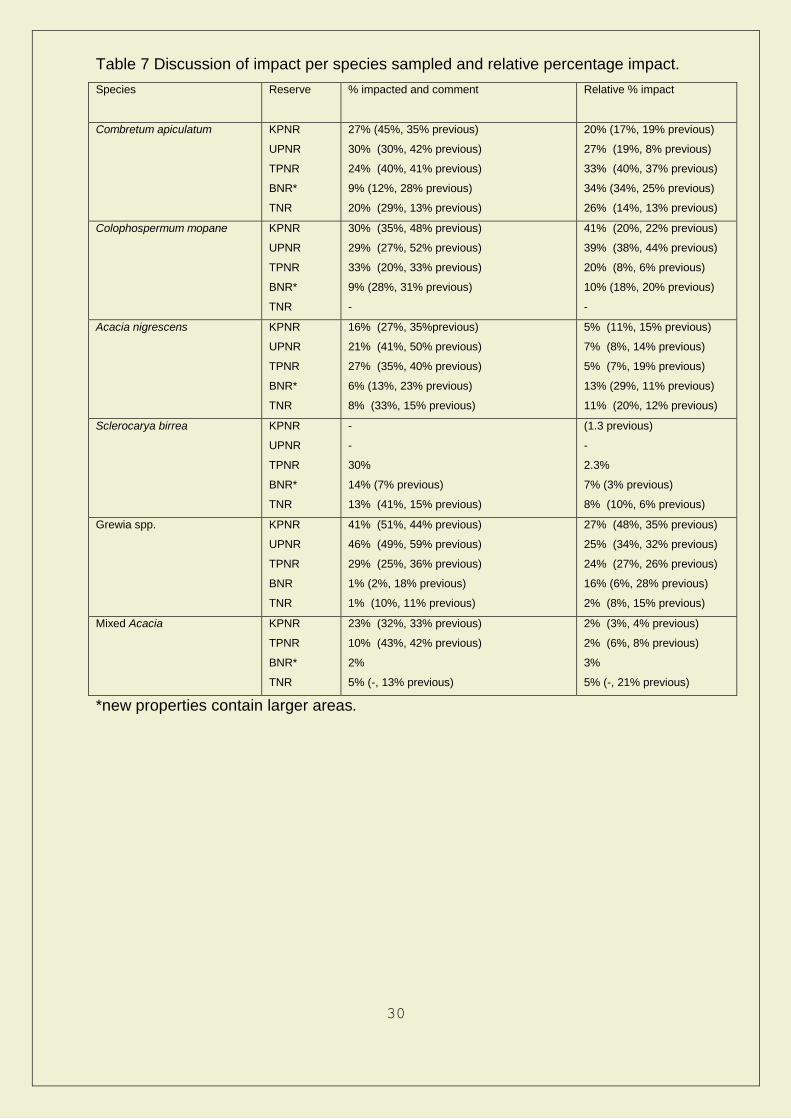
Table 7 shows the percentage of selected trees sampled per species, which were
impacted upon, and the relative percentage of all tree species sampled that have
been impacted upon.
The link between elephant density and impact on favoured trees is currently being
investigated. Combretum apiculatum and Colophospermum mopane play similar
roles in that relatively similar proportions of these species are selected for where
they dominate. Colophospermum mopane and Grewia spp. will in all likelihood
continue to comprise a large proportion of the impact particularly in the drier north
and east while in the central, south and west the impact shifts to Combretum
apiculatum.
As with the tree density and canopy data, a clearer understanding of elephant
impact is emerging as the monitoring programme continues. This is not an in-depth
study of elephant impact but more an attempt to broadly quantify impact on a
reserve scale. Species and areas of concern should be identified for closer
investigation within an elephant management plan.
30
Table 7 Discussion of impact per species sampled and relative percentage impact.
Species Reserve
% impacted and comment Relative % impact
Combretum apiculatum
KPNR
UPNR
TPNR
BNR*
TNR
27% (45%, 35% previous)
30% (30%, 42% previous)
24% (40%, 41% previous)
9% (12%, 28% previous)
20% (29%, 13% previous)
20% (17%, 19% previous)
27% (19%, 8% previous)
33% (40%, 37% previous)
34% (34%, 25% previous)
26% (14%, 13% previous)
Colophospermum mopane KPNR
UPNR
TPNR
BNR*
TNR
30% (35%, 48% previous)
29% (27%, 52% previous)
33% (20%, 33% previous)
9% (28%, 31% previous)
-
41% (20%, 22% previous)
39% (38%, 44% previous)
20% (8%, 6% previous)
10% (18%, 20% previous)
-
Acacia nigrescens KPNR
UPNR
TPNR
BNR*
TNR
16% (27%, 35%previous)
21% (41%, 50% previous)
27% (35%, 40% previous)
6% (13%, 23% previous)
8% (33%, 15% previous)
5% (11%, 15% previous)
7% (8%, 14% previous)
5% (7%, 19% previous)
13% (29%, 11% previous)
11% (20%, 12% previous)
Sclerocarya birrea KPNR
UPNR
TPNR
BNR*
TNR
-
-
30%
14% (7% previous)
13% (41%, 15% previous)
(1.3 previous)
-
2.3%
7% (3% previous)
8% (10%, 6% previous)
Grewia spp. KPNR
UPNR
TPNR
BNR
TNR
41% (51%, 44% previous)
46% (49%, 59% previous)
29% (25%, 36% previous)
1% (2%, 18% previous)
1% (10%, 11% previous)
27% (48%, 35% previous)
25% (34%, 32% previous)
24% (27%, 26% previous)
16% (6%, 28% previous)
2% (8%, 15% previous)
Mixed Acacia
KPNR
TPNR
BNR*
TNR
23% (32%, 33% previous)
10% (43%, 42% previous)
2%
5% (-, 13% previous)
2% (3%, 4% previous)
2% (6%, 8% previous)
3%
5% (-, 21% previous)
*new properties contain larger areas.

31
Figure 9 Elephant densities across the APNR and for individual reserves (note x axis
in 2 year increments so last marker is 2019).
32
Figure 10 Severity of elephant impact on APNR reserves.
33
Figure 11 Elephant impact by height class on APNR reserves.
34
THE ANIMAL COMPONENT
For the effective management of a game reserve, it is vital to count the animals on a
regular basis. These estimates are critical for calculations relating to herbivore
carrying/grazing capacity and stocking rate and the effect of their utilisation on the
habitat. No form of wildlife management is possible without reliable
information regarding herbivore numbers. Because different animals have
different effects on the vegetation, it is important to determine the feeding class
proportions on APNR. Appendix C presents the combined APNR animal numbers
from the 2019 count. Appendix A, B and D are included as they provide important
discussion relating to the current drought while Appendix F presents two peer
reviewed scientific papers relating to the drought. Much of the discussion in this
section is aimed at augmenting the information contained in Appendix A (drought
report v8 2016) in particular.
Due to the recent drought, Appendix A and the herbivore management plan (with
specific reference to elephant), reported on in 2016, forms an important adjunct to
past reports. After much discussion, version 8 of the former and version 5 of the
latter was forwarded to the authorities (MTPA and LEDET), SANParks and DEA.
The Klaserie, Timbavati, Umbabat, Thornybush reserves and the Olifants West
section of the Balule NR were counted as in previous years using a Bell jet Ranger
and linked computer system with pilot, computer operator and two experienced
observers. A Jabiru aircraft was employed to take high resolution photographs of
buffalo herds located by the helicopter team to obtain demographic data critical for
this exercise in the first four areas mentioned above. The rest of the Balule NR count
was done using the following platforms. The Jabiru covered the entire Balule NR
area to count elephant, rhino and buffalo. Finally, 46% of the total area of Balule
Nature Reserve was counted using a Robinson 44 helicopter with pilot, computer
operator and two observers. The length of the Olifants River in the Balule NR was
covered by the two helicopter counts. The 2019 game count numbers were used to
calculate stocking rates (Figure 12), feeding class ratios (Figure 13) and to examine
herbivore trends (Figure 14) and projections. Forward projections were calculated as
follows:
35
1. ‘20proj’ in Figure 12 = the 2019 count numbers plus the estimated natural
increase; minus the proposed management/hunting removals (Appendix D)
but not including possible additional ‘emergency’ offtakes (up to ≈ 5 000
impala). The latter would be deemed necessary in the event of the situation
deteriorating sufficiently to warrant further management action (to be re-
assessed winter 2020); re-introductions (0); and the calculated effect of
predators (Table 8). The second series in Figure 12 represents the prey
biomass only (i.e. taking non-prey animals out of the calculation rhino, hippo
and elephant - what will be available to predators).
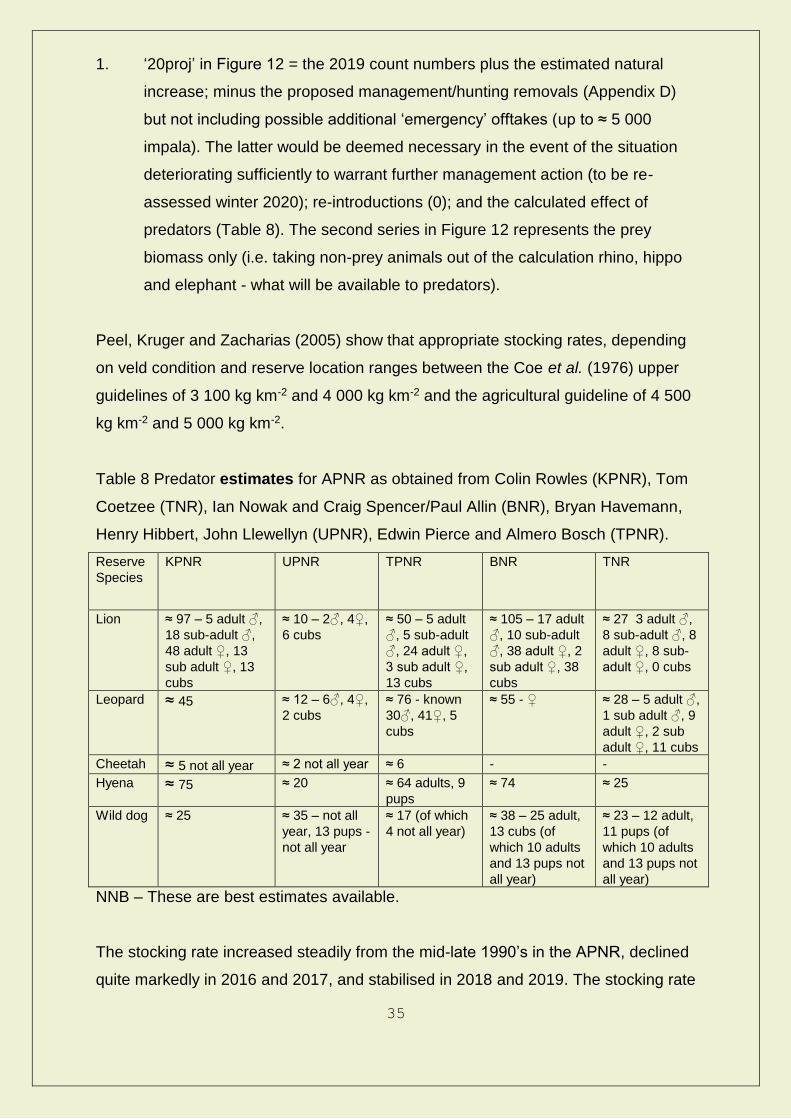
Peel, Kruger and Zacharias (2005) show that appropriate stocking rates, depending
on veld condition and reserve location ranges between the Coe et al. (1976) upper
guidelines of 3 100 kg km-2 and 4 000 kg km-2 and the agricultural guideline of 4 500
kg km-2 and 5 000 kg km-2.
Table 8 Predator estimates for APNR as obtained from Colin Rowles (KPNR), Tom
Coetzee (TNR), Ian Nowak and Craig Spencer/Paul Allin (BNR), Bryan Havemann,
Henry Hibbert, John Llewellyn (UPNR), Edwin Pierce and Almero Bosch (TPNR).
Reserve
Species
KPNR UPNR TPNR BNR TNR
Lion ≈ 97 – 5 adult ♂,
18 sub-adult ♂,
48 adult ♀, 13
sub adult ♀, 13
cubs
≈ 10 – 2♂, 4♀,
6 cubs
≈ 50 – 5 adult
♂, 5 sub-adult
♂, 24 adult ♀,
3 sub adult ♀,
13 cubs
≈ 105 – 17 adult
♂, 10 sub-adult
♂, 38 adult ♀, 2
sub adult ♀, 38
cubs
≈ 27 3 adult ♂,
8 sub-adult ♂, 8
adult ♀, 8 sub-
adult ♀, 0 cubs
Leopard ≈ 45
≈ 12 – 6♂, 4♀,
2 cubs
≈ 76 - known
30♂, 41♀, 5
cubs
≈ 55 - ♀ ≈ 28 – 5 adult ♂,
1 sub adult ♂, 9
adult ♀, 2 sub
adult ♀, 11 cubs
Cheetah ≈ 5 not all year ≈ 2 not all year ≈ 6 - -
Hyena ≈ 75 ≈ 20 ≈ 64 adults, 9
pups
≈ 74 ≈ 25
Wild dog ≈ 25 ≈ 35 – not all
year, 13 pups -
not all year
≈ 17 (of which
4 not all year)
≈ 38 – 25 adult,
13 cubs (of
which 10 adults
and 13 pups not
all year)
≈ 23 – 12 adult,
11 pups (of
which 10 adults
and 13 pups not
all year)
NNB – These are best estimates available.
The stocking rate increased steadily from the mid-late 1990’s in the APNR, declined
quite markedly in 2016 and 2017, and stabilised in 2018 and 2019. The stocking rate
36
in the APNR remains well above the guideline (since around 2008) (Figure 12). In
2019 the stocking rate:
1. KPNR: Declined again in 2019 after sharp increase in 2018 - well above the
guideline (above since 2005, well above since 2008, decreased in 2017);
2. UPNR: Declined again in 2019 after sharp increase in 2018 - currently within
the guideline (largely below the guideline since 1996, above 2016 and 2018);
3. TPNR: Decline (not marked) again after sharp increase in 2018 – well above
the guideline (above for 17 of last 19 years);
4. BNR: Increased and remains well above the guideline in the BNR (above to
well above 14 of last 16 years – largely due to high numbers of elephant and
hippo);
5. TNR: Continued sharp increase in 2019 to well above the guideline in the
TNR (above to well above 16 of last 17 years – 2017 - 2019 largely due to
influx of elephant) (Figure 12).
When we remove the rhino, hippo and elephant from the stocking rate calculations
(essentially the non-prey species) we see that the prey biomass in the APNR
increased marginally (returning large herbivores especially buffalo). The prey
biomass increased marginally year on year from 2010 (with a marked increase in
2015, the 2014 prey decline due to the fact that only the megaherbivores were
counted in the BNR). The declines in 2017 and 2018 is largely due to declines in
buffalo numbers in the APNR through death and migration. For the individual
reserves in 2019 the prey biomass:
1. KPNR: decline after an increase in 2018 and the lowest since 2006;
2. UPNR: increased after two years of decline (low levels - the frequent
fluctuations illustrate animal movement in and out of this relatively small
reserve – see Appendix A and B relating to the drought and Peel & Anderson
2016);
3. TPNR: decline to 2017 levels after two years of increase;
4. BNR: Declined for fourth year running (large decline in 2014 a function of not
counting species outside of buffalo as prey species)
5. TNR: Marked increase in 2019 after declines between 2014 and 2017 and
stabilising in 2018 (buffalo returning).
37
As previously stated, the fluctuation in stocking rate in the various reserves within
the APNR is due to movement of large mammals (elephant and buffalo in particular)
and increased drought mortality (buffalo). This is highlighted where there has been
an influx of animals from the KNP (little natural water and few artificial water points)
to the many artificial water points in the APNR (see Appendix A, B and F relating to
the drought and Peel & Anderson 2016). There appears to have been widespread
mortality particularly among the grazing buffalo but there is evidence that this
species migrated to areas of the KNP north of the Olifants River where the drought
was less severe and where grazing remained favourable. The latter highlights the
need to look at the APNR holistically and in conjunction with the neighbouring
KNP – I refer you to my presentation at the Kruger network meeting in 2018 to
highlight this sentiment
(www.sanparks.org/conservation/scientific_new/savannah_arid/events/savann
a_science_network_meeting.php and two peer reviewed papers in this regard
- Appendix F). It is encouraging that we in the APNR are currently collaborating with
KNP on integrated management plans. As stated earlier the KPNR and TPNR plans
are complete while the UPNR, BNR and TNR are in the final phase of completion.
Stocking densities throughout the APNR have been well above the guideline in
recent years. As we came off a run of ‘good’ rainfall years, we have for a number of
years sensitized landowners to the possible effects of a dry/drought period. The
question previously asked was “what if we have a poor season where a relatively
favourable situation switches quickly to one where we suffer food shortages and
concomitant animal die-offs (particularly under heavy stocking densities)?” The
strength of the APNR is that it is ‘unfenced’ and relatively large and animals are free
to move to areas with better forage resources – which as stated above appears to
have happened to an extent. Water dependent species (e.g. impala and wildebeest)
are however generally sedentary and often do not move in response to diminishing
resources (unlike species such as buffalo and elephant). Therefore, even though the
APNR system is relatively large and ‘open’ (although this is not entirely true as there
are still fences, people and management that restrict unlimited movement) drought
has an impact on the herbivore component. Water provision re-scales the area such
that it functions at much smaller spatial scales. This is particularly relevant as

38
discussed in the previous paragraph where the water situation between the APNR
and KNP remains completely unbalanced (see Appendix A and Appendix F).
39
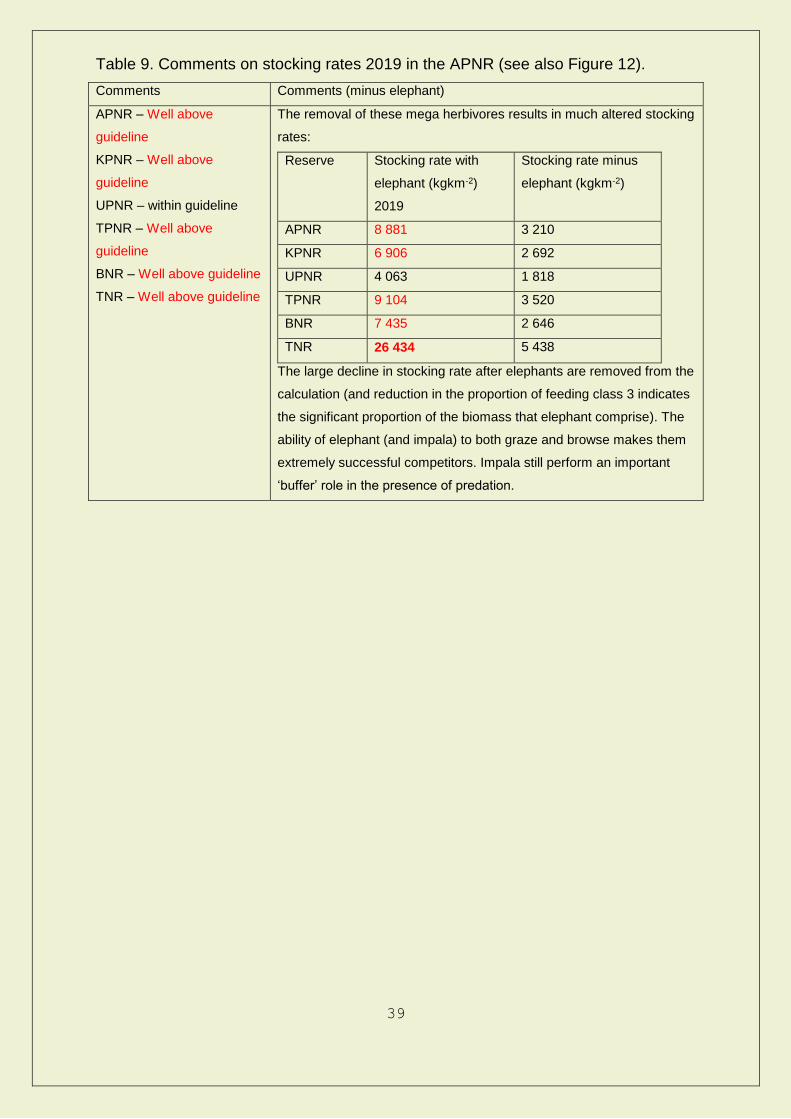
Table 9. Comments on stocking rates 2019 in the APNR (see also Figure 12).
Comments Comments (minus elephant)
APNR – Well above
guideline
KPNR – Well above
guideline
UPNR – within guideline
TPNR – Well above
guideline
BNR – Well above guideline
TNR – Well above guideline
The removal of these mega herbivores results in much altered stocking
rates:
Reserve Stocking rate with
elephant (kgkm-2)
2019
Stocking rate minus
elephant (kgkm-2)
APNR 8 881 3 210
KPNR 6 906 2 692
UPNR 4 063 1 818
TPNR 9 104 3 520
BNR 7 435 2 646
TNR 26 434 5 438
The large decline in stocking rate after elephants are removed from the
calculation (and reduction in the proportion of feeding class 3 indicates
the significant proportion of the biomass that elephant comprise). The
ability of elephant (and impala) to both graze and browse makes them
extremely successful competitors. Impala still perform an important
‘buffer’ role in the presence of predation.

40
Table 10 Indicating skewed feeding class proportions in the APNR (also see Figure
13).
Comments – current situation Comments (minus elephant) Reserve Feeding
class 1 Feeding class 2
Feeding class 3
Feeding class 4
The removal of these mega herbivores results in much altered feeding class ratios:
Reserve Feeding class ratios
with elephant (%) 2014
Feeding class ratios
minus elephant (%)
Feeding
class
1 2 3 4 1 2 3 4
APNR 20 1 72 7 53 4 23 20
KPNR 16 1 72 11 41 3 28 28
UPNR 30 0.2 63 6 67 0.5 18 15
TPNR 22 3 69 6 58 6 20 16
BNR 15 1 75 9 43 3 28 26
TNR 12 1 84 3 56 5 24 15
The situation is not much changed indicating generally extremely high proportions of feeding class 3 due to high elephant numbers. The large decline in the proportion of feeding class 3 after removing elephant from the calculations removal indicates the significant proportion of the biomass that elephant comprise. See above table for additional comment. Feeding class 1 remains relatively low post the drought although buffalo are returning and increasing in numbers. Feeding class 2 remains critically low throughout. The low number of wildebeest highlights the latter statement and with the ‘boom and bust’ nature of warthog fluctuations, the situation in feeding class 2 remains critical.
APNR Well below guideline
Critically low
Well
above
guideline
Below guideline
KPNR Well below guideline
Critically low
Well
above
guideline
Below guideline
UPNR Well below guideline
Critically low
Well
above
guideline
Below guideline
TPNR Well below guideline
Critically low
Well
above
guideline
Below guideline
BNR Well below guideline
Critically low
Well
above
guideline
Below guideline
TNR Critically low
Critically low
Well
above
guideline
Critically low
The actual number trends of the major animal species within the above feeding
classes are presented in Figures 14 (a –d) with a combined figure for the APNR
(discussed in Table 11).
41
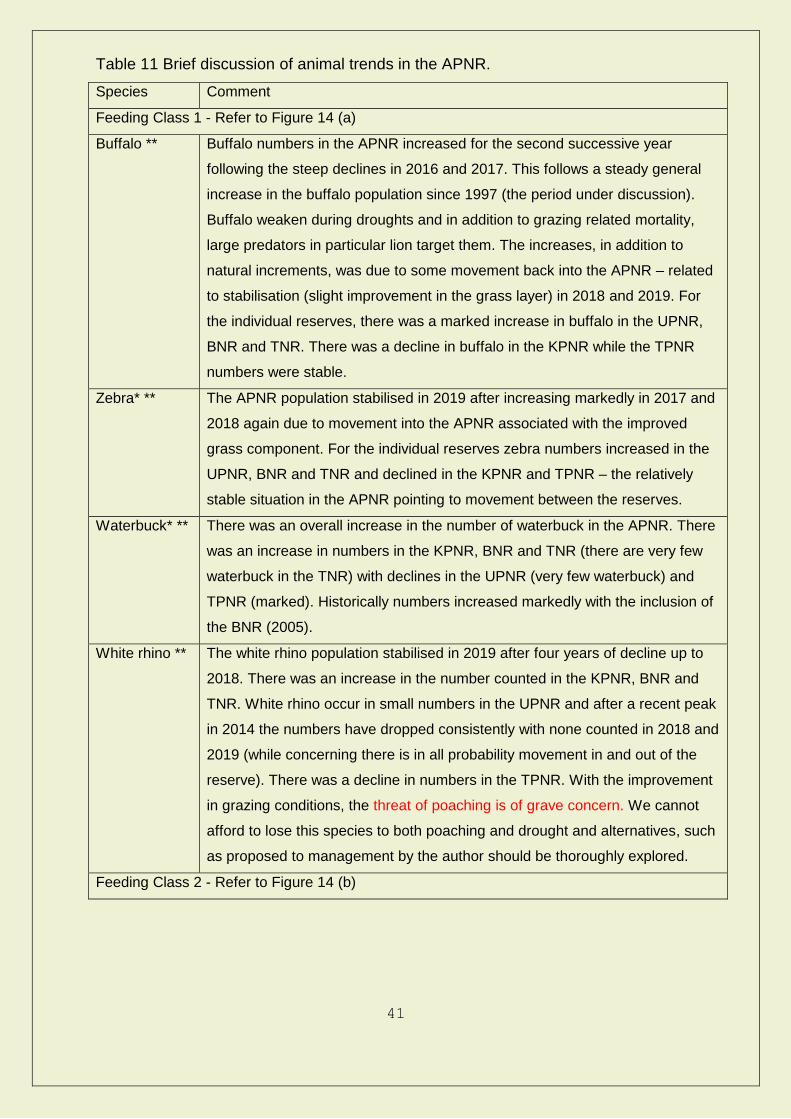
Table 11 Brief discussion of animal trends in the APNR.
Species Comment
Feeding Class 1 - Refer to Figure 14 (a)
Buffalo ** Buffalo numbers in the APNR increased for the second successive year
following the steep declines in 2016 and 2017. This follows a steady general
increase in the buffalo population since 1997 (the period under discussion).
Buffalo weaken during droughts and in addition to grazing related mortality,
large predators in particular lion target them. The increases, in addition to
natural increments, was due to some movement back into the APNR – related
to stabilisation (slight improvement in the grass layer) in 2018 and 2019. For
the individual reserves, there was a marked increase in buffalo in the UPNR,
BNR and TNR. There was a decline in buffalo in the KPNR while the TPNR
numbers were stable.
Zebra* ** The APNR population stabilised in 2019 after increasing markedly in 2017 and
2018 again due to movement into the APNR associated with the improved
grass component. For the individual reserves zebra numbers increased in the
UPNR, BNR and TNR and declined in the KPNR and TPNR – the relatively
stable situation in the APNR pointing to movement between the reserves.
Waterbuck* ** There was an overall increase in the number of waterbuck in the APNR. There
was an increase in numbers in the KPNR, BNR and TNR (there are very few
waterbuck in the TNR) with declines in the UPNR (very few waterbuck) and
TPNR (marked). Historically numbers increased markedly with the inclusion of
the BNR (2005).
White rhino ** The white rhino population stabilised in 2019 after four years of decline up to
2018. There was an increase in the number counted in the KPNR, BNR and
TNR. White rhino occur in small numbers in the UPNR and after a recent peak
in 2014 the numbers have dropped consistently with none counted in 2018 and
2019 (while concerning there is in all probability movement in and out of the
reserve). There was a decline in numbers in the TPNR. With the improvement
in grazing conditions, the threat of poaching is of grave concern. We cannot
afford to lose this species to both poaching and drought and alternatives, such
as proposed to management by the author should be thoroughly explored.
Feeding Class 2 - Refer to Figure 14 (b)
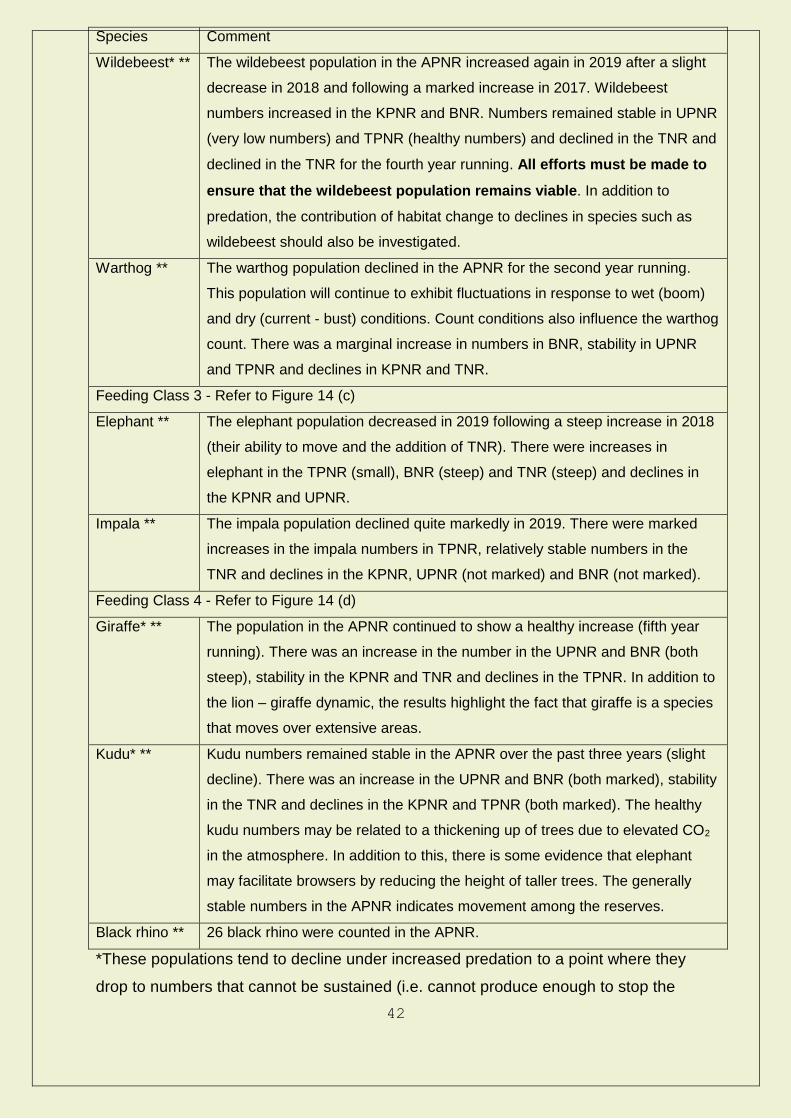
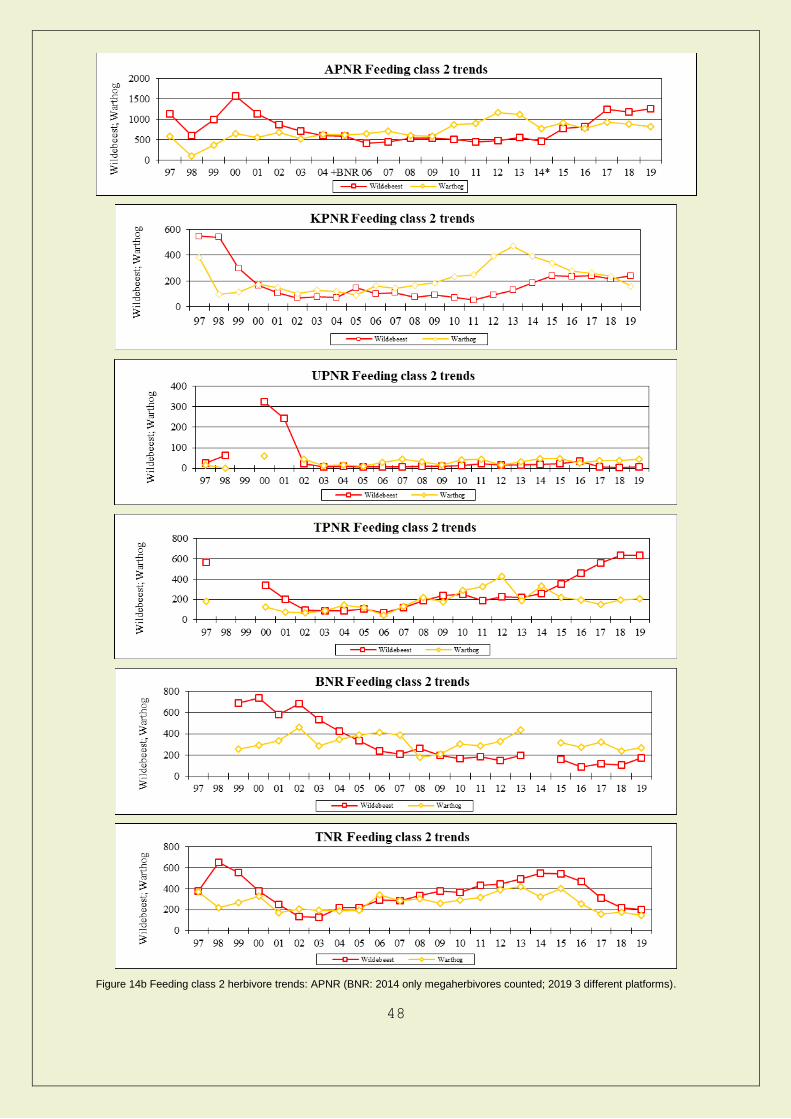
42
Species Comment
Wildebeest* ** The wildebeest population in the APNR increased again in 2019 after a slight
decrease in 2018 and following a marked increase in 2017. Wildebeest
numbers increased in the KPNR and BNR. Numbers remained stable in UPNR
(very low numbers) and TPNR (healthy numbers) and declined in the TNR and
declined in the TNR for the fourth year running. All efforts must be made to
ensure that the wildebeest population remains viable. In addition to
predation, the contribution of habitat change to declines in species such as
wildebeest should also be investigated.
Warthog ** The warthog population declined in the APNR for the second year running.
This population will continue to exhibit fluctuations in response to wet (boom)
and dry (current - bust) conditions. Count conditions also influence the warthog
count. There was a marginal increase in numbers in BNR, stability in UPNR
and TPNR and declines in KPNR and TNR.
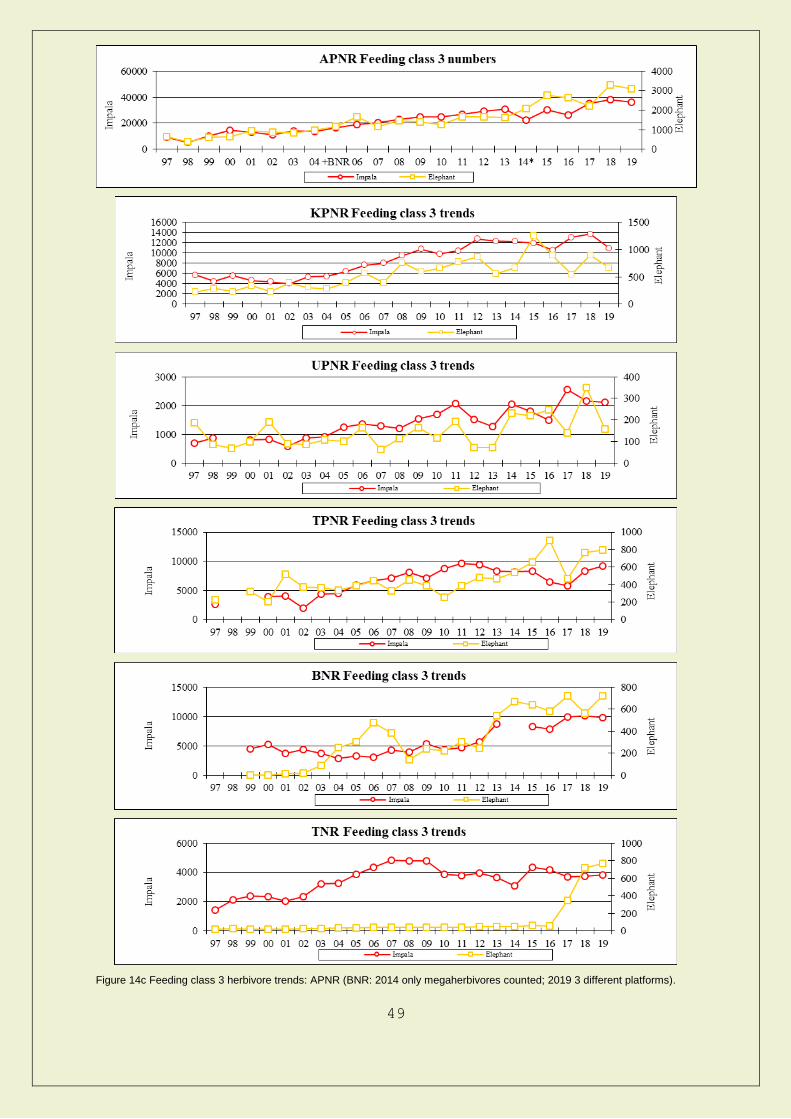
Feeding Class 3 - Refer to Figure 14 (c)
Elephant ** The elephant population decreased in 2019 following a steep increase in 2018
(their ability to move and the addition of TNR). There were increases in
elephant in the TPNR (small), BNR (steep) and TNR (steep) and declines in
the KPNR and UPNR.
Impala ** The impala population declined quite markedly in 2019. There were marked
increases in the impala numbers in TPNR, relatively stable numbers in the
TNR and declines in the KPNR, UPNR (not marked) and BNR (not marked).
Feeding Class 4 - Refer to Figure 14 (d)
Giraffe* ** The population in the APNR continued to show a healthy increase (fifth year
running). There was an increase in the number in the UPNR and BNR (both
steep), stability in the KPNR and TNR and declines in the TPNR. In addition to
the lion – giraffe dynamic, the results highlight the fact that giraffe is a species
that moves over extensive areas.
Kudu* ** Kudu numbers remained stable in the APNR over the past three years (slight
decline). There was an increase in the UPNR and BNR (both marked), stability
in the TNR and declines in the KPNR and TPNR (both marked). The healthy
kudu numbers may be related to a thickening up of trees due to elevated CO2
in the atmosphere. In addition to this, there is some evidence that elephant
may facilitate browsers by reducing the height of taller trees. The generally
stable numbers in the APNR indicates movement among the reserves.
Black rhino ** 26 black rhino were counted in the APNR.
*These populations tend to decline under increased predation to a point where they
drop to numbers that cannot be sustained (i.e. cannot produce enough to stop the

43
population declines i.e. a predator pit). With the removal of fences, there has
obviously been movement between the reserves and the KNP. This is very evident
when one looks at the recent relatively stable game populations but with often-wide
fluctuation within the APNR. ** See Appendix A, B, F and Peel & Anderson (2016)
for discussion around animal trends in the APNR since 2015. There is an
association between certain species (particularly mobile larger grazers) and the
wetter more productive southern areas of the APNR.
The early positive contribution of BNR in terms of animal numbers is evident from
previous year’s counts as this area experienced more intensive (predator)
management in the past due to it being fenced. This is again underlined by the
addition of more land into the BNR and the addition of the TNR contributing to
increases in the numbers of various species (hence studying the results at both
APNR and individual reserve level). The challenge remains to manage the APNR in
such a way that the animals move in response to the mosaic of varying food
resources – this seems to be happening but not necessarily due to management.
Preliminary ‘Thresholds of Potential Concern’ are available and emphasise the
importance of setting the limits of acceptable change. The tenuous position of
certain prey species on the one hand (see above) and high densities of mixed
feeders (elephant and impala) illustrate this on the other hand in the APNR. It is
recommended that preliminary TPCs for herbivores on APNR are set on the basis of
measurable criteria such as proportion of the total biomass a species constitutes,
estimated rates of increase and survival, impact on other species and vegetation, as
well as an element of predator impact, calving percentage and survival and calving
interval. Should a population move outside the limits of the TPC, the situation must
be investigated and remedial action taken where practicable (the individual
management plans will address this).
The recent dry seasons have had a marked impact on the herbivore populations in
the APNR (read Appendix A, B and F). Between 2015 and 2018 the grass layer was
limiting for grazers in general in the APNR. Discussion relating to animal
management and drought is discussed in depth in previous reports (Appendix F).
44
I would welcome discussion using the energy flow model (see below) that yields the
number of animals required to minimise grazing stress. In addition to the fact that
the system is open to the KNP, the influence of favourable rainfall years and drought
on vegetation cover has obvious implications for, among others: fire, herbivore
dynamics and interactions, predator-prey relations, counting conditions and
ultimately game numbers. In addition to the data collected by management, much
information exists within the current landowner and lodge structure. I would be willing
to assist in the collation and presentation of any such data collected within the
APNR. We continue to enjoy the collaboration on ecological issues between the
various wardens, researchers and landowners in the area. See Appendix A, F and
Peel & Anderson (2016) for further discussion in this regard.

45
Figure 12 Animal biomass (kg km-2) in the APNR (*BNR - 2014 only megaherbivores counted and 2019 three different
platforms).

46
Figure 13 Feeding class ratios in the APNR (BNR: 2014 only megaherbivores counted; 2019 3 different platforms).

47
Figure 14a Feeding class 1 herbivore trends: APNR (BNR: 2014 only megaherbivores counted; 2019 3 different platforms).
48
Figure 14b Feeding class 2 herbivore trends: APNR (BNR: 2014 only megaherbivores counted; 2019 3 different platforms).
49
Figure 14c Feeding class 3 herbivore trends: APNR (BNR: 2014 only megaherbivores counted; 2019 3 different platforms).

50
Figure 14d Feeding class 4 herbivore trends: APNR (BNR: 2014 only megaherbivores counted; 2019 3 different platforms).
51
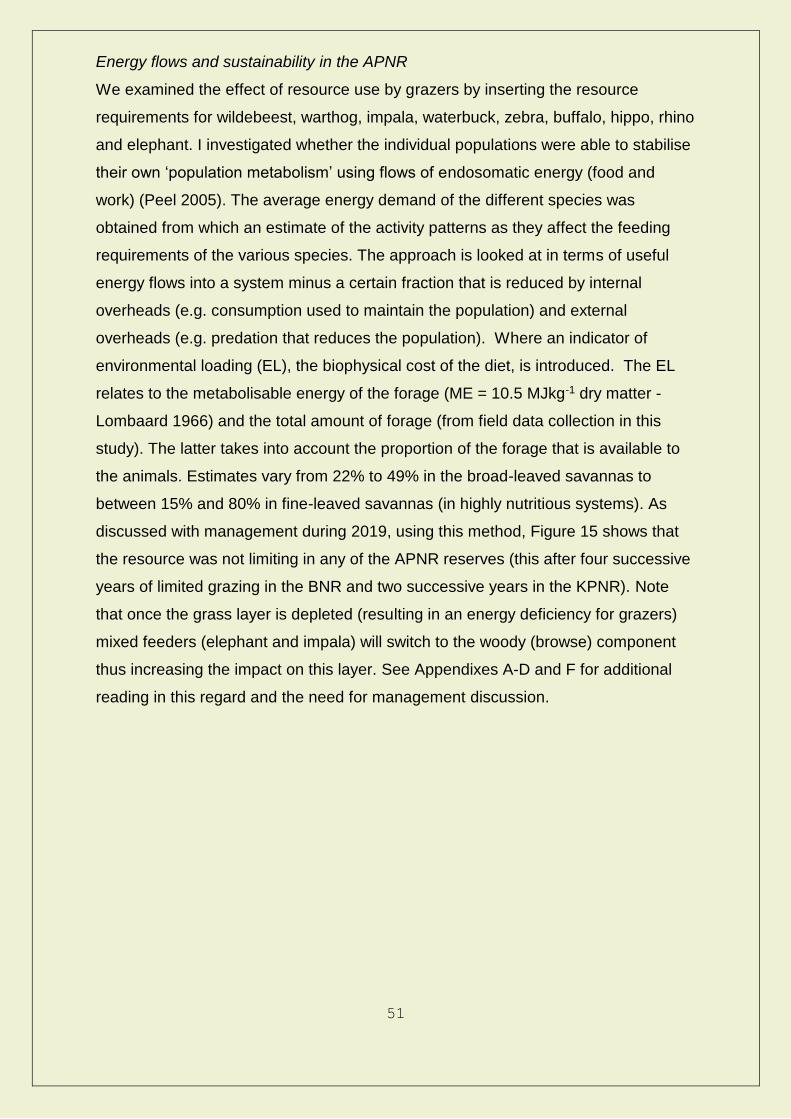
Energy flows and sustainability in the APNR
We examined the effect of resource use by grazers by inserting the resource
requirements for wildebeest, warthog, impala, waterbuck, zebra, buffalo, hippo, rhino
and elephant. I investigated whether the individual populations were able to stabilise
their own ‘population metabolism’ using flows of endosomatic energy (food and
work) (Peel 2005). The average energy demand of the different species was
obtained from which an estimate of the activity patterns as they affect the feeding
requirements of the various species. The approach is looked at in terms of useful
energy flows into a system minus a certain fraction that is reduced by internal
overheads (e.g. consumption used to maintain the population) and external
overheads (e.g. predation that reduces the population). Where an indicator of
environmental loading (EL), the biophysical cost of the diet, is introduced. The EL
relates to the metabolisable energy of the forage (ME = 10.5 MJkg-1 dry matter -
Lombaard 1966) and the total amount of forage (from field data collection in this
study). The latter takes into account the proportion of the forage that is available to
the animals. Estimates vary from 22% to 49% in the broad-leaved savannas to
between 15% and 80% in fine-leaved savannas (in highly nutritious systems). As
discussed with management during 2019, using this method, Figure 15 shows that
the resource was not limiting in any of the APNR reserves (this after four successive
years of limited grazing in the BNR and two successive years in the KPNR). Note
that once the grass layer is depleted (resulting in an energy deficiency for grazers)
mixed feeders (elephant and impala) will switch to the woody (browse) component
thus increasing the impact on this layer. See Appendixes A-D and F for additional
reading in this regard and the need for management discussion.
52
Figure 15 Resource availability in a multi-species grazing system – APNR 2019
(KPNR - red; UPNR - gold; TPNR – green; BNR – blue; TNR - orange).
Energy required
(1) 372330 116083 570742 372055 276727 MJd-1
Potential
activity (2) 116148840 26052240 121177080 107905680 50606520 h
Rest Overhead
(3) 53%
Actual available
activity (4) 61558885 13807687 64223852 57190010 26821456 h
Maintenance/ reproduction
overhead (5) 14%
Available activity
Food (6) 48782513 10941941 50894374 45320386 21254738 h
Grass required
(7)
12942893
4035280
19840069
12933323
9619561 kg y-1APPA-1
Energy
required (8)
12942893 42370441 208320721 135799892 101005392 MJy-1
Grass available (5794005) = +16447497 APPA-1
Grass available (10040651) = +6005370 APPA-1
Grass available (57950167) = +38110098 APPA-1
Grass available (7433139) = +51031356 APPA-1
Grass available (26185209) = +16565648 APPA-1
Resource not
limiting for KPNR
UPNR, TPNR, BNR
and TNR
53
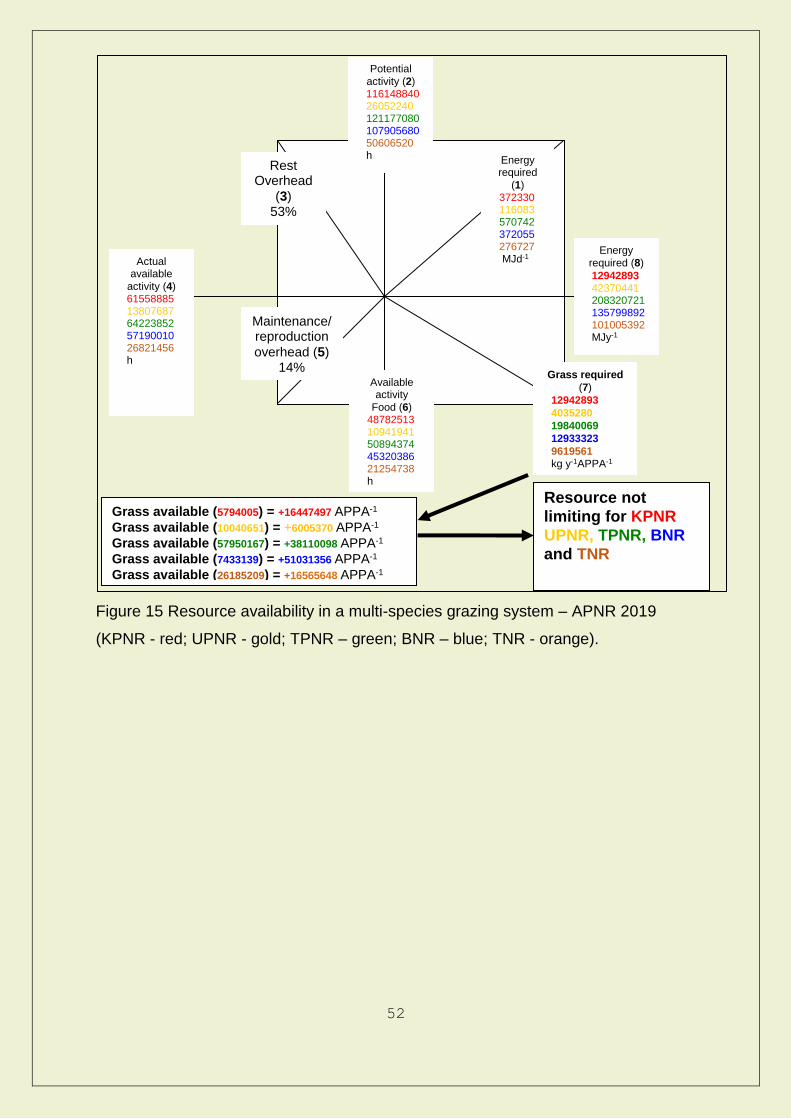
An amount of 1 % of the total value (not hunting) of the animals present on a
reserve is considered reasonable when deciding on doing a game count (ABSA
2003). Game values were obtained from various sources including wardens from the
area. I assume 1% for the vegetation and faecal analysis-monitoring programme
(not including the cost of land, infrastructure etc.). Table 13 summarises the situation
for the APNR reserves based on the 2019 game count:
Table 12: APNR estimate of costs as a proportion of the value of animals present.
Species Total Value (R)
(1) Total cost of vegetation monitoring and faecal analysis per annum (Exc. Vat) (R)
(2) Total cost of helicopter count @ say R7 500 per hour (Exc. Vat) – say 75h (R)
Value (R) 295730883 ≈247 191 660 000
Cost of ecological monitoring (1) and (2) as percentage of value of game (%)
(1) 0.08 (2) 0.20
Cost of ecological monitoring as percentage of value of game (%)
0.28
Recommended percentage (%)
2.0
* Estimate of what the reserve would currently receive per animal; **Mean of
estimated male and female costs.
The above indicates that the cost of the various ecological monitoring
exercises is well within the guideline for the APNR reserves.
54
FAECAL ANALYSIS
Seventeen reserves have extended their ecological monitoring programme to
include looking at animal condition as an adjunct to the ARC-API veld-monitoring
programme. Dr Rina Grant former research scientist in the Kruger National Park, is
collaborating with us on this project (retired).
Protein is the most common nutrient that limits animal performance and survival.
Faecal protein, measured as faecal Nitrogen (N), gives an idea of what the animal is
able to select. The measurement is correlated with forage digestibility, dietary
protein, phosphorous concentration and weight change. Phosphorous (P) is
commonly limiting during dry periods in particular. P is important in energy storage
and as a part building block of bones and teeth, (it is thus important in lactation). P
deficiencies generally lead to reduced reproduction rates. The higher the protein and
phosphorous concentrations and digestibility the greater the palatability of the
plants. Environmental conditions affect N and P concentrations and rainfall in
particular is correlated to their availability.
The paper by Grant, Peel, Zambatis & van Ryssen 2000 (reference given under
REFERENCES) is available on request.
RESULTS AND DISCUSSION
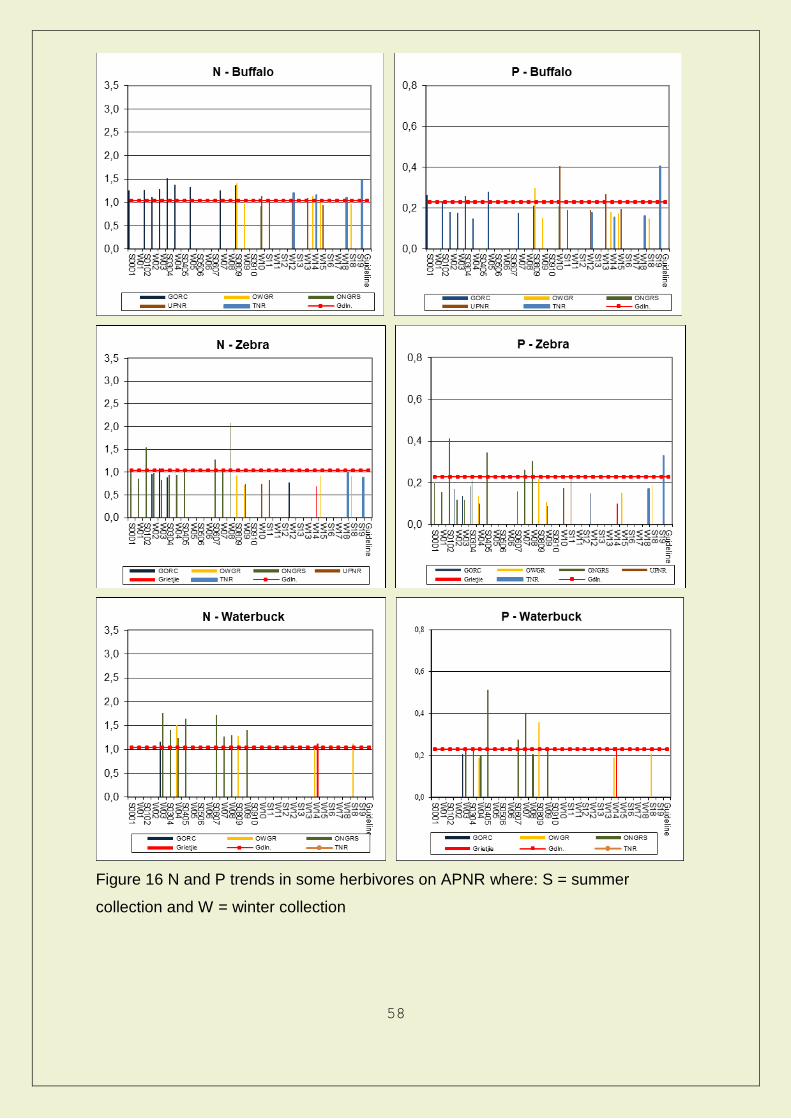
Faecal samples have been received intermittently for a number of years. In 2019
samples were only received from TNR (Thornybush) out of the entire APNR. This is
a pity given the drought we are experiencing/recovering from and the learning
opportunity missed by not having a wider (spatial and temporal) data base. The
results of analyses are presented in Figure 16.
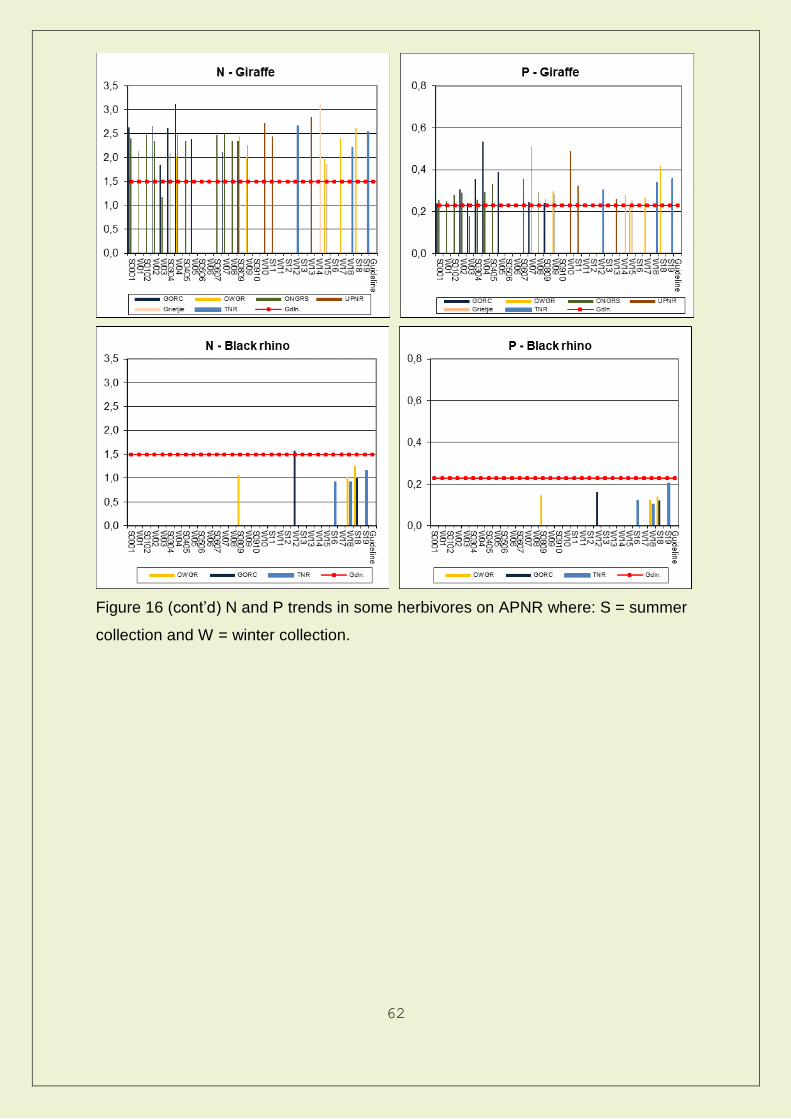
Results show that the N levels for grazers are much improved but still generally
lower than those for mixed feeders and browsers thus supporting the premise that in
these savanna systems the grass layer is the limiting layer. This is illustrated by the
results obtained in the drought conditions (Appendix F).
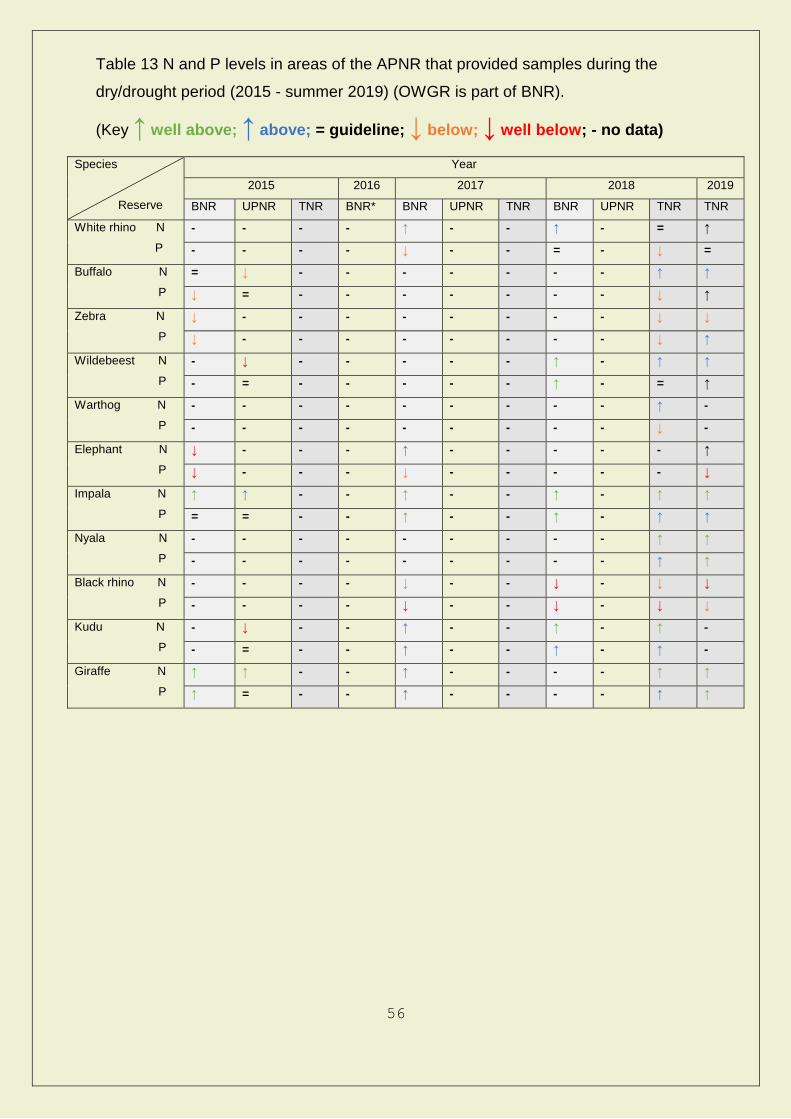
The results for N and P levels for during the dry/drought (2015 – 2019) period
55
relative to the guideline are presented in Table 13 and Figure 16.
For 2019 the N levels in grazers were generally above to well above the guideline –
a sign of an improving grass layer. The exception is zebra which was below the
guideline but zebra are able to take grass that is less palatable and nutritious
containing higher levels of lignin and fibre and still survive. Interestingly P levels
among grazers increased across the board and were above to well above the
guideline for all grazers with the exception of white rhino which was at the guideline.
For 2019, the N and P levels in mixed feeders (impala and nyala) and browsers
(giraffe) were above to well above the guideline. The ability of mixed feeders to
optimise their nutritional uptake by switching between grazing and browsing is
illustrated while the quality of browse is illustrated for the browsing component. The
exception for mixed feeders for P was elephant which was below the guideline and
black rhino for N and P, yielding results that were well below and below respectively
indicating grazing stress in particular throughout the winter in the latter species.
56
Table 13 N and P levels in areas of the APNR that provided samples during the
dry/drought period (2015 - summer 2019) (OWGR is part of BNR).
(Key ↑ well above; ↑ above; = guideline; ↓ below; ↓ well below; - no data)
Species
Reserve
Year
2015 2016 2017 2018 2019
BNR UPNR TNR BNR* BNR UPNR TNR BNR UPNR TNR TNR
White rhino N
P
- - - - ↑ - - ↑ - = ↑
- - - - ↓ - - = - ↓ =
Buffalo N
P
= ↓ - - - - - - - ↑ ↑
↓ = - - - - - - - ↓ ↑
Zebra N
P
↓ - - - - - - - - ↓ ↓
↓ - - - - - - - - ↓ ↑
Wildebeest N
P
- ↓ - - - - - ↑ - ↑ ↑
- = - - - - - ↑ - = ↑
Warthog N
P
- - - - - - - - - ↑ -
- - - - - - - - - ↓ -
Elephant N
P
↓ - - - ↑ - - - - - ↑
↓ - - - ↓ - - - - - ↓
Impala N
P
↑ ↑ - - ↑ - - ↑ - ↑ ↑
= = - - ↑ - - ↑ - ↑ ↑
Nyala N
P
- - - - - - - - - ↑ ↑
- - - - - - - - - ↑ ↑
Black rhino N
P
- - - - ↓ - - ↓ - ↓ ↓
- - - - ↓ - - ↓ - ↓ ↓
Kudu N
P
- ↓ - - ↑ - - ↑ - ↑ -
- = - - ↑ - - ↑ - ↑ -
Giraffe N
P
↑ ↑ - - ↑ - - - - ↑ ↑
↑ = - - ↑ - - - - ↑ ↑
57
I would encourage pooled samples as this gives us an idea of the situation within the
population and not just a single animal. Data are also largely discontinuous and
therefore of limited value and I encourage the various reserves within the APNR to
make use of this valuable animal based system indicator.
Consistent data collection and the pooling of greater numbers of animals per sample
(and including a spectrum of sex and age classes) will allow us to monitor N and P
levels in relation to threshold’s that may indicate a dietary deficiency (N) or P
deficiencies that may lead to low reproductive rates. As previously requested sex
and age data, lambing/calving rates and survival/mortality (related to sex and age)
could prove to be an important adjunct to the faecal analysis and by extension the
ecological monitoring programme as a whole (Appendix E).
58
Figure 16 N and P trends in some herbivores on APNR where: S = summer
collection and W = winter collection

59
Figure 16 (cont’d) N and P trends in some herbivores on APNR where: S = summer
collection and W = winter collection.

60
Figure 16 (cont’d) N and P trends in some herbivores on APNR where: S = summer
collection and W = winter collection.

61
Figure 16 (cont’d) N and P trends in some herbivores on APNR where: S = summer
collection and W = winter collection.
62
Figure 16 (cont’d) N and P trends in some herbivores on APNR where: S = summer
collection and W = winter collection.

63
The APNR is in an excellent position in terms of information available for the
management of herbivores and, where reliable trends are sought, the value of
regular consistent counting methods and teams cannot be overemphasised. The
importance of the ecological monitoring programme is apparent, as any change in
management actions will interact with climatic conditions to influence the vegetation
component.
Overall, the monitoring programme has received excellent support from all members
within the APNR. The addition of TNR represents a valuable asset and also with an
outstanding record of ecological data available. We have a database from which
sound management decisions are made, where hazards can be avoided and
opportunities grasped to the benefit of the properties. I thank all concerned for the
keen interest shown in this project and would like to restate that I am available to
discuss the ecological monitoring programme with you at any time.
64
REFERENCES AND OTHER READING
ABSA. 2003. Game ranch profitability in South Africa (3rd ed.). ABSA Economics.
Coe M.J., Cumming D.H. & Phillipson J. 1976. Biomass and production of large African herbivores in
relation to rainfall and primary production. Oecologia 22: 341-354.
Collinson R.F.H. & Goodman P.S. 1982. An Assessment of range condition and large herbivore
carrying capacity of the Pilanesberg Game Reserve, with guidelines and recommendations for
management. Inkwe (1).
Grant C.C., Peel M.J.S., Zambatis N. & van Ryssen J.B.J. 2000. Nitrogen and phosphorous
concentration in faeces: an indicator of range quality as a practical adjunct to existing range evaluation
methods. African Journal of Range and Forage Science 17(1, 2, &3): 81-92.
Peel Mike (ed.) 2000. Ecological Monitoring: Balule Nature Reserve.
Peel Mike (ed.) 2001. Ecological Monitoring: Balule Nature Reserve.
Peel Mike 2002. To manage or not to manage wildebeest in the Timbavati Private Nature Reserve.
Unpublished landowner report.
Peel Mike (ed.) 2002. Ecological Monitoring: Balule Nature Reserve.
Peel Mike (ed.) 2003. Ecological Monitoring: Balule Nature Reserve.
Peel M.J.S., Peel J.M.H. & Montagu G.P. 1993. AN ECOLOGICAL REVIEW AND SURVEY OF
TIMBAVATI/UMBABAT PRIVATE NATURE RESERVE (Unpublished report).
Peel M.J.S., Peel J.M.H. & Montagu G.P. 1996. ECOLOGICAL MONITORING
TIMBAVATI/UMBABAT PRIVATE NATURE RESERVES. Unpublished report).
Peel M.J.S., Peel J.M.H., McNamara T.M.S. & Jacobs A.F. 1997. Ecological Monitoring:
Timbavati/Umbabat Private Nature Reserves. (Unpublished report).
Peel M.J.S., Peel J.M.H., McNamara T.M.S. & Jacobs A.F. 1998. Ecological Monitoring:
Timbavati/Umbabat Private Nature Reserves. (Unpublished report).
Peel Mike (ed.) 1999 Ecological Monitoring: Timbavati Private Nature Reserve. (Unpublished report).
Peel Mike (ed.) 1999 Ecological Monitoring: Umbabat Private Nature Reserve. (Unpublished report).
Peel Mike (ed.) 2000 Ecological Monitoring: Timbavati and Umbabat Private Nature Reserves.
(Unpublished report).
Peel Mike (ed.) 2001 Ecological Monitoring: Timbavati and Umbabat Private Nature Reserves.
(Unpublished report).
Peel Mike (ed.) 2002 Ecological Monitoring: Timbavati and Umbabat Private Nature Reserves.
(Unpublished report).
Peel Mike 2003. Ecological Monitoring: APNR. (Unpublished landowner report).
Peel Mike 2004. Ecological Monitoring: APNR. (Unpublished landowner report).
Peel Mike 2005. Ecological Monitoring: Association of Private Nature Reserves. (Unpublished
landowner report).
Peel Mike 2006. Ecological Monitoring: Association of Private Nature Reserves. (Unpublished
landowner report).
Peel Mike 2007. Ecological Monitoring: Association of Private Nature Reserves. (Unpublished
landowner report).
Peel Mike 2008. Ecological Monitoring: Association of Private Nature Reserves. (Unpublished

65
landowner report).
Peel Mike 2009. Ecological Monitoring: Association of Private Nature Reserves. (Unpublished
landowner report).
Peel Mike 2009. Ecological Monitoring: Association of Private Nature Reserves. (Unpublished
landowner report).
Peel Mike 2010. Ecological Monitoring: Association of Private Nature Reserves. (Unpublished
landowner report).
Peel Mike 2011. Ecological Monitoring: Association of Private Nature Reserves. (Unpublished
landowner report).
Peel Mike 2012. Ecological Monitoring: Association of Private Nature Reserves. (Unpublished
landowner report).
Peel Mike 2013. Ecological Monitoring: Association of Private Nature Reserves. (Unpublished
landowner report).
Peel Mike 2014. Ecological Monitoring: Association of Private Nature Reserves. (Unpublished
landowner report).
Peel Mike 2015. Ecological Monitoring: Association of Private Nature Reserves. (Unpublished
landowner report).
Peel Mike 2016. Ecological Monitoring: Association of Private Nature Reserves – incorporating
Thornybush Nature Reserve. (Unpublished landowner report).
Peel Mike 2017. Ecological Monitoring: Association of Private Nature Reserves – incorporating
Thornybush Nature Reserve. (Unpublished landowner report).
Peel Mike 2018. Ecological Monitoring: Association of Private Nature Reserves. (Unpublished
landowner report).
Peel M.J.S. (ed.) 1995. AN ECOLOGICAL REVIEW AND SURVEY OF THORNYBUSH GAME
RESERVE. Unpubished report.
Peel M.J.S. (ed.). AN ECOLOGICAL REVIEW AND SURVEY OF LIVEYDALE GAME RANCH.
Unpublished report.
Peel M.J.S. (ed.). 1998. An Ecological Survey of Waterbuck Game Farm. Unpublished report.
Peel M.J.S. (ed.). 2000. Ecological Monitoring: Thornybush Game Reserve. Unpublished report.
Peel Mike (ed.). 2001. Ecological Monitoring: Thornybush Game Reserve. Unpublished report.
Peel Mike. 2002. Elephant management plan for Thornybush Game Reserve. Unpublished report.
Peel Mike. 2002. Black rhino habitat suitability assessment: Thornybush Game Reserve
Peel Mike (ed.). 2002. Ecological Monitoring: Thornybush Game Reserve. Unpublished report.
Peel Mike (ed.). 2002. Ecological Monitoring: Thornybush Game Reserve, Xilusi/Waterbuck and
Ridgeway. Unpublished report.
Peel Mike (ed.). 2003. Ecological Monitoring: Thornybush Game Reserve. Unpublished report.
Peel Mike (ed.). 2004. Ecological Monitoring: Thornybush Game Reserve (incorporating
Xilutsi/Waterbuck). Unpublished report.
Peel Mike (ed.). 2005. Ecological Monitoring: Thornybush Game Reserve. Unpublished report.
Peel Mike (ed.). 2006. Ecological Monitoring: Thornybush Game Reserve. Unpublished report.
Peel Mike. 2006. Annexure to Thornybush Game Reserve management Plan – A management plan
66
for predators: Thornybush Game Reserve (Annexure E).
Peel Mike (ed.). 2007. Ecological Monitoring: Thornybush Game Reserve. Unpublished report.
Peel Mike (ed.). 2008. Ecological Monitoring: Thornybush Game Reserve. Unpublished report.
Peel Mike (ed.). 2009. Ecological Monitoring: Thornybush Game Reserve. Unpublished report.
Peel Mike (ed.). 2010. Ecological Monitoring: Thornybush Game Reserve. Unpublished report.
Peel Mike (ed.). 2011. Ecological Monitoring: Thornybush Game Reserve. Unpublished report.
Peel Mike (ed.). 2012. Ecological Monitoring: Thornybush Game Reserve. Unpublished report.
Peel Mike (ed.). 2013. Ecological Monitoring: Thornybush Game Reserve. Unpublished report.
Peel Mike. 2014. Elephant Management Plan: Thornybush Game Reserve. Unpublished report.
Peel Mike (ed.). 2014. Ecological Monitoring: Thornybush Game Reserve. Unpublished report.
Peel Mike (ed.). 2015. Ecological Monitoring: Thornybush Game Reserve. Unpublished report.
Peel Mike (ed.). 2016. Ecological Monitoring: Thornybush Game Reserve. Unpublished report.
Peel Mike (ed.). 2017. Ecological Monitoring: Thornybush Game Reserve. Unpublished report.
Peel Mike. 2 OCTOBER 2015. Lowveld Protected Areas: to manage or not to manage? FW.
Peel M.J.S. 2005. Towards a predictive understanding of savanna vegetation dynamics in the eastern
Lowveld of South Africa: with implications for effective management. PhD thesis - University of
kwaZulu-Natal.
Peel M.J.S., Kruger J.M. & Zacharias P.J.K. 2005. Environmental and management determinants of
vegetation state on protected areas in the eastern Lowveld of South Africa. African Journal of Ecology
43, 352-361. (2005).
Range and Forage Institute 1990. AN ECOLOGICAL REVIEW AND SURVEY OF THE KLASERIE
PRIVATE NATURE RESERVE - ed. M.J.S. Peel.
Range and Forage Institute 1994. AN ECOLOGICAL REVIEW AND SURVEY
OF KLASERIE PRIVATE NATURE RESERVE - ed. M.J.S. Peel.
Range and Forage Institute 1995. ECOLOGICAL MONITORING: KLASERIE PRIVATE NATURE
Range and Forage Institute 1995. BALULE NATURE RESERVE - M.J.S. Peel, J.M.H. Peel, A.
Jacobs & T.M.S. McNamara.
Range and Forage Institute 1995. ECOLOGICAL MONITORING: BALULE NATURE RESERVE -
M.J.S. Peel, J.M.H. Peel, A. Jacobs & T.M.S. McNamara.
Range and Forage Institute 1996. ECOLOGICAL MONITORING: BALULE NATURE RESERVE -
M.J.S. Peel, J.M.H. Peel, A. Jacobs & T.M.S. McNamara.
Range and Forage Institute 1997. ECOLOGICAL MONITORING: BALULE NATURE RESERVE -
M.J.S. Peel, J.M.H. Peel, A. Jacobs & T.M.S. McNamara.
Range and Forage Institute 1998. ECOLOGICAL MONITORING: BALULE NATURE RESERVE -
M.J.S. Peel, J.M.H. Peel, A. Jacobs & T.M.S. McNamara.
Range and Forage Institute 1999. ECOLOGICAL MONITORING: BALULE NATURE RESERVE -
M.J.S. Peel, J.M.H. Peel, A. Jacobs & T.M.S. McNamara.
Range and Forage Institute 1999. AN ECOLOGICAL REVIEW AND SURVEY OF OLIFANTS RIVER
GAME RESERVE - M.J.S. Peel, J.M.H. Peel, A. Jacobs & T.M.S. McNamara.
Toxopeus, A.G. 1999. An interactive spatial and temporal modelling system as a tool in ecosystem
management. PhD thesis University of Amsterdam, Netherlands.

67
Appendix A
Correspondence relating to management response to current drought - APNR.
FOR CONSIDERATION: CHAIRMEN AND WARDENS APNR (v8)
12/04/16
Klaserie, Balule, Umbabat and Timbavati Representatives
Attention Colin Rowles (Reserve Warden Representative)
Dear Colin
GRAZING SITUATION AND OFFTAKES 2016: APNR
This report is a follow up on the letter dated 06/12/15 and correspondence dated
26/01/16 that I (MP) wrote to the wardens of the APNR (the latter document to
chairpersons as well) and expressing my concern around the critical grazing
situation within the APNR. With the reduction in water points in the Kruger National
Park (KNP) the current vegetation situation is unlike in the recent favourable rainfall
years where species such as elephant, buffalo and impala increased in number
resulting in high stocking densities and feeding ratios skewed in favour of mixed
feeders (elephant and impala) (Appendices after references). We are into the
second season of drought and the fact that there is reduced surface water in the
neighbouring KNP will ultimately ‘force’ game to enter the adjacent protected areas
such as the APNR. While these animals may return to the KNP their presence in the
APNR is adding pressure on the already stressed grazing situation. The soaking
rains over the past few days will obviously alleviate the situation but grass growth will
still be limited given the lateness of the rain – so the challenge remains.

68
The letter is also prompted by our request made at the DEA/SANParks/Provinces
meeting held on the 16th Feb 2016 at Skukuza. The request was that, in view of the
time lag involved in getting a quota approved, whether it would be possible to submit
and increased quota now – with the proviso that if by May is was not considered
necessary then the extra removals would not be implemented. All state agencies
agreed to this proposal.
This summary repeats some of that discussion but is expanded to provide context of
where we stand in the APNR in relation to the KNP with respect to objectives and
management in particular and the potential implications of these differences in terms
of plant-animal interactions. This document is therefore presented as follows:
1. An executive summary highlighting recommendations;
2. A summary of the letter sent to wardens in December 2015;
3. Objectives relating to protected areas;
4. Protected areas functioning at different scales due to management (fencing
and water in particular) and climate change (not covered here but to be
noted);
5. Management in the light of the current drought situation.
I look forward to taking the process forward.
Sincerely
(Mike Peel and Jeremy Anderson)
(COPY DR JULIUS TJELELE (ARC-API)
MR. COLIN ROWLES TO CIRCULATE
69
1. Executive Summary
a. Large private nature reserves (e.g. the APNR) adjacent to the KNP
have embraced the basic philosophies of the KNP management
approach since the removal of the fence between them, have similar
general objectives but function on different spatial scales. In the latter
areas movement is possible but, due to size (spatial scale) and
management issues such as water provision these areas present a
unique set of management challenges (from point 3);
b. The summary letter sent to wardens in December 2015 predicted
grazing shortfalls in 2016 and the need to increase management
offtakes to just cover grazing requirements (point 2). However only
sustainable yield quotas – or even less were requested (Table 1). The
drought has worsened and these numbers are now considered far too
low and require appropriate adjustment;
c. An over-supply of water in protected areas adjacent to the KNP led to
an eruption of relatively water dependent herbivore species. The
higher concentrations of animals resulting in increased grazing,
trampling, dunging and urination which in turn affects water infiltration,
run-off, grass cover, species composition, the tree:grass ratio, and
ultimately biodiversity and sustainability (from point 4). The KNP has
closed more water points which exacerbates the situation and the
probability of large numbers of animals entering the well-watered
APNR (estimate 1 water point 731 ha-1 in the APNR vs 1 water point
51 440 ha-1 in the KNP. As previously stated the recent soaking rains
will obviously alleviate the situation but grass growth will still be limited
given the lateness of the rain – so the challenge remains;
d. Water provision is clearly the major factor here - is there a possibility of
somehow equalising the density of water between the APNR and the
KNP?; We do not necessarily suggest reopening water points in the
KNP but closing more in the APNR. The areas to be selected should
be proposed by the individual reserves themselves as a matter of
urgency (e.g. to protect a stand of charismatic tree species;
e. The following are considered the minimum offtakes (live where
70
possible and additional to the hunting quota) to alleviate the current
f. drought situation (there will still be losses if these offtakes are effected)
– buffalo ≈ 1 450 (add another 500 if considered necessary); impala ≈
9 700; elephant ≈ 330 (but up to 1 000 if considered necessary); white
rhino ≈ 100 (but up to 150 if considered necessary); hippo ≈ 45 (but up
to 100 if considered necessary); and
g. Method of offtake is aimed at immediate action. Live removals of white
rhino and hippo is essential; Large scale contraception of elephant is
considered feasible in the middle term and should be considered as a
matter of urgency under the guidance of Audrey Delsink – but this will
only become effective in time which in the current situation we do not
have; Live removal of all species is preferred and we need to list the
properties that have been approached to illustrate the lengths to which
we have gone to try and move the animals live. Where all of these
avenues have been exhausted then culling must be considered in the
short term until the contraception programme becomes effective. In
this regard an incredible opportunity exists to initiate the ‘wildlife
economy’ in communal rangelands e.g. Andover and others. For this
opportunity to be exploited (and it could be an excellent public relations
exercise for private protected areas to contribute animals to communal
protected areas) authorities need to get these areas fenced
immediately and expedite logistic issues such as permit issuing,
staffing etc. – the expertise exists to determine range condition and the
number and type of animals that these areas could accommodate.
2. Summary of letter sent to APNR Wardens December 2015
We examine the effect of resource use by grazers by inserting the resource
requirements for wildebeest, warthog, impala, waterbuck, zebra, buffalo, hippo, rhino
and elephant to determine whether the individual populations (using 2015 counts
and projecting forward to 2016) can be sustained on the grass available in 2015 and
an estimated grass biomass following a dry/drought 2015/16 season.

71
Results and Discussion
Following a poor 2014/15 rainfall year the mean grass standing crop within the
various APNR areas was:
KPNR 879 kgha-1; UPNR 863 kgha-1 (corrected from estimated 532 kgha-1);
TPNR 1 482 kgha-1; BNR 257 kgha-1.
Energy flows and sustainability in the APNR
We examined the effect of resource use by grazers by inserting the resource
requirements for wildebeest, warthog, impala, waterbuck, zebra, buffalo, hippo, rhino
and elephant. I investigated whether the individual populations were able to stabilise
their own ‘population metabolism’ using flows of endosomatic energy (food and
work) (Peel 2005). The average energy demand of the different species was
obtained from which an estimate of the activity patterns as they affect the feeding
requirements of the various species. The approach is looked at in terms of useful
energy flows into a system minus a certain fraction that is reduced by internal
overheads (e.g. consumption used to maintain the population) and external
overheads (e.g. predation that reduces the population). Where an indicator of
environmental loading (EL), the biophysical cost of the diet, is introduced. The EL
relates to the metabolisable energy of the forage (ME = 10.5 MJkg-1 dry matter -
Lombaard 1966) and the total amount of forage (from field data collection in this
study). The latter takes into account the proportion of the forage that is available to
the animals. Estimates vary from 22% to 49% in the broad-leaved savannas to
between 15% and 80% in fine-leaved savannas (in highly nutritious systems).
As discussed with management during previous years and again in 2015,
using this method, the resource was not limiting for the grazing species in the
KPNR, UPNR and TPNR. However there was a grazing shortage for BNR.
I then projected forward to 2016 taking only the 2015 numbers into account (with
reduced increments due to drought/no predation/no natural mortality) and then
removing the grazer offtake requests as per the APNR offtake committee
correspondence of 2015 as follows:
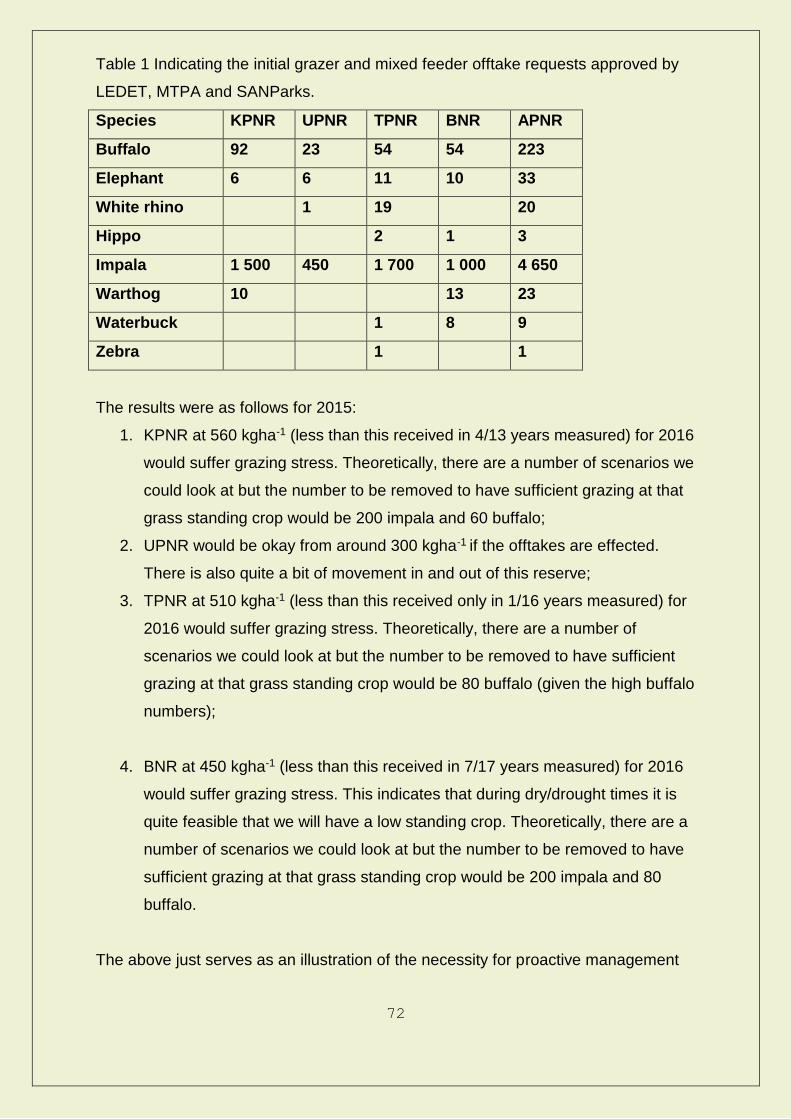
72
Table 1 Indicating the initial grazer and mixed feeder offtake requests approved by
LEDET, MTPA and SANParks.
Species KPNR UPNR TPNR BNR APNR
Buffalo 92 23 54 54 223
Elephant 6 6 11 10 33
White rhino 1 19 20
Hippo 2 1 3
Impala 1 500 450 1 700 1 000 4 650
Warthog 10 13 23
Waterbuck 1 8 9
Zebra 1 1
The results were as follows for 2015:
1. KPNR at 560 kgha-1 (less than this received in 4/13 years measured) for 2016
would suffer grazing stress. Theoretically, there are a number of scenarios we
could look at but the number to be removed to have sufficient grazing at that
grass standing crop would be 200 impala and 60 buffalo;
2. UPNR would be okay from around 300 kgha-1 if the offtakes are effected.
There is also quite a bit of movement in and out of this reserve;
3. TPNR at 510 kgha-1 (less than this received only in 1/16 years measured) for
2016 would suffer grazing stress. Theoretically, there are a number of
scenarios we could look at but the number to be removed to have sufficient
grazing at that grass standing crop would be 80 buffalo (given the high buffalo
numbers);
4. BNR at 450 kgha-1 (less than this received in 7/17 years measured) for 2016
would suffer grazing stress. This indicates that during dry/drought times it is
quite feasible that we will have a low standing crop. Theoretically, there are a
number of scenarios we could look at but the number to be removed to have
sufficient grazing at that grass standing crop would be 200 impala and 80
buffalo.
The above just serves as an illustration of the necessity for proactive management
73
in dry/drought times and the need for the reserves to look at adapting their offtake
proposals. This is not to say die-offs will not occur among weaker animals and we
also know that in the browser component species like kudu (especially adult male
kudu) go into the winter in relatively poor condition after the rut. So at the end of
winter they are much weakened and a poor winter and rain and cold snaps can
result in large scale die-offs.
I am wary to reduce prey species such as wildebeest, zebra and waterbuck because
the lion population has the ability to relatively quickly push them into a predator pit.
This is also a time when lions target the weakened buffalo population so their
removal needs to be carefully considered. All the while the grazing resource will be
stressed so time is of the essence.
The above assumes a drought situation and the potential need to accelerate
removals in the event of a poor season. We have reached a situation where
relatively large numbers will need to be removed. The worst case scenario is that we
suffer a drought and lose animals and where but some pressure will have been
taken off the veld through removals; we will recoup something from offtakes. The
best case scenario would be that we do not suffer a drought and the veld holds out
and where: some normal attrition would take place; pressure is taken off the veld;
we recoup something from offtakes.
Insert 2016: leading on from the above we can now say that the bulk of the summer
rains have failed and a second year of drought is upon us (again despite the recent
rains). So while the proposed offtakes as given above were a minimum to
maintain the grazing component it is now imperative that we adapt our
management again particularly in the light of the changed surface water
situation. For this we need to provide some context.
3. Objectives relating to protected areas
The following Table does not represent the actual objectives of the APNR or the
KNP but outlines the philosophy relating to setting objectives for protected areas and
74
the importance of spatial scale in setting realistic objectives.
Table 2: Issues relating to objectives, spatial scale (size) – OR why we don’t manage
all areas in the same way.
Philosophy/High Level
Objective
Relevance:
Large National Park
e.g. KNP
Relevance:
Protected Areas (smaller)
e.g. APNR
Maintain essential ecological
processes and life support
systems
High Moderate
Preserve genetic diversity High Moderate
Sustainable utilisation of
species and ecosystems
Moderate-low High
So while the APNR and KNP have a broadly similar philosophy, spatial and
temporal heterogeneity at different scales are prime determinants of system
qualities. Heterogeneity is an important consideration in any operation based on the
use of natural resources, for example, the Kruger National Park (KNP - c. 2 000 000
ha) has adopted the Noss (1990), definition of biodiversity as an underlying basis for
their revised management plan (Braack 1997a; Braack 1997b) which is expressed
operationally in terms of so-called ‘thresholds of potential concern’, endpoints of
which even include the desirability of having a certain limited percentage of land in a
‘degraded’ condition for a period of time due to biodiversity considerations (we need
to ask the KNP (Marisa?) if this philosophy has changed but either way the spatial
scale issues are relevant). Large adjacent private nature reserves (e.g. the
APNR) which embrace the basic philosophies of the KNP management
approach since the removal of the fence between them, have similar general
objectives but function on different spatial scales. In the latter areas
movement is possible but, due to size (spatial scale) and management issues
such as water provision these areas present a unique set of management
challenges. In the latter case ‘island populations’ are more likely to undergo more
extreme eruptions in numbers and related vegetation over-utilisation than in larger
‘open’ systems which are waterless for parts of the year (e.g. Owen Smith 1983).
75
4. Protected areas functioning at different scales due to management
(fencing and water in particular) and climate change;
The living requirements of wild animals include food, water and cover. Large
herbivores are limited by the amount of nutrients and forage available to them. In
addition to this, herbivore species differ in their dependence on surface water. The
spatial and temporal distribution of water therefore plays a major role in determining
the distribution of herbivores and by extension the condition of the soils and
vegetation.
The sub-division of land and the fencing off of conservation areas in the savannas of
the north-eastern Lowveld of South Africa began in the late 1960's. This broke the
natural east-west herbivore migration and, because many of the fenced off areas did
not have perennial water, artificial water points had to be constructed. The result
was a network of artificial water points in the Lowveld supplying ‘excess’ surface
water in these areas.
Such an over-supply of water led to an eruption of relatively water dependent
herbivore species such as impala, wildebeest and zebra around such water points,
the higher concentrations of animals resulting in increased grazing, trampling,
dunging and urination which in turn affects water infiltration, run-off, grass cover,
species composition, the tree:grass ratio, and ultimately biodiversity and ‘carrying
capacity’. Many artificial water points therefore may have a negative impact in terms
of resource degradation which is directly related to increased animal activities. The
figures included in the Appendix illustrates; The increase in herbivore biomass with
an increase in rainfall (in particular impala and to a lesser extent elephant extent –
buffalo have also increased sharply in the past few years); The increase in animal
biomass in the APNR and the skewed feeding class ratios dominated by mixed
feeders (largely impala and elephant) which are highly successful and competitive
species due to their ability to switch from grazing to browsing. So this year we can
expect an increase in tree impact by elephant (to potentially undesirable levels) due
to a depleted grass layer. In addition to this the high buffalo numbers will result in
increased competition with white rhino and possible related mortalities (this cannot
be entertained and live removals of both is essential). Hippo are also likely to come

76
under pressure and removals are essential (live).
To illustrate the current water situation we compare the density of open water points
in the APNR (Rowles pers. comm.) and the KNP (within a 10km strip in the KNP
Coetzee pers. comm.). The data are being continually updated (see Figures below
and summarised in the Table that follows).
Figure 1 indicating open artifical water points in the APNR and in the KNP (focusing
on the area adjacent to the SSW, Manyeleti and APNR).
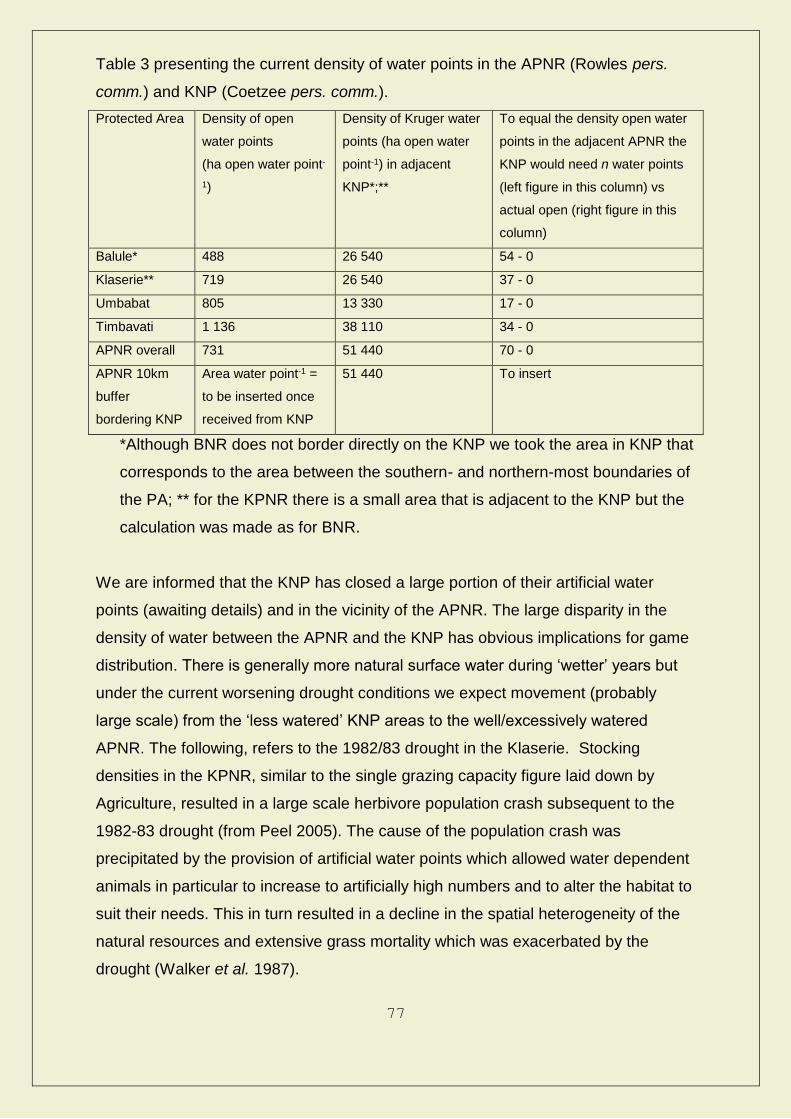
77
Table 3 presenting the current density of water points in the APNR (Rowles pers.
comm.) and KNP (Coetzee pers. comm.).
Protected Area Density of open
water points
(ha open water point-
1)
Density of Kruger water
points (ha open water
point-1) in adjacent
KNP*;**
To equal the density open water
points in the adjacent APNR the
KNP would need n water points
(left figure in this column) vs
actual open (right figure in this
column)
Balule* 488 26 540 54 - 0
Klaserie** 719 26 540 37 - 0
Umbabat 805 13 330 17 - 0
Timbavati 1 136 38 110 34 - 0
APNR overall 731 51 440 70 - 0
APNR 10km
buffer
bordering KNP
Area water point-1 =
to be inserted once
received from KNP
51 440 To insert
*Although BNR does not border directly on the KNP we took the area in KNP that
corresponds to the area between the southern- and northern-most boundaries of
the PA; ** for the KPNR there is a small area that is adjacent to the KNP but the
calculation was made as for BNR.
We are informed that the KNP has closed a large portion of their artificial water
points (awaiting details) and in the vicinity of the APNR. The large disparity in the
density of water between the APNR and the KNP has obvious implications for game
distribution. There is generally more natural surface water during ‘wetter’ years but
under the current worsening drought conditions we expect movement (probably
large scale) from the ‘less watered’ KNP areas to the well/excessively watered
APNR. The following, refers to the 1982/83 drought in the Klaserie. Stocking
densities in the KPNR, similar to the single grazing capacity figure laid down by
Agriculture, resulted in a large scale herbivore population crash subsequent to the
1982-83 drought (from Peel 2005). The cause of the population crash was
precipitated by the provision of artificial water points which allowed water dependent
animals in particular to increase to artificially high numbers and to alter the habitat to
suit their needs. This in turn resulted in a decline in the spatial heterogeneity of the
natural resources and extensive grass mortality which was exacerbated by the
drought (Walker et al. 1987).
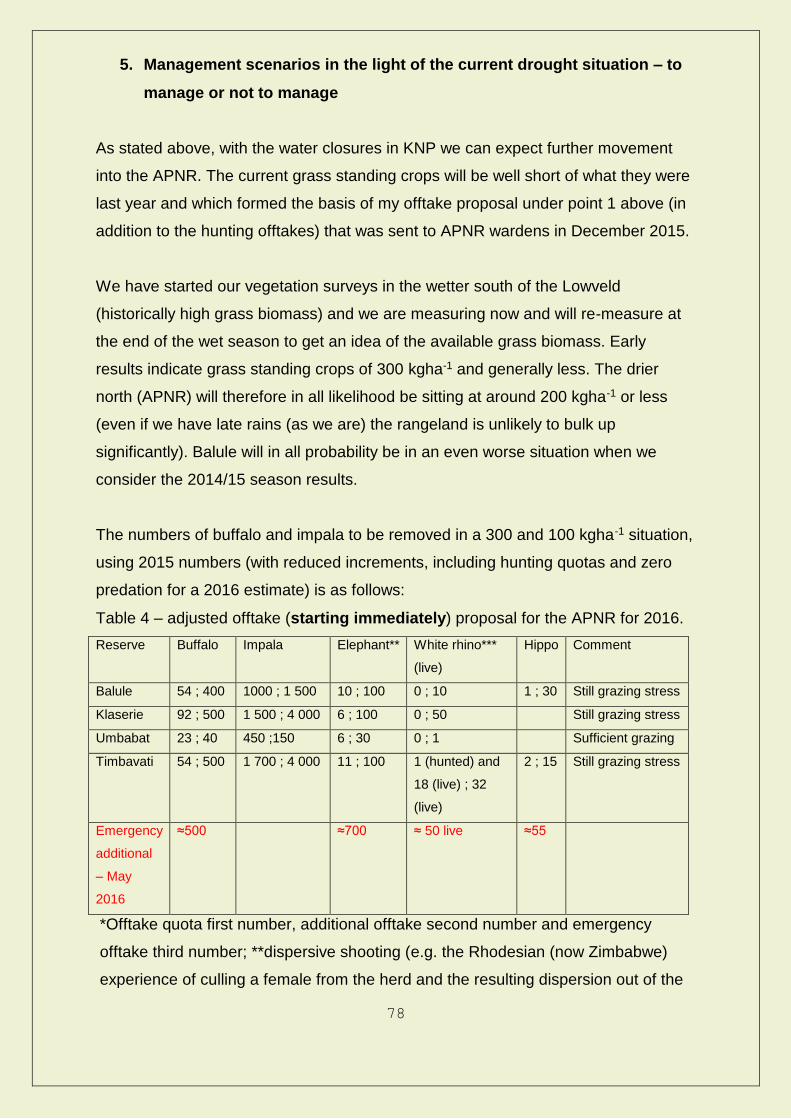
78
5. Management scenarios in the light of the current drought situation – to
manage or not to manage
As stated above, with the water closures in KNP we can expect further movement
into the APNR. The current grass standing crops will be well short of what they were
last year and which formed the basis of my offtake proposal under point 1 above (in
addition to the hunting offtakes) that was sent to APNR wardens in December 2015.
We have started our vegetation surveys in the wetter south of the Lowveld
(historically high grass biomass) and we are measuring now and will re-measure at
the end of the wet season to get an idea of the available grass biomass. Early
results indicate grass standing crops of 300 kgha-1 and generally less. The drier
north (APNR) will therefore in all likelihood be sitting at around 200 kgha-1 or less
(even if we have late rains (as we are) the rangeland is unlikely to bulk up
significantly). Balule will in all probability be in an even worse situation when we
consider the 2014/15 season results.
The numbers of buffalo and impala to be removed in a 300 and 100 kgha-1 situation,
using 2015 numbers (with reduced increments, including hunting quotas and zero
predation for a 2016 estimate) is as follows:
Table 4 – adjusted offtake (starting immediately) proposal for the APNR for 2016.
Reserve Buffalo Impala Elephant** White rhino***
(live)
Hippo Comment
Balule 54 ; 400 1000 ; 1 500 10 ; 100 0 ; 10 1 ; 30 Still grazing stress
Klaserie 92 ; 500 1 500 ; 4 000 6 ; 100 0 ; 50 Still grazing stress
Umbabat 23 ; 40 450 ;150 6 ; 30 0 ; 1 Sufficient grazing
Timbavati 54 ; 500 1 700 ; 4 000 11 ; 100
1 (hunted) and
18 (live) ; 32
(live)
2 ; 15 Still grazing stress
Emergency
additional
– May
2016
≈500 ≈700 ≈ 50 live ≈55
*Offtake quota first number, additional offtake second number and emergency
offtake third number; **dispersive shooting (e.g. the Rhodesian (now Zimbabwe)
experience of culling a female from the herd and the resulting dispersion out of the
79
area for up to three months. In this instance it may be that less animals will need to
be managed); *** live removal or removal while retaining a share of the animals –
NNB buffalo are starting to compete with the rhino grazing and we cannot afford to
lose rhino to drought and poaching. Other species removals per the hunting quota
are not included here but are supported as per previous correspondence.
The main mitigating factor for intense management is the current water situation
relating to the closure of water points in the KNP. To summarise from point 1 above:
The ‘assumed’ drought has materialised and we need to accelerate removals or risk
large scale animal losses and resource (in particular grazing) degradation which may
take years to recover. As stated above: We have reached a situation where
relatively large numbers will need to be removed. The worst case scenario is that we
suffer a drought and lose animals but some pressure will have been taken off the
veld; we will recoup something from offtakes. The best case scenario would be that
we do not suffer a drought and the veld holds out and where: some normal attrition
would take place; pressure is taken off the veld; we will recoup something from
offtakes.
There is evidence of the KNP elephant population ‘stabilising’ – we need
confirmation of this. Given the gravity of the situation, the requirements for
immediate game reduction is clear and in the following table we outline some of the
options with their usefulness in the short term with comments (from Henley August
2014 – from the Norms and Standards for Managing Elephants in S.A.) and moving
from least to most disturbance.
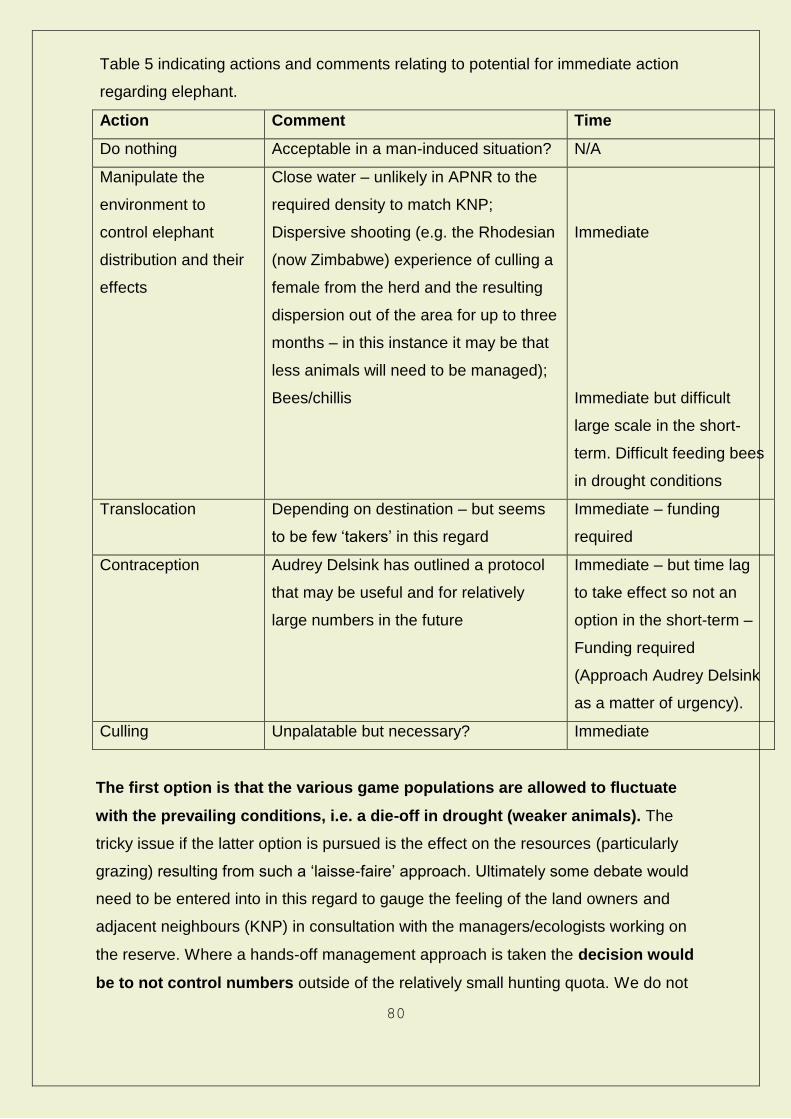
80
Table 5 indicating actions and comments relating to potential for immediate action
regarding elephant.
Action Comment Time
Do nothing Acceptable in a man-induced situation? N/A
Manipulate the
environment to
control elephant
distribution and their
effects
Close water – unlikely in APNR to the
required density to match KNP;
Dispersive shooting (e.g. the Rhodesian
(now Zimbabwe) experience of culling a
female from the herd and the resulting
dispersion out of the area for up to three
months – in this instance it may be that
less animals will need to be managed);
Bees/chillis
Immediate
Immediate but difficult
large scale in the short-
term. Difficult feeding bees
in drought conditions
Translocation Depending on destination – but seems
to be few ‘takers’ in this regard
Immediate – funding
required
Contraception Audrey Delsink has outlined a protocol
that may be useful and for relatively
large numbers in the future
Immediate – but time lag
to take effect so not an
option in the short-term –
Funding required
(Approach Audrey Delsink
as a matter of urgency).
Culling Unpalatable but necessary? Immediate
The first option is that the various game populations are allowed to fluctuate
with the prevailing conditions, i.e. a die-off in drought (weaker animals). The
tricky issue if the latter option is pursued is the effect on the resources (particularly
grazing) resulting from such a ‘laisse-faire’ approach. Ultimately some debate would
need to be entered into in this regard to gauge the feeling of the land owners and
adjacent neighbours (KNP) in consultation with the managers/ecologists working on
the reserve. Where a hands-off management approach is taken the decision would
be to not control numbers outside of the relatively small hunting quota. We do not
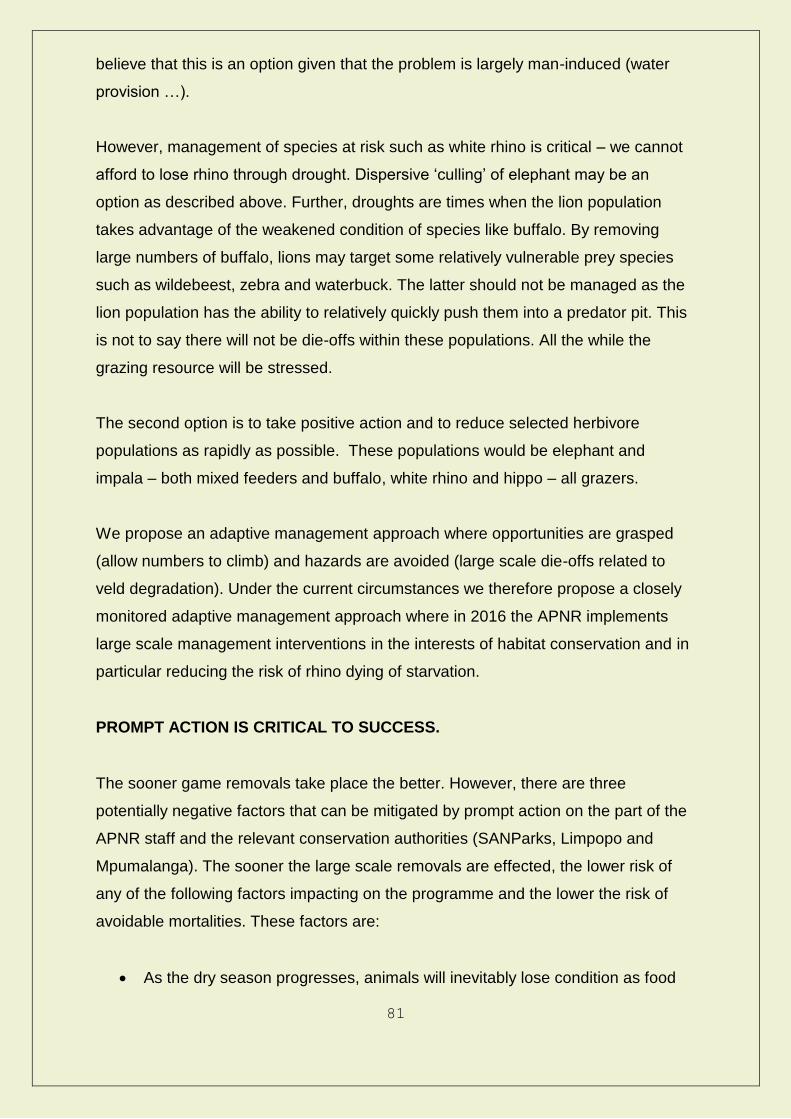
81
believe that this is an option given that the problem is largely man-induced (water
provision …).
However, management of species at risk such as white rhino is critical – we cannot
afford to lose rhino through drought. Dispersive ‘culling’ of elephant may be an
option as described above. Further, droughts are times when the lion population
takes advantage of the weakened condition of species like buffalo. By removing
large numbers of buffalo, lions may target some relatively vulnerable prey species
such as wildebeest, zebra and waterbuck. The latter should not be managed as the
lion population has the ability to relatively quickly push them into a predator pit. This
is not to say there will not be die-offs within these populations. All the while the
grazing resource will be stressed.
The second option is to take positive action and to reduce selected herbivore
populations as rapidly as possible. These populations would be elephant and
impala – both mixed feeders and buffalo, white rhino and hippo – all grazers.
We propose an adaptive management approach where opportunities are grasped
(allow numbers to climb) and hazards are avoided (large scale die-offs related to
veld degradation). Under the current circumstances we therefore propose a closely
monitored adaptive management approach where in 2016 the APNR implements
large scale management interventions in the interests of habitat conservation and in
particular reducing the risk of rhino dying of starvation.
PROMPT ACTION IS CRITICAL TO SUCCESS.
The sooner game removals take place the better. However, there are three
potentially negative factors that can be mitigated by prompt action on the part of the
APNR staff and the relevant conservation authorities (SANParks, Limpopo and
Mpumalanga). The sooner the large scale removals are effected, the lower risk of
any of the following factors impacting on the programme and the lower the risk of
avoidable mortalities. These factors are:
As the dry season progresses, animals will inevitably lose condition as food
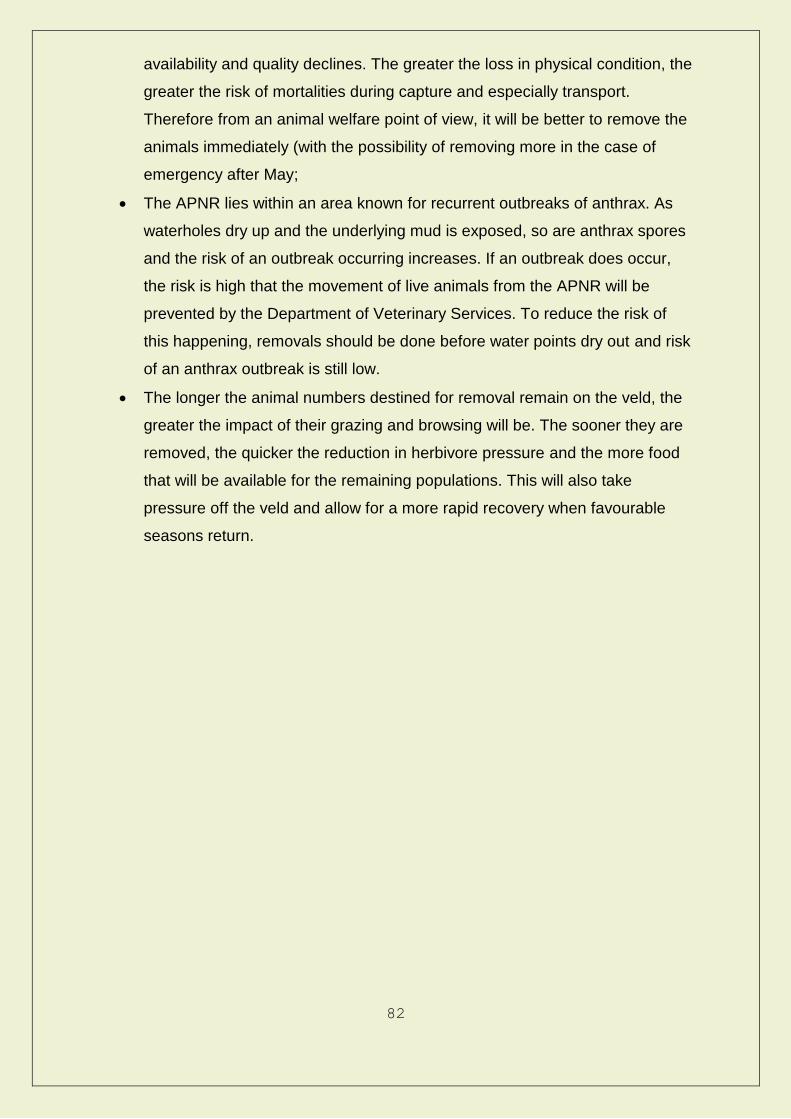
82
availability and quality declines. The greater the loss in physical condition, the
greater the risk of mortalities during capture and especially transport.
Therefore from an animal welfare point of view, it will be better to remove the
animals immediately (with the possibility of removing more in the case of
emergency after May;
The APNR lies within an area known for recurrent outbreaks of anthrax. As
waterholes dry up and the underlying mud is exposed, so are anthrax spores
and the risk of an outbreak occurring increases. If an outbreak does occur,
the risk is high that the movement of live animals from the APNR will be
prevented by the Department of Veterinary Services. To reduce the risk of
this happening, removals should be done before water points dry out and risk
of an anthrax outbreak is still low.
The longer the animal numbers destined for removal remain on the veld, the
greater the impact of their grazing and browsing will be. The sooner they are
removed, the quicker the reduction in herbivore pressure and the more food
that will be available for the remaining populations. This will also take
pressure off the veld and allow for a more rapid recovery when favourable
seasons return.
83
References and other reading
Balme Guy, Jacques Brits, Almero Bosch, Ross Pitman 2015. USING CAMERA-
TRAP DATA TO INFORM SUSTAINABLE LEOPARD HUNTING. Report to TPNR.
pp.
Braack LEO (Review co-ordinator) 1997a. An objectives hierarchy for the
management of the KNP. A review of parts of the management plan for the KNP.
Vol. VII. SA National Parks Skukuza.
Braack LEO (Review co-ordinator) 1997b. Policy proposals regarding issues relating
to biodiversity, maintenance, maintenance of wilderness qualities, and provision of
human benefits. A review of parts of the management plan for the KNP. Vol. VIII.
SA National Parks Skukuza.
International Conservation Services & P.C. Viljoen 2009. Lions and Lion Hunting in
Zambia – Management Guidelines. Report Zambian wildlife Authority. 109 pp.
Henley M. 2015. Elephant Management Forum: Associated Private Nature
Reserves. Workshop 8th March 2015. Unpublished Report.
Martin R & S. Thomas. 1991. Quotas for Sustainable Wildlife Utilization in
Communal Lands. The Zimbabwe Trust & Department of National parks & Wildlife
Management. 121pp.
Noss RF 1990. Indicators for monitoring biodiversity: a hierarchical approach.
Conservation Biology 4:355-364.
Peel MJS, Biggs H & Zacharias PJK. 1999. The evolving use of stocking rate indices
currently based on animal number and type in semi-arid heterogeneous landscapes
and complex land-use systems - perspective article -. African Journal of Range and
Forage Science 15(3): 117-127.
Peel MJS 2005. Towards a predictive understanding of savanna vegetation
dynamics in the eastern Lowveld of South Africa: with implications for effective
management. PhD thesis - Discipline of Grassland Science, School of Biological and
Conservation Sciences, Faculty of Science and Agriculture, University of KwaZulu-
Natal.
Walker BH & Goodman PS 1983. Some implications of ecosystem properties for
wildlife management. In: Owen-Smith RN (ed). Management of large mammals in
African conservation areas. Haum Pretoria.
Walker BH, Emslie RH, Owen-Smith RN & Scholes RJ 1987. To cull or not to cull:
lessons from a southern African drought. Journal of Applied Ecology 24:381-401.

84
Whyte. IJ, 2001.CONSERVATION MANAGEMENT OF THE KRUGER NATIONAL
APRK ELEPHANT POPULATION. Ph.D. Thesis University of Pretoria. 235 pp.
Whyte. I.J., Van Aarde R. & Pimm. S.l. 1998 Managing the elephants of the Kruger
National park. Animal Conservation 1: 77-83.
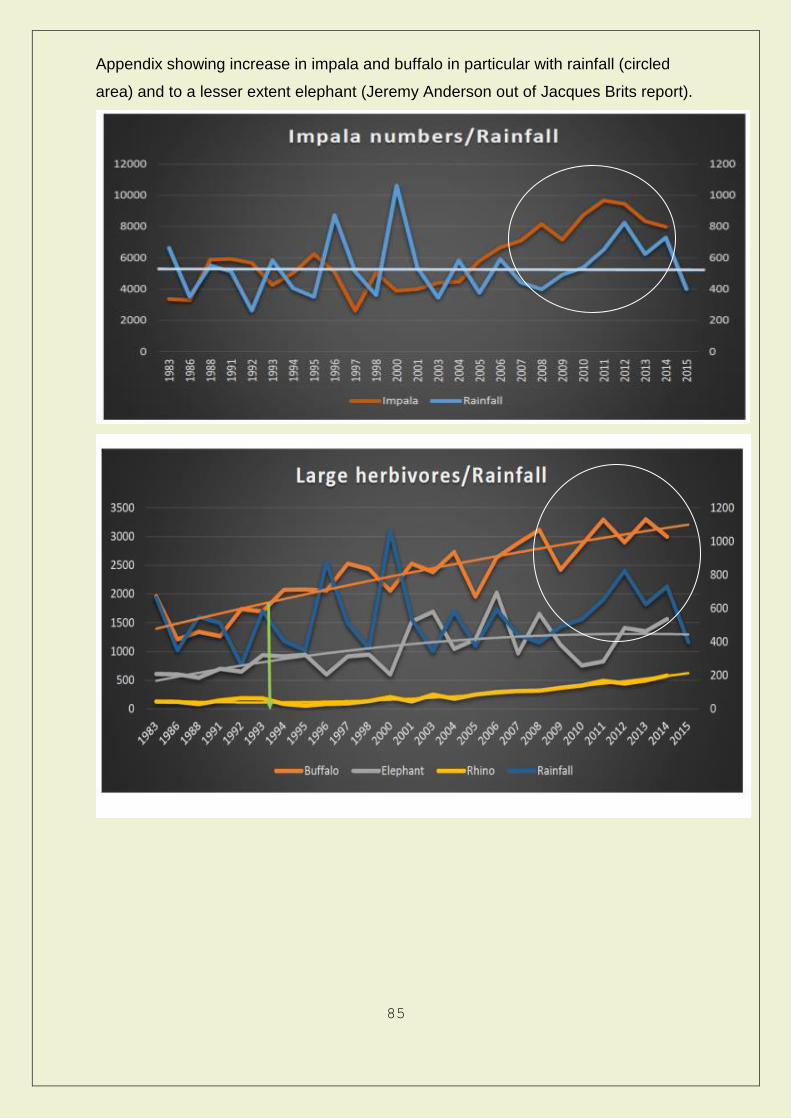
85
Appendix showing increase in impala and buffalo in particular with rainfall (circled
area) and to a lesser extent elephant (Jeremy Anderson out of Jacques Brits report).
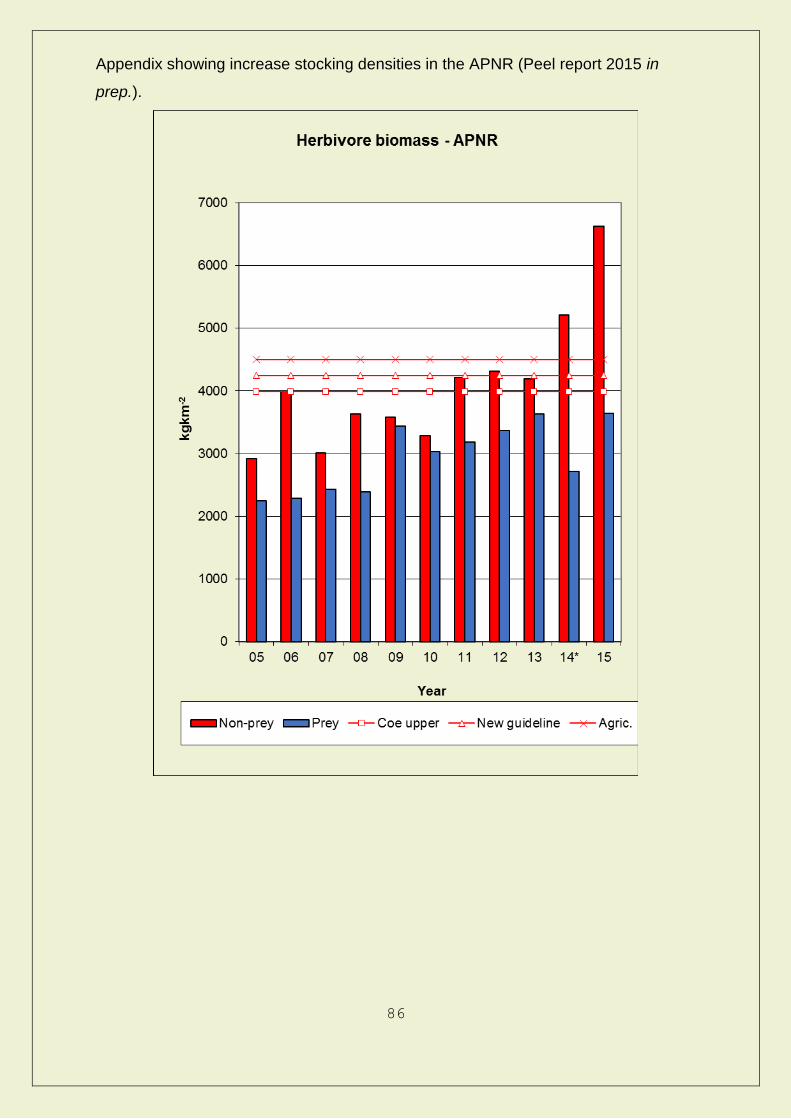
86
Appendix showing increase stocking densities in the APNR (Peel report 2015 in
prep.).

87
Appendix showing skewed feeding class proportions in the APNR (Peel report 2015
in prep.). Note Class 3 mixed feeders (elephant and impala) dominate the biomass
(64%); class 1 bulk grazers (buffalo, hippo, rhino – 30%), class2 selective feeders
(wildebeest and warthog 0.9%) and class 4 feeders - browsers (5%).
88
Appendix B
Lowveld Protected Areas: To Manage or Not to Manage
Mike Peel (Agricultural Research Council, Rangeland Ecology Group –
As we are all aware, the Lowveld has experienced average to above average rainfall
over the past six years. During these ‘years of plenty’, with the veld looking great we
are often numbed into a false sense of security and as game numbers increase, we
try to create a sense of ‘anticipatory awareness’ – the dry times will return and we
cannot predict when, how long and what the severity of the dry period will be when it
comes. In fact it appears that with increased variability in climatic conditions,
prediction may become more and more difficult.
The Rangeland Ecology group of the Agricultural Research Council has over many
years presented potential animal trend scenarios to a large number of land users
based on current veld condition and animal numbers (both based on up to 25 years
of historical data) under varying rainfall conditions and with the predicted response
of the grass layer to these variables. The bottom line is that we do not want
unpleasant surprises and we need to be proactive rather than reactive when taking
management decisions relating to animal numbers. In the following discussion I
share some thoughts relating to animal management under fluctuating
environmental conditions.
The fact that, due to land fragmentation there is no longer movement to the higher
rainfall areas and forage resources in the west near the Drakensberg range means
that there will be animal losses in drought years. Population declines especially in
larger grazer species such as buffalo, zebra and wildebeest would vary from minimal
through sharp as evidenced by the 1982-83 drought for example where some
grazers were reduced to between 10 and 20% of their pre-drought numbers
following large scale perennial grass mortality. Mortality amongst these grazing
herbivores may be viewed as part of a longer term cycle and droughts are also times
when predators, in particular lions, feast on weakened animals.
The question is whether or not we are prepared to allow drought related mortality to
occur and whether the cost to the veld would be acceptable if numbers are allowed
to increase unchecked? Management decisions are also linked to whether the
protected area is fenced (no movement to favourable grazing areas possible) or not.
89
The relationship between grass production and standing crop is highlighted with
recent favourable rainfall seasons in the eastern Lowveld (mean or above rainfall
since 2008/09 in the example given below) resulting in an increase in grass standing
crop (the portion of production that remains after utilisation) (Figure 1). The latter is
due to a favourable perennial composition and cover and improved soil moisture
conditions that promote grass growth (Figure 1). This has in turn resulted in a steady
increase in herbivore numbers in Lowveld Protected Areas (Figure 2) which largely
reflects these favourable grazing conditions.
Figure 1 illustrating the favourable relationship between annual rainfall and grass
standing crop (note mean or above mean rainfall since 2008/09 and above or above
average grass standing crop since 2009/10 – note lag of one rainfall season before
the grass response becomes clearly evident.

90
Figure 2 illustrating trends in three grazing species in the protected areas of the
eastern Lowveld. Note the increases in these important grazers in response to the
data shown in Figure 1 (increased rainfall and increased grass standing crop from
around 2008/09 and linked increases in grazing animals)
Over the past few years we can see that the grass layer has not been limiting for
grazers in general (Figure 1). Further I think that given the fact that grazers like
buffalo move in large herds over extensive areas and are not sedentary around a
single water point, that they have a generally beneficial effect on the vegetation for,
among others, the following reasons. High densities of large hooved animals:
o Break soil crusts by their hoof action allowing for a good soil surface to
seed contact;
o Reduce the height of moribund grass, thus allowing sunlight to penetrate
the shorter vigorous grass tufts while reducing the temperature of the soil
and making it more suitable for rainfall infiltration; and
o Deposit concentrated amounts of dung and urine.
All of the above promotes seedling establishment, particularly in bare areas and
promotes a healthy productive perennial sward of grasses. Closer plant spacing
(increased density) with a better litter layer (organic matter) and stable soils results
in less evaporation and more effective rainfall (infiltration) with lower soil
temperatures, less rainfall runoff, silting up of streams etc. The presence of

91
predators, in particular lions, causes buffalo herds to bunch when chased thus
intensifying the positive impacts outlined above.
The fact that these large herds are mobile also means that they seldom ‘camp’ on a
patch for a long period of time but are continually moving through different
landscapes. This means that unlike selective water dependent grazers, buffalo will
utilise an area and then move on thus reducing the chance of overgrazing (a
function of time and not necessarily number – veld needs rest). For example
excessive artificially supplied surface water results in high densities of sedentary
water dependent species (e.g. impala). So where and when do we exercise animal
control? Even on unfenced areas animal control may need to be considered where
water point provision has resulted in increased animal numbers due to their
increased distribution resulting in insufficient forage for animals during dry periods
(obviously more critical in fenced situations). The alternative is that the population is
allowed to fluctuate with the prevailing resource conditions, i.e. a die-off in drought
(weaker animals). This may be acceptable in unfenced, ‘open’ situations but is it
appropriate in fenced areas where animals are unable to migrate? The tricky issue if
the ‘laisser-faire’ option is pursued, is the long term effect on the resources resulting
from overgrazing
A hypothetical example from a fenced area – to manage or not to manage
We examine the effect of resource use by grazers by inserting the resource
requirements for grazing species and determine whether the grazing population is
able to maintain themselves under varying environmental and attendant resource
conditions.
For this exercise the model is based on a fenced protected area using real data
(main grazers rounded off: buffalo 1 000; wildebeest 550; zebra 250; impala 3 100),
year 1 grass standing crop (≈ 1 700kg ha-1 which provides some residual for the year
2 season’s standing crop) and as a worst case scenario a projected a grass standing
crop for year 2 season which yields only 600kg ha-1 (approximately the lowest
standing crop on the PA in question for some 18 years). The results indicate that
there would have been insufficient forage for the grazing animals present on the PA.
This information is critical for managers to take early animal management decisions
and depending on the amount of risk they are willing to take. Any animal
management would be aimed at preventing:
o Excessive animal die-off; and

92
o Veld degradation.
This situation obviously brings into question the species that we should consider
managing. We need to be wary about reducing prey species such as wildebeest and
zebra which, in this case are showing encouraging increases (Figure 2). The reason
for this caution is that the lion population has the ability to relatively quickly push
these and other more sensitive species (e.g. waterbuck) into a predator pit (as
happened under high predator levels for wildebeest and zebra between 1997 and
2002 (Figure 2). The latter situation required predator, in particular lion,
management – a discussion for another day!). Consideration could be given to the
removal of species such as impala but caution is again advised as impala are an
important buffer to other prey populations that may be under pressure. All the while
the grazing resource would be stressed. To address this situation the removal of
around 20 buffalo would have ensured that there was just sufficient food to satisfy
the needs of the grazing population (this is obviously an oversimplification but is
used here purely for illustrative purposes).
The reality is that we had a good year 2 season so the stressed grazing situation
never materialised. If we feed the year 2 standing crop in (≈ 2 100kgha-1) and project
an increase in animal numbers minus predation (actual data obtained from the
protected area concerned) and remembering that populations close to ‘ecological
carrying capacity’ do not generally increase at rates attained when a population is
increasing with surplus resources (on the fast part – logarithmic part of the growth
curve) then anything less than 680kgha-1 would result in a shortage of grazing. Note:
The point at which grazing stress becomes an issue increases from 600kgha-1 to
680kgha-1 (assuming reduced animal increment levels for the reasons given above
resulting in more grass but still a stressed grazing resource to ‘break-even). At
600kgha-1 it would be difficult to reduce the number of buffalo alone (in one
exercise) to get to the ‘break even’ point as this number would be projected at
around 1 150 to reduce to around 900 (a 10% increase in buffalo from 1 000 is 100!
Plus the other species would also increase in number). Is this logistically practical?
We need to look at other species as well. In addition, for example, 700 impala could
be removed to stabilize the situation. As stated above however we need to be wary
to reduce prey species such as wildebeest and zebra (which are both increasing), as
well as waterbuck due to their susceptibility to heavy predation.
93
BUT the above assumes a drought situation and we are coming off a run of good
seasons. The good news is there was sufficient grazing and offtakes should be
aimed at maintaining this situation depending on rainfall. A staggered offtake is
logistically preferable but what I aim to illustrate in this discussion is how quickly
‘things can get away’. On fenced areas where the animals cannot move the situation
is even more critical!!
An active adaptive management approach means that in the worst case scenario:
o We suffer a drought
o We lose animals;
o Pressure is taken off the veld;
o Feeding is considered in some instances;
o We recoup something from offtakes.
The best case scenario would be that;
o We do not suffer a drought
o We lose animals through natural attrition
o Pressure is taken off the veld;
o The veld remains in a favourable condition;
o We recoup something from offtakes.
In unfenced protected areas there is obviously another option in terms of
management, that of a laisser faire or hands-off approach. However, populations
cannot increase at consistent rates under stressed conditions so one would expect a
drop off in natural increments. So we use adaptive management where opportunities
are grasped (allow numbers to climb) and hazards are avoided (large scale die-offs
related to veld degradation).
In many Lowveld protected areas the stocking rates are such that it would require a
relatively large management effort to reduce the numbers to adapt to any decline in
veld condition. As the grazing resource is generally limiting, grazer species in
particular require constant monitoring (removal, feeding or no action). These
‘managed’ animals would be animals not removed by predation but considered
necessary for removal for ecological reasons while at the same time being careful
not to push prey species into a ‘predator pit’ and all the while striving to achieve the
ecological and economic objectives of the protected area in question.
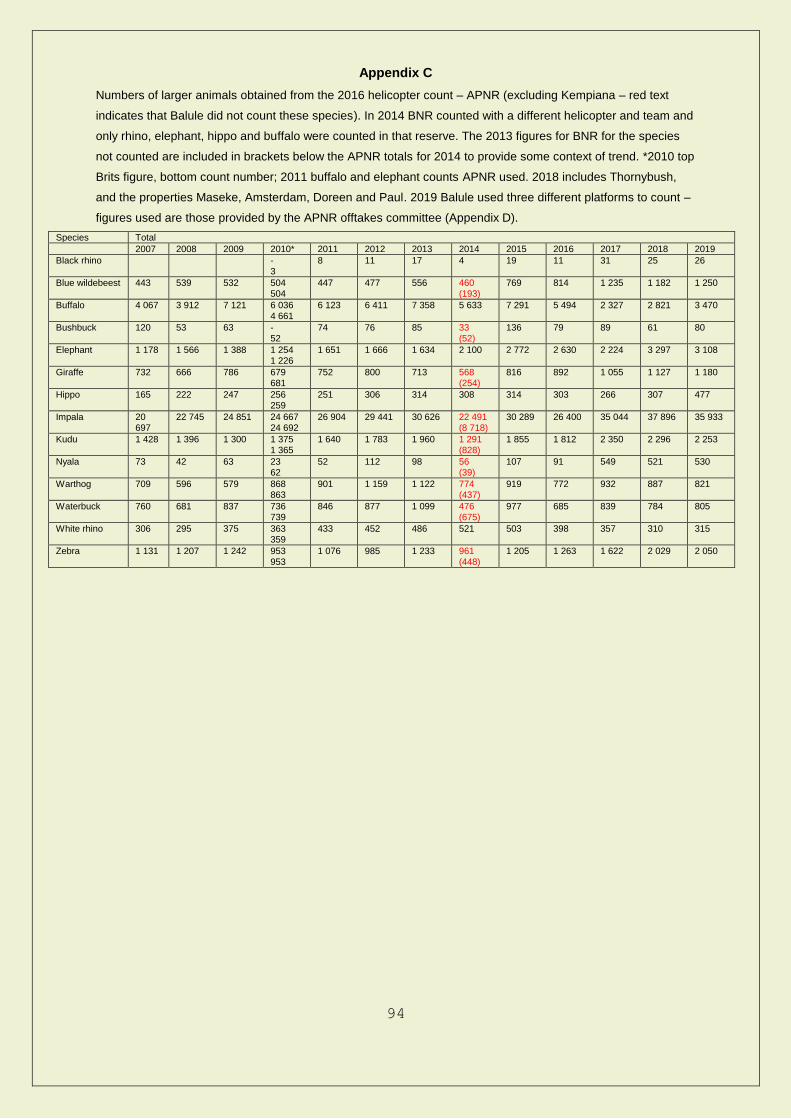
94
Appendix C
Numbers of larger animals obtained from the 2016 helicopter count – APNR (excluding Kempiana – red text
indicates that Balule did not count these species). In 2014 BNR counted with a different helicopter and team and
only rhino, elephant, hippo and buffalo were counted in that reserve. The 2013 figures for BNR for the species
not counted are included in brackets below the APNR totals for 2014 to provide some context of trend. *2010 top
Brits figure, bottom count number; 2011 buffalo and elephant counts APNR used. 2018 includes Thornybush,
and the properties Maseke, Amsterdam, Doreen and Paul. 2019 Balule used three different platforms to count –
figures used are those provided by the APNR offtakes committee (Appendix D).
Species Total
2007 2008 2009 2010* 2011 2012 2013 2014 2015 2016 2017 2018 2019
Black rhino - 3
8 11 17 4 19 11 31 25 26
Blue wildebeest 443 539 532 504 504
447 477 556 460 (193)
769 814 1 235 1 182 1 250
Buffalo 4 067 3 912 7 121 6 036 4 661
6 123 6 411 7 358 5 633 7 291 5 494 2 327 2 821 3 470
Bushbuck 120 53 63 - 52
74 76 85 33 (52)
136 79 89 61 80
Elephant 1 178 1 566 1 388 1 254 1 226
1 651 1 666 1 634 2 100 2 772 2 630 2 224 3 297 3 108
Giraffe 732 666 786 679 681
752 800 713 568 (254)
816 892 1 055 1 127 1 180
Hippo 165 222 247 256 259
251 306 314 308 314 303 266 307 477
Impala 20 697
22 745 24 851 24 667 24 692
26 904 29 441 30 626 22 491 (8 718)
30 289 26 400 35 044 37 896 35 933
Kudu 1 428 1 396 1 300 1 375 1 365
1 640 1 783 1 960 1 291 (828)
1 855 1 812 2 350 2 296 2 253
Nyala 73 42 63 23 62
52 112 98 56 (39)
107 91 549 521 530
Warthog 709 596 579 868 863
901 1 159 1 122 774 (437)
919 772 932 887 821
Waterbuck 760 681 837 736 739
846 877 1 099 476 (675)
977 685 839 784 805
White rhino 306 295 375 363 359
433 452 486 521 503 398 357 310 315
Zebra 1 131 1 207 1 242 953 953
1 076 985 1 233 961 (448)
1 205 1 263 1 622 2 029 2 050
95
Appendix D
Correspondence relating to the hunting quota for the APNR for 2020-21.
19/11/19
Dear Edwin
OFFTAKES REQUEST 2020/21: APNR v2
The meeting of 24 October 2019, refers. The 2019 game count numbers were used to calculate
stocking rates, feeding class ratios and to examine herbivore trends with a view to determining
sustainable offtakes for the various reserves within the APNR while also taking into account the
current state of the rangelands. Note the following:
2. Comments on the proposed management/hunting removals are based on the 2019 counts.
The Klaserie, Timbavati, Umbabat, Thornybush reserves and the Olifants West section of the
Balule NR were counted as in previous years using a Bell jet Ranger and linked computer
system with pilot, computer operator and two experienced observers. A Jabiru aircraft was
employed to take high resolution photographs of buffalo herds located by the helicopter team
to obtain demographic data critical for this exercise in the first four areas mentioned above.
The rest of the Balule NR count was done using the following platforms. The Jabiru covered
the entire Balule NR area to count elephant, rhino and buffalo. Finally, 46% of the total area of
Balule Nature Reserve was counted using a Robinson 44 helicopter with pilot, computer
operator and two observers. The length of the Olifants River in the Balule NR was covered by
the two helicopter counts;
3. My annual report will contain projections forward and take the possible effect of predators into
account where possible (I await estimates from the various reserves);
4. As stated in my correspondence regarding demographic studies within the APNR the
following. The reserves comprising the APNR are taking steps to collect demographic data to
ensure that offtakes within the elephant and buffalo populations in particular are sustainable
(Peel 2013 and APNR Wardens pers. comm. and discussed at our annual meetings). In this
regard I again commend the actions that all concerned put into the protocols;
5. The taking of minutes at the meeting is critical as it allows anyone who has queries to go
through the discussion and processes that were followed regarding the final offtake decisions.
96
In addition to the fact that the system is ‘open’, the influence of favourable/drought rainfall years on the
vegetation has implications for, among others: fire, herbivore dynamics and interactions, predator-prey
relations, counting conditions and ultimately game numbers. In addition to the data collected by
management, much information exists within the current landowner and lodge structure (e.g. predation
data, sex and age data) but these must be used with the necessary caution.
The APNR summary is again a well-considered document. Dr Petri Viljoen and I have looked at the
offtake proposals and again largely support them with some discussion included. As stated in previous
reports we agree that large-scale (possible) removal of impala be done for ecological and economic
reasons. The 2019 count again illustrates that other ‘prey’ herbivores are relatively finely balanced with
the predator, in particular lion, population. See further discussion in the annual report.
We have previously proposed that, given the dry period we are experiencing, private protected areas
contribute animals to communal areas for non-consumptive and consumptive use as a way to
encourage the ‘wildlife economy’ in these important rangelands. We feel that an excellent opportunity
was missed in the past in this regard and that we should be prepared to exercise such options in the
future.
We continue to enjoy the collaboration on ecological issues between the various wardens, researchers
and staff of the management authorities in the area. Please do not hesitate to contact us if there are
any queries.
Yours Sincerely
(DR. MIKE PEEL: Pr.Sci.Nat; M.G.S.S.A - SPECIALIST SCIENTIST RANGELAND ECOLOGY & DR PETRI VILJOEN)
COPY: EDWIN PIERCE TO CIRCULATE AS REQUIRED; DR JULIUS TJELELE
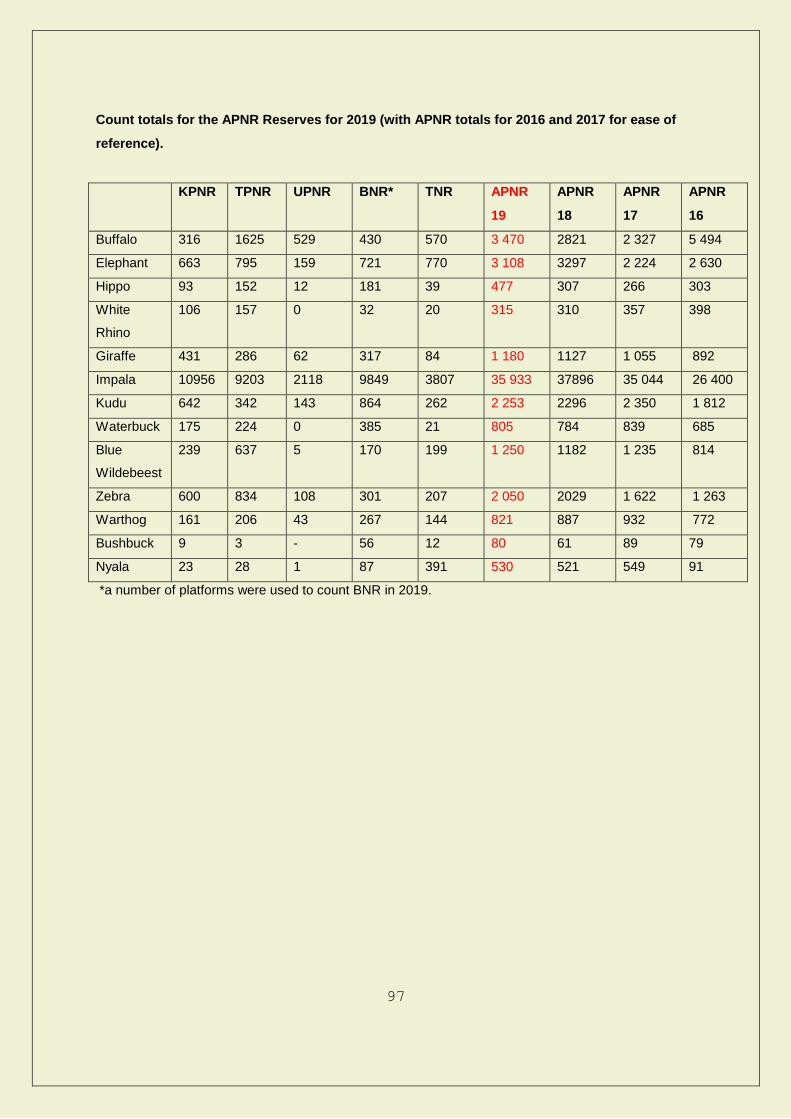
97
Count totals for the APNR Reserves for 2019 (with APNR totals for 2016 and 2017 for ease of
reference).
Species: KPNR TPNR UPNR BNR* TNR APNR
19
APNR
18
APNR
17
APNR
16
Buffalo 316 1625 529 430 570 3 470 2821 2 327 5 494
Elephant 663 795 159 721 770 3 108 3297 2 224 2 630
Hippo 93 152 12 181 39 477 307 266 303
White
Rhino
106 157 0 32 20 315 310 357 398
Giraffe 431 286 62 317 84 1 180 1127 1 055 892
Impala 10956 9203 2118 9849 3807 35 933 37896 35 044 26 400
Kudu 642 342 143 864 262 2 253 2296 2 350 1 812
Waterbuck 175 224 0 385 21 805 784 839 685
Blue
Wildebeest
239 637 5 170 199 1 250 1182 1 235 814
Zebra 600 834 108 301 207 2 050 2029 1 622 1 263
Warthog 161 206 43 267 144 821 887 932 772
Bushbuck 9 3 - 56 12 80 61 89 79
Nyala 23 28 1 87 391 530 521 549 91
*a number of platforms were used to count BNR in 2019.

98
Proposed Total APNR off-takes for 2020/21.
Species Count
APNR
Count
class
Offtake Proposal Total and as a % of reserve
total (in columns) (-acceptable; - but
requires further study/extenuating
circumstances; x - high)
% of APNR
population
(; ; x)
Buffalo 3 470 KPNR TPNR UPNR BNR TNR
Bulls <34" 32 6 – 1,9
16 – 0,98
7 – 1,32
3 – 0,70
0 0,92
Bulls <38" 16 6 – 1,9
4 – 0,25
4 – 0,76
2 – 0,47
0 0,46
Classic Buffalo Bulls >12Y
4 0 1 – 0,06
3 – 0,57
0 0 0,12
Commercial Buffalo cows>12y
10 0 10 – 0,62
0 0 0 0,29
Non- commercial Buffalo cows>12y
5 0 5 – 0,31
0 0 0 0,14
Total offtake
♂ 52
♀ 15
All 67
12 – 3,8x
0 – 0,0
12 – 3,8x
21 – 1,29
15 –
0,93
36 – 2,22
14 – 2,65x
0 – 0,0
14 – 2,65x
5 – 1,16
0 – 0,0
5 –
1,16
0
0
0
1,50
0,43
1,93
Comments
Buffalo
Within guideline for ♂ and ♀ and combined for: APNR overall – open
system supported. BNR, TPNR marginally above but acceptable. KPNR
and UPNR above for ♂. Overall within guideline calculations for APNR. There will be discussion around the demographic studies to determine the sustainability of current offtake rates. The TPNR figure for bulls is 42% (Bosch pers. comm. – all ages)
Elephant 3 108 KPNR TPNR UPNR BNR TNR % of APNR
population
(; ; x)
Bulls20-25y 25lb@
4 0 0 0 4 – 0,55
0 0,13
Bulls25-30y 30lb@
27 5 – 0,75
7 – 0,88
4 – 2,52x
11 – 1,53x
0 0,87
Bulls30-35y 40lb@
13 2 – 0,3
3 – 0,38
3 – 1,89x
5 – 0,69
0 0,42
Bulls35-40y 55lb@
2 1 – 0,15
0 1 – 0,63
0 0 0,06
Total offtake 46 8 – 1,20x
10 – 1,26x
8 – 5,03x
20 – 2,77x
0 1,48x*
Comments
elephant
A guideline to maximum percent of the total for sport hunted elephant is
0.75 - 1% which is exceeded if we look at: KPNR, TPNR, UPNR, BNR and
APNR overall. Question - what do we define as sport hunt a trophy animal or are these categories in the ‘management’ class but hunted commercially? *The elephant population makes up in excess of 60% of the total herbivore
biomass of the APNR and we consider the offtakes sustainable. While the hunting programme is not aimed at population control this will contribute in some way to reducing numbers. At the same time hunting in areas targeted by elephant may be a useful learning tool to see if this type of exercise in fact will disperse elephant out of sensitive areas. As previously stated this is a guideline requiring verification and data

99
Species Count
APNR
Count
class
Offtake Proposal Total and as a % of reserve
total (in columns) (-acceptable; - but
requires further study/extenuating
circumstances; x - high)
% of APNR
population
(; ; x)
collection and we await this information per bull category from photographs taken during the counts. Bulls make up the following proportions in the reserves for which there are data: KPNR 6% (6% previous), TPNR 12% (5% previous), UPNR 38% (15% previous), BNR (Olifants West - 9%; All Balule 16% - 23% previous) and TNR 11% (10% previous). The overall proportion of bulls in the APNR population is 13%.
White Rhino 315 KPNR TPNR UPNR BNR TNR
Commercial hunt bulls
0 0 0
0 0 0 0,0
Live sales cow/calf
combinations
0 0 0 0 0 0 0,0
Live bull sales 0 0 0 0 0 0 0,0
Total offtake 0 0 0 0 0 0 0,0
Hippo 307 KPNR TPNR UPNR BNR TNR
Hippo bulls commercial
hunt
9 2 - 2,15
3 – 1,97
0 4 – 3,45
0 1,89
Live sales 0 0 0 0 0 0 0
Total offtake 9 2 - 2,15
3 – 1,97
0 4 – 3,45
0 1,89
The hunting request is ecologically acceptable.
Impala 35 933 KPNR TPNR UPNR BNR TNR
Landowner non-
commercial consumptive and culling
4 525 1 500 – 13,69
1 185 – 12,88
420 – 19,83
1 450 – 14,72
300 – 7,88
13,51
Commercial males hunt
455 0 15 – 0,16
0 110 – 1,12
0 0,35
Total offtake 4 980 1 500 – 13,69
1 200 – 13,04
420 – 19,83
1 560 – 15,84
300 – 7,88
13,86
The commercial hunting and consumptive use is considered sustainable. We remain in the grips of a very dry period and I believe the proposed removals are relatively light and that the option of increasing these numbers be lodged with the relevant authorities. Impala are water dependent non-mobile species and at high densities impact heavily on rangelands. This does not ignore their function as a buffer to vulnerable species such as giraffe, wildebeest, zebra etc. and this must be considered. It is apparent that during the drought the lion target the weakened buffalo population but this could change with the onset of favourable conditions and a strengthening buffalo population.
Waterbuck 805 KPNR TPNR UPNR BNR TNR APNR
Trophy bull commercial
hunt
12 1 – 0,57
3 – 1,34
0 8 – 2,08
0 1,49
Bull non- commercial
hunt
0 0 0 0 0 0 0,00
Cows non-commercial
0 0 0 0 0 0,00
Total offtake 12 1 – 0,57
3 – 1,34
0 8 – 2,08
0 1,49
Acceptable. A demographic study of waterbuck is necessary to assess the

100
Species Count
APNR
Count
class
Offtake Proposal Total and as a % of reserve
total (in columns) (-acceptable; - but
requires further study/extenuating
circumstances; x - high)
% of APNR
population
(; ; x)
sustainability of the bull animals in the future.
Kudu 2 253 KPNR TPNR UPNR BNR TNR APNR
Bulls commercial
19 4 – 0,62
3 – 0,88
0 12 – 1,39
0 0,84
Bulls non-commercial
18 5 – 0,78
0 0 13 – 1,50
0 0,80
Cows commercial
5 5 – 0,78
0 0 0 0 0,22
Cows non-commercial
5 0 5 – 1,46
0 0 0,22
Total offtake 47 14 – 2,18
8 – 2,34
0 25 – 2,89
0 2,09
Acceptable.
Warthog 821 KPNR TPNR UPNR BNR TNR
Commercial 3 0 3 – 1,53
0 0 0,37
Non-commercial
16 0 0 0 11 – 4,58
1,95
Total offtake 19 0 3 – 1,53
0 11 – 4,58
2,31
Acceptable. Can increase as these animals will die during the drought. Also an important prey species however.
Giraffe 1 180 KPNR TPNR UPNR BNR TNR APNR
Bulls commercial
8 0 3 – 1,05
0 5 – 1,58
0 0,68
Bulls non-commercial
0 0 0 0 0 0 0,00
Total offtake 8 0 3 – 1,05
0 5 – 1,58
0 0,68
Acceptable
Zebra 2 050 KPNR TPNR UPNR BNR TNR APNR
Commercial 7 4 – 0,67
3 – 0,36
0 0 0 0,34
Non-commercial
4 4 – 0,67
0 0 0 0 0,20
Total offtake 11 8 – 1,33
3 – 0,36
0 0 0 0,54
Acceptable
Wildebeest 1 250 KPNR TPNR UPNR BNR TNR APNR
Commercial 3 0 3 – 0,47
0 0 0 0,24
Total offtake 3 0 3 – 0,47
0 0 0 0,24
Acceptable
Nyala 530 KPNR TPNR UPNR BNR TNR APNR
Bulls commercial
0 0 0 0 0 0 0,00
0 0 0 0 0 0 0,00
Acceptable
Hyena KPNR TPNR UPNR BNR TNR APNR
3♀ 0 3 0 0 0
3 0 3 0 0 0
Ecologically sustainable – target animals critical to ensure minimal disruption of clan structure. Does APNR meet SANParks protocol
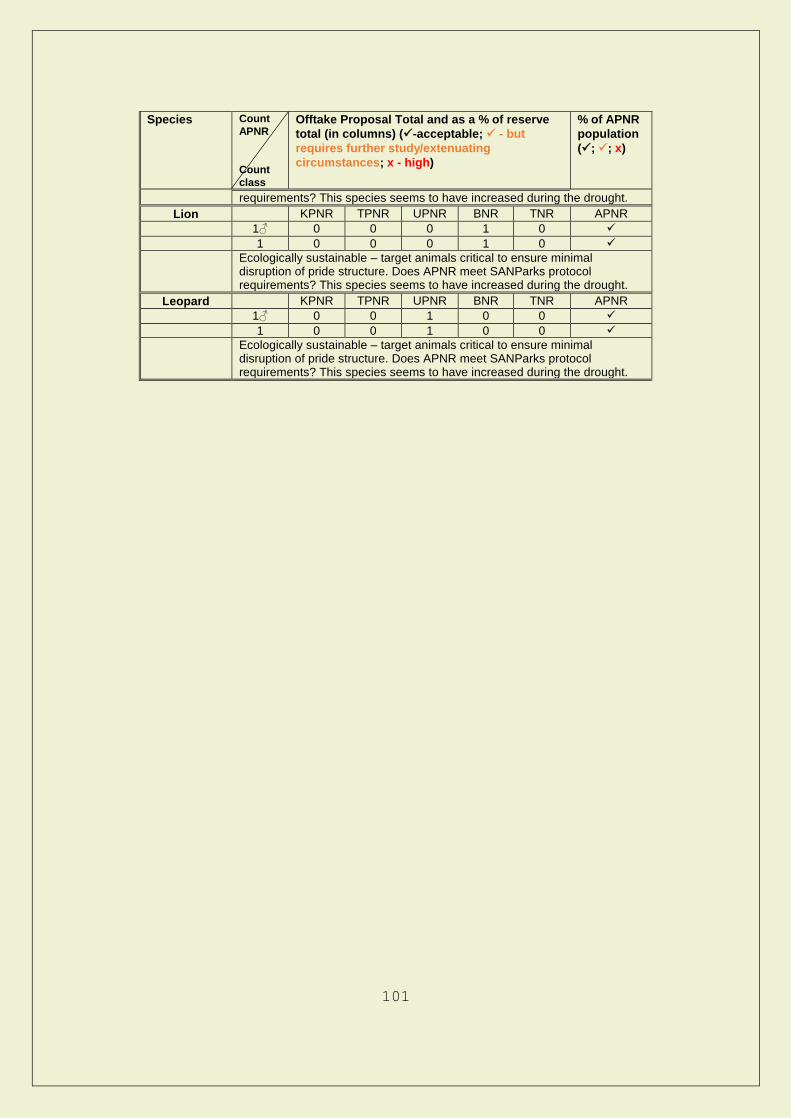
101
Species Count
APNR
Count
class
Offtake Proposal Total and as a % of reserve
total (in columns) (-acceptable; - but
requires further study/extenuating
circumstances; x - high)
% of APNR
population
(; ; x)
requirements? This species seems to have increased during the drought.
Lion KPNR TPNR UPNR BNR TNR APNR
1♂ 0 0 0 1 0
1 0 0 0 1 0
Ecologically sustainable – target animals critical to ensure minimal disruption of pride structure. Does APNR meet SANParks protocol requirements? This species seems to have increased during the drought.
Leopard KPNR TPNR UPNR BNR TNR APNR
1♂ 0 0 1 0 0
1 0 0 1 0 0
Ecologically sustainable – target animals critical to ensure minimal disruption of pride structure. Does APNR meet SANParks protocol requirements? This species seems to have increased during the drought.

102
Appendix E
Sex and age structures of herbivores on APNR reserves (use attached sheet to
assist with sex/age classification-PTO)
Date Species Number Age class/sex Location/GP
S
1 2 3 4
M F M F M F M F
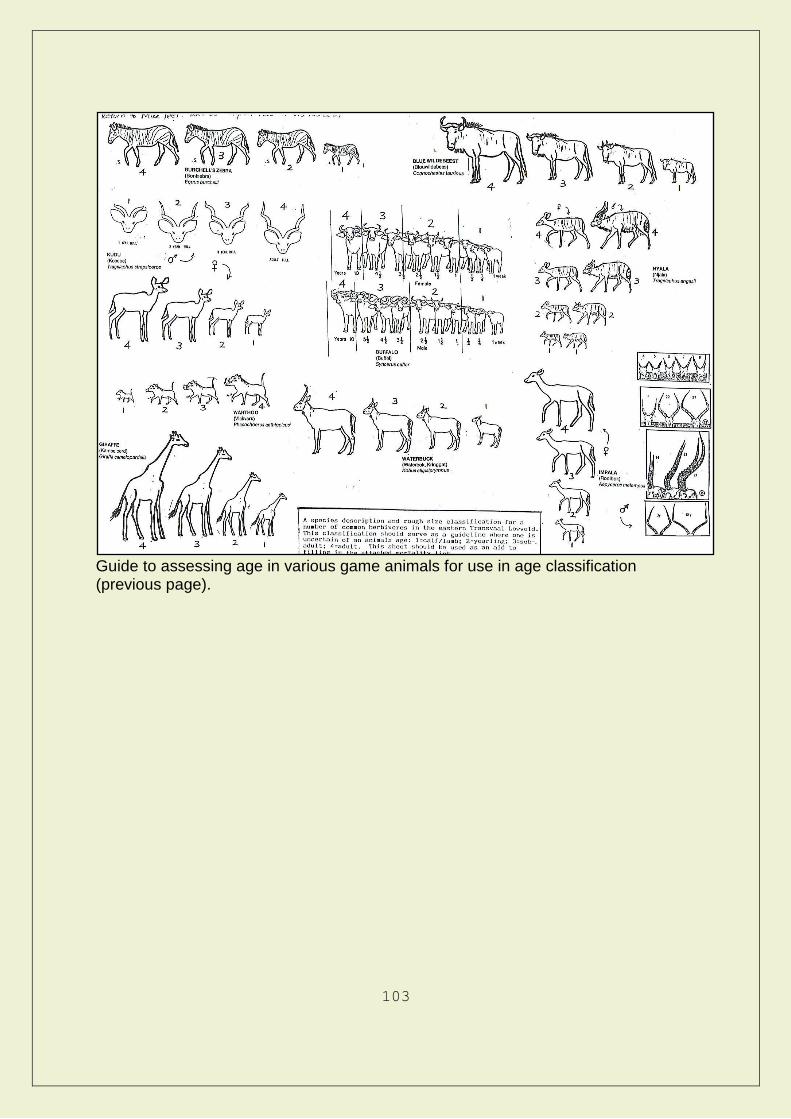
103
Guide to assessing age in various game animals for use in age classification (previous page).
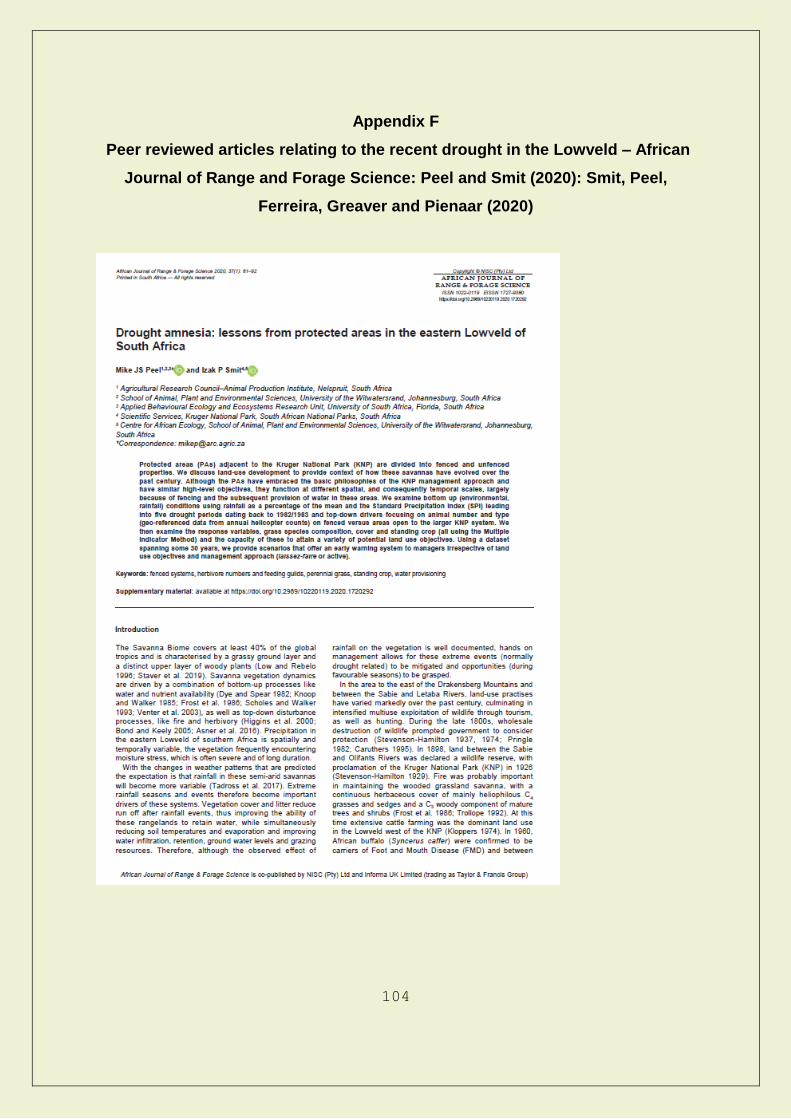
104
Appendix F
Peer reviewed articles relating to the recent drought in the Lowveld – African
Journal of Range and Forage Science: Peel and Smit (2020): Smit, Peel,
Ferreira, Greaver and Pienaar (2020)
105
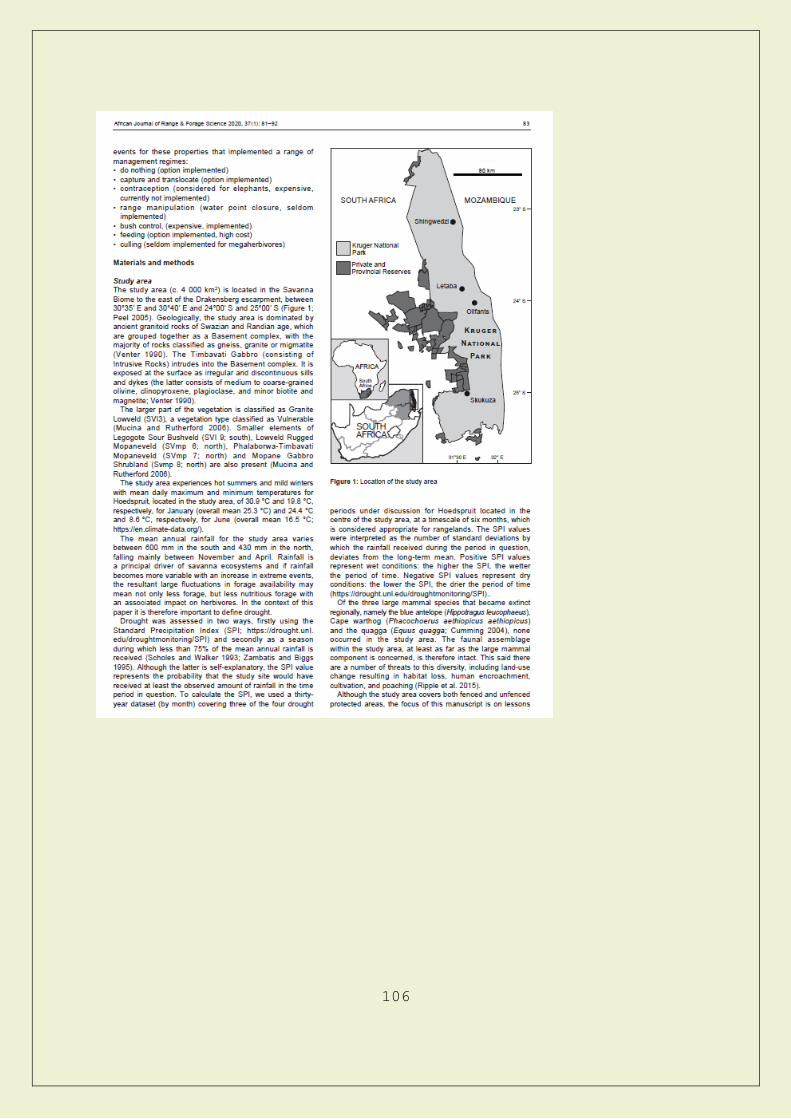
106

107

108
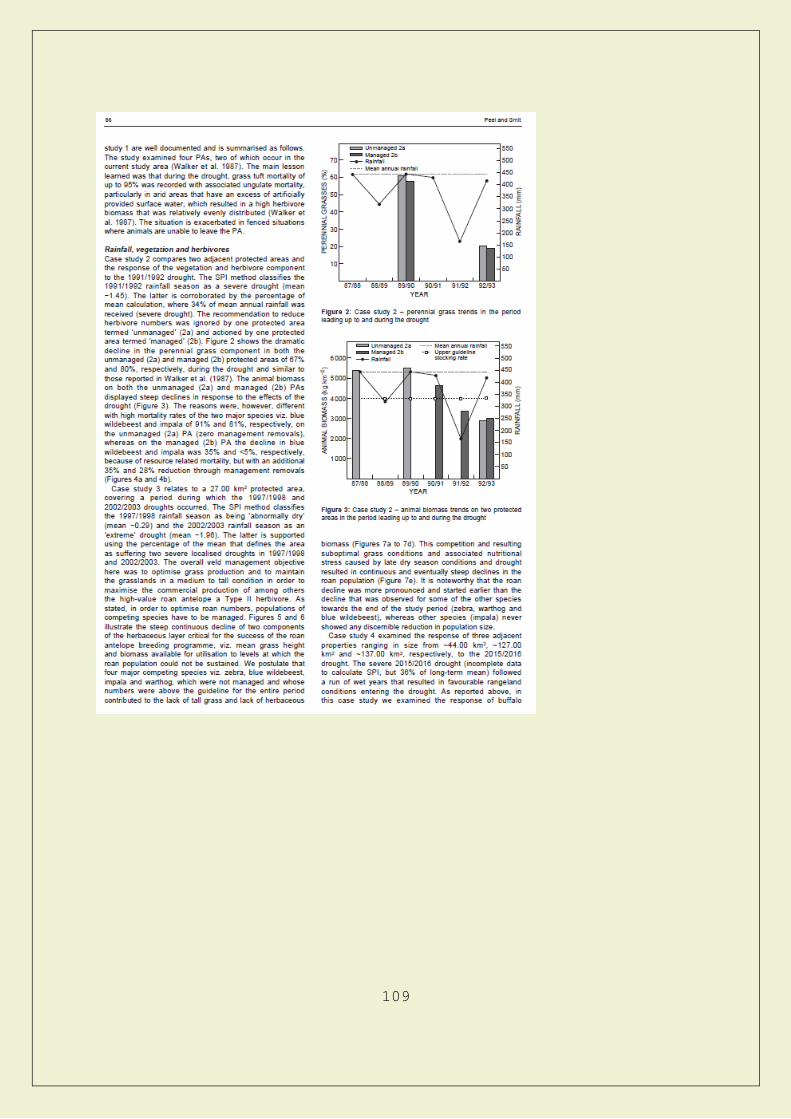
109
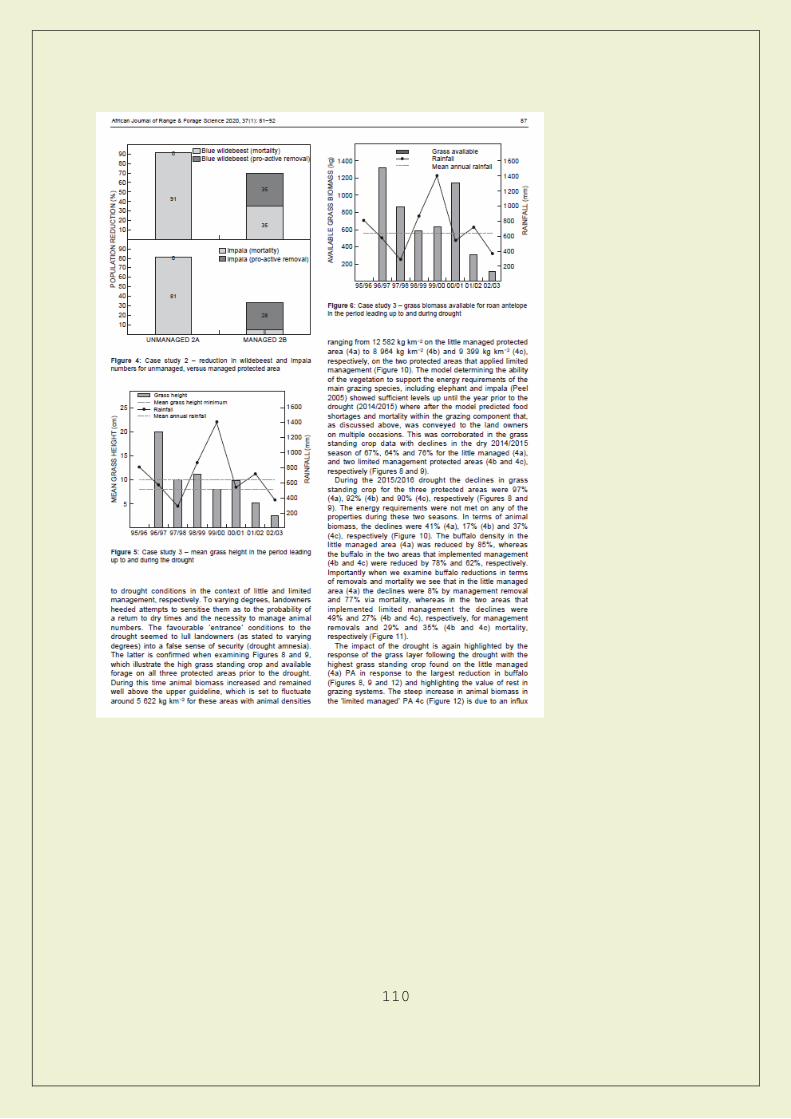
110

111

112
113
114
115

116
117
118
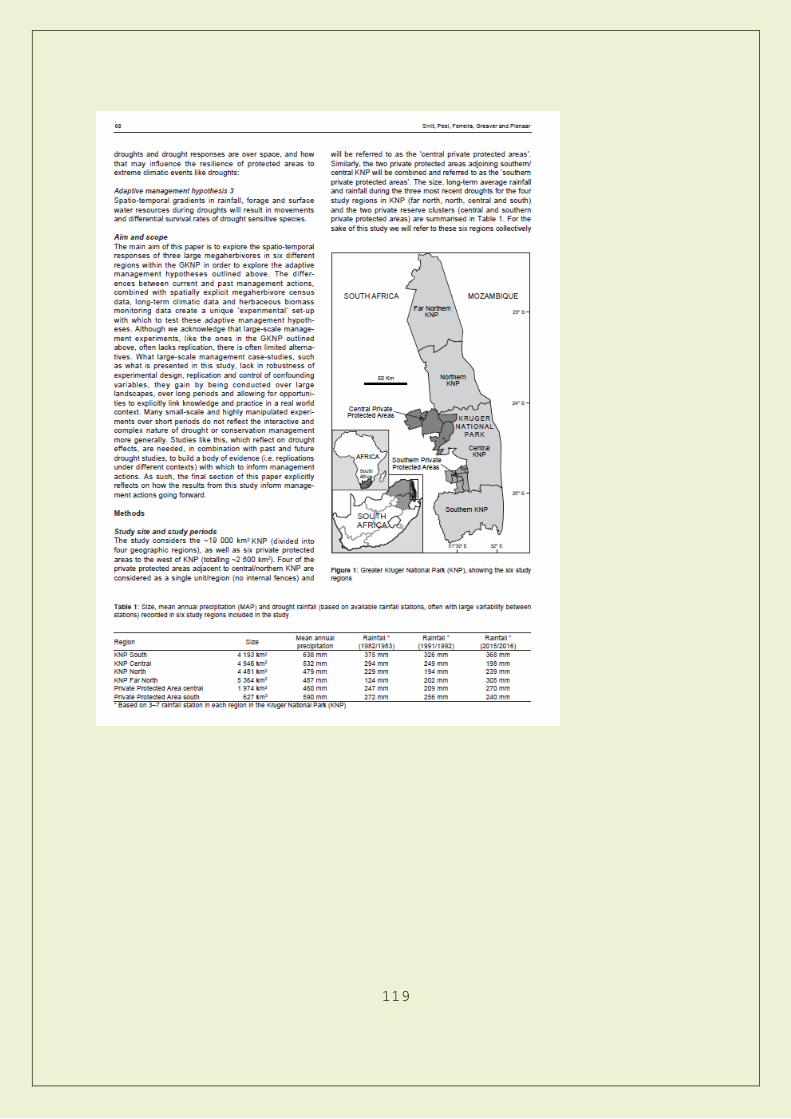
119
120
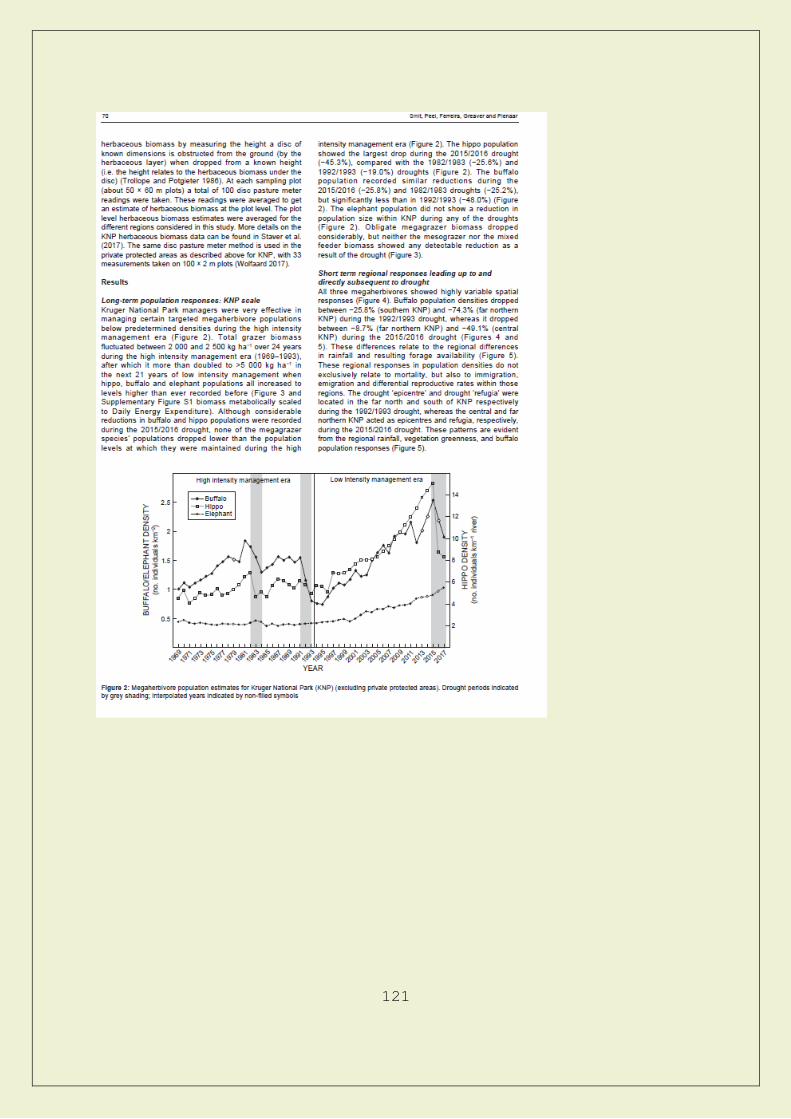
121
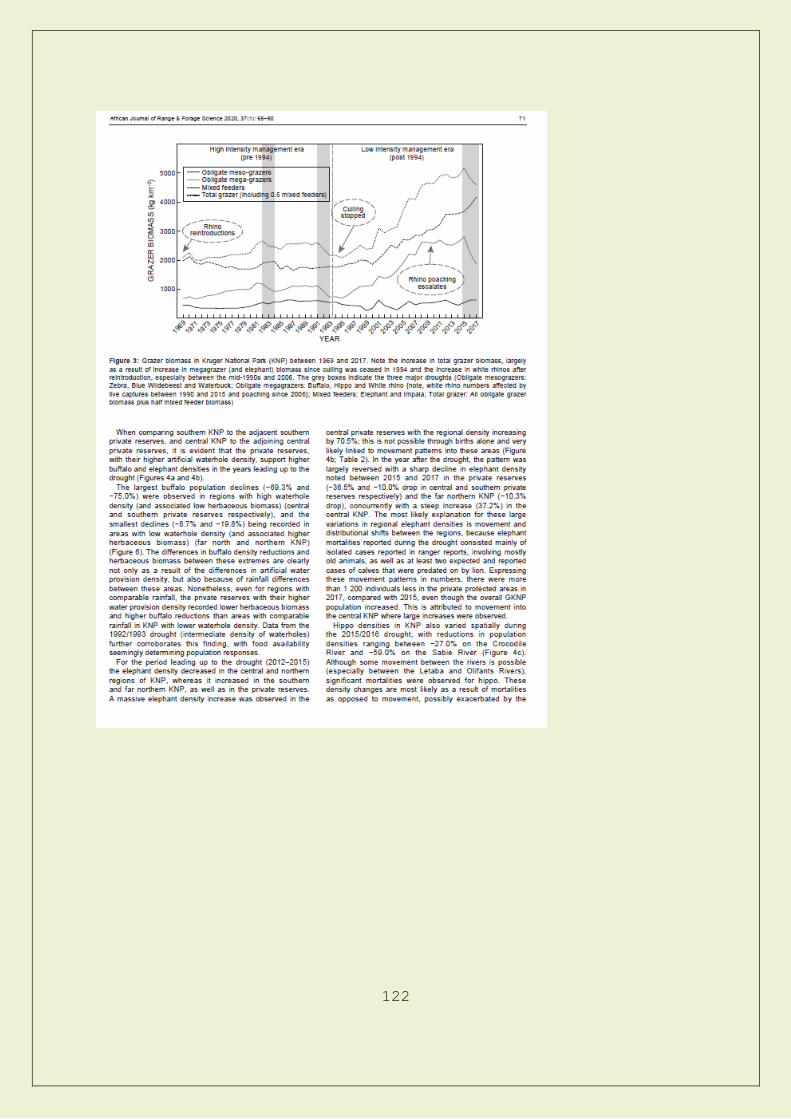
122

123
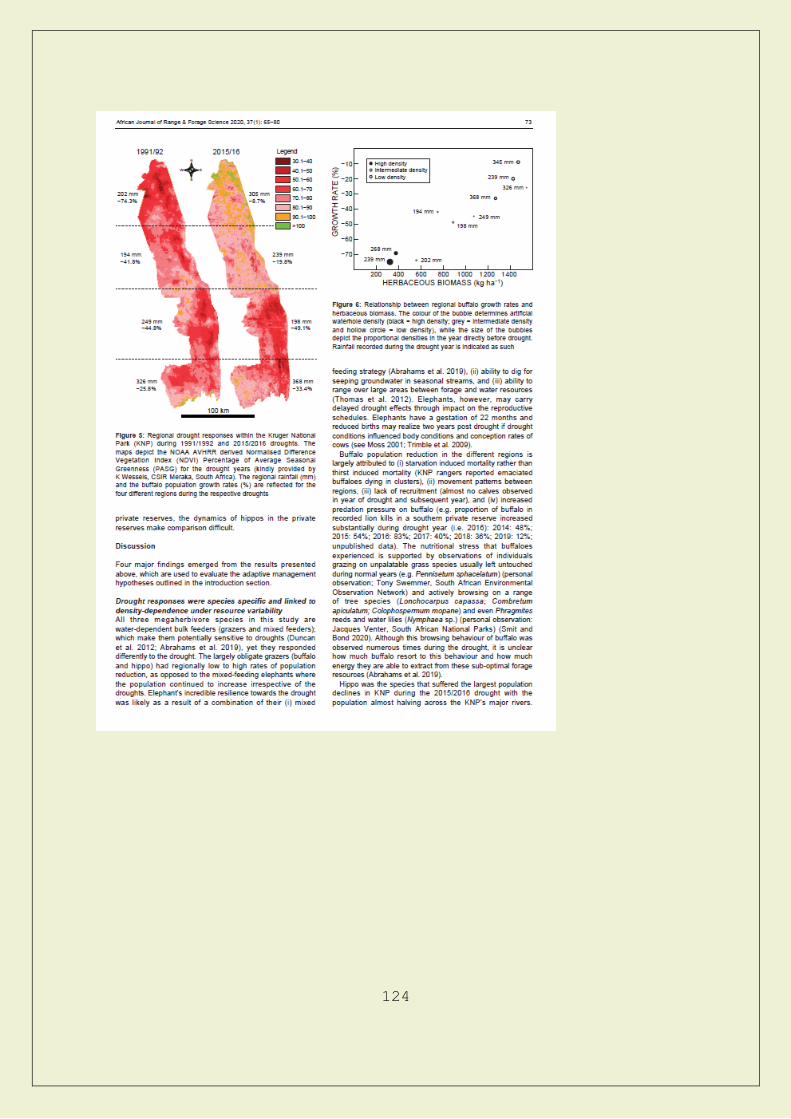
124
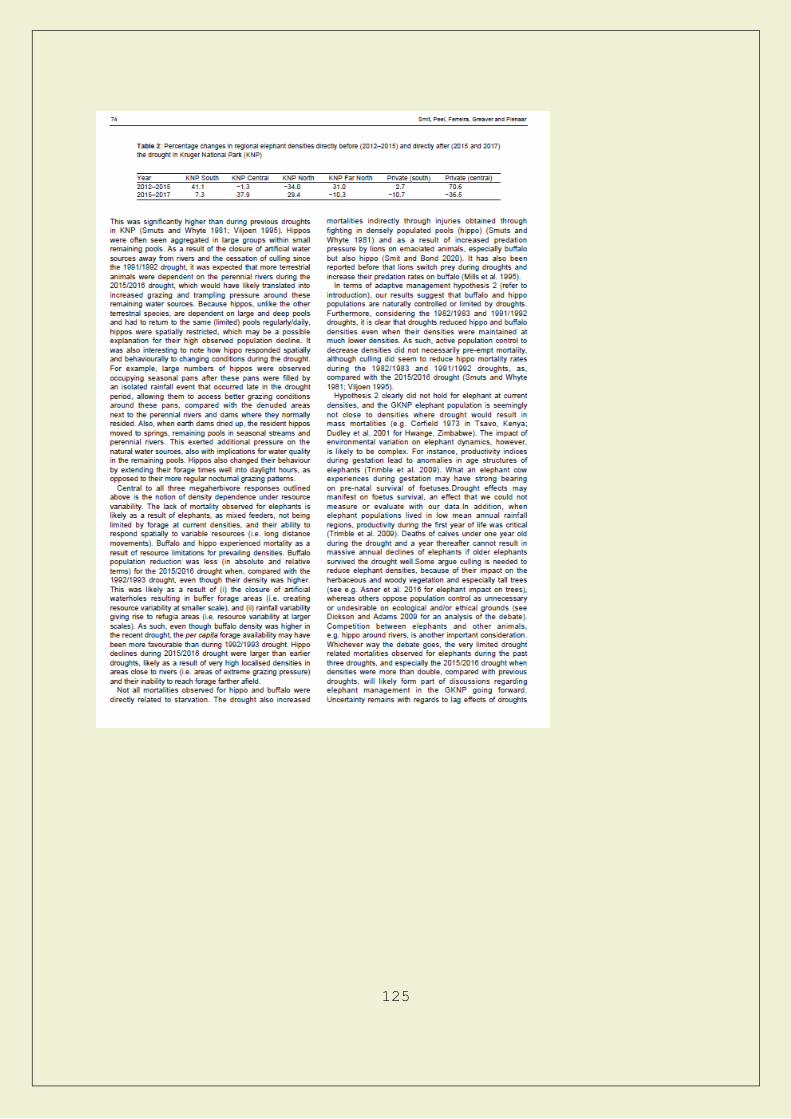
125

126
127
128
129
130
131