Embed Size (px)
Citation preview
INNOVATIVE VIEWPOINTS
Ecological network metrics: opportunities for synthesisMATTHEW K. LAU,1,� STUART R. BORRETT,2,3 BENJAMIN BAISER,4 NICHOLAS J. GOTELLI,5
AND AARON M. ELLISON1
1Harvard Forest, Harvard University, Petersham, Massachusetts 02138 USA2Department of Biology and Marine Biology, University of North Carolina, Wilmington, North Carolina 28403 USA
3Duke Network Analysis Center, Social Science Research Institute, Duke University, Durham, North Carolina 27708 USA4Department of Wildlife Ecology and Conservation, University of Florida, Gainesville, Florida 32611 USA
5Department of Biology, University of Vermont, Burlington, Vermont 05405 USA
Citation: Lau, M. K., S. R. Borrett, B. Baiser, N. J. Gotelli, and A. M. Ellison. 2017. Ecological network metrics:opportunities for synthesis. Ecosphere 8(8):e01900. 10.1002/ecs2.1900
Abstract. Network ecology provides a systems basis for approaching ecological questions, such as fac-tors that influence biological diversity, the role of particular species or particular traits in structuringecosystems, and long-term ecological dynamics (e.g., stability). Whereas the introduction of networktheory has enabled ecologists to quantify not only the degree, but also the architecture of ecological com-plexity, these advances have come at the cost of introducing new challenges, including new theoretical con-cepts and metrics, and increased data complexity and computational intensity. Synthesizing recentdevelopments in the network ecology literature, we point to several potential solutions to these issues: inte-grating network metrics and their terminology across sub-disciplines; benchmarking new network algo-rithms and models to increase mechanistic understanding; and improving tools for sharing ecologicalnetwork research, in particular “model” data provenance, to increase the reproducibility of network mod-els and analyses. We propose that applying these solutions will aid in synthesizing ecological sub-disci-plines and allied fields by improving the accessibility of network methods and models.
Key words: benchmarking; computation; data provenance; metrics; network ecology; systems analysis.
Received 8 April 2017; revised and accepted 26 May 2017; final version received 28 June 2017. Corresponding Editor:Debra P. C. Peters.Copyright: © 2017 Lau et al. This is an open access article under the terms of the Creative Commons AttributionLicense, which permits use, distribution and reproduction in any medium, provided the original work is properly cited.� E-mail: [email protected]
INTRODUCTION
Interactions are at the heart of ecology anddrive many of its key questions. What are theroles of species interactions in ecological systems?When and why is biological diversity important?What factors influence the long-term dynamics ofecosystems? These are all questions with a longhistory in ecology (Cherrett 1989, Lubchencoet al. 1991, Council 2003, Sutherland et al. 2013)that are not addressed in isolation. Points of inter-section include the relationship between diversityand stability (May 2001, 2006); the identity and
role of species that are the main drivers of com-munity structure (e.g., keystone species, Paine1966), ecosystem engineers (Jones et al. 1994), orfoundation species (Dayton 1972, Ellison et al.2005); and the causes and consequences of intro-ducing new species into existing assemblages(Simberloff and Holle 1999, Baiser et al. 2008).Furthermore, “systems thinking” has been a per-sistent thread throughout the history of ecology(Odum and Pinkerton 1955, Margalef 1963, Pat-ten 1978, Patten and Auble 1981, Ulanowicz1986), dating back at least to Darwin’s Origin ofSpecies in his famous pondering of an entangled
❖ www.esajournals.org 1 August 2017 ❖ Volume 8(8) ❖ Article e01900
bank (Golley 1993, Bascompte and Jordano 2014).The application of network theory has provided aformal, mathematical framework to approachsystems (Proulx et al. 2005, Bascompte andJordano 2014) and led to the development ofnetwork ecology (Patten and Witkamp 1967,Borrett et al. 2014, Poisot et al. 2016b).
Network ecology can be defined as the use ofnetwork models and analyses to investigate thestructure, function, and evolution of ecologicalsystems at many scales and levels of organization(Borrett et al. 2012, Ekl€of et al. 2012). The influxof network thinking throughout ecology, andecology’s contribution to the development ofnetwork science highlight the assertion that“networks are everywhere” (Lima 2011). And, asone would expect, the field has grown rapidly,from 1% of the primary ecological literature in1991 to over 6% in 2017 (Fig. 1A). Some examplesinclude the following: applying network theoryto population dynamics and spread of infectiousdiseases (May 2006); description and analysis ofnetworks of proteins in adult organisms (Stumpfet al. 2007) or during development (Hollenberg2007); expanding classical food-web to includeparasites and non-trophic interactions (Ings et al.2009, K�efi et al. 2012); investigating animal move-ment patterns (L�ed�ee et al. 2016) and the spatialstructure of metapopulations (Holstein et al.2014, Dubois et al. 2016); connecting biodiversityto ecosystem functioning (Creamer et al. 2016);identifying keystone species (Borrett 2013, Zhaoet al. 2016); and using social network theory instudies of animal behavior (Krause et al. 2003,Croft et al. 2004, Sih et al. 2009, Fletcher et al.2013). Further, ideas and concepts from networkecology are being applied to investigate the sus-tainability of urban and industrial systems (Fanget al. 2014, Layton et al. 2016, Xia et al. 2016) andelements of the food–energy–water nexus (Wangand Chen 2016, Yang and Chen 2016).
Over the past 15 yr, re-occurring themes formoving network ecology forward have emergedfrom reviews, perspectives, and syntheses (e.g.,Proulx et al. 2005, Bascompte 2010, Borrett et al.2014, Poisot et al. 2015). In this paper, we examineareas where the network approach is being appliedto address important ecological questions andidentify both challenges and opportunities foradvancing the field. Among these are the need forshifting the focus toward mechanisms rather than
observations, and increasing the resolution (e.g.,individuals or traits as nodes and weighted edgesof different interaction types) and replication ofnetwork models across different ecosystems andtime (Ings et al. 2009, Woodward et al. 2010, Poisotet al. 2016b). After a brief primer of key conceptsfrom network ecology, we discuss the followingtopics as they relate to these issues: the prolifera-tion of terminology for ecological metrics with theincreasing application of network methods; fullyexploring the underlying assumptions of modelsof mechanistic processes for generating networkstructure; and the need for improved sharing andreproducibility of ecological network research andmodels. Although these topics are not new, thecombination of the influx of metrics and theoryand rapid increases in the computational intensityof ecology is creating novel challenges. Withrespect to these issues, we discuss recent advancesthat should be explored as tools to aid in a moreeffective integration of network methods for syn-thesis across ecological sub-disciplines.
A PRIMER OF ECOLOGICAL NETWORKS:MODELS AND METRICS
Prior to the introduction of network methodsin ecology, the primary way of studying interac-tions was limited to detailed studies of behaviorsand traits of individual species important tointeractions, or of relationships between tightlyinteracting pairs of species (Carmel et al. 2013).Some ecologists were advancing whole-systemmethods (Lindeman 1942, Odum 1957); however,quantifying interactions is costly, as compared tosurveys of species abundances. This has createda significant barrier to studying interactions atthe scale of entire communities, either at the scaleof individuals or species pairs, because thenumber of interactions becomes intractable. Forinstance, even if one assumes that only pairwiseinteractions occur among S species, the numberof possible pairs is S(S � 1)/2. Local assemblagesof macrobes often have 101–102 species, andmicrobial diversity can easily exceed 103 opera-tional taxonomic units (OTUs).This complexity of ecological systems is one
reason there is a long tradition in communityecology of studying interactions within smallsubsets of closely related species (e.g., trophicguilds) and using dimensionality reducing
❖ www.esajournals.org 2 August 2017 ❖ Volume 8(8) ❖ Article e01900
INNOVATIVE VIEWPOINTS LAU ET AL.
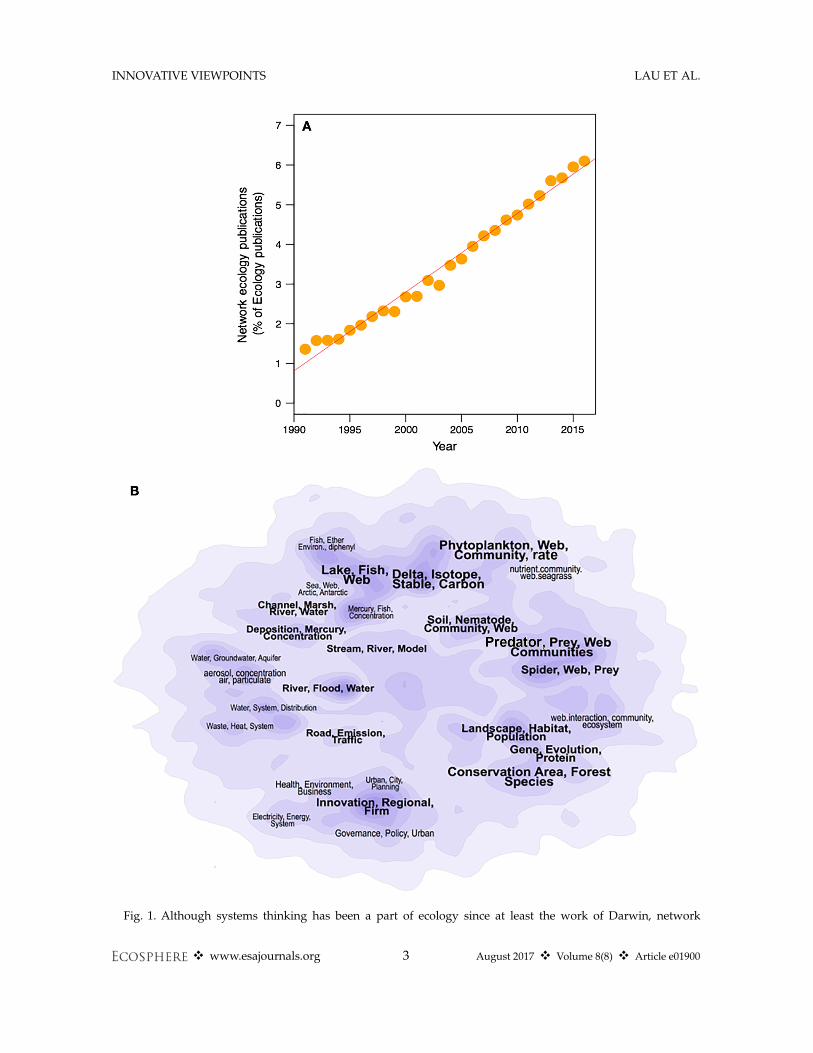
Fig. 1. Although systems thinking has been a part of ecology since at least the work of Darwin, network
❖ www.esajournals.org 3 August 2017 ❖ Volume 8(8) ❖ Article e01900
INNOVATIVE VIEWPOINTS LAU ET AL.
methods based on multivariate, correlativeapproaches (Legendre et al. 2012). While someapproaches to studying subsets of species incor-porate the underlying pattern of direct and indi-rect links (e.g., modules [sensu Holt 1997, Holtand Hoopes 2005]), the majority do not. Suchlimitations repeatedly have led to calls for theapplication of “network thinking” to ecologicalquestions (e.g., Patten and Witkamp 1967, Urbanand Keitt 2001, Proulx et al. 2005, Ings et al.2009, Golubski et al. 2016, Jacoby and Freeman2016, QUINTESSENCE Consortium et al. 2016).There are now many resources for learning aboutnetwork ecology and network theory in general,and we point the reader in the direction of excel-lent reviews in this area (Proulx et al. 2005,Bascompte and Jordano 2007, Ings et al. 2009,Borrett et al. 2012, Brandes et al. 2013) and morecomprehensive introductions (Brandes andErlebach 2005, Newman 2010, Estrada 2015).
Network ecology employs network theory toquantify the structure of ecological interactions.All networks consist of sets of interacting nodes(e.g. species, non-living nutrient pools, habitatpatches) whose relationships are represented byedges (e.g., nutrient or energy transfers, pollina-tion, movement of individuals). Conceptually, anetwork is a set of things or objects with connec-tions among them. Stated mathematically, anetwork is a generic relational model comprisedof a set of objects represented by nodes orvertices (N) and a set of edges (E) that map oneor more relationships among the nodes, G = (N,E). A canonical ecological example of a networkis a food-web diagram, in which the nodes repre-sent species, groups of species, or non-livingresources, and the edges map the relationshipwho-eats-whom.
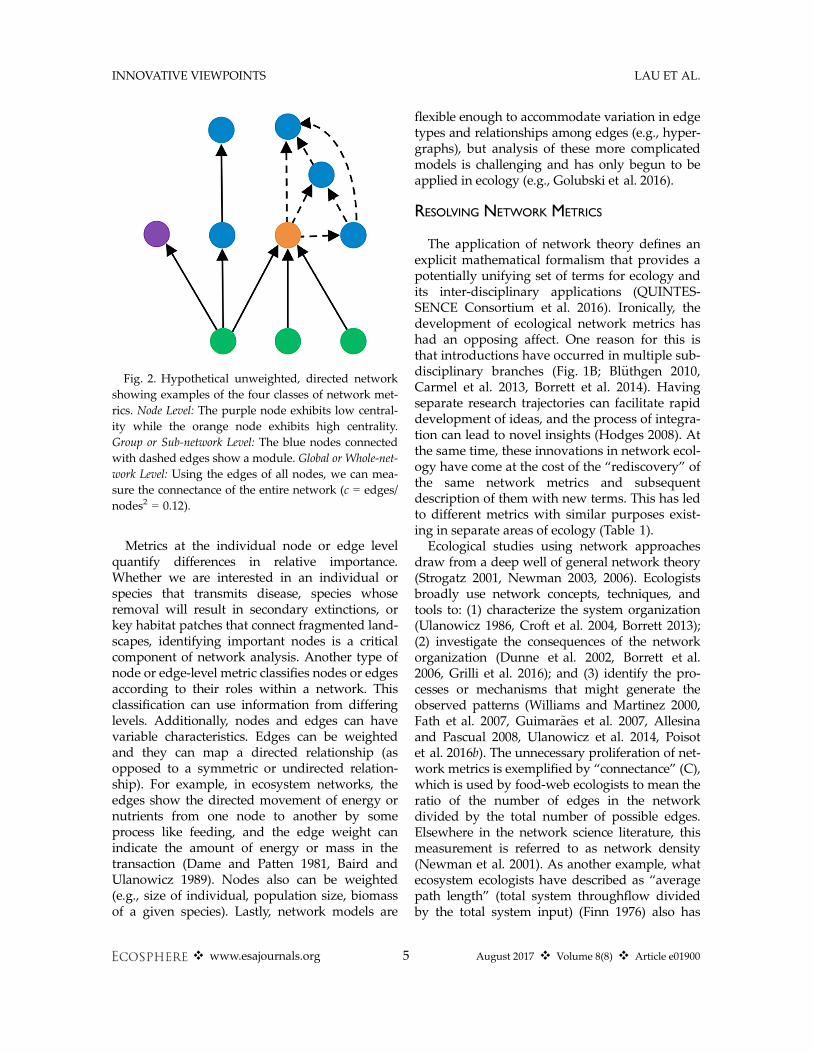
The analysis of networks is inherently hierar-chical, ranging from the entire network down toindividual nodes and edges. Depending on thecharacteristics and level of detail of the informa-tion provided for a given model, there is a large
number of network analyses and metrics that canbe used to characterize the system at multiplelevels (similar to Hines and Borrett 2014, Wasser-man and Faust 1994), including: (1) the whole-network level (i.e., the entire network), (2) thesub-network level (i.e., groups of two or morenodes and their edges), and (3) the individualnode or edge level (Fig. 2).Network-level metrics integrate information
over the entire set of nodes and edges. Forexample, the number of nodes (e.g., the speciesrichness of a food-web) and the density of con-nections or connectance are both network-levelstatistics used to describe the overall complexityof a network and have been investigated byecologists for over 40 yr (May 1972, Allesina andTang 2012).Sub-network-level analyses focus on identify-
ing specific subsets of nodes and edges. Thereare a variety of groups that have different names(e.g., module, motif, cluster, clique, environ) anddifferent methods for measurement. Sub-networks often represent more tractable andmeaningful units of study than individual nodesand edges on the one hand or entire networks onthe other. For example, in landscape and popula-tion ecology, the preferential movement of indi-viduals and genes (edges) between habitatpatches (nodes) has implications for conservationof populations and the design of preserves(Calabrese and Fagan 2004, Holt and Hoopes2005, Fletcher et al. 2013). Also, both nodes andedges can be divided into classes. An example ofthis is the bipartite graph, in which interactionsoccur primarily between, rather than within,each class or “part” of the community. A bipar-tite network has only two classes of nodes, suchas in a pollination network in which the commu-nity is divided into plants being pollinated andinsects that do the pollination (Petanidou et al.2008). In this network, edges representing polli-nation visits can only map between two nodes inthe different classes.
ecology has grown rapidly since the turn of the last century but has been developing in isolated sub-fields. (A)Plot showing the increase in “network ecology” keywords in the literature from 1991 to current (updated usingsearch developed by Borrett et al. [2014]). (B) Contour plot of common topics in network ecology with peaksindicating clusters of related topics. The regions are labeled with the most common terms found in the clusters.From Borrett et al. (2014), reproduced with permission.
(Fig. 1. Continued)
❖ www.esajournals.org 4 August 2017 ❖ Volume 8(8) ❖ Article e01900
INNOVATIVE VIEWPOINTS LAU ET AL.
Metrics at the individual node or edge levelquantify differences in relative importance.Whether we are interested in an individual orspecies that transmits disease, species whoseremoval will result in secondary extinctions, orkey habitat patches that connect fragmented land-scapes, identifying important nodes is a criticalcomponent of network analysis. Another type ofnode or edge-level metric classifies nodes or edgesaccording to their roles within a network. Thisclassification can use information from differinglevels. Additionally, nodes and edges can havevariable characteristics. Edges can be weightedand they can map a directed relationship (asopposed to a symmetric or undirected relation-ship). For example, in ecosystem networks, theedges show the directed movement of energy ornutrients from one node to another by someprocess like feeding, and the edge weight canindicate the amount of energy or mass in thetransaction (Dame and Patten 1981, Baird andUlanowicz 1989). Nodes also can be weighted(e.g., size of individual, population size, biomassof a given species). Lastly, network models are
flexible enough to accommodate variation in edgetypes and relationships among edges (e.g., hyper-graphs), but analysis of these more complicatedmodels is challenging and has only begun to beapplied in ecology (e.g., Golubski et al. 2016).
RESOLVING NETWORK METRICS
The application of network theory defines anexplicit mathematical formalism that provides apotentially unifying set of terms for ecology andits inter-disciplinary applications (QUINTES-SENCE Consortium et al. 2016). Ironically, thedevelopment of ecological network metrics hashad an opposing affect. One reason for this isthat introductions have occurred in multiple sub-disciplinary branches (Fig. 1B; Bl€uthgen 2010,Carmel et al. 2013, Borrett et al. 2014). Havingseparate research trajectories can facilitate rapiddevelopment of ideas, and the process of integra-tion can lead to novel insights (Hodges 2008). Atthe same time, these innovations in network ecol-ogy have come at the cost of the “rediscovery” ofthe same network metrics and subsequentdescription of them with new terms. This has ledto different metrics with similar purposes exist-ing in separate areas of ecology (Table 1).Ecological studies using network approaches
draw from a deep well of general network theory(Strogatz 2001, Newman 2003, 2006). Ecologistsbroadly use network concepts, techniques, andtools to: (1) characterize the system organization(Ulanowicz 1986, Croft et al. 2004, Borrett 2013);(2) investigate the consequences of the networkorganization (Dunne et al. 2002, Borrett et al.2006, Grilli et al. 2016); and (3) identify the pro-cesses or mechanisms that might generate theobserved patterns (Williams and Martinez 2000,Fath et al. 2007, Guimar~aes et al. 2007, Allesinaand Pascual 2008, Ulanowicz et al. 2014, Poisotet al. 2016b). The unnecessary proliferation of net-work metrics is exemplified by “connectance” (C),which is used by food-web ecologists to mean theratio of the number of edges in the networkdivided by the total number of possible edges.Elsewhere in the network science literature, thismeasurement is referred to as network density(Newman et al. 2001). As another example, whatecosystem ecologists have described as “averagepath length” (total system throughflow dividedby the total system input) (Finn 1976) also has
Fig. 2. Hypothetical unweighted, directed networkshowing examples of the four classes of network met-rics. Node Level: The purple node exhibits low central-ity while the orange node exhibits high centrality.Group or Sub-network Level: The blue nodes connectedwith dashed edges show a module. Global or Whole-net-work Level: Using the edges of all nodes, we can mea-sure the connectance of the entire network (c = edges/nodes2 = 0.12).
❖ www.esajournals.org 5 August 2017 ❖ Volume 8(8) ❖ Article e01900
INNOVATIVE VIEWPOINTS LAU ET AL.
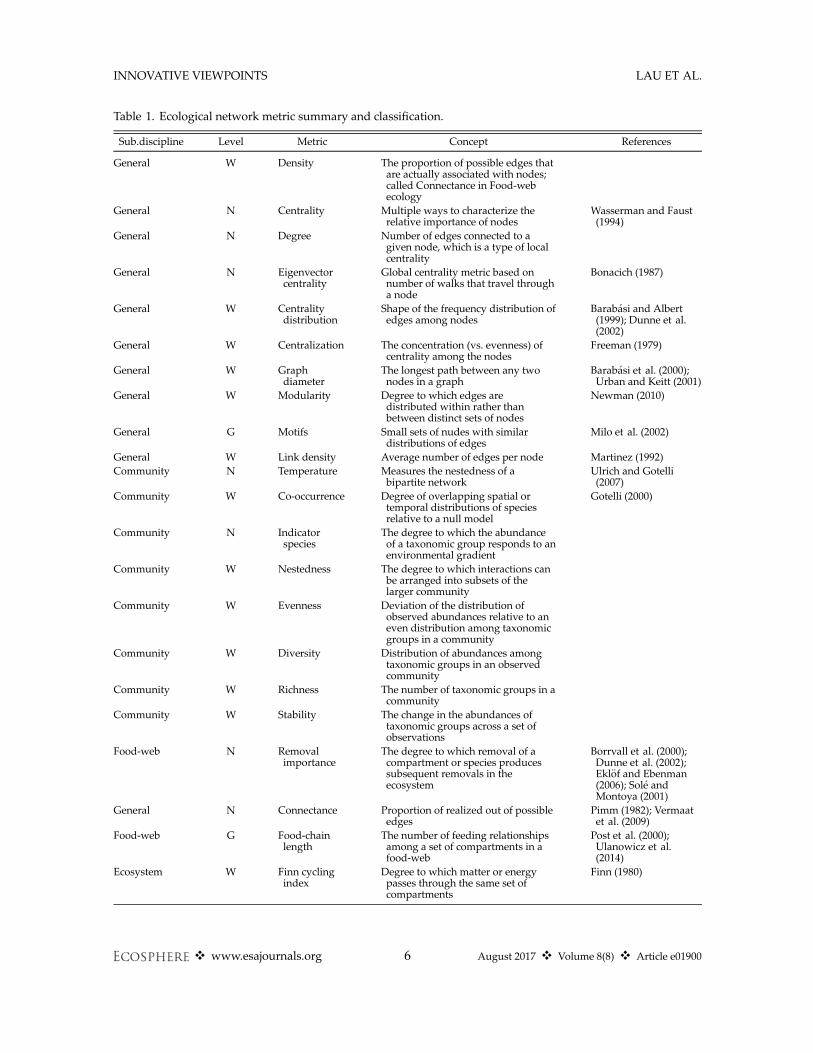
Table 1. Ecological network metric summary and classification.
Sub.discipline Level Metric Concept References
General W Density The proportion of possible edges thatare actually associated with nodes;called Connectance in Food-webecology
General N Centrality Multiple ways to characterize therelative importance of nodes
Wasserman and Faust(1994)
General N Degree Number of edges connected to agiven node, which is a type of localcentrality
General N Eigenvectorcentrality
Global centrality metric based onnumber of walks that travel througha node
Bonacich (1987)
General W Centralitydistribution
Shape of the frequency distribution ofedges among nodes
Barab�asi and Albert(1999); Dunne et al.(2002)
General W Centralization The concentration (vs. evenness) ofcentrality among the nodes
Freeman (1979)
General W Graphdiameter
The longest path between any twonodes in a graph
Barab�asi et al. (2000);Urban and Keitt (2001)
General W Modularity Degree to which edges aredistributed within rather thanbetween distinct sets of nodes
Newman (2010)
General G Motifs Small sets of nudes with similardistributions of edges
Milo et al. (2002)
General W Link density Average number of edges per node Martinez (1992)Community N Temperature Measures the nestedness of a
bipartite networkUlrich and Gotelli(2007)
Community W Co-occurrence Degree of overlapping spatial ortemporal distributions of speciesrelative to a null model
Gotelli (2000)
Community N Indicatorspecies
The degree to which the abundanceof a taxonomic group responds to anenvironmental gradient
Community W Nestedness The degree to which interactions canbe arranged into subsets of thelarger community
Community W Evenness Deviation of the distribution ofobserved abundances relative to aneven distribution among taxonomicgroups in a community
Community W Diversity Distribution of abundances amongtaxonomic groups in an observedcommunity
Community W Richness The number of taxonomic groups in acommunity
Community W Stability The change in the abundances oftaxonomic groups across a set ofobservations
Food-web N Removalimportance
The degree to which removal of acompartment or species producessubsequent removals in theecosystem
Borrvall et al. (2000);Dunne et al. (2002);Ekl€of and Ebenman(2006); Sol�e andMontoya (2001)
General N Connectance Proportion of realized out of possibleedges
Pimm (1982); Vermaatet al. (2009)
Food-web G Food-chainlength
The number of feeding relationshipsamong a set of compartments in afood-web
Post et al. (2000);Ulanowicz et al.(2014)
Ecosystem W Finn cyclingindex
Degree to which matter or energypasses through the same set ofcompartments
Finn (1980)
❖ www.esajournals.org 6 August 2017 ❖ Volume 8(8) ❖ Article e01900
INNOVATIVE VIEWPOINTS LAU ET AL.
been called network aggradation (Jørgensen et al.2000). In economics, average path length isknown as the multiplier effect (Samuelson 1948).
Another kind of redundancy is the creationand use of multiple statistics that measure thesame or very similar network aspects. A clearexample of this is inherent in the proliferation ofcentrality measures to indicate node or edgeimportance. Network scientists have shown thatmany centrality metrics are correlated (Newman2006, Jord�an et al. 2007, Valente et al. 2008).Likewise, Borrett and Osidele (2007) found thatnine commonly reported ecosystem networkanalysis metrics covaried in 90 plausible parame-terizations of a model of phosphorus biogeo-chemical cycling for Lake Lanier, Georgia, butthat all these metrics were associated stronglywith only two underlying factors. However, evena perfect correlation does not mean that two met-rics have identical properties, and they still maydiverge in different models. Therefore, it isimportant to have mathematically based compar-isons of metrics (Borgatti and Everett 2006,Borrett 2013, Kazanci and Ma 2015, Ludovisi and
Scharler 2017). It is incumbent on network ecolo-gists to establish clearly the independence anduniqueness of the descriptive metrics used.From the perspective of the broader field of
ecology, the proliferation of concepts, terms, andmetrics is not a new issue (e.g., Tansley 1935, Elli-son et al. 2005). Ecologists have a long history ofusing network concepts and related models inmultiple subdomains (e.g., metapopulations,matrix population models, community co-occurrence models, ecosystems) without fullyrecognizing or capitalizing on the similarities ofthe underlying models. Each subdomain hasconstructed its own concepts and methods (occa-sionally borrowing from other areas) and estab-lished its own jargon that impedes scientificdevelopment. Previous suggestions for solvingthis issue have focused on maintaining an histor-ical perspective of ecology (Graham and Dayton2002); Bl€uthgen et al. (2008) is an excellentexample of how this can be done through peer-reviewed literature.One possible approach that would go beyond
such a diffuse, literature-centered approach
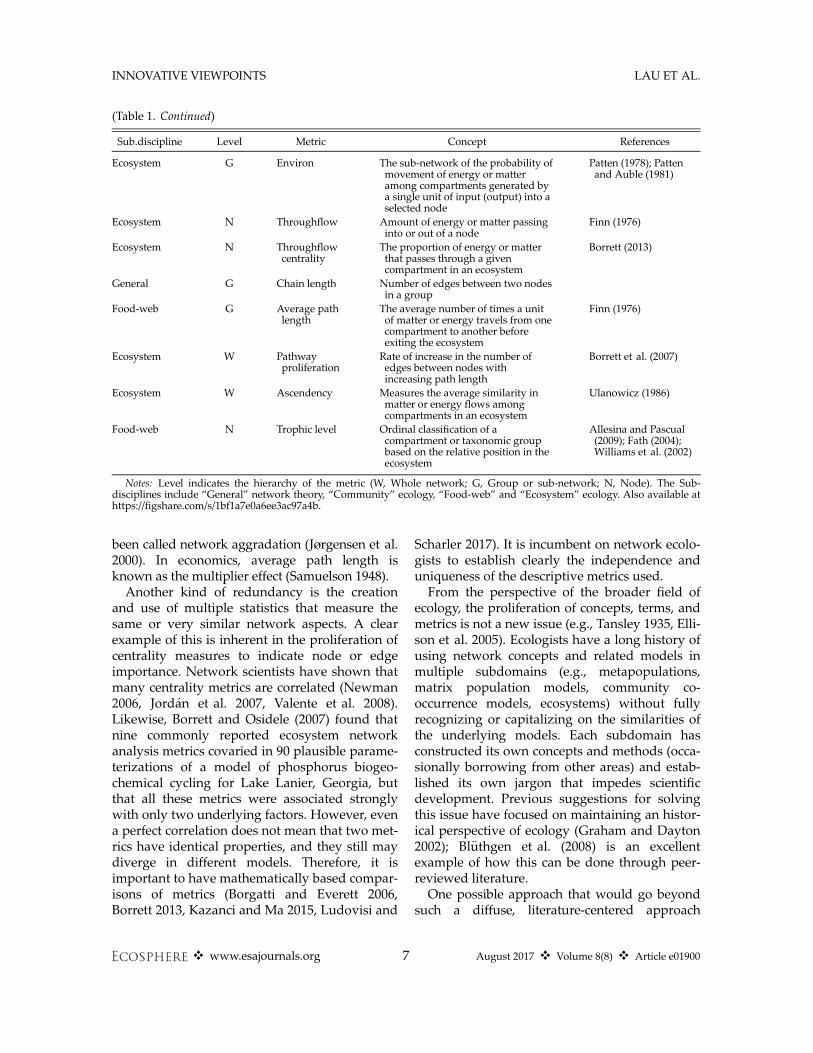
(Table 1. Continued)
Sub.discipline Level Metric Concept References
Ecosystem G Environ The sub-network of the probability ofmovement of energy or matteramong compartments generated bya single unit of input (output) into aselected node
Patten (1978); Pattenand Auble (1981)
Ecosystem N Throughflow Amount of energy or matter passinginto or out of a node
Finn (1976)
Ecosystem N Throughflowcentrality
The proportion of energy or matterthat passes through a givencompartment in an ecosystem
Borrett (2013)
General G Chain length Number of edges between two nodesin a group
Food-web G Average pathlength
The average number of times a unitof matter or energy travels from onecompartment to another beforeexiting the ecosystem
Finn (1976)
Ecosystem W Pathwayproliferation
Rate of increase in the number ofedges between nodes withincreasing path length
Borrett et al. (2007)
Ecosystem W Ascendency Measures the average similarity inmatter or energy flows amongcompartments in an ecosystem
Ulanowicz (1986)
Food-web N Trophic level Ordinal classification of acompartment or taxonomic groupbased on the relative position in theecosystem
Allesina and Pascual(2009); Fath (2004);Williams et al. (2002)
Notes: Level indicates the hierarchy of the metric (W, Whole network; G, Group or sub-network; N, Node). The Sub-disciplines include “General” network theory, “Community” ecology, “Food-web” and “Ecosystem” ecology. Also available athttps://figshare.com/s/1bf1a7e0a6ee3ac97a4b.
❖ www.esajournals.org 7 August 2017 ❖ Volume 8(8) ❖ Article e01900
INNOVATIVE VIEWPOINTS LAU ET AL.
would be to develop a formal ontology of con-cepts and metrics. An ontology is a set of relatedterms that are formally defined and supported byassertions (Bard and Rhee 2004). An ontologytherefore provides a framework for developingconcepts within a discipline and presents theopportunity for more efficient synthesis acrossdisciplinary boundaries. The concept of an ontol-ogy is not new, but more rapid sharing of ontolo-gies and their collaborative development havebeen enabled by the Internet. For example, theOpen Biological Ontologies (OBO, http://www.obofoundry.org) supports the creation and shar-ing of ontologies over the web. Currently, there isno OBO for a “network ecology metric” ontology,and as far as we are aware, ontologies have yet tobe explored or developed for network metrics.
The OBO could provide a platform for harmo-nizing ecological network metrics, terms, andconcepts. Key obstacles to such harmonizationinclude a requirement that network ecologistswork within a common framework, and the needfor an individual or leadership team to periodi-cally curate the ontology based on new develop-ments in the field. In determining the best courseof action, network ecologists could follow theexample of how similar OBO projects have beenmanaged in the past. The FOODON food roleontology project (http://www.obofoundry.org/ontology/foodon.html) contains information about“materials in natural ecosystems and food-websas well as human-centric categorization andhandling of food.” It could serve as an exampleor even the basis of a ecological network metricontology.
BENCHMARKING: TRUSTING OUR MODELS OFMECHANISMS
Inferences about processes in ecological systemshave relied in part on the application of simulationmodels that generate matrices with predictableproperties. As discussed in the previous section,the proliferation of network metrics points to theneed for the investigation and comparison of howthese metrics will behave in the context of differentmodeling algorithms. Once a metric or algorithmhas been chosen, it is tempting to apply themwidely to empirical systems to detect patterns, butbefore research proceeds, a process of “benchmark-ing” with artificial matrices that have predefined
amounts of structure and randomness should beused to examine the behavior of the algorithmsand the metrics that are applied to them.Benchmarking of ecological models developed
from null model analysis in community ecology(Connor and Simberloff 1979, Atmar and Patter-son 1993, Gotelli and Ulrich 2012). Null modelsare specific examples of randomization or MonteCarlo tests (Manly 2007) that estimate a frequen-tist P value, the tail probability of obtaining thevalue of some metric if the null hypothesis weretrue (Gotelli and Graves 1996). The aim of a nullmodel is to determine if the structure of anobserved ecological pattern in space or time isincongruous with what would be expected giventhe absence of a causal mechanism. A metric ofstructure calculated for a single empirical data setis compared to the distribution of the same metriccalculated for a collection of a large number ofrandomizations of the empirical data set. The dataare typically randomized by reshuffling some ele-ments while holding other elements constant toincorporate realistic constraints. Comparison witha suite of null models in which different con-straints are systematically imposed or relaxedmay provide a better understanding of the factorsthat contribute most to patterns in the network(see Box 1). However, the devil remains in thedetails and there are also a variety of ways to ran-domize data and impose constraints to constructa useful null model. If the null model is too sim-plistic, such as a model in which edges and nodesare sampled with uniform probability, it willalways be rejected and provide little insight intoimportant ecological patterns, regardless of whatmetric is used. At the other extreme, if the nullmodel incorporates too many constraints from thedata, it will be difficult or impossible to reject thenull hypothesis, even though the network maycontain interesting structure.In network theory, the Erdos-Renyi (ER, Erd€os
and R�enyi 1959) model is a now-classic exampleof a model used to generate networks via a ran-dom process for creating matrix structure. TheER model is a random graph that starts with anN 9 N adjacency matrix of nodes and assigns toit K edges between randomly chosen pairs ofnodes. The ER model has been applied in ecol-ogy to address questions about the relationshipbetween stability and complexity (May 1972) andthe structure of genetic networks (Kauffman
❖ www.esajournals.org 8 August 2017 ❖ Volume 8(8) ❖ Article e01900
INNOVATIVE VIEWPOINTS LAU ET AL.
et al. 2003). For example, randomized networkshave been used to link motifs (Milo et al. 2002) tonetwork assembly (Baiser et al. 2016), stability(Allesina and Pascual 2008, Borrelli et al. 2015),
and persistence in food-webs (Stouffer andBascompte 2010).In addition to the random matrix approaches
of null and ER models, there are other, more
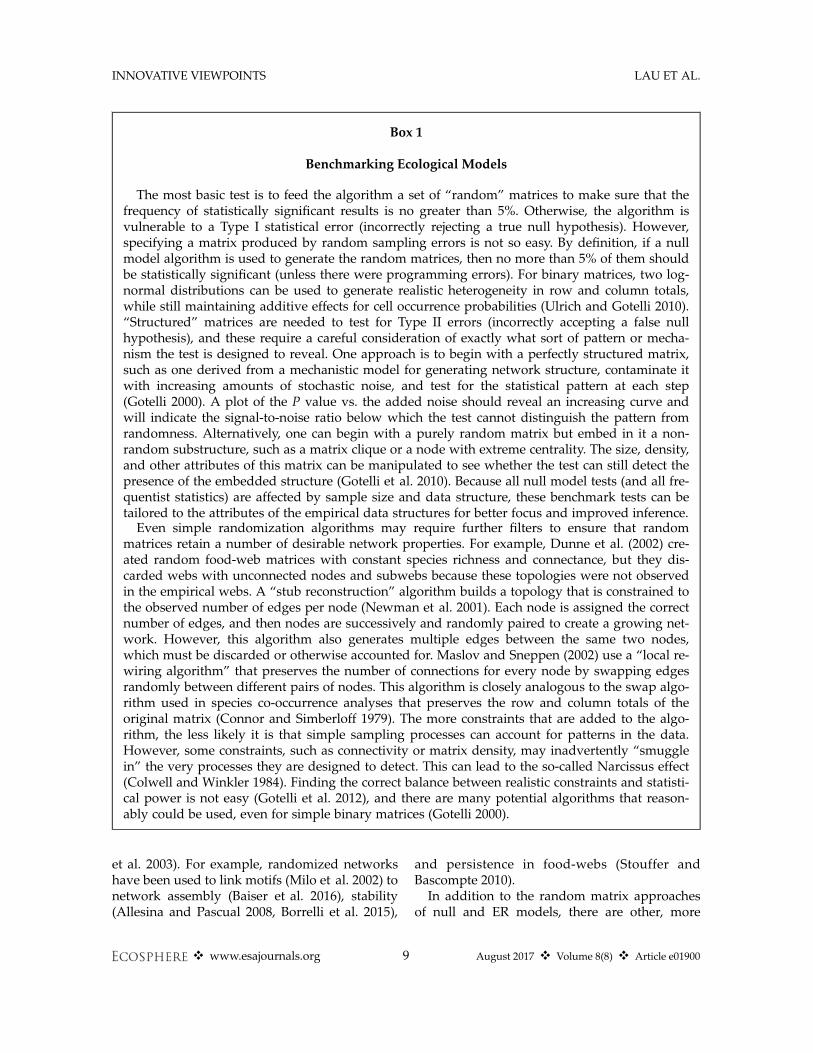
Box 1
Benchmarking Ecological Models
The most basic test is to feed the algorithm a set of “random” matrices to make sure that thefrequency of statistically significant results is no greater than 5%. Otherwise, the algorithm isvulnerable to a Type I statistical error (incorrectly rejecting a true null hypothesis). However,specifying a matrix produced by random sampling errors is not so easy. By definition, if a nullmodel algorithm is used to generate the random matrices, then no more than 5% of them shouldbe statistically significant (unless there were programming errors). For binary matrices, two log-normal distributions can be used to generate realistic heterogeneity in row and column totals,while still maintaining additive effects for cell occurrence probabilities (Ulrich and Gotelli 2010).“Structured” matrices are needed to test for Type II errors (incorrectly accepting a false nullhypothesis), and these require a careful consideration of exactly what sort of pattern or mecha-nism the test is designed to reveal. One approach is to begin with a perfectly structured matrix,such as one derived from a mechanistic model for generating network structure, contaminate itwith increasing amounts of stochastic noise, and test for the statistical pattern at each step(Gotelli 2000). A plot of the P value vs. the added noise should reveal an increasing curve andwill indicate the signal-to-noise ratio below which the test cannot distinguish the pattern fromrandomness. Alternatively, one can begin with a purely random matrix but embed in it a non-random substructure, such as a matrix clique or a node with extreme centrality. The size, density,and other attributes of this matrix can be manipulated to see whether the test can still detect thepresence of the embedded structure (Gotelli et al. 2010). Because all null model tests (and all fre-quentist statistics) are affected by sample size and data structure, these benchmark tests can betailored to the attributes of the empirical data structures for better focus and improved inference.
Even simple randomization algorithms may require further filters to ensure that randommatrices retain a number of desirable network properties. For example, Dunne et al. (2002) cre-ated random food-web matrices with constant species richness and connectance, but they dis-carded webs with unconnected nodes and subwebs because these topologies were not observedin the empirical webs. A “stub reconstruction” algorithm builds a topology that is constrained tothe observed number of edges per node (Newman et al. 2001). Each node is assigned the correctnumber of edges, and then nodes are successively and randomly paired to create a growing net-work. However, this algorithm also generates multiple edges between the same two nodes,which must be discarded or otherwise accounted for. Maslov and Sneppen (2002) use a “local re-wiring algorithm” that preserves the number of connections for every node by swapping edgesrandomly between different pairs of nodes. This algorithm is closely analogous to the swap algo-rithm used in species co-occurrence analyses that preserves the row and column totals of theoriginal matrix (Connor and Simberloff 1979). The more constraints that are added to the algo-rithm, the less likely it is that simple sampling processes can account for patterns in the data.However, some constraints, such as connectivity or matrix density, may inadvertently “smugglein” the very processes they are designed to detect. This can lead to the so-called Narcissus effect(Colwell and Winkler 1984). Finding the correct balance between realistic constraints and statisti-cal power is not easy (Gotelli et al. 2012), and there are many potential algorithms that reason-ably could be used, even for simple binary matrices (Gotelli 2000).
❖ www.esajournals.org 9 August 2017 ❖ Volume 8(8) ❖ Article e01900
INNOVATIVE VIEWPOINTS LAU ET AL.
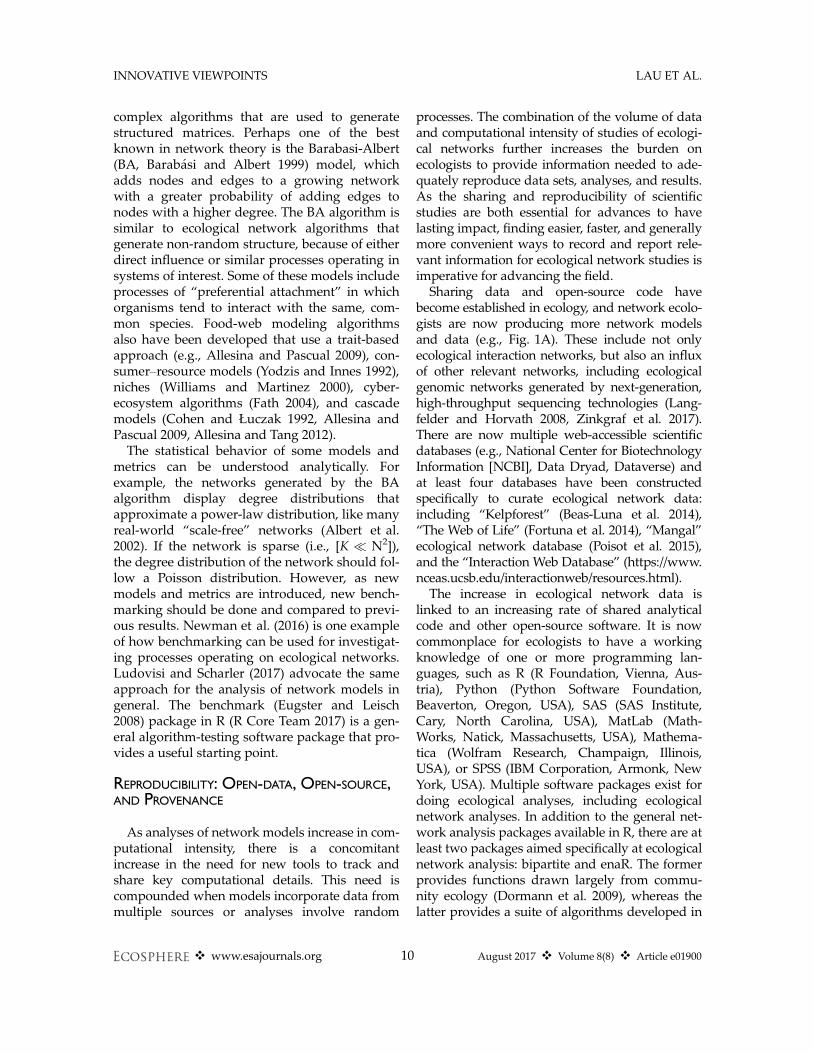
complex algorithms that are used to generatestructured matrices. Perhaps one of the bestknown in network theory is the Barabasi-Albert(BA, Barab�asi and Albert 1999) model, whichadds nodes and edges to a growing networkwith a greater probability of adding edges tonodes with a higher degree. The BA algorithm issimilar to ecological network algorithms thatgenerate non-random structure, because of eitherdirect influence or similar processes operating insystems of interest. Some of these models includeprocesses of “preferential attachment” in whichorganisms tend to interact with the same, com-mon species. Food-web modeling algorithmsalso have been developed that use a trait-basedapproach (e.g., Allesina and Pascual 2009), con-sumer–resource models (Yodzis and Innes 1992),niches (Williams and Martinez 2000), cyber-ecosystem algorithms (Fath 2004), and cascademodels (Cohen and Łuczak 1992, Allesina andPascual 2009, Allesina and Tang 2012).
The statistical behavior of some models andmetrics can be understood analytically. Forexample, the networks generated by the BAalgorithm display degree distributions thatapproximate a power-law distribution, like manyreal-world “scale-free” networks (Albert et al.2002). If the network is sparse (i.e., [K � N2]),the degree distribution of the network should fol-low a Poisson distribution. However, as newmodels and metrics are introduced, new bench-marking should be done and compared to previ-ous results. Newman et al. (2016) is one exampleof how benchmarking can be used for investigat-ing processes operating on ecological networks.Ludovisi and Scharler (2017) advocate the sameapproach for the analysis of network models ingeneral. The benchmark (Eugster and Leisch2008) package in R (R Core Team 2017) is a gen-eral algorithm-testing software package that pro-vides a useful starting point.
REPRODUCIBILITY: OPEN-DATA, OPEN-SOURCE,AND PROVENANCE
As analyses of network models increase in com-putational intensity, there is a concomitantincrease in the need for new tools to track andshare key computational details. This need iscompounded when models incorporate data frommultiple sources or analyses involve random
processes. The combination of the volume of dataand computational intensity of studies of ecologi-cal networks further increases the burden onecologists to provide information needed to ade-quately reproduce data sets, analyses, and results.As the sharing and reproducibility of scientificstudies are both essential for advances to havelasting impact, finding easier, faster, and generallymore convenient ways to record and report rele-vant information for ecological network studies isimperative for advancing the field.Sharing data and open-source code have
become established in ecology, and network ecolo-gists are now producing more network modelsand data (e.g., Fig. 1A). These include not onlyecological interaction networks, but also an influxof other relevant networks, including ecologicalgenomic networks generated by next-generation,high-throughput sequencing technologies (Lang-felder and Horvath 2008, Zinkgraf et al. 2017).There are now multiple web-accessible scientificdatabases (e.g., National Center for BiotechnologyInformation [NCBI], Data Dryad, Dataverse) andat least four databases have been constructedspecifically to curate ecological network data:including “Kelpforest” (Beas-Luna et al. 2014),“The Web of Life” (Fortuna et al. 2014), “Mangal”ecological network database (Poisot et al. 2015),and the “Interaction Web Database” (https://www.nceas.ucsb.edu/interactionweb/resources.html).The increase in ecological network data is
linked to an increasing rate of shared analyticalcode and other open-source software. It is nowcommonplace for ecologists to have a workingknowledge of one or more programming lan-guages, such as R (R Foundation, Vienna, Aus-tria), Python (Python Software Foundation,Beaverton, Oregon, USA), SAS (SAS Institute,Cary, North Carolina, USA), MatLab (Math-Works, Natick, Massachusetts, USA), Mathema-tica (Wolfram Research, Champaign, Illinois,USA), or SPSS (IBM Corporation, Armonk, NewYork, USA). Multiple software packages exist fordoing ecological analyses, including ecologicalnetwork analyses. In addition to the general net-work analysis packages available in R, there are atleast two packages aimed specifically at ecologicalnetwork analysis: bipartite and enaR. The formerprovides functions drawn largely from commu-nity ecology (Dormann et al. 2009), whereas thelatter provides a suite of algorithms developed in
❖ www.esajournals.org 10 August 2017 ❖ Volume 8(8) ❖ Article e01900
INNOVATIVE VIEWPOINTS LAU ET AL.
the ecosystem network analysis literature (Borrettand Lau 2014, Lau et al. 2015).
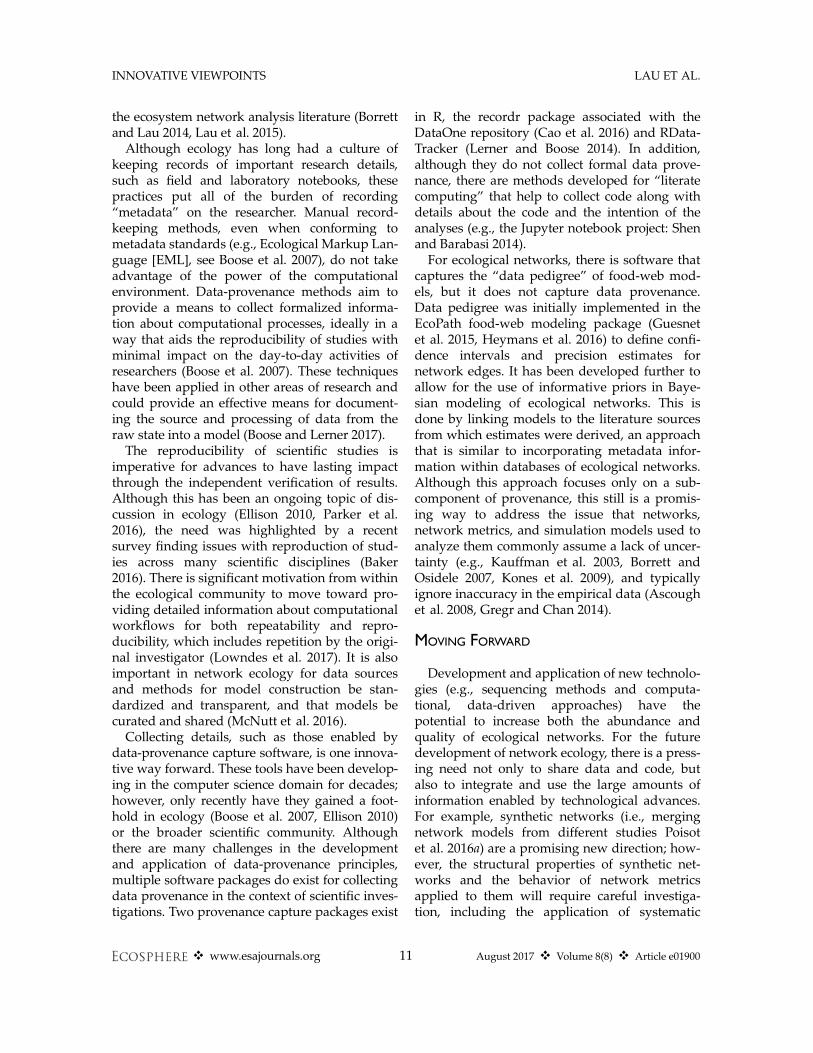
Although ecology has long had a culture ofkeeping records of important research details,such as field and laboratory notebooks, thesepractices put all of the burden of recording“metadata” on the researcher. Manual record-keeping methods, even when conforming tometadata standards (e.g., Ecological Markup Lan-guage [EML], see Boose et al. 2007), do not takeadvantage of the power of the computationalenvironment. Data-provenance methods aim toprovide a means to collect formalized informa-tion about computational processes, ideally in away that aids the reproducibility of studies withminimal impact on the day-to-day activities ofresearchers (Boose et al. 2007). These techniqueshave been applied in other areas of research andcould provide an effective means for document-ing the source and processing of data from theraw state into a model (Boose and Lerner 2017).
The reproducibility of scientific studies isimperative for advances to have lasting impactthrough the independent verification of results.Although this has been an ongoing topic of dis-cussion in ecology (Ellison 2010, Parker et al.2016), the need was highlighted by a recentsurvey finding issues with reproduction of stud-ies across many scientific disciplines (Baker2016). There is significant motivation from withinthe ecological community to move toward pro-viding detailed information about computationalworkflows for both repeatability and repro-ducibility, which includes repetition by the origi-nal investigator (Lowndes et al. 2017). It is alsoimportant in network ecology for data sourcesand methods for model construction be stan-dardized and transparent, and that models becurated and shared (McNutt et al. 2016).
Collecting details, such as those enabled bydata-provenance capture software, is one innova-tive way forward. These tools have been develop-ing in the computer science domain for decades;however, only recently have they gained a foot-hold in ecology (Boose et al. 2007, Ellison 2010)or the broader scientific community. Althoughthere are many challenges in the developmentand application of data-provenance principles,multiple software packages do exist for collectingdata provenance in the context of scientific inves-tigations. Two provenance capture packages exist
in R, the recordr package associated with theDataOne repository (Cao et al. 2016) and RData-Tracker (Lerner and Boose 2014). In addition,although they do not collect formal data prove-nance, there are methods developed for “literatecomputing” that help to collect code along withdetails about the code and the intention of theanalyses (e.g., the Jupyter notebook project: Shenand Barabasi 2014).For ecological networks, there is software that
captures the “data pedigree” of food-web mod-els, but it does not capture data provenance.Data pedigree was initially implemented in theEcoPath food-web modeling package (Guesnetet al. 2015, Heymans et al. 2016) to define confi-dence intervals and precision estimates fornetwork edges. It has been developed further toallow for the use of informative priors in Baye-sian modeling of ecological networks. This isdone by linking models to the literature sourcesfrom which estimates were derived, an approachthat is similar to incorporating metadata infor-mation within databases of ecological networks.Although this approach focuses only on a sub-component of provenance, this still is a promis-ing way to address the issue that networks,network metrics, and simulation models used toanalyze them commonly assume a lack of uncer-tainty (e.g., Kauffman et al. 2003, Borrett andOsidele 2007, Kones et al. 2009), and typicallyignore inaccuracy in the empirical data (Ascoughet al. 2008, Gregr and Chan 2014).
MOVING FORWARD
Development and application of new technolo-gies (e.g., sequencing methods and computa-tional, data-driven approaches) have thepotential to increase both the abundance andquality of ecological networks. For the futuredevelopment of network ecology, there is a press-ing need not only to share data and code, butalso to integrate and use the large amounts ofinformation enabled by technological advances.For example, synthetic networks (i.e., mergingnetwork models from different studies Poisotet al. 2016a) are a promising new direction; how-ever, the structural properties of synthetic net-works and the behavior of network metricsapplied to them will require careful investiga-tion, including the application of systematic
❖ www.esajournals.org 11 August 2017 ❖ Volume 8(8) ❖ Article e01900
INNOVATIVE VIEWPOINTS LAU ET AL.
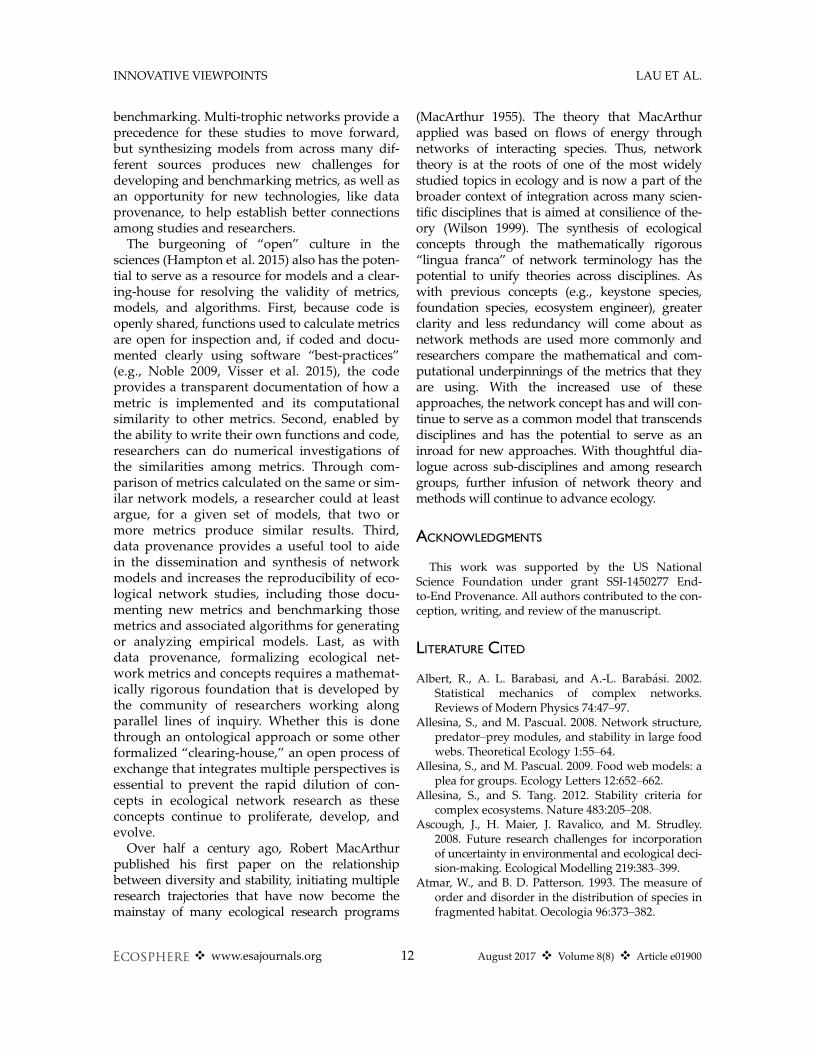
benchmarking. Multi-trophic networks provide aprecedence for these studies to move forward,but synthesizing models from across many dif-ferent sources produces new challenges fordeveloping and benchmarking metrics, as well asan opportunity for new technologies, like dataprovenance, to help establish better connectionsamong studies and researchers.
The burgeoning of “open” culture in thesciences (Hampton et al. 2015) also has the poten-tial to serve as a resource for models and a clear-ing-house for resolving the validity of metrics,models, and algorithms. First, because code isopenly shared, functions used to calculate metricsare open for inspection and, if coded and docu-mented clearly using software “best-practices”(e.g., Noble 2009, Visser et al. 2015), the codeprovides a transparent documentation of how ametric is implemented and its computationalsimilarity to other metrics. Second, enabled bythe ability to write their own functions and code,researchers can do numerical investigations ofthe similarities among metrics. Through com-parison of metrics calculated on the same or sim-ilar network models, a researcher could at leastargue, for a given set of models, that two ormore metrics produce similar results. Third,data provenance provides a useful tool to aidein the dissemination and synthesis of networkmodels and increases the reproducibility of eco-logical network studies, including those docu-menting new metrics and benchmarking thosemetrics and associated algorithms for generatingor analyzing empirical models. Last, as withdata provenance, formalizing ecological net-work metrics and concepts requires a mathemat-ically rigorous foundation that is developed bythe community of researchers working alongparallel lines of inquiry. Whether this is donethrough an ontological approach or some otherformalized “clearing-house,” an open process ofexchange that integrates multiple perspectives isessential to prevent the rapid dilution of con-cepts in ecological network research as theseconcepts continue to proliferate, develop, andevolve.
Over half a century ago, Robert MacArthurpublished his first paper on the relationshipbetween diversity and stability, initiating multipleresearch trajectories that have now become themainstay of many ecological research programs
(MacArthur 1955). The theory that MacArthurapplied was based on flows of energy throughnetworks of interacting species. Thus, networktheory is at the roots of one of the most widelystudied topics in ecology and is now a part of thebroader context of integration across many scien-tific disciplines that is aimed at consilience of the-ory (Wilson 1999). The synthesis of ecologicalconcepts through the mathematically rigorous“lingua franca” of network terminology has thepotential to unify theories across disciplines. Aswith previous concepts (e.g., keystone species,foundation species, ecosystem engineer), greaterclarity and less redundancy will come about asnetwork methods are used more commonly andresearchers compare the mathematical and com-putational underpinnings of the metrics that theyare using. With the increased use of theseapproaches, the network concept has and will con-tinue to serve as a common model that transcendsdisciplines and has the potential to serve as aninroad for new approaches. With thoughtful dia-logue across sub-disciplines and among researchgroups, further infusion of network theory andmethods will continue to advance ecology.
ACKNOWLEDGMENTS
This work was supported by the US NationalScience Foundation under grant SSI-1450277 End-to-End Provenance. All authors contributed to the con-ception, writing, and review of the manuscript.
LITERATURE CITED
Albert, R., A. L. Barabasi, and A.-L. Barab�asi. 2002.Statistical mechanics of complex networks.Reviews of Modern Physics 74:47–97.
Allesina, S., and M. Pascual. 2008. Network structure,predator–prey modules, and stability in large foodwebs. Theoretical Ecology 1:55–64.
Allesina, S., and M. Pascual. 2009. Food web models: aplea for groups. Ecology Letters 12:652–662.
Allesina, S., and S. Tang. 2012. Stability criteria forcomplex ecosystems. Nature 483:205–208.
Ascough, J., H. Maier, J. Ravalico, and M. Strudley.2008. Future research challenges for incorporationof uncertainty in environmental and ecological deci-sion-making. Ecological Modelling 219:383–399.
Atmar, W., and B. D. Patterson. 1993. The measure oforder and disorder in the distribution of species infragmented habitat. Oecologia 96:373–382.
❖ www.esajournals.org 12 August 2017 ❖ Volume 8(8) ❖ Article e01900
INNOVATIVE VIEWPOINTS LAU ET AL.
Baird, D., and R. E. Ulanowicz. 1989. The seasonaldynamics of the Chesapeake Bay ecosystem. Eco-logical Monographs 59:329–364.
Baiser, B., R. Elhesha, and T. Kahveci. 2016. Motifs inthe assembly of food web networks. Oikos 125:480–491.
Baiser, B., J. L. Lockwood, D. La Puma, and M. F. J.Aronson. 2008. A perfect storm: Two ecosystemengineers interact to degrade deciduous forests ofNew Jersey. Biological Invasions 10:785–795.
Baker, M. 2016. 1,500 scientists lift the lid on repro-ducibility. Nature 533:452–454.
Barab�asi, A.-L., and R. Albert. 1999. Emergence of scal-ing in random networks. Science 286:509–512.
Barab�asi, A.-L., R. Albert, and H. Jeong. 2000. Scale-free characteristics of random networks: the topol-ogy of the world-wide web. Physica A: StatisticalMechanics and its Applications 281:69–77.
Bard, J. B. L., and S. Y. Rhee. 2004. Ontologies in biol-ogy: design, applications and future challenges.Nature Reviews Genetics 5:213–222.
Bascompte, J. 2010. Structure and dynamics of ecologi-cal networks. Science 329:765–766.
Bascompte, J., and P. Jordano. 2007. Plant-animalmutualistic networks: the architecture of biodiver-sity. Annual Review of Ecology, Evolution, andSystematics 38:567–593.
Bascompte, J., and P. Jordano. 2014. Mutualisticnetworks. Princeton University Press, Princteon,New Jersey, USA.
Beas-Luna, R., M. Novak, M. H. Carr, M. T. Tinker,A. Black, J. E. Caselle, M. Hoban, D. Malone, andA. Iles. 2014. An online database for informingecological network models: http://kelpforest.ucsc.edu. PLoS One 9:e109356.
Bl€uthgen, N. 2010. Why network analysis is often dis-connected from community ecology: a critique andan ecologist’s guide. Basic and Applied Ecology11:185–195.
Bl€uthgen, N., J. Fr€und, D. P. V�azquez, and F. Menzel.2008. What do interaction network metrics tell usabout specialization and biological traits? Ecology89:3387–3399.
Bonacich, P. 1987. Power and centrality: a family ofmeasures. American Journal of Sociology 92:1170.
Boose, E. R., A. M. Ellison, L. J. Osterweil, L. A. Clarke,R. Podorozhny, J. L. Hadley, A. Wise, and D. R.Foster. 2007. Ensuring reliable datasets for environ-mental models and forecasts. Ecological Informat-ics 2:237–247.
Boose, E. R., and B. S. Lerner. 2017. Replication of dataanalyses: provenance in R. Pages 195–212 inA. Shavitand A. M. Ellison, editors. Stepping in the same rivertwice: replication in biological research. Yale Univer-sity Press, New Haven, Connecticut, USA.
Borgatti, S. P., and M. G. Everett. 2006. A graph-theore-tic perspective on centrality. Social Networks28:466–484.
Borrelli, J. J., et al. 2015. Selection on stability acrossecological scales. Trends in Ecology and Evolution30:417–425.
Borrett, S. R. 2013. Throughflow centrality is aglobal indicator of the functional importance ofspecies in ecosystems. Ecological Indicators 32:182–196.
Borrett, S. R., W. Bridewell, P. Langely, and K. R. Arrigo.2006. A method for representing and developingprocess models. Ecological Complexity 4:28.
Borrett, S. R., R. R. Christian, and R. E. Ulanowicz.2012. Network ecology (revised). Pages 1767–1772in A. El-Shaarawi and W. Piegorsch, editors. Ency-clopedia of environmetrics. Second edition. JohnWiley and Sons, Chichester, UK.
Borrett, S. R., B. D. Fath, and B. C. Patten. 2007. Func-tional integration of ecological networks throughpathway proliferation. Journal of Theoretical Biol-ogy 245:98–111.
Borrett, S. R., and M. K. Lau. 2014. enaR: an R packagefor ecosystem network analysis. Methods in Ecol-ogy and Evolution 11:1206–1213.
Borrett, S. R., J. Moody, and A. Edelmann. 2014. Therise of network ecology: maps of the topic diversityand scientific collaboration. Ecological Modelling293:111–127.
Borrett, S. R., and O. O. Osidele. 2007. Environ indica-tor sensitivity to flux uncertainty in a phosphorusmodel of Lake Sidney Lanier, USA. EcologicalModelling 200:371–383.
Borrvall, C., B. Ebenman, and T. Jonsson. 2000. Biodi-versity lessens the risk of cascading extinction inmodel food webs. Ecology Letters 3:131–136.
Brandes, U., and T. Erlebach. 2005. Network analysis:methodological foundations. Springer Publishing,New York, New York, USA.
Brandes, U., G. Robins, A. McCranie, and S. Wasser-man. 2013. What is network science? NetworkScience 1:1–15.
Calabrese, J. M., and W. F. Fagan. 2004. A comparison-shopper’s guide to connectivity metrics. Frontiersin Ecology and the Environment 2:529–536.
Cao, Y., et al. 2016. DataONE: a data federation withprovenance support. Pages 230–234. SpringerPublishing, New York, New York, USA.
Carmel, Y., R. Kent, A. Bar-Massada, L. Blank,J. Liberzon, O. Nezer, G. Sapir, and R. Federman.2013. Trends in ecological research during the lastthree decades–a systematic review. PLoS One 8:e59813.
Cherrett, J. M. 1989. Key concepts: the results of a sur-vey of our members’ opinions. Pages 1–16 in J. M.
❖ www.esajournals.org 13 August 2017 ❖ Volume 8(8) ❖ Article e01900
INNOVATIVE VIEWPOINTS LAU ET AL.
Cherrett, A. D. Bradshaw, F. B. Goldsmith, P. G.Grubb, and J. R. Krebs, editors. Ecological con-cepts: the contribution of ecology to an under-standing of the natural world. Blackwell ScientificPublications, Oxford, UK.
Cohen, J. E., and T. Łuczak. 1992. Trophic levelsin community food webs. Evolutionary Ecology 6:73–89.
Colwell, R. K., and D. W. Winkler. 1984. A null modelfor null models in biogeography. Princeton Univer-sity Press, Princeton, New Jersey, USA.
Connor, E. F., and D. Simberloff. 1979. The assembly ofspecies communities: Chance or competition? Ecol-ogy 60:1132.
Council, N. R. 2003. Neon. National Academies Press,Washington, D.C., USA.
Creamer, R., et al. 2016. Ecological network analysisreveals the inter-connection between soil biodiver-sity and ecosystem function as affected by land useacross Europe. Applied Soil Ecology 97:112–124.
Croft, D. P., J. Krause, and R. James. 2004. Social net-works in the guppy Poecilia reticulata. Proceedingsof the Royal Society of London B: BiologicalSciences 271:S516–S519.
Dame, R. F., and B. C. Patten. 1981. Analysis of energyflows in an intertidal oyster reef. Marine EcologyProgress Series 5:115–124.
Dayton, P. K. 1972. Toward an understanding ofcommunity resilience and the potential effects ofenrichment to the benthos at McMurdo Sound,Antarctica. Proceedings of the Colloquium onConservation Problems in Antarctica. Pages 81–96.
Dormann, C. F., C. F. Dormann, J. Fr€und, N. Bl€uthgen,and B. Gruber. 2009. Indices, graphs and nullmodels: analyzing bipartite ecological networks.Open Ecology Journal 2:7–24.
Dubois, M., V. Rossi, E. Ser-Giacomi, S. Arnaud-Haond, C. L�opez, and E. Hern�andez-Garc�ıa. 2016.Linking basin-scale connectivity, oceanographyand population dynamics for the conservation andmanagement of marine ecosystems. Global Ecol-ogy and Biogeography 25:503–515.
Dunne, J. A., R. J. Williams, and N. D. Martinez. 2002.Network structure and biodiversity loss in foodwebs: Robustness increases with connectance. Ecol-ogy Letters 5:558–567.
Ekl€of, A., and B. Ebenman. 2006. Species loss andsecondary extinctions in simple and complex modelcommunities. Journal of Animal Ecology 75:239–246.
Ekl€of, A., M. R. Helmus, M. Moore, and S. Allesina.2012. Relevance of evolutionary history for foodweb structure. Proceedings of the Royal Society ofLondon B: Biological Sciences 279:1588–1596.
Ellison, A. M. 2010. Repeatability and transparency inecological research. Ecology 91:2536–2539.
Ellison, A. M., et al. 2005. Loss of foundation species:consequences for the structure and dynamics offorested ecosystems. Frontiers in Ecology and theEnvironment 3:479–486.
Erd€os, P., and A. R�enyi. 1959. On random graphs.Publicationes Mathematicae 6:290–297.
Estrada, E. 2015. Introduction to complex networks:structure and dynamics. Pages 93–131. SpringerPublishing, New York, New York, USA.
Eugster, M. J. A., and F. Leisch. 2008. Bench plot andmixed effects models: first steps toward a compre-hensive benchmark analysis toolbox. Pages299–306 in P. Brito, editor. Compstat 2008—Proceedings in Computational Statistics. PhysicaVerlag, Heidelberg, Germany.
Fang, D., B. D. Fath, B. Chen, and U. M. Scharler. 2014.Network environ analysis for socio-economicwater system. Ecological Indicators 47:80–88.
Fath, B. D. 2004. Network analysis applied to large-scalecyber-ecosystems. Ecological Modelling 171:329–337.
Fath, B. D., U. M. Scharler, R. E. Ulanowicz, and B. Han-non. 2007. Ecological network analysis: networkconstruction. Ecological Modelling 208:49–55.
Finn, J. T. 1976. Measures of ecosystem structure andfunction derived from analysis of flows. Journal ofTheoretical Biology 56:363–380.
Finn, J. T. 1980. Flow analysis of models of the Hub-bard Brook ecosystem. Ecology 61:562–571.
Fletcher, R. J., A. Revell, B. E. Reichert, W. M. Kitchens,J. D. Dixon, and J. D. Austin. 2013. Networkmodularity reveals critical scales for connectivity inecology and evolution. Nature Communications 4:2572–2576.
Fortuna, M. A., R. Ortega, and J. Bascompte. 2014. Theweb of life. www.web-oflife.es
Freeman, L. C. 1979. Centrality in networks. I. Concep-tual clarification. Social Networks 1:215–239.
Golley, F. 1993. A history of the ecosystem concept inecology: more than the sum of the parts. YaleUniversity Press, New Haven, Connecticut, USA.
Golubski, A. J., E. E. Westlund, J. Vandermeer, and M.Pascual. 2016. Ecological networks over the edge:hypergraph trait-mediated indirect interaction(TMII) structure. Trends in Ecology and Evolution31:344–354.
Gotelli, N. J. 2000. Null model analysis of speciesco-occurrence patterns. Ecology 81:2606–2621.
Gotelli, N. J., R. M. Dorazio, A. M. Ellison, and G. D.Grossman. 2010. Detecting temporal trends inspecies assemblages with bootstrapping proce-dures and hierarchical models. PhilosophicalTransactions of the Royal Society of London SeriesB: Biological Sciences 365:3621–3631.
Gotelli, N. J., A. M. Ellison, and B. A. Ballif. 2012. Envi-ronmental proteomics, biodiversity statistics and
❖ www.esajournals.org 14 August 2017 ❖ Volume 8(8) ❖ Article e01900
INNOVATIVE VIEWPOINTS LAU ET AL.
food-web structure. Trends in Ecology and Evolu-tion 27:436–442.
Gotelli, N. J., and G. R. Graves. 1996. Null models inecology. Ecology 14:368.
Gotelli, N. J., and W. Ulrich. 2012. Statistical challengesin null model analysis. Oikos 121:171–180.
Graham, M. H., and P. K. Dayton. 2002. On the evolu-tion of ecological ideas: paradigms and scientificprogress. Ecology 83:1481–1489.
Gregr, E. J., and K. M. A. Chan. 2014. Leaps of faith:How implicit assumptions compromise the utilityof ecosystem models for decision-making. Bio-Science 65:43–54.
Grilli, J., T. Rogers, and S. Allesina. 2016. Modularityand stability in ecological communities. NatureCommunications 7:12031–12041.
Guesnet, V., G. Lassalle, A. Chaalali, K. Kearney, B.Saint-B�eat, B. Karimi, B. Grami, S. Tecchio, N. Niquil,and J. Lobry. 2015. Incorporating food-web parame-ter uncertainty into Ecopath-derived ecological net-work indicators. Ecological Modelling 313:29–40.
Guimar~aes, P. R., G. Machado, M. A. M. de Aguiar,P. Jordano, J. Bascompte, A. Pinheiro, and S. F. DosReis. 2007. Build-up mechanisms determining thetopology of mutualistic networks. Journal of Theo-retical Biology 249:181–189.
Hampton, S. E., S. Anderson, S. C. Bagby, and C. Gries.2015. The Tao of open science for ecology. Eco-sphere 6. https://doi.org/10.1890/ES14-00402.1
Heymans, J. J., M. Coll, J. S. Link, S. Mackinson,J. Steenbeek, C. Walters, and V. Christensen. 2016.Best practice in Ecopath with Ecosim food-webmodels for ecosystem-based management. Ecologi-cal Modelling 331:173–184.
Hines, D. E., and S. R. Borrett. 2014. A comparison ofnetwork, neighborhood, and node levels of analysesin two models of nitrogen cycling in the Cape FearRiver Estuary. Ecological Modelling 293:210–220.
Hodges, K. E. 2008. Defining the problem: terminologyand progress in ecology. Frontiers in Ecology andthe Environment 6:35–42.
Hollenberg, D. 2007. On the evolution and dynamicsof biological networks. Rivista di Biologia 100:93–118.
Holstein, D. M., C. B. Paris, and P. J. Mumby. 2014.Consistency and inconsistency in multispeciespopulation network dynamics of coral reef ecosys-tems. Marine Ecology Progress Series 499:1–18.
Holt, R. 1997. Community modules. Pages 333–349 inA. C. Gange and V. K. Brown, editors. Multitrophicinteractions in terrestrial ecosystems, 36th Sympo-sium of the British Ecological Society. BlackwellScience, Oxford, UK.
Holt, R. D., and M. F. Hoopes. 2005. Food web dynam-ics in a metacommunity context. Pages 68–93 in
M. Holyoak, M. A. Leibold, and R. D. Holt, editors.Metacommunities: spatial dynamics and ecologicalcommunities. University of Chicago Press, Chi-cago, Illinois, USA.
Ings, T. C., et al. 2009. Ecological networks–beyondfood webs. Journal of Animal Ecology 78:253–269.
Jacoby, D. M. P., and R. Freeman. 2016. Emerging net-work-based tools in movement ecology. Trends inEcology and Evolution 31:301–314.
Jones, C. G., J. H. Lawton, andM. Shachak. 1994. Organ-isms as ecosystem engineers. Oikos 69:373–386.
Jord�an, F., Z. Benedek, and J. Podani. 2007. Quantify-ing positional importance in food webs: a compar-ison of centrality indices. Ecological Modelling205:270–275.
Jørgensen, S. E., B. C. Patten, and M. Stra�skraba. 2000.Ecosystems emerging: 4. Growth. Ecological Mod-elling 126:249–284.
Kauffman, S., C. Peterson, B. R. Samuelsson, C. Troein,and P. W. Anderson. 2003. Random Boolean net-work models and the yeast transcriptional net-work. PNAS 100:14796–14799.
Kazanci, C., and Q. Ma. 2015. Chapter 3 system-widemeasures in ecological network analysis. Pages45–68 in Y.-S. Park, S. Lek, C. Baehr, and S. E.Jorgensen, editors. Advanced modelling tech-niques studying global changes in environmentalsciences. Volume 27. Elsevier, Amsterdam, TheNetherlands.
K�efi, S., et al. 2012. More than a meal. . . integratingnon-feeding interactions into food webs. EcologyLetters 15:291–300.
Kones, J. K., K. Soetaert, D. van Oevelen, and J. O.Owino. 2009. Are network indices robust indicatorsof food web functioning? A Monte Carlo approach.Ecological Modelling 220:370–382.
Krause, A. E., K. A. Frank, D. M. Mason, R. E. Ulanow-icz, and W. W. Taylor. 2003. Compartments revealedin food-web structure. Nature 426:282–285.
Langfelder, P., and S. Horvath. 2008. WGCNA: anR package for weighted correlation network analy-sis. BMC Bioinformatics 9:559.
Lau, M. K., S. R. Borrett, D. E. Hines, and P. Singh.2015. enaR: tools for ecological network analysis.R Package, version 2.6.
Layton, A., B. Bras, and M. Weissburg. 2016. Ecologicalprinciples and metrics for improving materialcycling structures in manufacturing networks.Journal of Manufacturing Science and Engineering138:101002.
L�ed�ee, E. J. I., M. R. Heupel, A. J. Tobin, A. Mapleston,and C. A. Simpfendorfer. 2016. Movement patternsof two carangid species in inshore habitats charac-terised using network analysis. Marine EcologyProgress Series 553:219–232.
❖ www.esajournals.org 15 August 2017 ❖ Volume 8(8) ❖ Article e01900
INNOVATIVE VIEWPOINTS LAU ET AL.
Legendre, P., L. Legendre, L. Legendre, and P. Legendre.2012. Numerical ecology. Elsevier, Amsterdam, TheNetherlands.
Lerner, B., and E. Boose. 2014. RDataTracker: collectingprovenance in an interactive scripting environ-ment. Pages 1–4 in 6th USENIX Workshop on theTheory and Practice of Provenance (TaPP 2014).USENIX Association, Cologne, Germany.
Lima, M. 2011. Visual complexity: mapping patterns ofinformation. Princeton Architectural Press, NewYork, New York, USA.
Lindeman, R. L. 1942. The trophic-dynamic aspect ofecology. Ecology 23:399–418.
Lowndes, J. S. S., B. D. Best, C. Scarborough, J. C.Afflerbach, M. R. Frazier, C. C. O’Hara, N. Jiang,and B. S. Halpern. 2017. Our path to better sciencein less time using open data science tools. NatureEcology and Evolution 1:0160.
Lubchenco, J., et al. 1991. The sustainable biosphereinitiative: an ecological research agenda: a reportfrom the Ecological Society of America. RisserSource: Ecology 72:371–412.
Ludovisi, A., and U. M. Scharler. 2017. Towards asounder interpretation of entropybased indicatorsin ecological network analysis. Ecological Indica-tors 72:726–737.
MacArthur, R. 1955. Fluctuations of animal popula-tions and a measure of community stability. Ecol-ogy 36:533.
Manly, B. F. J. 2007. Randomization, bootstrap andMonte Carlo methods in biology. Chapman andHall, Boca Raton, Florida, USA.
Margalef, R. 1963. Certain unifying principles in ecol-ogy. American Naturalist 97:357–374.
Martinez, N. D. 1992. Constant connectance in com-munity food webs. The American Naturalist 139:1208–1218.
Maslov, S., and K. Sneppen. 2002. Specificity and sta-bility in topology of protein networks. Science 296:910–913.
May, R. M. 1972. Will a large complex system bestable? Nature 238:413–414.
May, R. M. 2001. Stability and complexity in modelecosystems. Princeton University Press, Princeton,New Jersey, USA.
May, R. M. 2006. Network structure and the biology ofpopulations. Trends in Ecology and Evolution 21:394–399.
McNutt, M., K. Lehnert, B. Hanson, B. A. Nosek, A. M.Ellison, and J. L. King. 2016. Liberating fieldscience samples and data. Science 351:1024–1026.
Milo, R., et al. 2002. Network motifs: simple buildingblocks of complex networks. Science 298:824–827.
Newman, M. E. J. 2003. The structure and function ofcomplex networks. SIAM Review 45:167–256.
Newman, M. E. J. 2006. Modularity and communitystructure in networks. PNAS 103:8577–8582.
Newman, M. 2010. Networks an introduction. OxfordUniversity Press, Oxford, England, UK.
Newman, M. E. J., S. H. Strogatz, and D. J. Watts. 2001.Random graphs with arbitrary degree distributionsand their applications. Physical Review E 64:026118.
Newman, M. E. J., et al. 2016. Structure and inferencein annotated networks. Nature Communications7:11863.
Noble, W. S. 2009. A quick guide to organizing compu-tational biology projects. PLoS Computational Biol-ogy 5:e1000424.
Odum, H. T. 1957. Trophic structure and productivityof Silver Springs, Florida. Ecological Monographs27:55–112.
Odum, H. T., and R. C. Pinkerton. 1955. Time’s speedregulator: the optimum efficiency for maximumpower output in physical and biological systems.American Scientist 43:331–343.
Paine, R. T. 1966. Food web complexity and speciesdiversity. American Naturalist 100:65.
Parker, T. H., S. Nakagawa, and J. Gurevitch. 2016.Promoting transparency in evolutionary biologyand ecology. Ecology Letters 19:726–728.
Patten, B. C. 1978. Systems approach to the concept ofenvironment. Ohio Journal of Science 78:206–222.
Patten, B. C., and G. T. Auble. 1981. System theoryof the ecological niche. American Naturalist 117:893–922.
Patten, B. C., and M. Witkamp. 1967. Systems analysisof 134cesium kinetics in terrestrial microcosms.Ecology 48:813–824.
Petanidou, T., A. S. Kallimanis, J. Tzanopoulos, S. P.Sgardelis, and J. D. Pantis. 2008. Long-termobservation of a pollination network: fluctuation inspecies and interactions, relative invariance ofnetwork structure and implications for estimates ofspecialization. Ecology Letters 11:564–575.
Pimm, S. L. 1982. Food webs. Chapman and Hall,London, UK; New York, New York, USA.
Poisot, T., B. Baiser, J. A. Dunne, S. K�efi, F. Massol,N. Mouquet, T. N. Romanuk, D. B. Stouffer, S. A.Wood, and D. Gravel. 2015. Mangal makingecological network analysis simple. Ecography 39:384–390.
Poisot, T., D. Gravel, S. Leroux, S. A. Wood, M.-J. For-tin, B. Baiser, A. R. Cirtwill, M. B. Ara�ujo, and D. B.Stouffer. 2016a. Synthetic datasets and communitytools for the rapid testing of ecological hypotheses.Ecography 39:402–408.
Poisot, T., D. B. Stouffer, and S. K�efi. 2016b. Describe,understand and predict: Why do we need networksin ecology? Functional Ecology 30:1878–1882.
❖ www.esajournals.org 16 August 2017 ❖ Volume 8(8) ❖ Article e01900
INNOVATIVE VIEWPOINTS LAU ET AL.
Post, D. M., M. L. Pace, and N. G. Hairston. 2000.Ecosystem size determines food-chain length inlakes. Nature 405:1047–1049.
Proulx, S. R., D. E. L. Promislow, and P. C. Phillips.2005. Network thinking in ecology and evolution.Trends in Ecology and Evolution 20:345–353.
QUINTESSENCE Consortium, et al. 2016. Networkingour way to better ecosystem service provision.Trends in Ecology and Evolution 31:105–115.
R Core Team. 2017. R: a language and environment forstatistical computing. R Foundation for StatisticalComputing, Vienna, Austria.
Samuelson, P. A. 1948. Economics: an introductoryanalysis. McGraw–Hill Book Co., New York, NewYork, USA.
Shen, H.-W., and A.-L. Barabasi. 2014. Collective creditallocation in science. PNAS 111:12325–12330.
Sih, A., S. F. Hanser, and K. A. McHugh. 2009. Socialnetwork theory: new insights and issues for behav-ioral ecologists. Behavioral Ecology and Sociobiol-ogy 63:975–988.
Simberloff, D., and B. V. Holle. 1999. Positive interac-tions of nonindigenous species: Invasional melt-down? Biological Invasions 1:21–32.
Sol�e, R. V., and J. M. Montoya. 2001. Complexity andfragility in ecological networks. Proceedings of theRoyal Society of London B: Biological Sciences268:2039–2045.
Stouffer, D. B., and J. Bascompte. 2010. Understandingfood-web persistence from local to global scales.Ecology Letters 13:154–161.
Strogatz, S. H. 2001. Exploring complex networks.Nature 410:268–276.
Stumpf, M. P. H., W. P. Kelly, T. Thorne, and C. Wiuf.2007. Evolution at the system level: the natural his-tory of protein interaction networks. Trends inEcology and Evolution 22:366–373.
Sutherland, W. J., et al. 2013. Identification of 100fundamental ecological questions. Journal of Ecol-ogy 101:58–67.
Tansley, A. G. 1935. The use and abuse of vegetationalconcepts and terms. Ecology 16:284–307.
Ulanowicz, R. E. 1986. Growth and development.Springer, New York, New York, USA.
Ulanowicz, R. E., R. D. Holt, and M. Barfield. 2014.Limits on ecosystem trophic complexity: insightsfrom ecological network analysis. Ecology Letters17:127–136.
Ulrich, W., and N. J. Gotelli. 2007. Null model analysis ofspecies nestedness patterns. Ecology 88:1824–1831.
Ulrich, W., and N. J. Gotelli. 2010. Null model analysisof species associations using abundance data. Ecol-ogy 91:3384–3397.
Urban, D., and T. Keitt. 2001. Landscape connectivity:a graph-theoretic perspective. Ecology 82:1205–1218.
Valente, T. W., K. Coronges, C. Lakon, and E. Costen-bader. 2008. How correlated are network centralitymeasures? Connections 28:16–26.
Vermaat, J. E., J. A. Dunne, and A. J. Gilbert. 2009.Major dimensions in food-web structure proper-ties. Ecology 90:278–282.
Visser, M. D., et al. 2015. Speeding up ecological andevolutionary computations in R; essentials of highperformance computing for biologists. PLoS Com-putational Biology 11:e1004140.
Wang, S., and B. Chen. 2016. Energy-water nexus ofurban agglomeration based on multiregionalinput-output tables and ecological network analy-sis: a case study of the Beijing-Tianjin-Hebei region.Applied Energy 178:773–783.
Wasserman, S., and K. Faust. 1994. Advances in socialnetwork analysis: research in the social and behav-ioral sciences. SAGE Publications, London, Eng-land, UK.
Williams, R. J., E. L. Berlow, J. A. Dunne, A.-L. Barab�asi,and N. D. Martinez. 2002. Two degrees of separa-tion in complex food webs. PNAS 99:12913–12916.
Williams, R. J., and N. D. Martinez. 2000. Simple rulesyield complex food webs. Nature 404:180–183.
Wilson, E. O. 1999. Consilience: the unity of knowl-edge. Vintage, New York, New York, USA.
Woodward, G. U. Y., et al. 2010. Ecological networksin a changing climate. Advances in EcologicalResearch 42:72–120.
Xia, L., B. D. Fath, U. M. Scharler, and Y. Zhang. 2016.Spatial variation in the ecological relationshipsamong the components of Beijing’s carbon meta-bolic system. Science of the Total Environment544:103–113.
Yang, J., and B. Chen. 2016. Energy–water nexus ofwind power generation systems. Applied Energy169:1–13.
Yodzis, P., and S. Innes. 1992. Body size and consumer-resource dynamics. American Naturalist 139:1151–1175.
Zhao, L., H. Zhang, E. J. O’Gorman, W. Tian, A. Ma,J. C. Moore, S. R. Borrett, and G. Woodward.2016. Weighting and indirect effects identifykeystone species in food webs. Ecology Letters 19:1032–1040.
Zinkgraf, M., L. Liu, A. Groover, and V. Filkov. 2017.Identifying gene coexpression networks underly-ing the dynamic regulation of wood-forming tis-sues in populus under diverse environmentalconditions. New Phytologist 214:1464–1478.
❖ www.esajournals.org 17 August 2017 ❖ Volume 8(8) ❖ Article e01900
INNOVATIVE VIEWPOINTS LAU ET AL.