Embed Size (px)
Citation preview

UCLAUCLA Electronic Theses and Dissertations
TitleEcological Speciation and Cryptic Diversity of Coral-Associated Nudibranchs
Permalinkhttps://escholarship.org/uc/item/3z1643wq
AuthorFritts-Penniman, Allison Louise
Publication Date2016-01-01 Peer reviewed|Thesis/dissertation
eScholarship.org Powered by the California Digital LibraryUniversity of California
UNIVERSITY OF CALIFORNIA
Los Angeles
Ecological Speciation and Cryptic Diversity of
Coral-Associated Nudibranchs
A dissertation submitted in partial satisfaction of the
requirements for the degree Doctor of Philosophy
in Biology
by
Allison Louise Fritts-Penniman
2016

© Copyright by
Allison Louise Fritts-Penniman
2016

ii
ABSTRACT OF THE DISSERTATION
Cryptic Diversity and Ecological Speciation of
Coral-Associated Nudibranchs
by
Allison Louise Fritts-Penniman
Doctor of Philosophy in Biology
University of California, Los Angeles, 2016
Professor Paul Henry Barber, Chair
Although it is commonly assumed that most speciation occurs in allopatry, a growing
body of research indicates that natural selection can lead to reproductive isolation and
speciation in sympatry. A common mechanism for sympatric speciation is ecological
speciation, where diversification is driven by differential selection across ecological niches.
New genetic and genomic techniques facilitate the discovery of cryptic ecological
divergence, and allow us to examine in detail the relative roles of natural selection and gene
flow in speciation, particularly in marine systems, where it is difficult to identify mechanisms
for allopatric speciation.
This dissertation combines broad exploratory field sampling with population genetic
and phylogenetic methods to tease apart the roles of geographic isolation and natural
selection in driving speciation in the Coral Triangle. Using the coral-associated nudibranch

iii
genus Phestilla as a model, in chapter 1 we examine the effect of coral host and geography
on population divergence in Phestilla lugubris and Phestilla minor. Phylogenetic analyses
and analyses of molecular variance of mitochondrial COI sequences indicate very little
population structure in Phestilla lugubris, but Phestilla minor has diverged across the Sunda
Shelf and across two major clades of coral host. In chapter 2 we use population genomics
to test whether natural selection plays a larger role in the divergence of sympatric host-
separated populations than allopatric populations of Phestilla minor. Population genetic
analyses of genome-wide single nucleotide polymorphisms show host-driven divergence is
stronger than that across the Sunda Shelf, despite having occurred more recently. Genomic
scans for selection reveal an important role for natural selection in both geographic and
host-associated divergence. Finally, in chapter 3 we broadened our approach to examine
the roles of geography and host in diversification of all scleractinian-associated
nudibranchs. A phylogenetic tree of COI, 16S, and H3 sequences from scleractinian-
associated nudibranchs collected across the Indo-Pacific Ocean reveals three times the
number of purported species than previously thought, with evidence for host shifting and
geographic divergence multiple times throughout evolutionary history. Combined, these
three studies demonstrate that both coral host and geography contribute to diversification
both within and between species of scleractinian coral-associated nudibranchs.

iv
The dissertation of Allison Louise Fritts-Penniman is approved.
Patrick Krug
Thomas Bates Smith
Paul Henry Barber, Committee Chair
University of California, Los Angeles
2016

v
TABLE OF CONTENTS
Epigraph …………………………………………………………………………………….. vi List of Tables ……………………………………………………………………………….. vii List of Figures ………………………………………………………………………............ ix Acknowledgements ………………………………………………………………….......... xii Vita/Biographical Sketch ………………………………………………………………...... xvi Introduction …………………………………………………………………………..........
1
References ……………………………………………………………………….... 7
Chapter 1. Cryptic ecological and geographic divergence of coral-associated nudibranchs in the Coral Triangle …………………………………………..........
12
Tables and Figures ………………………………………………………………… 33 References ………………………………………………………………………..... 43
Chapter 2. The relative roles of natural selection and limits to gene flow in genomic
divergence of coral-associated nudibranchs……………………………………..
50 Tables and Figures ………………………………………………………………… 74 References ………………………………………………………………………..… 87
Chapter 3. The roles of host and geography in promoting species diversity in coral-
associated nudibranchs …………………..........................................................
95 Tables and Figures ………………………………………………………………… 116 References ………………………………………………………………….………. 132

vi
EPIGRAPH
"In the end we will conserve only what we love, we will love only what we understand, and
we will understand only what we are taught."
-Baba Dioum
vii
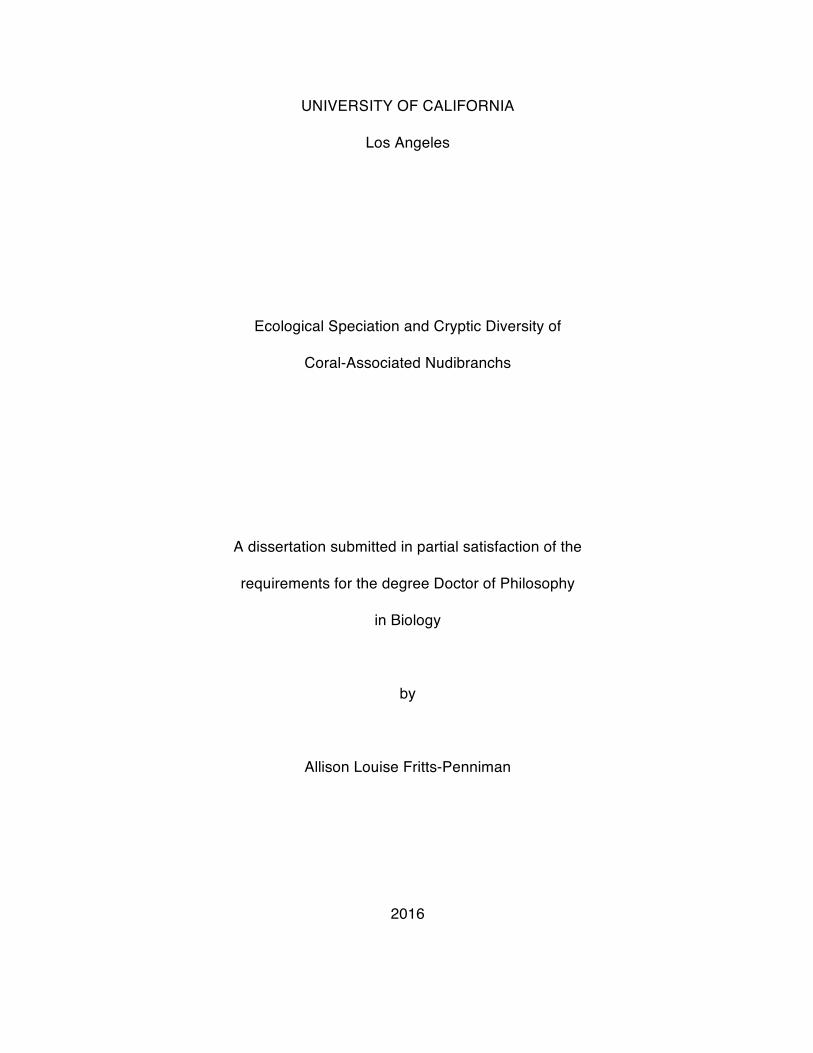
LIST OF TABLES
Table 1.1. List of populations and sample sizes used for phylogeographic analyses, with coral host as labeled in the field based on visual identification…………………………………………………………………..
33
Table 1.2. Phestilla minor divergence time estimates, based on molecular clock of 2.4% sequence divergence per million years (Hellberg and Vacquier 1999)…………………………………………………………………………..
33
Table 1.3. Summary statistics by locality for Phestilla lugubris and Phestilla minor. Haplotype diversity (h), nucleotide diversity (π), and θs caluculated in Arlequin. One P. minor sample from Komodo (Komo_06.03) was excluded because it belongs to the subspecies found in Aceh and Cubadak……………………………………………………………………….
34
Table 1.4. AMOVA results for Phestilla minor Pacific populations. Within localities, all samples collected from Porites cylindrica were treated as one population and all samples collected from other hosts are treated as another population. We first ran AMOVA with no a priori groups, then grouped populations east and west of the Maluku Sea, then grouped by coral host. Significant F statistics (p <0.05) shown in bold……………………………………………………………………………..
34
Table 1.5. Contingency table to test association between Phestilla minor clades and coral host clades. Fisher’s exact test p < 0.0001; Chi-square test, C2 = 78.65, p = 7.4 x 10⁻¹⁹…………………………………………………...
34
Table 1.6. Pairwise Fsts between populations on different corals at the same locality. Significant Fsts (p <0.05) shown in bold…………………………..
34
Table 1.7. AMOVA results testing no a priori structure, then the Sunda Shelf and the Maluku Sea as barriers to gene flow for Phestilla lugubris. No significant F statistics………………………………………………………...
35
Table 2.1. Samples collected and sequenced…………………………………………. 74 Table 2.2. Subsets of data independently filtered and analyzed for tests of natural
selection……………………………………………………………………….. 74
Table 2.3. ADMIXTURE CV errors for K=1 through K=7, 86 samples across all sampling sites…………………………………………………………………
75
Table 2.4. Weir and Cockerhams’s Fst calculated in SNPrelate, with and without outlier loci………………………………………………………………………
75
Table 2.5. Outlier test results for all sets of populations. We present the total number of outliers identified, the number of negative outliers (for BayeScan defined as outliers with a ≤ 0, for fhetboot defined as outliers with Fst ≤ 0), positive outliers (for BayeScan defined as outliers with a > 1, for fhetboot defined as outliers with Fst > 1), and the proportion of each relative to the total number of loci used in each test...........................................................................................................
76

viii
Table 2.6. Heat map showing overlap of outliers between population pairs having a coral host barrier, a geographic barrier, or both. Note that not all datasets are completely independent population pairs. Dataset 1 includes samples from all other datasets; dataset 2A includes samples from 3A, 4A, and 5A; dataset 2B includes samples from 3B, 4B, and 5B……………………………………………………………………………….
76
Table 3.1. Sample collections in Indonesia and Hawaii………………………………. 116 Table 3.2. Samples acquired from Los Angeles County Natural History Museum
(LACNHM) and GenBank……………………………………………………. 118
Table 3.3. Coral hosts and geographic range of 19 putative Phestilla species, based on this dataset alone. Number indicates the number of individuals from that Phestilla clade found on that coral………………….
119

ix
LIST OF FIGURES
Figure 1.1. Sampling localities…………………………………………………………. 36 Figure 1.2. Bayesian phylogenetic tree for 146 Phestilla minor COI sequences.
Node values show Bayesian posterior probability on top and maximum likelihood (ML) bootstrap proportion on bottom. Graphs show for each of the three clade the percent of samples collected from each host clade……………………………………………………….
36
Figure 1.3. Minimum spanning tree of 114 Phestilla minor COI haplotypes. Node size corresponds to haplotype frequency, ranging from 1 to 10, and line length corresponds to mutational steps between each haplotype. Colors correspond to clades in Figure 2…………………………………
37
Figure 1.4. Phestilla minor haplotype map. Pie charts show proportion of haplotypes from each of the three clades shown in Figures 2 and 3. Size of pie charts is proportional to samples size………………………
38
Figure 1.5. Minimum spanning tree of 114 Phestilla minor COI haplotypes. Node size corresponds to haplotype frequency, ranging from 1 to 10, and line length corresponds to mutational steps between each haplotype. Colors correspond to A) sampling location and B) coral host clade….
39
Figure 1.6. Maximum likelihood tree of 47 H2 sequences from Porites hosts of Phestilla minor and/or P. lugubris. Node values show Bayesian posterior probability on top and ML bootstrap proportion on bottom…
40
Figure 1.7. Bayesian phylogenetic tree of 66 Phestilla lugubris COI sequences. Node values show Bayesian posterior probability on top and ML bootstrap proportion on bottom…………………………………………...
41
Figure 1.8. Minimum spanning tree of 43 Phestilla lugubris COI haplotypes. Node size corresponds to haplotype frequency, ranging from 1 to 12, and line length corresponds to mutational steps between each haplotype. Colors correspond to sampling location…………………….
41
Figure S1.1.
ABGD results for 146 Phestilla minor COI sequences. Intraspecific genetic distances shown in orange, interspecific distances shown in yellow………………………………………………………………………...
42
Figure 2.1. Sampling localities (same as Figure 1.1)……………………………….. 77 Figure 2.2. ADMXITURE results, K = 3. A) samples organized by geographic
location, west to east, B) samples organized by location and coral host, C) samples organized by location and coral host, with outlier loci removed………………………………………………………………...
78
Figure 2.3. Phylogenetic tree generated by SNAPP using 3 samples per clade and aligned genotypes for A) all 4,966 SNPs and B) 4,090 non-outlier SNPs…………………………………………………………………
79
Figure 2.4. PCA of 86 individuals, color coded by ADMIXTURE cluster. A) 4,779 biallelic SNPs. B) 3,990 non-outlier SNPs……………………………….
80
Figure 2.5. PCA of 86 individuals, color coded by locality. A) 4,779 biallelic SNPs. B) 3,990 non-outlier SNPs………………………………………...
81

x
Figure 2.6. BayeScan results for full dataset subdivided into 11 populations by locality and host. Vertical line indicates q = 0.05; all loci to the left of that threshold are outliers. Outliers on the upper half of the distribution are under divergent selection; those on the bottom half are under purifying selection………………………………………………
82
Figure 2.7. Schematic diagram of population pairs for comparison of the effect of coral host and allopatry on genomic divergence………………………..
83
Figure 2.8. Results from fhetboot for A) all individuals east of the Sunda Shelf, with populations defined by host coral clade, B) all individuals on host clade 1, with populations defined by side of the Sunda Shelf, C) all individuals in Bali, with populations defined by host coral clade, and D) individuals on host clade 1 from Bali and Cubadak. Outliers were defined as those falling outside the 99% confidence interval, shown in yellow……………………………………………………………..
84
Figure 2.9. Results from fhetboot for A) all individuals in Donggala, with populations defined by host coral clade, B) individuals on host clade 1 from Donggala and Cubadak. C) all individuals in Raja Ampat, with populations defined by host coral clade, and D) individuals on host clade 1 from Raja Ampat and Cubadak. Outliers were defined as those falling outside the 99% confidence interval, shown in yellow…..
85
Figure 2.10. Distribution of Fsts as calculated by BayeScan. Each graph shows the results from two outlier tests: one where populations were defined by coral host clade (blue), one where populations were defined by side of the Sunda Shelf (red). A) Coral host populations east of the Sunda Shelf (blue) and allopatric populations on coral host 1 (red). B) Coral host populations in Bali (blue) and allopatric populations on coral host 1 in Bali and Cubadak (red). C) Coral host populations in Donggala (blue) and allopatric populations on coral host 1 in Donggala and Cubadak (red). D) Coral host populations in Raja Ampat (blue) and allopatric populations on coral host 1 in Raja Ampat and Cubadak (red)…………………………………………………
86
Figure 3.1. Cryptic coloration and texture of Phestilla species: A) Clade 1: Phestilla cf minor on Porites lobata B) Clade 8: Phestilla sp. collected from Montipora porites, C) Clade 16: Cuthona poritophages on Porites lobata, D) Clade 19: Pinufius rebus on Porites lobata, E) Clade 9: Phestilla sp. collected from Pavona explanulata, F) Clade 10 Phestilla sp. collected from Pavona decussata……………………..
120
Figure 3.2. SEM images of radulae from A) Clade 16: Cuthona poritophages collected from Porites lobata, B) Clade 8: Phestilla sp. collected from Montipora porites, C) Clade 12: Phestilla cf lugubris collected from Porites cylindrica, D) Clade 4: Phestilla cf. minor collected from Porites cylindrica, E) Clade 13: Phestilla melanobrachia collected from Tubastrea coccinea…………………………………………………..
120
Figure 3.3. Jukes-Cantor genetic distances calculated with Automatic Barcode Gap Discovery for A) 439 COI sequences, B) 179 concatenated COI+16S sequences, and C) 48 concatenated COI+16S+H3

xi
sequences. Presumed intraspecific divergence shown in orange, interspecific divergence in yellow…………………………………………
122
Figure 3.4. Bayesian tree of 88 COI sequences. Node labels show posterior probability. Clades color-coded by host species, or genus for those that occur on more than one species. Black bars indicate the two major clades: all Phestilla minor-like species in the top clade, and all other species in the bottom clade………………………………………...
123
Figure 3.5. Bayesian tree of 71 concatenated mitochondrial COI and 16S sequences. Node labels show posterior probability. Clades color-coded by host species, or genus for those that occur on more than one species…………………………………………………………………
124
Figure 3.6. Bayesian tree of 48 concatenated COI, 16S, and H3 sequences. Node labels show posterior probability. Clades color-coded by host species, or genus for those that occur on more than one species. Black bars highlight the different placement of Pinufius rebus and Cuthona poritophages relative to the mitochondrial gene trees………
125
Figure 3.7. Maximum likelihood tree of 48 concatenated COI, 16S, and H3 sequences. Node labels show bootstrap proportion. Clades color-coded by host species, or genus for those that occur on more than one species. Black bar highlights the placement of Cuthona poritophages inside the clade rather than as an outgroup, as it is in the Bayesian tree…………………………………………………………..
126
Figure 3.8. Bayesian tree of 41 concatenated COI, 16S, and H3 sequences, using only samples with all 3 genes sequenced, which excludes clades 7, 14, 15, and 18. Node labels show posterior probability on top and maximum likelihood on bottom. Clades color-coded by host species, or genus for those that occur on more than one species……
127
Figure 3.9. Bayesian tree of 41 COI sequences, using only samples with all 3 genes sequenced, which excludes clades 7, 14, 15, and 18. Node labels show posterior probability on top and maximum likelihood on bottom. Clades color-coded by host species, or genus for those that occur on more than one species………………………………………….
128
Figure 3.10. Bayesian tree of 41 concatenated mitochondrial COI and 16S sequences, using only samples with all 3 genes sequenced, which excludes clades 7, 14, 15, and 18. Node labels show posterior probability on top and maximum likelihood on bottom. Clades color-coded by host species, or genus for those that occur on more than one species…………………………………………………………………
129
Figure 3.11. Bayesian tree of 81 Porites H2 sequences. Node labels show posterior probability on top and maximum likelihood on bottom. Corals from Figure 1.6 highlighted……………………………………….
130
Figure S3.1.
Bayesian tree of 439 COI sequences. Node labels show posterior probability……………………………………………………………………
131

xii
ACKNOWLEDGEMENTS
I would like to extend a huge thank you to my mentor, Paul Barber, for providing this
incredible research opportunity and helping me turn a collection of thoughts and data into a
dissertation. When you took me into your lab I gained not only a mentor, but a permanent
advocate and support system. Your confidence in my ability to succeed never seemed to
waver, even when my own confidence was lost. You have never failed to provide support,
be it professional advice, grant money, intellectual discussion, or in times of extreme stress,
therapy. Thank you for teaching me to surf (sort of), the importance of unconventional
bottle-opening, and the dangers of riding on the back of a motor bike, which I definitely
never did. Most of all, thank you for teaching me through example that it is possible to value
happiness above all else while maintaining a career in science. It is easy to lose faith in that
fact during grad school, and having the right mentor makes all the difference.
To the Barber Lab: Sam Cheng, I’m so glad you stalked me on the internet. From
that day when we both chose beach beers over all other activities, I had a feeling that my
first new friend in grad school would turn out to be one of the best friends I have ever had.
We’ve now had beers on the beach in 3 different countries, which can only be the beginning
of a very long list. Sara Simmonds, you are an amazing friend and field buddy. The only
reason I have a dissertation is because of your encouragement and help. I might have quit
after the first day in the waves if you hadn’t insisted that I could do it, and over time showed
me how fun field work can be. Rita Rachmawati, you are one of the most kind and helpful
people I know. I probably wouldn’t have survived in Indonesia without you, and I know I can
always count on you. Abril Iñiguez, Ali Hamilton, and Hayley Nuetzel, thank you for helping
me face my fears underwater, and accompanying me on various misadventures in the field.

xiii
Amanda Russell, Paul Mendoza, and Sutra Anjani, thank you for all of your hard work in the
lab. I hope my mentorship served you well. Aji Wahyu and Dita Cahyani, thank you for
being the wizards of IBRC, making things happen against all odds. Zack Gold and Kelcie
Chiquillo, thank you for making my last two years in the lab a blast!
To all the graduate students that I’ve overlapped with in UCLA Ecology and
Evolutionary Biology (EEB), thank you for being the best community I could have asked for.
To “writing and cats take 2,” I have no idea how I would have survived this last year without
you. Thank you for providing the perfect combination of therapy, pro tips, cute videos, and
memes. Sarah Joy Bittick, thank you for the laughs, the dogs, the beers, and the late nights
(working and not) all over Los Angeles. It feels like we’ve gone through everything together,
but really we’re just starting out, and I can’t wait to navigate the rest of our academic
careers together. Mairin Balisi, thank you for helping me explore this wonderful city on two
wheels. Next stop, San Francisco, don’t forget your bike! Jonathan Chang, thank you for
being a loyal and helpful friend while keeping us all humble. Grace John, thank you for
feeding me, entertaining me, and continuing to be my friend, even when I’m difficult. To
EEB clubbing club, thanks for showing me how and where to dance it all out.
Thank you to my doctoral committee; Tom Smith, Pat Krug, and non-certifying
members John Novembre and Kirk Lohmueller; for your advice and feedback. To the rest of
the UCLA EEB faculty, thank you for broadening our experiences as graduate students as
much as you could. I am particularly grateful to Peter Nonacs for showing us how to fail in
style, to Peggy Fong for being the academic mom we all want, and to Dan Blumstein for
pushing us to leave the ivory tower. I am certain I would not be in fortunate the position I am
in today without the science communication aspect of the GAANN Fellowship. To the EEB
xiv
staff, you are incredible! Jocelyn Yamadero, I don’t want to know where I would be without
you. To Jonathan Rodgers and Raffaella D’Auria, thank you for responding quickly to my
frantic emails and guiding me through various computer problems over the years.
To the Dickson 5-5, thank you for sticking with me all these years! Veronica Conti,
you helped me become the person I was when I started grad school, which has shaped the
person I am now. I will always fly across the world for you. Jessica Intravia, some people
might ask how we ended up best friends, but they don’t see how our brains work. Countless
times I’ve doubted myself, or talked about taking the easy way out of a tough situation, and
you always challenge me to stay and prove myself. You’ve known for over a decade that I
could do this, and that I would regret it over and over again if I didn’t. You never let me take
this life for granted, and for that I am grateful. I may be excited to get my own closet, but
there’s still no one else with whom I’d rather shall a wall. I know you followed me to LA, so
pick somewhere good, and next time maybe I’ll follow you. To Louis and Milo, your
dissertation-year cuddles and walks kept me sane.
Finally, to my family, thank you for the values that made me to want this degree, the
privilege to pursue it, and the confidence to accomplish it. While some may view this career
path as a sacrifice of someone who values the earth over personal gain, you have always
known that there is no such tradeoff; without the diversity of life on Earth, we have nothing.
Shannon, you have always been a role model, showing me that through every stage of life
you can choose your path, and make it exactly what you want it to be. Dad, I don’t know
how you do it, but you have always been a calming presence. No matter how tough a
situation appears to be, you always know that things are not as bad as they seem, and with
a little hard work, everything works out. Mom, thank you for believing in me rather than

xv
succumbing to those worried thoughts I know you were having this whole time. You have
always let me make my own decisions and mistakes, no matter how much you disagreed or
worried about the consequences. I would have given up long ago without your continued
support.
The following dissertation chapters are being prepared to submit for publication with
myself as first author, Gusti Gnurah Mahardika as Indonesian research sponsor and second
author, and Paul Barber as principle investigator. Included in this work are data contributed
by Jessica Goodheart at the University of Maryland, Rob Toonen and Kaho Tisthammer at
the University of Hawaii, and Angel Valdes at California State Polytechnic University,
Pomona. Sutra Anjani, Paul Mendoza, and Amanda Russell assisted with lab work. Thank
you for all of your work, and I look forward to continuing our collaborations. This research
was conducted using research permits granted by RISTEK in Indonesia
(188SIP/FRP/SM/VI/2012 and 220/SIP/FRP/SM/VI/2013) and the Department of Land and
Natural Resources in Hawaii (SAP 2013-11). Funding was provided by the UCLA
Indonesian Studies Program Lemelson Fellowship, the UCLA Pauley Fellowship, the UCLA
EEB GAANN Fellowship, the American Museum of Natural History Lerner Grey Memorial
Fund, the American Society of Naturalists Student Research Fellowship, a Conchologists of
America Research Grant, a Sigma Xi Grant-in-Aid of Research, and UCLA EEB travel and
research grants.

xvi
VITA/BIOGRAPHICAL SKETCH
Professional Preparation
Cornell University Natural Resources B.S. 2008
University of California Los Angeles Biology M.S. 2015
Appointments
Teaching Associate, Ecology & Evolutionary Biology Dept., UCLA 2011-16
GAANN Fellow, Ecology & Evolutionary Biology Dept., UCLA 2011-12, 14-15
Pauley Fellow, Ecology & Evolutionary Biology Dept., UCLA 2010-11, 13-14
Teaching Associate, General Education Dept., UCLA 2012-13
Research Assistant, Seattle Institute for Biomedical and Clinical Research 2009-10
Research Assistant, Conservation Genetics Lab, U.S. Fish and Wildlife 2008-09
Field Technician, Museum of Vertebrate Zoology, Univ. of California Berkeley 2007
Research Assistant, Natural Resources Department, Cornell University 2006-07
Presentations
Fritts-Penniman, AL; Mahardika, GN; Barber, PH “Genomic evidence for ecological
speciation in coral associated nudibranchs.” International Coral Reef Symposium 2016.
Hawaii Convention Center, Honolulu, HI. 21 June 2016. Conference oral presentation.
Fritts-Penniman, AL; Mahardika, GN; Barber, PH “Genomic evidence for ecological
speciation in Phestilla nudibranchs (Gastropoda: Opisthobranchia).” Molluscan Forum 2015.
Natural History Museum, London, UK. 19 November 2015. Conference oral presentation.

xvii
Fritts-Penniman, AL; Mahardika, GN; Barber, PH "Genomic signatures of ecological
speciation in the coral associated nudibranch genus Phestilla.” Evolution 2015. Casa
Grande Resort, Guaruja, Brazil. 30 June 2015. Conference oral presentation.
Fritts-Penniman, AL; Mahardika, GN; Barber, PH "Genomic signatures of ecological
speciation in the coral-associated nudibranch genus Phestilla.” Gordon Research
Conference on Speciation. Four Points Sheraton Hotel, Ventura CA. 16-20 March 20015.
Conference poster presentation.
Fritts-Penniman, AL; Mahardika, GN.; Barber, PH "Genetic signatures of ecological
speciation in a coral-associated nudibranch." Society for Integrative and Comparative
Biology Meeting. Hilton Austin Hotel, Austin, TX. 6 January 2014. Conference oral
presentation.
Fritts-Penniman, AL and Barber, PH "Genetic signatures of ecological speciation in a
coral-associated nudibranch." Benthic Ecology Meeting. Hyatt Regency Hotel, Savannah,
GA. 23 March 2013. Conference oral presentation.
Fritts-Penniman, AL "Genetic structure of coral-associated nudibranchs across the Pacific
Ocean." Western Society of Naturalists Meeting. Embassy Suites, Seaside, CA. 9
November 2012. Conference poster presentation.
Publications
Tsuang D, Leverenz JB, Lopez OL, et al. (2012) “GBA mutations increase risk for Lewy
body disease with and without Alzheimer disease pathology.” Neurology 79(19): 1944-1950.

1
INTRODUCTION
The origins of biological diversity have fascinated people for millennia. Over the past
couple of centuries, evolutionary biologists have honed in on the specific processes that
produce the diversity of species we see on Earth. Since its “discovery” by Alfred Russel
Wallace and Charles Darwin, the role of natural selection in speciation has been heavily
debated (Darwin 1859). In the modern synthesis of the 20th century, natural selection was
credited for producing much of the differences between species. However, physical isolation
resulting from geographic barriers to dispersal was considered essential for populations to
become isolated enough for species to form (Hutchinson 1959, Mayr 1963).
While divergence in allopatry is likely the most common mode of speciation
(Barraclough & Vogler 2000), there is now mounting theoretical and empirical evidence that
sympatric speciation can and does occur (Maynard Smith 1966, Schliewen et al. 1994;
Bush 1994; Dieckmann & Doebeli 1999; Berlocher & Feder 2002; Bolnick & Fitzpatrick
2007; Gavrilets 2014). It was recognized early on that disruptive selection could potentially
lead to isolation without a geographic barrier (Mather 1955, Maynard Smith 1966), and
laboratory selection experiments did indeed confirmed this prediction (Thoday & Gibson
1962, 1970). One of the earliest proposed mechanisms for sympatric speciation
was “competitive speciation” (Rosenzweig 1978), where the existence of multiple
specialized phenotypes reduces competition for the resource base of any one phenotype.
Competition between specialized phenotypes and intermediate phenotypes causes
disruptive selection, promoting assortative mating, and reproductive isolation. Now the
broader term “ecological speciation” is used for any speciation that is initiated by divergent
selection for different ecological niches (Schluter 2001; Rundle & Nosil 2005).

2
Over the past few decades new genetic and genomic techniques have allowed us to
identify the processes driving population divergence with much greater detail, because we
can now detect and observe the process in action. These techniques have facilitated the
discovery of cryptic, ecologically-associated, sympatric divergence, and the topic of
ecological speciation has surged in the literature (Hendry 2009). Accompanying this surge
is a shift in the focus of speciation studies: instead of distinguishing between allopatric and
sympatric speciation, studies now examine the roles of ecology, natural selection, and gene
flow in speciation (Orr & Smith 1998). This paradigm shift is especially important for studies
of speciation in the sea, where the lack of obvious barriers to gene flow makes it difficult to
identify clear mechanisms for allopatric speciation (Palumbi 1994; Rocha et al. 2005; Krug
2011; Miglietta et al. 2011).
Despite the potential for ecological speciation to be an important contributor to
marine biodiversity, research on the topic still lags far behind that in terrestrial and aquatic
systems. Ecological speciation was first described in phytophagous insects and aquatic fish
(Schliewen et al. 1994; Schluter & Nagel 1995; Lu & Bernatchez 1999; Filchak et al. 2000).
Now examples of ecological speciation span the tree of life, including bacteria (Lassalle et
al. 2015), plants (Lowry et al. 2008; Mitsui et al. 2011; Andrew et al. 2012; Osborne et al.
2013; Papadopulos et al. 2013; Roda et al. 2013), arachnids (Pekár et al. 2012),
amphibians (Rice et al. 2009), reptiles (Rosenblum & Harmon 2011; Nunes et al. 2011;
Muñoz et al. 2013), and birds (Parchman et al. 2006; Milá et al. 2009; Ballentine et al.
2013). In the ocean, evidence of ecological speciation has been observed in cnidarians
(Prada & Hellberg 2013), polychaetes (Maltagliati et al. 2004), molluscs (Bierne et al. 2003;
Faucci et al. 2007; Johannesson 2009; Bird et al. 2011, Simmonds 2016), crustaceans

3
(Tsang et al. 2009; Hurt et al. 2013), fish (Munday et al. 2004; Puebla et al. 2007;
Buonaccorsi et al. 2011) and sea snakes (Sanders et al. 2013). However, considering the
vast biodiversity of marine ecosystems such as the Coral Triangle (Veron et al. 2007),
where ecological associations are plenty and vicariance is relatively rare (Bowen et al.
2013), there are a plethora of opportunities to study ecological speciation in the sea.
With the surge in studies of ecological speciation, it is no longer necessary to define
or categorize speciation research based solely on geography (Butlin et al. 2008; Harrison
2012). Instead, it is often categorized based on the phylogenetic relationships between
ecotypes across different locations (Orr & Smith 1998). In parallel ecological divergence,
gene flow is limited between locations, but the same selective pressures lead to the
independent evolution of the same ecotypes across locations. For example, in the three-
spine stickleback, benthic and limnetic ecomorphs have repeatedly evolved in many
different isolated lakes (Rundle et al. 2000), and at the interface of marine and freshwater
habitats, armored plating is always reduced in freshwater (Colosimo et al. 2005). Genomic
research has shown the same loci under parallel selection across independent population
pairs in stick insects and pea aphids associated with different plant hosts (Soria-Carrasco et
al. 2014, Nouhaud et al. 2014). Alternatively, many studies reveal that gene flow is
restricted more by ecological divergence than geography, such that individuals from the
same habitat are more closely related, regardless of geographic location. Examples of this
pattern of divergence include limpets (Bird et al. 2011), rockfish (Narum et al. 2004,
Buonaccorsi et al. 2011), and some well-studied phytophagous insects such as the apple
maggot fly Rhagoletis (Feder et al. 2005; Powell et al. 2014) and the European corn borer
Ostrina (Midamegbe et al. 2011).
4
Research on ecological divergence tends to focus on single cases of population-
level divergence in its early stages, because once reproductive isolation is complete,
subsequent changes can obscure the process through which it first evolved (Orr & Smith
1998; Hendry 2009). While these studies provide important insights into the mechanisms
driving ecological divergence, they do not actually demonstrate the evolution of reproductive
isolation, and they do not address whether the process of ecological speciation is an
important process driving the diversification of life on Earth. Understanding the role of
ecological speciation in shaping global biodiversity requires connecting individual examples
of ecological divergence to speciation patterns at higher taxonomic levels. This means
studying one system, ideally one with high taxonomic diversity, across multiple stages of the
speciation continuum, from adaptive divergence with gene flow to fully ecologically isolated
species (Hendry 2009; Feder et al. 2012). A rare example of this approach in the pea aphid
complex, where genetic evidence revealed host-specific populations at different stages of
divergence, from host race to purported species (Peccoud et al. 2009).
This dissertation uses a multi-stage approach to understand the relative roles of
geography and ecology in generating and maintaining species diversity in scleractinian
coral-associated nudibranchs. We define coral-associated nudibranchs as nudibranch
species that rely completely on a coral host for both food and habitat. The relationship
between this unique group of nudibranchs and their coral prey draws a strong parallel to
well-studied terrestrial phytophagous insects. The large size of coral colonies combined with
the limited mobility of adults results in a tendency for individual nudibranchs to stay the
same host coral colony for their entire life, including mating (Krug 2011). This life-history
promotes reproductive isolation between populations feeding on different corals, and has

5
the potential to lead to ecological speciation, possibly in sympatry. Speciation via host
shifting has been suggested as a mechanism of diversification in genus Phestilla (Faucci et
al. 2007), but has never been explicitly tested. This dissertation tests for ecological
divergence at many taxonomic and geographic scales, from investigating host-associated
genomic divergence within a single site, to using genetic evidence to identify cryptic coral-
associated nudibranch species throughout the entire Indo-Pacific Ocean.
In chapter 1, I use phylogenetic and population genetic techniques to identify cryptic
speciation across the Sunda Shelf, and reveal a new example of ecological divergence with
Phestilla cf. minor diverging on two difference lineages of co-distributed Porites coral hosts.
In the Pacific Ocean, Phestilla cf. minor individuals are more closely related to those from
the same host than those from the same reef, indicating that coral host may act as a
stronger barrier to gene flow than geographic distance. In chapter 2, I investigate this host-
associated genomic divergence in more detail using genome-wide single nucleotide
polymorphisms. I use population genetic analyses to demonstrate that host-driven
divergence is stronger than that across the Sunda Shelf, despite having occurred more
recently. Genomic scans for selection reveal an important role for natural selection in both
geographic and host-associated divergence. Finally, in chapter 3 I broaden my approach to
include all scleractinian-associated nudibranchs. I conducted exploratory field sampling and
genetic sequencing to discover species with previously unknown host associations and
cryptic allopatric speciation throughout the Indo-Pacific Ocean. A phylogenetic tree of all
scleractinian-associated nudibranchs that reveals multiple instances of host shifting and
geographic divergence throughout evolutionary history. Combined, these three studies
demonstrate that both coral host and geography contribute to diversification both within and

6
between species of scleractinian coral-associated nudibranchs. This research provides a
solid foundation to develop this system into a new model for the study of ecological
speciation in the sea.

7
REFERENCES
Andrew RL, Ostevik KL, Ebert DP, Rieseberg LH (2012) Adaptation with gene flow across the landscape in a dune sunflower. Molecular Ecology, 21, 2078–2091.
Ballentine B, Horton B, Brown ET, Greenberg R (2013) Divergent selection on bill
morphology contributes to nonrandom mating between swamp sparrow subspecies. Animal Behaviour, 86, 467–473.
Barraclough T, Vogler A (2000) Detecting the Geographical Pattern of Speciation from
Species-Level Phylogenies. The American Naturalist, 155, 419–434. Berlocher SH, Feder JL (2002) Sympatric speciation in phytophagous insects: moving
beyond controversy? Annual Review of Entomology, 47, 773–815. Bierne N, Bonhomme F, David P (2003) Habitat preference and the marine-speciation
paradox. Proceedings of the Royal Society of London B: Biological Sciences, 270, 1399–1406.
Bird CE, Holland BS, Bowen BW, Toonen RJ (2011) Diversification of sympatric broadcast-
spawning limpets (Cellana spp.) within the Hawaiian archipelago. Molecular Ecology, 20, 2128–2141.
Bolnick DI, Fitzpatrick BM (2007) Sympatric Speciation: Models and Empirical Evidence.
Annual Review of Ecology, Evolution, and Systematics, 38, 459–487. Bowen BW, Rocha LA, Toonen RJ, Karl SA (2013) The origins of tropical marine
biodiversity. Trends in Ecology and Evolution, 28, 359–366. Buonaccorsi VP, Narum SR, Karkoska KA et al. (2011) Characterization of a genomic
divergence island between black-and-yellow and gopher Sebastes rockfishes. Molecular Ecology, 20, 2603–2618.
Bush GL (1994) Sympatric speciation in animals: New wine in old bottles. Trends in Ecology
and Evolution, 9, 285–288. Butlin RK, Galindo J, Grahame JW (2008) Sympatric, parapatric or allopatric: the most
important way to classify speciation? Philosophical Transactions of the Royal Society B: Biological Sciences, 363, 2997–3007.
Colosimo PF, Hosemann KE, Balabhadra S et al. (2005) Widespread parallel evolution in
sticklebacks by repeated fixation of Ectodysplasin alleles. Science, 307, 1928–33. Darwin C (1859) On the origin of species by means of natural selection. London:
Murray, 247.

8
Dieckmann U, Doebeli MO (1999) On the origin of species by sympatric speciation. Nature, 400, 354–357.
Faucci A, Toonen RJ, Hadfield MG (2007) Host shift and speciation in a coral-feeding
nudibranch. Proceedings of the Royal Society B: Biological Sciences, 274, 111–119. Feder JL, Egan SP, Nosil P (2012) The genomics of speciation-with-gene-flow. Trends in
Genetics, 28, 342–350. Feder JL, Xie X, Rull J et al. (2005) Mayr, Dobzhansky, and Bush and the complexities of
sympatric speciation in Rhagoletis. Proceedings of the National Academy of Sciences, 102 Suppl, 6573–80.
Filchak KE, Roethele JB, Feder JL (2000) Natural selection and sympatric divergence in the
apple maggot Rhagoletis pomonella. Nature, 407, 739–742. Gavrilets S (2014) Models of speciation: Where are we now? Journal of Heredity, 105, 743–
755. Harrison RG (2012) The language of speciation. Evolution, 66, 3643–3657. Hendry AP (2009) Ecological speciation! Or the lack thereof? Canadian Journal of Fisheries
and Aquatic Sciences, 66, 1383–1398. Hurt C, Silliman K, Anker A, Knowlton N (2013) Ecological speciation in anemone-
associated snapping shrimps (Alpheus armatus species complex). Molecular Ecology, 22, 4532–4548.
Hutchinson G (1959) Homage to Santa Rosalia or Why are there so many kinds of animals?
The American Naturalist. Johannesson K (2009) Inverting the null-hypothesis of speciation: A marine snail
perspective. Evolutionary Ecology, 23, 5–16. Krug PJ (2011) Patterns of speciation in marine gastropods: A review of the phylogenetic
evidence for localized radiations in the sea. American Malacological Bulletin, 29, 169–186.
Lassalle F, Muller D, Nesme X (2015) Ecological speciation in bacteria: Reverse ecology
approaches reveal the adaptive part of bacterial cladogenesis. Research in Microbiology, 166, 729–741.
Lowry DB, Rockwood RC, Willis JH (2008) Ecological reproductive isolation of coast and
inland races of Mimulus guttatus. Evolution, 62, 2196–214.

9
Lu G, Bernatchez L (1999) Correlated Trophic Specialization and Genetic Divergence in Sympatric Lake Whitefish Ecotypes (Coregonus clupeaformis): Support for the Ecological Speciation Hypothesis. Evolution, 53, 1491–1505.
Maltagliati F, Casu M, Castelli A (2004) Morphological and genetic evidence supports the
existence of two species in the genus Ophelia (Annelida, Polychaeta) from the Western Mediterranean. Biological Journal of the Linnean Society, 83, 101–113.
Mather K (1955) Polymorphism as an Outcome of Disruptive Selection. Source: Evolution,
9, 52–61. Mayr E (1963) Animal species and evolution. Belknap Press of Harvard University Press,
Cambridge, MA. Midamegbe A, Vitalis R, Malausa T et al. (2011) Scanning the European corn borer
(Ostrinia spp.) genome for adaptive divergence between host-affiliated sibling species. Molecular Ecology, 20, 1414–1430.
Miglietta MP, Faucci A, Santini F (2011) Speciation in the sea: Overview of the symposium
and discussion of future directions. Integrative and Comparative Biology, 51, 449–455. Milá B, Wayne RK, Fitze P, Smith TB (2009) Divergence with gene flow and fine-scale
phylogeographical structure in the wedge-billed woodcreeper, glyphorynchus spirurus, a neotropical rainforest bird. Molecular Ecology, 18, 2979–2995.
Mitsui Y, Nomura N, Isagi Y, Tobe H, Setoguchi H (2011) Ecological barriers to gene flow
between riparian and forest species of ainsliaea (asteraceae). Evolution, 65, 335–349. Munday PL, Van Herwerden L, Dudgeon CL (2004) Evidence for Sympatric Speciation by
Host Shift in the Sea. Current Biology, 14, 1498–1504. Muñoz MM, Crawford NG, McGreevy TJ et al. (2013) Divergence in coloration and
ecological speciation in the Anolis marmoratus species complex. Molecular Ecology, 22, 2668–2682.
Nunes VL, Beaumont MA, Butlin RK, Paulo OS (2011) Multiple approaches to detect
outliers in a genome scan for selection in ocellated lizards (Lacerta lepida) along an environmental gradient. Molecular Ecology, 20, 193–205.
Orr MR, Smith TB (1998) Ecology and speciation. Trends in Ecology & Evolution, 13, 502–
506. Osborne OG, Batstone TE, Hiscock SJ, Filatov DA (2013) Rapid speciation with gene flow
following the formation of Mt. Etna. Genome Biology and Evolution, 5, 1704–1715.

10
Palumbi SR (1994) Genetic divergence, reproductive isolation, and marine speciation. Annual Review of Ecology and Systematics, 25, 547–572.
Papadopulos AST, Price Z, Devaux C et al. (2013) A comparative analysis of the
mechanisms underlying speciation on Lord Howe Island. Journal of Evolutionary Biology, 26, 733–745.
Parchman TL, Benkman CW, Britch SC (2006) Patterns of genetic variation in the adaptive
radiation of New World crossbills (Aves: Loxia). Molecular Ecology, 15, 1873–1887. Peccoud J, Ollivier A, Plantegenest M, Simon J-C (2009) A continuum of genetic
divergence from sympatric host races to species in the pea aphid complex. Proceedings of the National Academy of Sciences, 106, 7495–7500.
Pekár S, Šmerda J, Hrušková M et al. (2012) Prey-race drives differentiation of biotypes in
ant-eating spiders. Journal of Animal Ecology, 81, 838–848. Powell THQ, Forbes AA, Hood GR, Feder JL (2014) Ecological adaptation and reproductive
isolation in sympatry: genetic and phenotypic evidence for native host races of Rhagoletis pomonella. Molecular Ecology, 23, 688–704.
Prada C, Hellberg ME (2013) Long prereproductive selection and divergence by depth in a
Caribbean candelabrum coral. Proceedings of the National Academy of Sciences, 110, 3961–3966.
Puebla O, Bermingham E, Guichard F, Whiteman E (2007) Colour pattern as a single trait
driving speciation in Hypoplectrus coral reef fishes? Proceedings of the Royal Society B: Biological Sciences, 274, 1265–1271.
Rice AM, Leichty AR, Pfennig DW (2009) Parallel evolution and ecological selection:
replicated character displacement in spadefoot toads. Proceedings of the Royal Society B: Biological Sciences, 276, 4189–4196.
Rocha LA, Robertson DR, Roman J, Bowen BW (2005) Ecological speciation in tropical reef
fishes. Proceedings of the Royal Society B: Biological Sciences, 272, 573–579. Roda F, Ambrose L, Walter GM et al. (2013) Genomic evidence for the parallel evolution of
coastal forms in the Senecio lautus complex. Molecular Ecology, 22, 2941–2952. Rosenblum EB, Harmon LJ (2011) “Same same but different”: Replicated ecological
speciation at white sands. Evolution, 65, 946–960. Rosenzweig M (1978) Competitive speciation. Biological Journal of the Linnean Society, 10,
275–289.

11
Rundle HDD, Nagel L, Boughman JW, Schluter D, Wenrick Boughman J (2000) Natural Selection and Parallel Speciation in Sympatric Sticklebacks. Science, 287, 306–308.
Rundle HD, Nosil P (2005) Ecological speciation. Ecology Letters, 8, 336–352. Sanders KL, Rasmussen AR, Mumpuni et al. (2013) Recent rapid speciation and ecomorph
divergence in Indo-Australian sea snakes. Molecular Ecology, 22, 2742–2759. Schliewen UK, Tautz D, Paabo S (1994) Sympatric speciation suggested by monophyly of
crater lake cichlids. Nature, 368, 629–632. Schluter D (2001) Ecology and the origin of species. Trends in Ecology and Evolution, 16,
372–380. Schluter D, Nagel LM (1995) Parallel Speciation by Natural Selection. American Naturalist,
146, 292–301. Thoday JM, Gibson JB (1962) Isolation by disruptive selection. Nature, 193, 1164–1166. Thoday J, Gibson J (1970) The probability of isolation by disruptive selection. American
Naturalist, 104, 500. Tsang LM, Chan BKK, Shih FL, Chu KH, Allen Chen C (2009) Host-associated speciation in
the coral barnacle Wanella milleporae (Cirripedia: Pyrgomatidae) inhabiting the Millepora coral. Molecular Ecology, 18, 1463–1475.
Veron JEN, Devantier LM, Turak E, Green AL (2007) Delineating the Coral Triangle. Global
Biodiversity, 1–14.

12
CHAPTER 1
Cryptic ecological and geographic divergence of coral-associated nudibranchs in
the Coral Triangle
Introduction
The Coral Triangle (sensu Veron et al. 2007) is the global epicenter of marine
biodiversity, and multiple theories seek to explain this pattern (Palumbi 1997; Barber 2009;
Bowen et al. 2013; Barber & Meyer 2015). The Center of Overlap postulates that divergent
Indian and Pacific Ocean taxa overlap in the Coral Triangle where these two oceans meet
(Woodland 1983; Hobbs et al. 2009). The Center of Accumulation, or the “vortex model,”
states that species that originate in the peripheral islands of the Indian and Pacific Oceans
gradually accumulate in the Coral Triangle (Ladd 1960; Jokiel & Martinelli 1992). The
Center of Origin counters that speciation occurs in the Coral Triangle (Ekman 1953; Briggs
1992). Fundamental to all of these theories is the question of where and how speciation
occurs in the tropical Indo-West Pacific (IWP).
Speciation studies have historically focused on the geographic context of
divergence, attempting to determine whether divergence occurred in geographic isolation
(allopatry), across an environmental gradient (parapatry), or with no geographic separation
(sympatry) (Coyne & Orr 2004). In marine systems, identifying allopatric mechanisms of
population divergence and speciation is challenging because of the lack of obvious
geographic barriers (Palumbi 1994). Most marine species have highly dispersive larvae,
and the longer a species pelagic larval duration (PLD), the farther it typically disperses
(Shanks et al. 2003). In some cases dispersal can cover many thousands of miles

13
(Scheltema 1971, 1988), suggesting that for some species there may be no barriers to
dispersal or migration. However, if larval duration is short, or if realized dispersal falls short
of its potential, then isolation can result as a function of distance, leading to allopatric
speciation (Knowlton & Keller 1986; Siegel et al. 2003; Rocha & Bowen 2008; Selkoe &
Toonen 2011).
Within the Coral Triangle, there is evidence to support allopatric divergence. Genetic
data has revealed fine scale endemism within some Indo-Pacific marine invertebrate
species, revealing regional populations isolated enough to be potentially allopatric cryptic
species (Meyer et al. 2005; Barber et al. 2006). Similarly, phylogeographic studies have
demonstrated the existence of dispersal barriers within the seemingly continuous seas of
the Coral Triangle (Fleminger 1985; McMillan & Palumbi 1995; Lavery et al. 1996; Palumbi
1997; Barber & Bellwood 2005; Barber et al. 2006, 2011), barriers that could lead to
speciation. For example, lowered sea levels during Pleistocene glacial periods exposed the
Sunda shelf, creating a land barrier between the Indian and Pacific Oceans that likely
resulted in allopatric speciation of many taxa (e.g. Fleminger 1985; Lavery et al. 1996), as
well as pronounced phylogeographic structure in a wide diversity of marine species
including clownfish, stomatopods, giant clams, echinoderms, sea stars, and snails (Williams
& Benzie 1998; Nelson et al. 2000; Barber et al. 2006; Crandall et al. 2008; Timm &
Kochzius 2008; DeBoer et al. 2008, Simmonds 2016). Similarly, concordant patterns in a
variety of marine fish and invertebrates indicate that oceanographic processes such as the
Halmahera Eddy may also promote isolation and diversification (Barber et al. 2011;
Carpenter et al. 2011), a pattern predicted by physical oceanographic models (Kool et al.
2011; Treml et al. 2015).

14
While there is clearly evidence for allopatric divergence in the Coral Triangle, the
ephemeral nature of isolation in this region and the fact that many sister species have
sympatric ranges suggests that other modes of speciation (e.g. sympatric speciation) could
significantly contribute to biodiversity in this region. Research in terrestrial and freshwater
systems is increasingly providing examples of speciation in sympatry (Bush 1994; Dres &
Mallet 2002; Marques et al. 2016), the most striking example being cichlid fishes, which
have undergone parallel adaptive radiations producing nearly 1,500 species in the Great
Lakes of East Africa (Schliewen et al. 1994; Brawand et al. 2014).
One mode of sympatric speciation is ecological speciation, where divergent selection
for different ecological niches promotes reproductive isolation (Rundle and Nosil 2005,
Marie Curie SPECIATION Network 2012). Such isolation frequently comes from host
shifting, a process by which lineage divergence and speciation occurs as a result of
populations of a parent species adapted to live on specific hosts evolving a preference for a
novel host (Via and West 2008). Evidence for host-driven ecological speciation is well-
documented in terrestrial systems, particularly in phytophagous insects (Berlocher & Feder
2002; Matsubayashi et al. 2010). Classic examples include the apple maggot fly (Filchak et
al. 2000; Feder et al. 2005), pea aphids (Via et al. 2000), and the walking stick insect
Timema cristinae (Nosil et al. 2002).
In comparison to the terrestrial realm, ecological speciation in marine ecosystems is
relatively unstudied (Krug 2011). Notable examples include Gobiodon gobies (Munday et al.
2004), the barnacle Wanella milliporae (Tsang et al. 2009), and the snail Coralliophila
violacea (Simmonds 2016) all of which have strong associations with coral and potentially
have undergone speciation via host shifting. Hundreds of marine species have associations

15
with coral hosts, in relationships that parallel those of phytophagous insects to their host
plants. This coral habitat-driven divergent selection could play a significant role in shaping
the remarkable diversity of coral reefs (Rocha et al. 2005; Alfaro et al. 2007).
Heterobranchs are an extremely diverse group of snails and slugs that includes the
order Nudibranchia. There are over 2,700 recognized species of nudibranch (Wägele 2004),
with an equal number of undescribed species (Gosliner et al. 2015). Nudibranch diversity
peaks in the Coral Triangle, where many taxa have overlapping ranges with their sister
species, with little to no evidence for divergence via vicariance (Gosliner & Draheim 1996).
Many heterobranchs benefit substantially from strong ecological associations with specific
algal or cnidarian taxa (Jensen 1997; Wägele 2004; Krug 2011). For example, many aeolid
nudibranchs are so well adapted to their cnidarian host/prey that they can consume stinging
nematocysts and retain them for their own defensive use (Wagele & Willan 2000; Putz et al.
2010). In other taxa, such as Phestilla, species have adapted extraordinary camouflage to
stay hidden on their coral hosts.
Phestilla lugubris (synonymous with P. sibogae) and P. minor are widespread aeolid
nudibranchs that live and prey upon Porites corals across the Indo-Pacific Ocean from
Hawaii to Tanzania. Phestilla mate on their host corals using internal fertilization, then lay
eggs on the coral. After a brief planktonic stage, the length of which varies between
species, Phestilla larvae use chemical cues from corals to identify and initiate recruitment
onto their host coral of choice (Hadfield & Pennington 1990; Hadfield & Koehl 2004), where
the metamorphosed larva will spend its entire life. Phestilla species have specific
associations with disparate coral genera (Faucci et al. 2007). Given the lack of allopatric
barriers between sister species on different hosts, host-associated divergent selection is a

16
likely mechanism for speciation, but ecological diversification has never been explicitly
tested in this group.
In this paper, we use genetics to test for divergence among populations of Phestilla
lugibris and Phestilla minor in the Coral Triangle. Specifically, we examine for divergence
among populations that span well-established phylogeographic provinces, and among
populations that live on different Porites coral hosts, in an effort to test the relative roles of
geographic and ecological barriers to gene flow in population divergence of Phestilla
nudibranchs in the Coral Triangle.
Methods
(a) Sample collection
To test the potential impact of biogeographic barriers on diversification of Phestilla
minor and Phestilla lugubris populations, we collected samples from Indonesian coral reefs
(Figure 1.1) spanning the well-documented Indian and Pacific Ocean biogeographic
boundary (Fleminger 1985; Lavery et al. 1996). We also sampled on either side of the
Maluku Sea, a region where the Halmahera Eddy isolates populations of many coral reef
invertebrates (Barber et al. 2002, 2011). We located Phestilla through close inspection of
loose coral pieces while using snorkel and SCUBA, and collected individual nudibranchs by
hand.
To test for ecological diversification among nudibranchs with different coral hosts, we
collected Phestilla minor and Phestilla lugubris from as many species of Porites coral hosts
as possible. Porites corals are notoriously plastic in appearance, making species

17
identifications based on morphology extremely difficult (Forsman et al. 2009). To genetically
confirm perceived differences among hosts, we collected a small sample of tissue from
each host for genetic analysis. To abide by the limits of our sampling permits, at some
locations we could only sample the first 3 individuals of a given coral morpho-species, and
any additional coral hosts were classified by morphology alone.
We photographed all nudibranchs on their host coral in the field prior to collection.
Individuals were kept alive for ≤ 6 hours in small vials of seawater until sample processing.
We anesthetized and relaxed all specimens in the freezer before transferring them to 95%
ethanol for long-term preservation. We recorded the specific coral host for all samples, with
as many as 12 nudibranchs coming from one small coral. In total, we collected 250 Phestilla
cf minor and 66 Phestilla lugubris samples from 6 Porites morpho-species at 8 locations.
(b) DNA extraction, amplification, and sequencing
We extracted DNA from nudibranch and coral tissue using Qiagen DNEasy Kits and
Omega Bio-Tek E.Z.N.A. Mollusc DNA Kits. For nudibranchs, we isolated foot tissue for
extraction when possible, but for individuals smaller than 5 mm, we used half the body, and
for those smaller than 2 mm we used the entire body. We excluded cerata (the projections
of the gut covering the bodies of most aeolid nudibranchs) from the DNA extractions as they
often contain recently ingested coral tissue (Rudman 1982). For nudibranchs we amplified a
section of the mitochondrial cytochrome oxidase subunit I gene (COI) using the universal
primers LCO1490 and HCO2198 (Folmer et al. 1994) under the following PCR conditions: 2
minutes at 94ºC; 35 cycles of 94ºC for 30 seconds, 40ºC for 30 seconds, and 72ºC for 30
seconds; with a final extension of 7 minutes at 72ºC. For coral hosts we amplified a section

18
of the nuclear histone 2 (H2) coding region using the primers zpH2AH4f (5’-
GTGTACTTGGCTGCYGTRCT-3’) and zpH4Fr (5’-GACAACCGAGAATGTCCGGT-3’)
under the following PCR conditions: 2 minutes at 96ºC; 34 cycles of 96ºC for 20 seconds,
58.5ºC for 20 seconds, and 72ºC for 90 seconds; and a final extension of 5 minutes at 72ºC
(Tishammer et al. unpublished). Amplified DNA was then sequenced in both directions with
the ABI 3730 sequencer at UC Berkeley’s DNA Sequencing Facility. We assembled and
edited all sequences in Geneious version 6.1.7 (Kearse et al. 2012), and verified the quality
of sequences with successful translation to amino acid protein code and alignment using
the MUSCLE algorithm as implemented in Geneious.
(c) Phylogenetic analysis
To test for the presence of phylogenetic structure in the two nudibranch species we
generated phylogenetic trees of COI sequences. Sequences from Phestilla lugubris and “P.
sp. 1”, the undescribed sister taxon to P. minor (Faucci et al. 2007, Ritson-Williams et al.
2003), were included as outgroups for P. minor; for P. lugubris we used P. minor and P. sp.
1 as outgroups. To confirm coral host species field identifications we generated a
phylogenetic tree of H2 sequences from the sampled Porites hosts using a Porites
superfusa sequence (Tisthammer et al. unpublished) as an outgroup. For all three
phylogenetic trees we determined the best-fit model of evolution (HKY+I+G for P. minor,
GTR+I+G for P. lugubris and Porites) for phylogenetic analysis using the Akaike information
criterion (AIC) as implemented in JModelTest (Guindon & Gascuel 2003; Darriba et al.
2012). Bayesian analysis was conducted in MrBayes 3.2.2 (Ronquist & Huelsenbeck 2003;
Ronquist et al. 2012) as implemented in Geneious. We ran analyses for 1,000,000

19
generations, sampling every 200 generations, with a 10% burn-in, and assessed support for
individual nodes using posterior probabilities. We also conducted a maximum likelihood
analysis in PhyML 2.2.0 (Guindon & Gascuel 2003) as implemented in Geneious and
assessed support for nodes using proportion out of 1,000 bootstraps.
To assess whether nudibranch divergence was initiated by lowered sea levels during
the Pleistocene, we compared approximate divergence time between clades to the timing of
glacial cycles (Voris 2000; Lambeck et al. 2002). We calculated mean sequence divergence
between clades by first calculating pairwise percent sequence identity for all samples in a
given pair of clades. We then transformed sequence identity to sequence divergence and
averaged across all pairwise divergence estimates between the different clades. We
approximated divergence time from sequence divergence using the COI sequence
divergence between two teguline gastropods calibrated by the Isthmus of Panama (Hellberg
& Vacquier 1999).
To determine whether cryptic nudibranch clades could be analyzed using population
genetic techniques or should be considered as separate species, we used Automatic
Barcode Gap Detection (ABGD, Puillandre et al. 2012). ABGD uses DNA barcodes such as
COI to partition samples into putative species based on the barcode gap, which occurs
when divergence among individuals within the species is less than that between species.
We analyzed P. minor and P. lugubris sequence alignments using the online tool
(http://wwwabi.snv.jussieu.fr/public/abgd/abgdweb.html) with the default range of 0.001 to
0.1 for prior intraspecific divergence (P) and 1.5 for relative gap width (x), with corrected
Jukes-Cantor and Kimura distances as well as simple distances.
To test for ecological divergence, we constructed a contingency table categorizing

20
nudibranchs by phylogenetic clade and coral host. We then conducted a chi-square test and
Fisher’s exact test for a statistical association between nudibranch clades and coral hosts.
These tests calculate whether nudibranchs in a given clade come from a particular coral
host disproportionately more than expected by random sampling. If so, it indicates that
phylogenetic clades differ in their host associations, and have likely undergone ecological
divergence.
(d) Population genetic analysis
To test for geographic or ecological population structure we analyzed haplotype
frequencies using Arlequin 3.5 (Excoffier & Lischer 2010). We used the online file-
processing tool FABOX (Villesen 2007) to collapse Phestilla sequence alignments into
haplotypes. To identify haplotype groups and confirm clades from Bayesian analysis, we
created a minimum spanning tree of haplotypes based on pairwise distances using the
MINSPNET algorithm as employed in Arlequin. For both nudibranch species we color-
coded the haplotype trees by sampling locality, and for Phestilla minor also by phylogenetic
clade and coral host clades.
To determine the relative strength of geographic or ecological barriers to gene flow,
we calculated diversity indices, population pairwise Fsts, and conducted analyses of
molecular variance (AMOVA) in Arlequin, with significance determined with 10,000 random
permutations. For Phestilla minor we defined populations by both locality and coral host
clade, but for Phestilla lugubris we defined populations only by sampling locality as
sampling was too uneven across hosts. We first ran AMOVA assuming no a priori structure.
To test for geographic divergence across the Sunda Shelf we ran AMOVA with two groups;
21
Indian Ocean (Aceh and Cubadak) and Pacific Ocean (Bali, Komodo, Donggala, Bunaken,
Lembeh, and Raja Ampat). Although Bali and Komodo border the Indian Ocean,
geographically they are on the opposite side of the Sunda Shelf relative to Aceh and
Cubadak, so are included with Pacific populations. To test for population structure across
the Maluku Sea we excluded Indian Ocean populations and ran AMOVA with Raja Ampat in
a separate group from the other Pacific Ocean populations.
To test for ecological divergence among Phestilla minor populations, we ran AMOVA
grouping populations from different localities together based on their coral host. To compare
the relative influence of coral host and geography on gene flow, we calculated pairwise Fst
values for populations at the same site but on different coral hosts, and on the same host
but at different sites.
Results
Phestilla minor
We sequenced a total of 658 bp of mtDNA COI from 250 Phestilla cf minor
specimens. As Phestilla minor is known to be part of a putative cryptic species complex
(Faucci et al. 2007), here we present results from one subclade of that complex, which we
refer to as Phestilla minor, but our full analysis of all Phestilla cf minor specimens is
reported in chapter 3. For this study we analyzed COI sequences from 146 Phestilla minor
specimens (Table 1.1), representing 114 unique haplotypes. Phylogenetic analyses
revealed three distinct clades, which we have color-coded as white, black, and grey (Figure
1.2). A minimum spanning tree of the 114 haplotypes shows the same three haplotype

22
groups (Figure 1.3). The white clade only includes samples from Aceh and Cubadak on the
west side of the Sunda Shelf (Figure 1.4), and these sequences are 39 mutational steps
(7.02 %) removed from the black and grey clades (Table 1.2, Figure 1.3). The black and
gray clades, found east of the Sunda Shelf (Figure 1.4), are separated from each other by a
mean of 3.94% sequence divergence or 20 mutational steps (Table 1.2, Figure 1.3). These
clades show no association with geography, as they both contain specimens from locations
as distant as Bali in the west and Raja Ampat in the east (Figure 1.4, Figure 1.5A).
Based on the molecular clock of 2.4% sequence divergence per million years
(Hellberg & Vacquier 1999), using our calculations of mean pairwise sequence divergence
between clades (Table 1.2) we estimate that the white clade diverged from the black/grey
clade about 2.9 million years ago, and the black and grey clades diverged from each other
about 1.6 million years ago. ABGD analyses revealed a barcode gap between genetic
distances of 0.02 and 0.04 (Figure S1.1), and prior intraspecific divergence values ranging
from 0.01 to 0.04 yielded two purported species separated by the Sunda Shelf: the white
clade on one side and the black and grey clades on the other. This result was consistent for
Jukes-Cantor and Kimura corrected distances and simple distances.
Genetic diversity is generally high within sampling localities (Table 1.3). Given the
strong likelihood that speciation has already occurred across the Sunda Shelf, for
population genetic analyses we excluded Indian Ocean populations (e.g. white clade). For
Pacific Ocean samples, AMOVA with no a priori structure indicates strong population
structure (Table 1.4, ΦST = 0.40, p < 0.00001), with 40.2% of the variation among
populations and 59.8% within populations, but this could not be attributed to variation
among populations spanning the Maluku Sea (Table 1.4, ΦCT = -0.16, p = 0.67): 48.6% of

23
the variation was among populations within groups (Table 1.4, ΦSC = 0.42, p < 0.00001),
and 67.2% of the variation within populations (Table 1.4, ΦST = 0.33, p < 0.00001).
Ecological divergence
There is a strong association between the Phestilla minor grey clade and the coral
Porites cylindrica (Figure 1.2, Figure 1.5B). The distinctiveness of the host corals we
identified as Porites cylindrica was confirmed by phylogenetic analysis of 1,488 bp of
nuclear H2 region from 47 Porites hosts (Figure 1.6). Morphological variation in Porites
does not generally correspond well to genetic species identity, but the 9 hosts that were
identified as P. cylindrica in this study form a highly divergent, monophyletic clade (Figure
1.6, blue). All other Porites hosts are dispersed throughout a second, more diverse clade,
with no agreement between field identification and genetic identity (Figure 1.6, orange).
We constructed a contingency table (Table 1.5) classifying all Phestilla minor
individuals by clade (grey or black) and by host (P. cyclindrica or other Porites). Almost all
grey clade nudibranchs (14 of 15) were collected from Porites cylindrica, and the majority of
black clade nudibranchs (102 of 107) were collected from other corals (see bar graphs in
Figure 1.2). This extremely skewed distribution of nudibranch clades on specific coral hosts
indicates a very significant ecological association between the grey clade and Porites
cylindrica (Fisher’s exact test, p < 0.0001; Chi-square = 78.65, p = 7.4 x 10⁻¹⁹).
In AMOVA, we see that 58.1 % of the variation in Pacific Ocean populations of
Phestilla minor is explained by grouping based on these two coral clades (Table 1.4, ΦCT =
0.58, p < 0.00001), with only 6.10 % of the variation among populations within groups
(Table 1.4, ΦSC = 0.15, p < 0.01), and 35.8% of the variation within populations (Table 1.4,

24
ΦST = 0.64, p < 0.05). Pairwise Fsts show that within localities, populations found on Porites
cylindrica are extremely differentiated from populations from other hosts (average pairwise
Fst = 0.58, Table 1.6). In Bali the differentiation between host clades is not as high as in
Raja Ampat and Donggala. While all of the P. minor samples from Porites cylindrica in Raja
Ampat and Donggala fall into the grey nudibranch clade, in Bali they are split between the
grey and black clades. The populations from P. cylindrica are also quite differentiated from
each other (average pairwise Fst = 0.51) while populations from the orange host clade are
not at all differentiated across the 6 locations (average pairwise Fst = 0.00).
Phestilla lugubris
We sequenced 648 bp of mtDNA COI from 65 Phestilla lugubris specimens,
representing 43 unique haplotypes forming a single phylogenetic clade (Figure 1.7) and a
comparatively close-knit haplotype network (Figure 1.8). The maximum distance between
any two haplotypes in the minimum spanning tree is 5 mutational steps. The most common
haplotypes were found in all six locations broadly distributed across Indonesia (Figure 1.8),
with no clear geographic pattern.
AMOVA with no a priori groupings showed no evidence of population structure
(Table 1.7, ΦST = -0.04, p = 0.95). Further AMOVAs indicate that neither the Sunda Shelf
(Table 1.7, ΦCT = 0.01, p = 0.42) or the Maluku Sea (Table 1.7, ΦCT = -0.04, p = 0.86) act as
barriers to gene flow, and diversity within populations explains 100% of the nucleotide
variation (Table 1.7).

25
Discussion
Allopatric explanations dominate studies of speciation (Barraclough & Vogler 2000;
Coyne & Orr 2004), including those focused on the evolution of the Coral Triangle
biodiversity hotspot (see Barber et al. 2011 and Carpenter et al. 2011 for reviews).
However, results from sympatric populations of Phestilla minor showed clear evidence of
ecological divergence. On the Pacific side of the Sunda Shelf, populations of P. minor
hosted by Porites cylindrica exhibit no significant genetic structure over 1750 km of ocean,
yet they are strongly divergent from P. minor that live on other Porites hosts collected from
the exact same locality. This result confirms the suggestion by Faucci et al. (2007) that host
shifting could promote speciation in Phestilla, providing us with an exciting new system for
the study of ecological speciation in the sea.
In addition to ecological divergence, results also showed clear evidence of
geographic isolation of Phestilla minor populations on either side of the Sunda Shelf. This
pattern is commonly seen in many different marine taxa (Lavery et al. 1996; Williams &
Benzie 1998; Nelson et al. 2000; Barber et al. 2006; Crandall et al. 2008; Timm & Kochzius
2008; DeBoer et al. 2008, Simmonds 2016), and is typically attributed to the exposure of the
Sunda Shelf during periods of low sea level (Fleminger 1985). However, there was no
evidence for further phylogeographic structure east of the Sunda Shelf, including across the
Maluku Sea, a region where strong phylogeographic structure is frequently observed
(Barber et al. 2011; Carpenter et al. 2011).
Despite geography and host having a dramatic impact on Phestilla minor, the closely
related Phestilla lugubris showed no evidence of genetic structure throughout the region.
The observance of strong genetic structure in one species, but not in a closely related co-

26
distributed species is observed in populations of Nerita snails that also span the Sunda
Shelf (Crandall et al. 2007), indicating that closely related species can respond very
differently to shared geographic and ecological processes. In Phestilla, this difference is
most likely the result of differences in pelagic larval duration.
Ecological divergence
Our results suggest that Phestilla minor populations are undergoing ecological
divergence on their Porites coral hosts in sympatry. While many described morphospecies
of Porites corals are not genetically distinguishable, Porites cylindrica is distinct, and
Phestilla minor populations mirror this differentiation. The relatively high level of divergence
between sympatric Phestilla minor host races in COI, a putatively neutral marker, indicates
that coral host acts as a strong barrier to gene flow, and these populations are on their way
towards becoming separate species. This result adds to the slowly growing evidence that
ecological speciation may be an important evolutionary driver in the ocean (Rocha et al.
2005; Krug 2011; Miglietta et al. 2011).
Ecological speciation via adaptation to host is well established in phytophagous
insects (e.g. Nosil et al. 2002; Feder et al. 2005). However, host-driven ecological
speciation has only been suggested a few times in marine systems (Munday et al. 2004;
Faucci et al. 2007; Tsang et al. 2009; Hurt et al. 2013, Simmonds 2016) despite strong
parallels between plant-insect and coral-gastropod associations. Both associations involve
a parasite on a specific sessile host, and adults mate and lay eggs directly on the host. This
direct linkage between habitat preference and mate choice is important for the evolution of
reproductive isolation in sympatry (Maynard Smith 1966). Interestingly, insects are less

27
vagile as larvae and disperse as young adults, while gastropods disperse as larvae, then
tend to stay on one host coral colony for their entire adult life (Krug 2011). Research on
host-driven speciation in gastropods lags far behind that in insects, so little is known about
how this difference in life history may impact ecological divergence.
Given the close proximity of Porites cylindrica to the other Porites hosts at the
collection sites, the barrier to gene flow between nudibranch host races cannot be attributed
to geography, and must be maintained by natural selection. This selection could act at any
life stage: selection of host, metamorphosis, survival to adulthood, mate selection, or
reproductive success. Larvae hatched from P. cylindrica may not be able to successfully
recruit to or metamorphose on other Porites corals, and vice versa. Ritson-Williams et al.
(2003, 2007, 2009) tested prey choice and metamorphic competence of Phestilla species
on different corals in the lab. Phestilla minor were collected from Porites annae, and not
surprisingly, larvae had the highest rate of metamorphosis on P. annae. However, many
larvae did undergo metamorphosis using cues from other corals, including P. cylindrica, and
even in fresh seawater. It appears that Phestilla minor larvae do not require a specific host
in order to metamorphose, but they may prefer to settle on a specific host.
Alternatively, selection could act in the form of differential survival. If individuals are
unable to survive on the wrong host, a phenomenon known as immigrant inviability (Nosil &
Schluter 2011), it is unlikely that adults will ever encounter individuals originating from the
other host, and assortative mating will occur by default. This is likely in Phestilla minor,
given that we collected nudibranchs of all sizes/ages, and very few individuals were found
on a coral host mismatched with their genetic clade. It may be that populations are adapted
to eat a specific host, and unable to eat the “wrong” host. In fact, in one no-choice

28
experiment, P. minor born on Porites annae would only eat P. annae (Ritson-Williams et al.
2003).
Lastly, if some individuals do survive on the wrong host, selection could act on
reproduction. Individuals from different hosts may not be able to mate successfully, or they
may not even recognize each other as potential mates. Further experimental work on host
choice, the role of corals in metamorphosis, and mate choice is required to identify at which
stage natural selection acts.
While natural selection is crucial to the process of ecological speciation, the high
level of divergence that we see in a putatively neutral gene indicates that genetic drift is also
acting. It appears that ecologically-mediated assortative mating is already limiting gene flow,
leading to isolation by adaptation or IBA (Nosil et al. 2008; Feder et al. 2012). In the
absence of gene flow, genetic drift may obscure the signature of natural selection on the
genome, and genomic divergence due to IBA will resemble that which results from isolation
by distance (IBD). In fact, if host choice is determined by a single trait such as a chemical
cue, and the coral hosts are otherwise very similar, the effect of natural selection on the
genome could be negligible. More genetic data are needed to determine the relative roles of
genetic drift and natural selection in Phestilla minor divergence. Fortunately, advances in
sequencing have made it possible to generate huge amounts of genomic data efficiently
and relatively cheaply. Future studies on this system should use next-generation
sequencing data to determine whether natural selection has left a signature on the genome,
or if ecological speciation involves more neutral evolution than expected.

29
Geographic divergence
The divergence of Phestilla minor across the Sunda Shelf is consistent with previous
phylogeographic studies of marine invertebrates in the Coral Triangle (Lavery et al. 1996;
Williams & Benzie 1998; Barber et al. 2006; DeBoer et al. 2008, Simmonds 2016).
Divergence in marine taxa across this region is typically believed to result from periods of
lowered sea level when the Sunda shelf formed a land barrier between ocean basins (Voris
2000), although coupled bio-physical models suggest that larval dispersal and gene flow
could also be limited by ocean currents (Kool et al. 2011; Treml et al. 2015). The divergence
among clades of P. minor date to approximately 2.9 million years ago, a date that roughly
coincides with the onset of the first Pleistocene glacial cycles (Lambeck et al. 2002). We
recognize that the molecular clock rate we used may not be accurately calibrated for
Phestilla. Recent work on marine invertebrates in the Sunda Shelf region has shown that
rates of evolution are dependent on the time of calibration, and that in recent history rates
may have been elevated by population expansion (Crandall et al. 2011). The high
divergence observed between P. minor clades may be more recent than estimated, but still
falls within the time of Pleistocene glaciation. This result suggests that glacial cycles could
have promoted diversification in P. minor populations spanning the Sunda Shelf, or might
have reinforced historical barriers in this region.
An alternative, but not mutually exclusive explanation for this pattern of divergence is
that natural selection limits dispersal of P. minor across the historical Sunda Shelf barrier.
The waters of the eastern Indian Ocean are very different from the South China and Java
Seas, and if populations have adapted to these conditions, ecological barriers may remain
even though the physical barrier is gone. In certain species of Echinolittorina snails in the

30
Indo-West Pacific, local adaptation to continental or oceanic habitat restricts their
distributions (Williams & Reid 2004; Reid et al. 2006) and Crandall et al. (2007) suggested
that even small ecological differences could result in vastly different phylogeographic
structure in gastropod taxa spanning the Sunda Shelf. If P. minor larvae can disperse
across the Sunda shelf, but are maladapted and unable to recruit successfully,
environmental differences could drive diversification or reinforce historical isolation. Future
work using ecological niche modeling is required to test the hypothesis of ecological limits to
larval dispersal.
In contrast to the highly structured P. minor, populations of P. lugubris maintain
connectivity across all of Indonesia, with no evidence of divergence across well-known
biogeographic and phylogeographic breaks (Barber et al. 2011; Carpenter et al. 2011). This
result is similar to marine snails, Nerita albicilla and N. plicata, where disparate
phylogeographic patterns were attributed to differences in habitat requirements: N. plicata
lives in the high intertidal while N. albicilla lives in protected rubble fields (Crandall et al.
2007). While P. minor and P. lugubris have nearly identical habitat requirements, exploiting
identical coral hosts in lagoonal environments, they do differ in larval ecology and dispersal
ability. Larvae of P. lugubris are facultative planktotrophic and metamorphic competence
within 5 days, but with food available can remain in the plankton for as long as 42 days
(Kempf & Hadfield 1985; Miller & Hadfield 1986; Faucci et al. 2007; Ritson-Williams et al.
2007, 2009). The larvae of P. minor are lecithotrophic and reach metamorphic competence
within 3 days, sometimes as fast as 1 day (Faucci et al. 2007, Ritson-Williams et al. 2007,
2009). The longer PLD of P. lugubris may have reestablished gene flow between ocean
basins when sea levels rose. Alternatively, P. lugubris may have gone extinct on one side of

31
the Sunda Shelf land bridge, and its current widespread distribution a result of secondary
colonization in more recent history, while P. minor survived on both sides and underwent
allopatric speciation. More genetic information is needed to determine the full demographic
history of this panmictic species.
Speciation in the sea
It is well established that geographic limits to dispersal contribute to divergence and
speciation in the Coral Triangle (Barber 2009, Carpenter et al. 2011, Treml et al. 2015).
However, allopatric explanations may be insufficient to explain speciation and the incredibly
high biodiversity of the region. Neither the Sunda Shelf nor Halmahera Eddy are hard
dispersal barriers. The majority of the Coral Triangle region was still open-ocean during
Pleistocene glacial maxima (Voris 2000), and periods of lowered sea levels were also
ephemeral (Lambek et al. 2002). As such, even if populations were isolated during periods
of lowered sea level, gene flow should resume once sea levels rise again, potentially
erasing diversification in neutral loci that occurred in allopatry. However, ABGD results
indicate that these two clades are likely separate species. If environmental differences were
sufficiently large on either side of the Sunda Shelf, ecological divergence could reinforce
incipient allopatric divergence. The accessibility of genomic tools and marine environmental
databases (e.g. Sbrocco & Barber 2013) will make it possible to test this hypothesis in the
future.
While ecology may reinforce allopatric divergence, the results of this study clearly
show that ecological barriers can also operate in sympatry. Distinct clades of P. minor are
strongly differentiated by coral host associations despite gene flow being maintained within

32
these clades across long distances. Gene flow is even maintained across well-known
phylogeographic barriers like the Maluku Sea (Barber et al. 2006, Barber et al. 2011). Thus,
the only reasonable explanation for our results is that P. minor is undergoing sympatric,
ecological divergence throughout the Coral Triangle. Given the prevalence of strong host
associations in coral reef environments, it is likely that there are many more examples of
ecological divergence in this region, multiplying the potential for diversification in the Coral
Triangle. It is important for future marine speciation research to move beyond purely
allopatric explanations of diversification and begin to explore the potential role of ecological
differences in driving speciation in the sea.

33
TABLES AND FIGURES Table 1.1. List of populations and sample sizes used for phylogeographic analyses, with coral host as labeled in the field based on visual identification.
Host species Phestilla lugubris Phestilla minor West of Sunda Shelf 1. Aceh
Porites lobata 9
7
2. Cubadak Porites lobata Porites lutea Porites sp.
7 6
5 9 2
East of Sunda Shelf West of Moluku Sea 3. Bali
Porites lobata Porites lutea Porites attenuata Porites cylindrica Porites sp.
10 2
1
13 14 2 6 2
4. Komodo Porites lobata Porites annae
11 2
5. Donggala Porites lobata Porites cylindrica
6 0
19 10
6. Bunaken Porites lobata Porites lutea Porites cylindrica
13 2
13 4 0
7. Lembeh Porites lobata Porites lutea
4
10 4
East of Moluku Sea 8. Raja Ampat
Porites lobata Porites lutea Porites cylindrica
5 1
9 1 3
Total 66 146 Table 1.2. Phestilla minor divergence time estimates, based on molecular clock of 2.4% sequence divergence per million years (Hellberg and Vacquier 1999).
White clade vs. grey/black Grey vs. black Mean sequence identity 92.98 96.06 Mean sequence divergence 7.02 3.94 Divergence time 2.92 1.64

34
Table 1.3. Summary statistics by locality for Phestilla lugubris and Phestilla minor. Haplotype diversity (h), nucleotide diversity (π), and θs caluculated in Arlequin. One P. minor sample from Komodo (Komo_06.03) was excluded because it belongs to the subspecies found in Aceh and Cubadak.
Table 1.4. AMOVA results for Phestilla minor Pacific populations. Within localities, all samples collected from Porites cylindrica were treated as one population and all samples collected from other hosts are treated as another population. We first ran AMOVA with no a priori groups, then grouped populations east and west of the Maluku Sea, then grouped by coral host. Significant F statistics (p <0.05) shown in bold.
Among groups Among populations within groups
Within populations
df Var %Var FCT df Var %Var FSC df Var %Var FST None 8 2.07 40.2 113 3.08 59.8 0.40 Maluku Sea 1 -0.73 -15.8 -0.16 7 2.23 48.6 0.42 113 3.08 67.2 0.33 Coral host 1 5.00 58.1 0.58 7 0.53 6.10 0.15 113 3.08 35.8 0.64
Table 1.5. Contingency table to test association between Phestilla minor clades and coral host clades. Fisher’s exact test p < 0.0001; Chi-square test, C2 = 78.65, p = 7.4 x 10⁻¹⁹.
Clade Porites (other) Porites cylindrica
Total
P. minor– black 102 5 107 P. minor– grey 1 14 15 Total 103 19 122
Table 1.6. Pairwise Fsts between populations on different corals at the same locality. Significant Fsts (p <0.05) shown in bold.
Phestilla lugubris Phestilla minor Locality N h π θs N h π θs 1. Aceh 9 0.972 0.009 5.887 7 1.000 0.010 3.808 2. Cubadak 13 0.974 0.009 7.412 16 1.000 0.009 8.137 3. Bali 13 1.000 0.010 8.056 37 0.964 0.012 15.091 4. Komodo 12 1.000 0.010 8.278 5. Donggala 6 1.000 0.011 7.007 29 0.958 0.022 13.750 6. Bunaken 15 0.895 0.007 5.536 17 0.993 0.008 9.170 7. Lembeh 4 1.000 0.008 5.455 14 1.000 0.008 8.805 8. Raja Ampat 6 0.867 0.007 4.818 13 0.987 0.018 12.568
Bali other Donggala other Raja Ampat other Bali cylindrica 0.161 Donggala cylindrica 0.739 Raja Ampat cylindrica 0.838
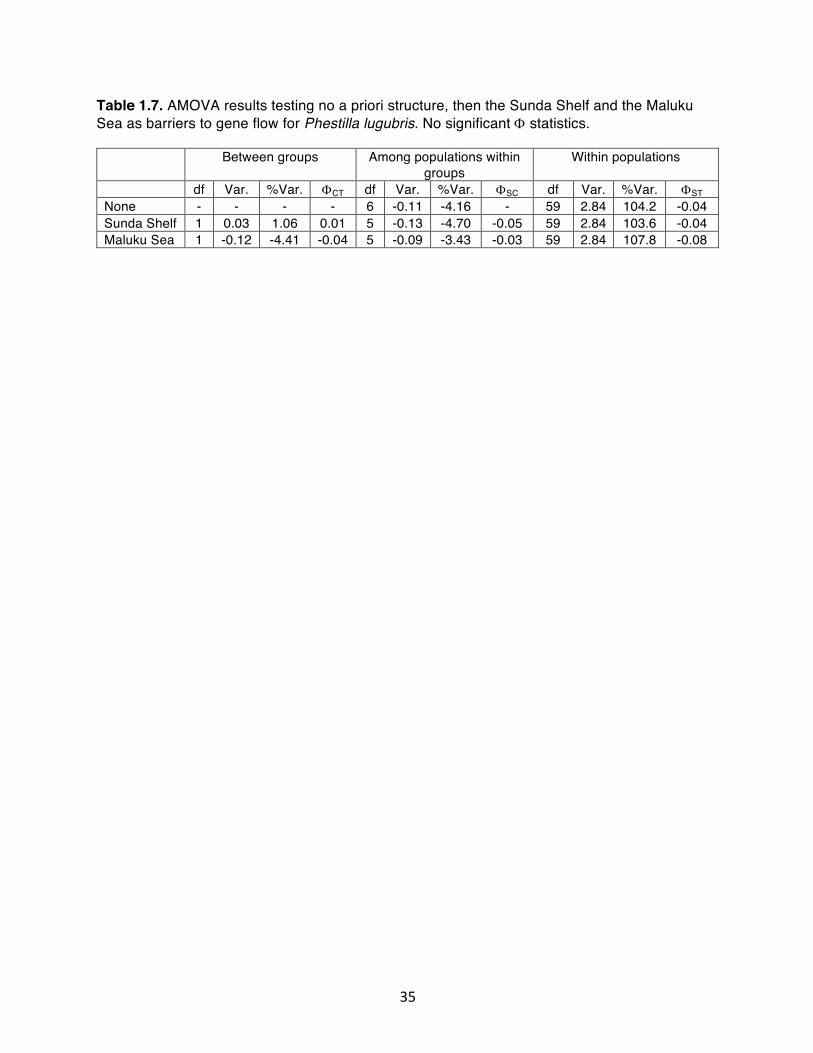
35
Table 1.7. AMOVA results testing no a priori structure, then the Sunda Shelf and the Maluku Sea as barriers to gene flow for Phestilla lugubris. No significant F statistics.
Between groups Among populations within groups
Within populations
df Var. %Var. FCT df Var. %Var. FSC df Var. %Var. FST None - - - - 6 -0.11 -4.16 - 59 2.84 104.2 -0.04 Sunda Shelf 1 0.03 1.06 0.01 5 -0.13 -4.70 -0.05 59 2.84 103.6 -0.04 Maluku Sea 1 -0.12 -4.41 -0.04 5 -0.09 -3.43 -0.03 59 2.84 107.8 -0.08

36
Figure 1.1. Sampling localities.
Figure 1.2. Bayesian phylogenetic tree for 146 Phestilla minor COI sequences. Node values show Bayesian posterior probability on top and maximum likelihood (ML) bootstrap proportion on bottom. Graphs show for each of the three clade the percent of samples collected from each host clade.

37
Figure 1.3. Minimum spanning tree of 114 Phestilla minor COI haplotypes. Node size corresponds to haplotype frequency, ranging from 1 to 10, and line length corresponds to mutational steps between each haplotype. Colors correspond to clades in Figure 2.

38
Figure 1.4. Phestilla minor haplotype map. Pie charts show proportion of haplotypes from each of the three clades shown in Figures 2 and 3. Size of pie charts is proportional to samples size.

39
Figure 1.5. Minimum spanning tree of 114 Phestilla minor COI haplotypes. Node size corresponds to haplotype frequency, ranging from 1 to 10, and line length corresponds to mutational steps between each haplotype. Colors correspond to A) sampling location and B) coral host clade.
A)
B)

40
Figure 1.6. Maximum likelihood tree of 47 H2 sequences from Porites hosts of Phestilla minor and/or P. lugubris. Node values show Bayesian posterior probability on top and ML bootstrap proportion on bottom.

41
Figure 1.7. Bayesian phylogenetic tree of 66 Phestilla lugubris COI sequences. Node values show Bayesian posterior probability on top and ML bootstrap proportion on bottom.
Figure 1.8. Minimum spanning tree of 43 Phestilla lugubris COI haplotypes. Node size corresponds to haplotype frequency, ranging from 1 to 12, and line length corresponds to mutational steps between each haplotype. Colors correspond to sampling location.

42
Supplement Figure S1.1. ABGD results for 146 Phestilla minor COI sequences. Intraspecific genetic distances shown in orange, interspecific distances shown in yellow.

43
REFERENCES
Alfaro ME, Santini F, Brock CD (2007) Do reefs drive diversification in marine teleosts? Evidence from the pufferfish and their allies (order tetraodontiformes). Evolution, 61, 2104–2126.
Barber PH (2009) The challenge of understanding the Coral Triangle biodiversity hotspot.
Journal of Biogeography, 36, 1845–1846. Barber PH, Bellwood DR (2005) Biodiversity hotspots: Evolutionary origins of biodiversity in
wrasses (Halichoeres: Labridae) in the Indo-Pacific and new world tropics. Molecular Phylogenetics and Evolution, 35, 235–253.
Barber P, Cheng S, Erdmann M, Tengardjaja K (2011) Evolution and conservation of
marine biodiversity in the Coral Triangle: insights from Stomatopod Crustacea. Crustacean Issues, 19, 129–156.
Barber PH, Erdmann M V, Palumbi SR (2006) Comparative phylogeography of three
codistributed stomatopods: origins and timing of regional lineage diversification in the Coral Triangle. Evolution, 60, 1825–1839.
Barber PH, Meyer CP (2015) Pluralism explains diversity in the Coral Triangle. In: Ecology
of Fishes on Coral Reefs (ed Sale P), pp. 258–263. Elsevier. Barber PH, Palumbi SR, Erdmann M V., Moosa MK (2002) Sharp genetic breaks among
populations of Haptosquilla pulchella (Stomatopoda) indicate limits to larval transport: Patterns, causes, and consequences. Molecular Ecology, 11, 659–674.
Barraclough T, Vogler A (2000) Detecting the Geographical Pattern of Speciation from
Species-Level Phylogenies. The American Naturalist, 155, 419–434. Berlocher SH, Feder JL (2002) Sympatric speciation in phytophagous insects: moving
beyond controversy? Annual Review of Entomology, 47, 773–815. Bowen BW, Rocha LA, Toonen RJ, Karl SA (2013) The origins of tropical marine
biodiversity. Trends in Ecology and Evolution, 28, 359–366. Brawand D, Wagner CE, Li YI et al. (2014) The genomic substrate for adaptive radiation in
African cichlid fish. Nature, 513, 375–381. Briggs JC. (1992) The Marine East Indies : Centre of Origin? Global Ecology and
Biogeography, 2, 149–156. Bush GL (1994) Sympatric speciation in animals: New wine in old bottles. Trends in Ecology
and Evolution, 9, 285–288.
44
Carpenter KE, Barber PH, Crandall ED et al. (2011) Comparative Phylogeography of the Coral Triangle and Implications for Marine Management. Journal of Marine Biology, 2011, 1–14.
Coyne J, Orr HA (2004) Speciation. Sinauer Associates, Sunderland, MA. Crandall ED, Frey MA, Grosberg RK, Barber PH (2007) Contrasting demographic history
and phylogeographical patterns in two Indo-Pacific gastropods. Molecular Ecology, 17, 611–626.
Crandall ED, Jones ME, Muñoz MM et al. (2008) Comparative phylogeography of two
seastars and their ectosymbionts within the Coral Triangle. Molecular Ecology, 17, 5276–5290.
Crandall ED, Sbrocco EJ, Deboer TS, Barber PH, Carpenter KE (2011) Expansion Dating:
Calibrating Molecular Clocks in Marine Species from Expansions onto the Sunda Shelf Following the Last Glacial Maximum. Molecular Biology and Evolution, 1, 1–13.
Darriba D, Taboada GL, Doallo R, Posada D (2012) jModelTest 2: more models, new
heuristics and parallel computing. Nature Methods, 9, 772–772. DeBoer TS, Subia MD, Ambariyanto et al. (2008) Phylogeography and limited genetic
connectivity in the endangered boring giant clam across the coral triangle. Conservation Biology, 22, 1255–1266.
Dres M, Mallet J (2002) Host races in plant-feeding insects and their importance in
sympatric speciation. Philosophical Transactions of the Royal Society B: Biological Sciences, 357, 471–492.
Ekman S (1953) Zoogeography of the Sea. Sidgwick and Jackson Limited, London. Excoffier L, Lischer HEL (2010) Arlequin suite ver 3.5: A new series of programs to perform
population genetics analyses under Linux and Windows. Molecular Ecology Resources, 10, 564–567.
Faucci A, Toonen RJ, Hadfield MG (2007) Host shift and speciation in a coral-feeding
nudibranch. Proceedings of the Royal Society B: Biological Sciences, 274, 111–119. Feder JL, Egan SP, Nosil P (2012) The genomics of speciation-with-gene-flow. Trends in
Genetics, 28, 342–350. Feder JL, Xie X, Rull J et al. (2005) Mayr, Dobzhansky, and Bush and the complexities of
sympatric speciation in Rhagoletis. Proceedings of the National Academy of Sciences of the United States of America, 102 Suppl, 6573–80.

45
Filchak KE, Roethele JB, Feder JL (2000) Natural selection and sympatric divergence in the apple maggot Rhagoletis pomonella. Nature, 407, 739–742.
Fleminger A (1985) The Pleistocene equatorial barrier between the Indian and Pacific
oceans and a likely cause for Wallace’s line. UNESCO Technical Papers in Marine Science, 49, 84–97.
Folmer O, Black M, Hoeh W, Lutz R, Vrijenhoek R (1994) DNA primers for amplification of
mitochondrial cytochrome c oxidase subunit I from diverse metazoan invertebrates. Molecular Marine Biology and Biotechnology, 3, 294–9.
Forsman ZH, Barshis DJ, Hunter CL, Toonen RJ (2009) Shape-shifting corals: molecular
markers show morphology is evolutionarily plastic in Porites. BMC evolutionary biology, 9, 45.
Gosliner TM, Draheim R (1996) Indo-Pacific opisthobranch gastropod biogeography: How
do we know what we don’t know? American Malacological Bulletin, 12, 37–43. Gosliner TM, Valdés Á, Behrens DW (2015) Nudibranch & Sea Slug Identification: Indo-
Pacific. New World Publications. Guindon S, Gascuel O (2003) A simple, fast, and accurate algorithm to estimate large
phylogenies by maximum likelihood. Systematic biology, 52, 696–704. Hadfield MG, Koehl M a R (2004) Rapid behavioral responses of an invertebrate larva to
dissolved settlement cue. Biological Bulletin, 207, 28–43. Hadfield M, Pennington J (1990) Nature of the metamorphic signal and its internal
transduction in larvae of the nudibranch Phestilla sibogae. Bulletin of Marine Science, 46, 455–464.
Hellberg ME, Vacquier VD (1999) Rapid evolution of fertilization selectivity and lysin cDNA
sequences in teguline gastropods. Molecular Biology and Evolution, 16, 839–48. Hobbs J-PA, Frisch AJ, Allen GR, Van Herwerden L (2009) Marine hybrid hotspot at Indo-
Pacific biogeographic border. Biology Letters, 5, 258–61. Hurt C, Silliman K, Anker A, Knowlton N (2013) Ecological speciation in anemone-
associated snapping shrimps (Alpheus armatus species complex). Molecular Ecology, 22, 4532–4548.
Jensen KR (1997) Evolution of the Sacoglossa (Mollusca, Opisthobranchia) and the
ecological associations with their food plants. Evolutionary Ecology, 11, 301–335. Jokiel P, Martinelli F (1992) The vortex model of coral reef biogeography. Journal of
Biogeography, 19, 449–458.

46
Kearse M, Moir R, Wilson A et al. (2012) Geneious Basic: An integrated and extendable
desktop software platform for the organization and analysis of sequence data. Bioinformatics, 28, 1647–1649.
Kempf SC, Hadfield MG (1985) Planktotrophy by the Lecithotrophic Larvae of a Nudibranch,
Phestilla sibogae (Gastropoda). Biological Bulletin, 169, 119–130. Knowlton N, Keller BD (1986) Larvae which fall short of their potential: highly localized
recruitment in an alpheid shrimp with extended larval development. Bulletin of Marine Science, 39, 213–223.
Kool JT, Paris CB, Barber PH, Cowen RK (2011) Connectivity and the development of
population genetic structure in Indo-West Pacific coral reef communities. Global Ecology and Biogeography, 20, 695–706.
Krug PJ (2011) Patterns of speciation in marine gastropods: A review of the phylogenetic
evidence for localized radiations in the sea. American Malacological Bulletin, 29, 169–186.
Ladd HS (1960) Origin of the Pacific island molluscan fauna. American Journal of Science,
258–A, 137–150. Lambeck K, Esat TM, Potter E-K (2002) Links between climate and sea levels for the past
three million years. Nature, 419, 199–206. Lavery S, Moritz C, Fielder DR (1996) Indo-Pacific population structure and evolutionary
history of the coconut crab Birgus latro. Molecular Ecology, 5, 557–570. Marques DA, Lucek K, Meier JI et al. (2016) Genomics of Rapid Incipient Speciation in
Sympatric Threespine Stickleback (G Coop, Ed,). PLOS Genetics, 12, 1–34. Matsubayashi KW, Ohshima I, Nosil P (2010) Ecological speciation in phytophagous
insects. Entomologia Experimentalis et Applicata, 134, 1–27. Maynard Smith J (1966) Sympatric speciation. American Naturalist, 637-650. McMillan WO, Palumbi SR (1995) Concordant evolutionary patterns among Indo-West
Pacific butterflyfishes. Proceedings of the Royal Society B: Biological Sciences, 260, 229–236.
Meyer CP, Geller JB, Paulay G (2005) Fine scale endemism on coral reefs: archipelagic
differentiation in turbinid gastropods. Evolution, 59, 113–125. Miglietta MP, Faucci A, Santini F (2011) Speciation in the sea: Overview of the symposium
and discussion of future directions. Integrative and Comparative Biology, 51, 449–455.
47
Miller SE, Hadfield MG (1986) Ontogeny of phototaxis and metamorphic competence in
larvae of the nudibranch Phestilla sibogae Bergh (Gastropoda : Opisthobranchia). Journal of Experimental Marine Biology and Ecology, 97, 95–112.
Munday PL, Van Herwerden L, Dudgeon CL (2004) Evidence for Sympatric Speciation by
Host Shift in the Sea. Current Biology, 14, 1498–1504. Nelson JS, Hoddell RJ, Chou LM, Chan WK, Phang VPE (2000) Phylogeographic structure
of false clownfish, Amphiprion ocellaris , explained by sea level changes on the Sunda shelf. Marine Biology, 137, 727–736.
Nosil P, Crespi BJ, Sandoval CP (2002) Host-plant adaptation drives the parallel evolution
of reproductive isolation. Nature, 417, 440–443. Nosil P, Egan SP, Funk DJ (2008) Heterogeneous genomic differentiation between walking-
stick ecotypes: “Isolation by adaptation” and multiple roles for divergent selection. Evolution, 62, 316–336.
Nosil P, Schluter D (2011) The genes underlying the process of speciation. Trends in
Ecology and Evolution, 26, 160–167. Palumbi SR (1994) Genetic divergence, reproductive isolation, and marine speciation.
Annual Review of Ecology and Systematics, 25, 547–572. Palumbi SR (1997) Molecular biogeography of the Pacific. Coral Reefs, 16, S47–S52. Puillandre N, Lambert A, Brouillet S, Achaz G (2012) ABGD, Automatic Barcode Gap
Discovery for primary species delimitation. Molecular Ecology, 21, 1864–1877. Putz A, König GM, Wägele H (2010) Defensive strategies of Cladobranchia (Gastropoda,
Opisthobranchia). Natural Product Reports, 27, 1386–1402. Reid DG, Lal K, Mackenzie-Dodds J et al. (2006) Comparative phylogeography and species
boundaries in Echinolittorina snails in the central Indo-West Pacific. Journal of Biogeography, 33, 990–1006.
Ritson-Williams R, Shjegstad S, Paul V (2003) Host specificity of four corallivorous Phestilla
nudibranchs (Gastropoda: Opisthobranchia). Marine Ecology Progress Series, 255, 207–218.
Ritson-Williams R, Shjegstad SM, Paul VJ (2007) Larval metamorphic competence in four
species of Phestilla (Gastropoda; Opisthobranchia). Journal of Experimental Marine Biology and Ecology, 351, 160–167.

48
Ritson-Williams R, Shjegstad SM, Paul VJ (2009) Larval metamorphosis of Phestilla spp. in response to waterborne cues from corals. Journal of Experimental Marine Biology and Ecology, 375, 84–88.
Rocha LA, Bowen BW (2008) Speciation in coral-reef fishes. Journal of Fish Biology, 72,
1101–1121. Rocha LA, Robertson DR, Roman J, Bowen BW (2005) Ecological speciation in tropical reef
fishes. Proceedings of the Royal Society B: Biological Sciences, 272, 573–579. Ronquist F, Huelsenbeck JP (2003) MrBayes 3: Bayesian phylogenetic inference under
mixed models. Bioinformatics, 19, 1572–1574. Ronquist F, Teslenko M, van der Mark P et al. (2012) MrBayes 3.2: Efficient Bayesian
Phylogenetic Inference and Model Choice Across a Large Model Space. Systematic Biology, 61, 539–542.
Rudman WB (1982) The taxonomy and biology of further aeolidacean and arminacean
nudibranch molluscs with symbiotic zooxanthellae. Zoological Journal of the Linnean Society, 74, 147–196.
Sbrocco EJ, Barber PH (2013) MARSPEC: Ocean climate layers for marine spatial ecology.
Ecology, 94, 979. Scheltema RS (1971) Larval dispersal as a means of genetic exchange between
geographically separated populations of shallow-water benthic marine gastropods. The Biological Bulletin, 140, 284.
Scheltema RS (1988) Initial Evidence for the Transport of Teleplanic Larvae of Benthic
Invertebrates across the East Pacific Barrier. Biological Bulletin, 174, 145. Schliewen UK, Tautz D, Paabo S (1994) Sympatric speciation suggested by monophyly of
crater lake cichlids. Nature, 368, 629–632. Selkoe K a., Toonen RJ (2011) Marine connectivity: A new look at pelagic larval duration
and genetic metrics of dispersal. Marine Ecology Progress Series, 436, 291–305. Shanks AL, Grantham B a., Carr MH (2003) Propagule dispersal distance and the size and
spacing of marine reserves. Ecological Applications, 13, 159–169. Siegel DA, Kinlan BP, Gaylord B, Gaines SD (2003) Lagrangian descriptions of marine
larval dispersion. Marine Ecology Progress Series, 260, 83–96. Simmonds S (2016) Genomic Signatures of Natural Selection and Geographic Isolation in
Corallivorous Snails. (Doctoral dissertation). Retrieved from eSchholarship. http://escholarship.org/uc/item/4xs0b56d
49
Timm J, Kochzius M (2008) Geological history and oceanography of the Indo-Malay
Archipelago shape the genetic population structure in the false clown anemonefish (Amphiprion ocellaris). Molecular Ecology, 17, 3999–4014.
Treml EA, Roberts J, Halpin PN, Possingham HP, Riginos C (2015) The emergent
geography of biophysical dispersal barriers across the Indo-West Pacific. Diversity and Distributions, 21, 465–476.
Tsang LM, Chan BKK, Shih FL, Chu KH, Allen Chen C (2009) Host-associated speciation in
the coral barnacle Wanella milleporae (Cirripedia: Pyrgomatidae) inhabiting the Millepora coral. Molecular Ecology, 18, 1463–1475.
Veron JEN, Devantier LM, Turak E, Green AL (2007) Delineating the Coral Triangle. Global
Biodiversity, 1–14. Via S, Ouck AMYCB, Killman STS (2000) Reproductive Isolation Between Divergent Races
of Pea Aphids on Two Hosts . Ii . Selection Against Migrants and Hybrids in the Parental Environments. Evolution, 54, 1626–1637.
Villesen P (2007) FaBox: An online toolbox for FASTA sequences. Molecular Ecology
Notes, 7, 965–968. Voris HK (2000) Maps of Pleistocene sea levels in Southeast Asia: shorelines, river
systems and time durations. Journal of Biogeography, 27, 1153–1167. Wägele H (2004) Potential key characters in Opisthobranchia (Gastropoda, Mollusca)
enhancing adaptive radiation. Organisms Diversity and Evolution, 4, 175–188. Wagele H, Willan R (2000) Phylogeny of the Nudibranchia. Zoological Journal Of The
Linnean Society, 130, 83–181. Williams S, Benzie J (1998) Evidence of a biogeographic break between populations of a
high dispersal starfish: Congruent regions within the Indo-West Pacific defined by color morphs, mtDNA, and allozyme data. Evolution, 52, 87–99.
Williams S, Reid DG (2004) Speciation and Diversity on Tropical Rocky Shores : a Global
Phylogeny of Snails of the Genus Echinolittorina. Evolution, 58, 2227–2251. Woodland DJ (1983) Richness patterns. Zoology, 33, 713–717.

50
CHAPTER 2
The relative roles of natural selection and limits to gene flow in genomic divergence of
coral-associated nudibranchs
Introduction
After more than a century of study, speciation remains one of the most intriguing and
studied processes in biology. The key to understanding speciation is in understanding the
underlying processes driving the evolution of reproductive isolation (Mayr 1963). The most
commonly invoked and conceptually simple speciation process is allopatric divergence—
reproductive isolation resulting from extended physical isolation of populations (Coyne & Orr
2004). However, a growing body of research is challenging this traditional view of
speciation, indicating instead that natural selection can drive population divergence and
lead to reproductive isolation in sympatry (Rosenzweig 1978; Schliewen et al. 1994; Bush
1994; Dieckmann & Doebeli 1999; Smadja & Butlin 2011; Gavrilets 2014).
One of the most commonly proposed mechanisms for sympatric speciation is
ecological speciation, where reproductive isolation and diversification is driven by
differential selection between ecological niches (Rundle & Nosil 2005; Schluter 2009).
Examples of ecological speciation span the tree of life, ranging from bacteria (Lassalle et al.
2015), to plants (Lowry et al. 2008; Mitsui et al. 2011; Andrew et al. 2012; Osborne et al.
2013; Papadopulos et al. 2013; Roda et al. 2013), and vertebrates (Smith 1997; Rundle et
al. 2000; Parchman et al. 2006; Rice et al. 2009; Nunes et al. 2011; Ballentine et al. 2013;
Muñoz et al. 2013; Sanders et al. 2013; Brawand et al. 2014).
51
Our expanded understanding of the relative roles of allopatric and sympatric
speciation is largely due to advances in genomic techniques that allow the identification of
cryptic sympatric divergence in wild populations (Peccoud et al. 2009; Garvin et al. 2010). In
addition, new theoretical models are helping us understand the relative roles of genetic drift
and natural selection through the unique signatures that these different processes leave on
the genome (Beaumont & Balding 2004; Via & West 2008; Nosil 2009; Pinho & Hey 2010;
Feder et al. 2012). Importantly, genome-wide data allow the detection of genetic signals of
adaptive divergence when populations are still connected by gene flow, providing new
insight into the first steps of ecological speciation, much like phylogeography provides
insights on nascent allopatric divergence.
Ecological divergence is often proposed as an early stage of "speciation-with-gene-
flow” (Feder et al. 2012). However, ecological speciation requires that ecological divergence
culminates in reproductive isolation (Orr & Smith 1998; Hendry 2009). Reproductive
isolation happens most rapidly when the trait on which natural selection acts directly
influences mate choice. For example, in swamp sparrows, the ecological differences
between tidal marsh and terrestrial habitats are associated with divergent selection on bill
length (Grenier & Greenberg 2005). These changes in bill morphology affect song
production, impacting mate recognition (Ballentine et al. 2013), and allowing sexual
selection to reinforce ecological divergence that may ultimately result in reproductive
isolation. Such traits that result from selection based on ecological conditions but also
promote nonrandom mating have been dubbed “magic traits” (Thibert-Plante & Gavrilets
2013) as they have the necessary ingredients to promote rapid reproduction isolation and
speciation based on ecological differences.

52
While magic traits may seem rare, under a broad definition they also include
extrinsic associations between ecology and mate choice (Servedio et al. 2011). Host-
parasite relationships are a prime example. When mating is limited to other individuals on
the same host, assortative mating automatically accompanies host preference, promoting
the evolution of reproductive isolation. Ecological speciation via host range expansion or
host shifting has been most commonly demonstrated in phytophagous insects (Hawthorne
& Via 2001; Nice et al. 2002; Janz & Nylin 2008; Apple et al. 2010; Singer & McBride 2010;
Midamegbe et al. 2011; Powell et al. 2014; Soria-Carrasco et al. 2014) but also in other
taxa such as fungal pathogens (Silva et al. 2012), coral-dwelling barnacles (Tsang et al.
2009), snails (Simmonds 2016), and nudibranchs (Faucci et al. 2007, Fritts-Penniman et al.
in prep). These latter marine examples all involve adults with low mobility, so wherever
larvae initially settle is where they will find a mate.
Of course, host-mediated assortative mating is not enough to cause speciation.
Even if mate choice is restricted to other individuals on the same host, if individuals
disperse and settle randomly each generation and host choice has no fitness consequence,
host races cannot diverge. Divergence can only occur if individuals associated with specific
hosts have traits that are better suited to a specific host, leading to differential survival and
reproduction on different hosts (Matsubayashi et al. 2010). In this case, selection will favor
settlement onto the host for which an individual is best equipped, ultimately resulting in
ecological speciation.
Key to the process of ecological divergence across hosts is the relative influence of
selection and gene flow, which have different effects on the genome. If migration between
hosts is initially common, but selection acts on a few traits and genetic loci, adaptive

53
divergence will precede neutral divergence, and the genes under selection may be
identified as highly diverged relative to the background level of gene flow occurring at other
loci, resulting in “genomic islands of divergence” (Michel et al. 2010). Over time, divergence
hitchhiking can cause these islands to grow, so the amount of time under selection greatly
influences these genomic signatures (Via 2012). However, if selection simultaneously acts
on many genes spread across the genome, divergence hitchhiking may rapidly become
genome hitchhiking, where we see “continents” rather than “islands” of divergence (Feder et
al. 2012), and the overall effect on the genome can resemble that of genetic drift alone. In
either case, eventually selection for host preference and the accompanying assortative
mating will result in the host races becoming reproductively isolated.
In contrast, if host preference acts to automatically isolate populations, the effect of
selection may be negligible, as the lack of gene flow and subsequent genetic drift will
promote neutral genetic differentiation across the genome (Smadja & Butlin 2011; Bird et al.
2012). For example, the initial mutation that promotes settlement onto a new host could
include a preference for or an adaptive advantage on that host, and selection on future
generations will already favor host specificity. In this case, adaptive and neutral divergence
would occur simultaneously, and speciation could proceed rapidly (Thibert-Plante & Hendry
2010). As such, it is important to have a broad view of genetic differentiation associated with
ecological speciation. It is well known that the neutral process of genetic drift contributes
greatly to allopatric speciation, and that divergent natural selection is a critical component of
ecological speciation (Rundle & Nosil 2005). However, if ecological divergence occurs
between discrete microhabitats such as hosts, and this habitat specificity acts as a strong
barrier to gene flow from the start, genetic drift could also play an important role in

54
ecological divergence. Meanwhile, different selective pressures on either side of a
geographic barrier are likely to contribute to allopatric divergence. As a result, allopatric and
ecological diversification may not be as fundamentally different as the literature suggests
(Orr & Smith 1998).
The coral associated nudibranch Phestilla minor feeds, lives, and mates upon
Porites corals in the Indo-Pacific Ocean. Previous work on mitochondrial COI shows that
populations collected west and east of the Sunda Shelf are divergent enough to be
considered two species, allopatric divergence that likely resulted from geographic isolation
during low sea level stands (Fritts-Penniman et al. in prep). However, within populations
east of the Sunda Shelf, there are two divergent clades of P. minor that live on different host
coral clades, a pattern consistent with ecological divergence. As such this group of
nudibranchs is an ideal system in which to test whether sympatric, ecological divergence
leaves a different signature on the genome than allopatric divergence.
In this paper, we examine patterns of genomic divergence between lineages of
Phestilla minor that are isolated either by geographic barriers or by host. Specifically, we
test the hypothesis that natural selection plays a larger role in divergence among host
lineages than among geographic lineages. To determine the relative roles of natural
selection and neutral evolution in host-driven divergence compared to allopatric divergence,
we conducted genome scans independently on population pairs comprised of either a)
sympatric populations on different hosts, or b) allopatric populations on the same host. We
use outlier tests to show that while allopatric divergence and sympatric ecological
divergence can leave similar signatures on the genome, the repeated occurrence of specific
loci under selection distinguishes the process of ecological speciation.

55
Methods
To test the relative importance of geographic and ecological barriers to gene flow in
Phestilla minor, we collected specimens from 8 localities in Indonesia that span the Sunda
Shelf, with Aceh and Cubadak on the west side, and Bali, Komodo, Donggala, Bunaken,
Lembeh, and Raja Ampat on the east side (Figure 2.1). Nudibranch specimens were
collected by hand, photographed, relaxed on ice, and stored in ethanol or RNALater.
We field identified the Porites corals from which we collected nudibranchs. However,
because Porites corals are notorious for having incomplete species boundaries, we grouped
coral hosts into two previously established clades: clade 1- Porites lobata, Porites annae,
Porites attenuata, Porites lutea; clade 2- Porites cylindrica (Fritts-Penniman et al. in prep).
To confirm coral field identifications, we took coral tissue samples to genetically assess the
membership of Porites samples to each of these two clades.
We extracted DNA from ethanol preserved nudibranchs using Qiagen DNeasy tissue
kits and Omega E.Z.N.A. Mollusc DNA kits. We isolated foot tissue for extraction when
possible, but for individuals smaller than 5 mm, we used half the body, and for those smaller
than 2 mm we used the entire body. We excluded cerata (the projections of the gut covering
the bodies of most aeolid nudibranchs) from the DNA extractions as they often contain
recently ingested coral tissue (Rudman 1982).
We used reduced representation sequencing to simultaneously discover and
genotype single nucleotide polymorphisms (SNPs). Specifically, we used a restriction site-
associated (RAD) method developed by Wang et al. (2012). RAD sequencing facilitates
genome-wide genotyping at a reduced cost through targeted sequencing of short fragments

56
surrounding recognition sites of a restriction endonuclease. The chosen method is called
2b-RAD for its use of a type IIB restriction enzyme. The enzyme cleaves the DNA upstream
and downstream of the recognition site throughout the genome, producing 35 basepair
fragments of the same loci across all individuals. These fragments were amplified and
tagged with sample-specific barcodes, then random combinations of 12-17 individuals were
pooled with normalized concentrations and run in a single lane of the Illumina HiSeq2000,
generating approximately 15 million 50 bp single end reads per sample.
We trimmed, assembled, filtered, and genotyped the sequence data using a custom
set of Perl scripts written for 2b-RAD by Wang et al. (2012). This protocol simultaneously
ascertains and genotypes SNPs, eliminating the risk of ascertainment bias. Without a
reference genome, we were concerned about DNA contamination from ingested coral tissue
in the small samples from which we extracted DNA from the entire body. To eliminate that
risk, we built the de novo reference scaffold using a subset of samples from which the DNA
had been extracted only from foot tissue. We filtered loci for: 10x coverage, 30% missing
individuals, and repetitive sites, then randomly selected one SNP per RAD tag to avoid
linkage. We then used VCFtools (Danecek et al. 2011) to remove individuals with higher
than 50% missing genotypes. These moderate thresholds ensured that we retained as
many informative loci as possible to fully understand patterns of genomic divergence among
sampled populations.
To test for genome-wide population structure of Phestilla minor among coral hosts
and sampling sites we used ADMIXTURE (Alexander et al. 2009). ADMIXTURE takes multi-
locus allele frequency data and uses a cross validation procedure to predict the number of
ancestral populations (K), and for each individual outputs the proportion of its genotypes
57
derived from each population. This method does not require previous knowledge of the
number of populations, and allows for the identification of individuals sampled from a
population other than their population of origin.
To estimate the level of overall gene flow between populations we calculated Fst
(Weir & Cockerham 1984) using SNPrelate (Zheng et al. 2012). To visualize the distribution
of genetic variation among populations we conducted a principle components analysis
(PCA) using SNPrelate. To determine the hierarchy of divergence among the resulting
populations, we selected three samples from each population, converted SNP genotypes
into a concatenated alignment, and built a phylogenetic tree using the coalescent method of
SNAPP (Bryant et al. 2012) in BEAST 2.4.3 (Bouckaert et al. 2014). We ran SNAPP with
the default parameter settings, with an MCMC chain length of 3,000,000, sampling every
1,000th tree. We analyzed the resulting trees with a 10% burn-in, and assessed node
support with posterior probability. To tease apart the contributions of neutral and adaptive
processes to population structure, we repeated all of these analyses after removing outlier
loci, which we detected using the following methods.
To determine the influence of natural selection in the divergence of Phestilla minor
populations, we tested for genomic signals of adaptive divergence. Because the Phestilla
SNP data was ascertained randomly from across the genome, several hundred genotyped
loci are randomly expected to fall within or near functional genes. Genes under divergent
selection between populations will have much stronger differences in allele frequencies,
resulting in higher than expected Fst values (Beaumont & Balding 2004). SNPs within non-
coding DNA that lie adjacent to selected loci are also expected to have higher than
expected differentiation due to genetic hitchhiking (Flaxman et al. 2013). Therefore, we

58
analyzed SNP data to calculate the level of gene flow between populations in terms of Fst
for each locus, and detect outlier loci with Fst values significantly different from the rest,
providing evidence of strong selection.
We used two programs to determine Fst outliers: BayeScan (Foll & Gaggiotti 2008),
which takes a Bayesian approach, and fhetboot (Flanagan & Jones in review), which
employs the frequentist (fdist) method. We ran BayeScan with the default settings. The
prior odds for the neutral model were set to 10, meaning the neutral model was considered
to be 10 times more likely than that of selection. We considered a locus to be an outlier if it
had a q value less than 0.05, corresponding to a 5% false discovery rate (FDR = 0.05).
Outliers with a positive alpha value are under divergent selection, while outliers with a
negative alpha value are under balancing selection. To determine the effect of coral host
and geographic isolation on overall genomic divergence, we extracted the locus-specific Fsts
calculated by BayeScan and used a Welch two sample t-test to compare the distribution of
Fsts across all loci between ecologically and geographically isolated population pairs.
The program fhetboot is a new R package for implementation of the fdist outlier test,
which generates 95% and 99% confidence intervals for the neutral model by bootstrapping
the Fst-heterozygosity distribution of each dataset. As recommended by developers, we
tested fhetboot with 10 bootstraps and 100 bootstraps, and since we obtained identical
results, we proceeded with 10 bootstraps for analyses (Flanagan and Jones in review, or R
vignette). We considered a locus to be under divergent selection if it fell outside of the 99%
confidence interval and had a positive Fst. We considered those loci outside the 99%
confidence interval with a negative Fst to be under balancing selection.

59
Although selection may act in allopatric divergence, due to geographic variability of
ecological conditions we do not expect the same loci to be under selection between
different population pairs. In contrast, if selection is associated with coral host clade, we
expect the same loci to be under selection across the species range, and should detect the
same outlier loci in multiple host-separated population pairs. To test this expectation, we
narrowed our dataset to loci detected in two or more population pairs, and counted the
number of times recurring outliers were only found in instances of either geographic or coral
host divergence. We created a heat map to visualize the degree of outlier overlap between
the tested datasets.
Finally, to learn more about the ultimate mechanism of coral-mediated natural
selection on Phestilla minor, we investigated the potential function of outlier loci that
repeatedly occurred in tests of host divergence. We used the online Basic Local Alignment
Search Tool (BLAST, NCBI) to search all publically available molluscan genomes for
potential matches to our outlier loci (Altschul et al. 1990). We also used the command line
version of BLAST, blastn, to search for matches in the transcriptome of Phestilla sp. 1,
which is the sister species to Phestilla minor. This transcriptome was sequenced from a
sample we collected for phylogenomic analysis (Goodheart et al. in prep).
Results
SNP filtering
We sequenced 101 individuals, but immediately filtered out 4 under-sequenced
individuals that lacked sufficient data for genotyping, leaving 97. 80 of these individuals

60
were collected from Porites clade 1 corals, and 17 from Porites clade 2 corals, as
determined by previous study (Fritts-Penniman et al. in prep). We built the de novo
reference using the first 2,000,000 reads each from 8 individuals spanning the geographic
range of the samples and both coral hosts. After alignment to the reference and filtering for
high quality reads with a minimum coverage of 10x, we obtained genotypes for 1,060,724
polymorphic sites across these 97 individuals. After applying locus and individual filters to
the whole dataset, 4,966 loci and 86 individuals remained (Table 2.2, dataset 1).
Overall population structure
ADMIXTURE results from 4,966 SNPs across 86 individuals, yielded the lowest
cross-validation (CV) error with three populations (Table 2.3). These three populations are
not strictly associated with geography. One cluster is composed of all populations west of
the Sunda Shelf, which all live on host clade 1 (Figure 2.2, maroon); a second cluster is
composed of those populations east of the Sunda Shelf that live on host clade 1 (Figure 2.2,
orange), and the third cluster is all populations east of the Sunda Shelf on host clade 2
(Figure 2.2, blue). Phylogenetic analysis of these three clusters using coalescent methods
in SNAPP showed that divergence occurred first across the Sunda Shelf, then across coral
hosts on the eastern side (Figure 2.3A). Removing outlier loci (see below) had no impact on
population structure (Table 2.3, Figure 2.2C) or phylogenetic results (Figure 2.3B), but a
higher proportion of individuals appeared to have admixed ancestry than when outliers were
included.
Overall Fst between these three populations was 0.231 (Table 2.4). When
populations were grouped by host Fst was 0.213, and when populations were grouped by

61
side of the Sunda Shelf Fst was 0.194 (Table 2.4). Excluding outliers, Fst between the three
populations was 0.192; grouped by host Fst was 0.188; grouped by side of the Sunda Shelf
Fst was 0.146 (Table 2.4). In a PCA of the 4,779 biallelic SNPs genotyped in these 86
individuals, the first principle component roughly reflected variation associated with coral
host, while the second principle component roughly reflected the variation across the Sunda
Shelf (Figure 2.4A). Across both PCs, the variation among individuals in the eastern
populations from host clade 1 was remarkably low compared to the others. This group
formed a very tight cluster, while the rest of the individuals spread out across these axes.
The variation within western populations and host clade 2 populations was not explained by
sampling locality (Figure 2.5A). However, excluding outliers, the variation represented in PC
2 in the western population completely disappeared, and the variation within host clade 2
populations clearly was associated with sampling locality (Figure 2.5B).
Signatures of natural selection
We ran BayeScan and fhetboot on the overall dataset grouping populations 2 ways:
first by the 3 populations indicated by ADMIXTURE, then subdividing these populations by
sampling location and host for a total of 11 populations. With 3 populations, we found 0
outliers using BayeScan and 526 outliers using fhetboot; 495 with negative Fsts and 31 with
positive Fsts (Table 2.5). With 11 populations, BayeScan detected 14 outliers with negative
a and 15 with positive a (Figure 2.6). With fhetboot we found 592 outliers with negative Fsts
and 34 with positive Fsts (Table 2.5).
The nature of RAD data is such that the more diverse individuals you include during
quality filtering, the lower your overall genotyping rates are, and the more data you must

62
discard. Therefore, to retain more data and maximize our ability to detect loci under
selection, we subdivided the data into smaller datasets, and applied filters independently to
each set (Table 2.2). These datasets were chosen so that we could do 4 direct comparisons
of ecological and geographic divergence (as demonstrated in Figure 2.7), first across the
whole sampling range, then looking specifically at Bali, Donggala, and Raja Ampat.
To examine overall genomic patterns of divergence across coral hosts while
controlling known geographic divergence, we analyzed all individuals from the east side of
the Sunda shelf, grouped into two populations based on their coral host (Table 2.2, dataset
2A). BayeScan found 0 outliers and fhetboot found 996 negative outliers and 43 positive
outliers (Table 2,5, Figure 2.8A). To examine overall genomic patterns of divergence across
the Sunda Shelf while controlling for coral host, we analyzed all individuals from host clade
1, with Aceh and Cubadak in one population and Bali, Komodo, Donggala, Bunaken,
Lembeh, and Raja Ampat in another (Table 2.2, dataset 2B). BayeScan found 0 outliers and
fhetboot found 957 negative outliers and 46 positive outliers (Table 2.5, Figure 2.8B).
We then looked specifically at the localities that had both coral hosts: Bali, Donggala,
and Raja Ampat. For each site we compared ecological divergence within that site to
allopatric divergence between that site and Cubadak on the other side of the Sunda Shelf
(Table 2.2, datasets 3-5). Between host-separated populations in Bali, BayeScan found 0
outliers and fhetboot found 2,723 negative outliers and 112 positive outliers (Table 2.5,
Figure 2.8C). Between host clade 1 populations in Bali and Cubadak, BayeScan found 0
outliers and fhetboot found 1,440 negative outliers and 81 positive outliers (Table 2.5,
Figure 2.8D). Between host-separated populations in Donggala, BayeScan found 0 outliers
and fhetboot found 1,081 negative outliers and 84 positive outliers (Table 2.5, Figure 2.9A).

63
Between host clade 1 populations in Donggala and Cubadak, BayeScan found 0 outliers
and fhetboot found 1,976 negative outliers and 94 positive outliers (Table 2.5, Figure 2.9B).
Between host-separated populations in Raja Ampat, BayeScan found 0 outliers and
fhetboot found 1,735 negative outliers and 63 positive outliers (Table 2.5, Figure 2.9C).
Between host clade 1 populations in Raja Ampat and Cubadak, BayeScan found 0 outliers
and fhetboot found 813 negative outliers and 111 positive outliers (Table 2.5, Figure 2.9D).
In addition to testing for outliers, BayeScan outputs mean Fst across populations for
each locus. We compared the distributions of Fsts in corresponding population pairs to gain
insight into the relative influence of geographic and ecological isolation on the genome.
Overall, differentiation between coral host populations (Fst = 0.60) was slightly higher than
differentiation between populations on either side of the Sunda Shelf (Fst = 0.59, Figure
2.10A, t-test: t = 125.86, df = 14347, p-value < 2.2e-16). The difference between divergence
mechanisms is particularly extreme in Donggala, where mean Fst was 0.50 between coral
hosts and 0.36 across the Sunda Shelf (Figure 2.10C, t = 1018.7, df = 23634, p-value <
2.2e-16). In Raja Ampat, mean Fst was 0.37 between coral hosts and 0.31 across the
Sunda Shelf (Figure 2.10D, t = -433.48, df = 24121, p-value < 2.2e-16). In Bali, the pattern
was reversed, with mean Fst of 0.36 between coral hosts and 0.37 across the Sunda Shelf
(Figure 2.10B, t = 100.07, df = 33102, p-value < 2.2e-16).
Because we were specifically interested in mechanisms of divergent selection, we
looked more closely at the loci detected as positive outliers. Due to the risk of false positives
in Fsts outlier tests, especially when overall divergence is high (Foll & Gaggiotti 2008), we
narrowed positive loci down to those detected in more than one outlier test. The majority of
outlier loci are only indicated as outliers in one dataset, but 21 outliers came up in 2 or more

64
datasets, for a total of 23 occurrences (Table 2.6). Only 2 of these 21 repeatedly occur as
outliers between population pairs that are diverging in allopatry, while 12 exclusively occur
as outliers between population pairs diverging on different coral hosts. We will refer to these
12 as “host-specific” loci following the model of Egan et al. (2008). The other 7 are outliers
in tests of both coral host and geographic divergence. For each of the 12 host-specific loci,
we used BLAST to explore the potential functions. None of these 36bp sequence tags
aligned with the Phestilla sp. transcriptome scaffold, but all had partial matches to
molluscan genomes in the NCBI database. The majority of loci had a variety of matches
with no detectable pattern, but locus number 38622 aligned only with membrane protein
mRNAs. Its top match is an alignment of 22 basepairs of a lysosome membrane protein in
the California Sea Hare, Aplysia californica, at 91% identity. This particular locus is the
single most commonly detected outlier, having been identified as an outlier by Bayescan
and fhetboot for the full dataset (Table 2.2, set 1), with fhetboot in host-diverging
populations throughout the Pacific (Table 2.2, set 2A), and locally between host populations
in Raja Ampat (Table 2.2, set 5A).
Discussion
Multilocus SNP data from Phestilla minor populations spanning the Indonesian
Archipelago provides evidence for the complex interaction between natural selection and
gene flow across both geographic and ecological barriers. Analysis of SNPs ascertained
using RAD sequencing from across the genome showed strong population structure across
the Sunda Shelf phylogeographic barrier (see Barber et al 2011, Carpenter et al. 2011 for
reviews), and across two major clades of Porites coral hosts (Fritts-Penniman et al. in prep).

65
Geographic and host-associated population structure remained even after removing loci
that were indicated by outlier tests to be under selection, showing that both coral host and
the Sunda Shelf have led to significant neutral divergence across the genome, and are
likely undergoing speciation. While strong neutral divergence is not often reported in the
ecological speciation literature, it is expected when divergent selection acts as a
generalized barrier to gene flow (Thibert-Plante & Hendry 2010).
Scans for natural selection detected many outliers, the vast majority of which were
negative, providing evidence for balancing selection across populations (Beaumont &
Balding 2004; Foll & Gaggiotti 2008). However, the existence of some positive outlier loci in
all population pairs indicated that there is also divergent selection acting across coral host
and across the Sunda Shelf barrier. The same loci were generally not found to be outliers
across different population pairs. However, recurring loci were more likely to be host-
specific than associated with geography, as has been observed in phytophagous insects
(Egan et al. 2008; Soria-Carrasco et al. 2014). These host-specific loci will provide a
starting point for deeper investigations into host-driven adaptation in nudibranchs.
Neutral genomic divergence
Population genetic and phylogenetic analyses of genome-wide SNPs supported
previous results from mitochondrial COI that both coral host and the Sunda Shelf act as
barriers to gene flow in Phestilla minor (Fritts-Penniman et al. in prep). Both datasets
indicate that the species split first across the Sunda Shelf, and more recently between
populations inhabiting the two distinct Porites host clades east of the Sunda Shelf. Previous
COI sequence data suggested a small degree of mismatch between nudibrach and host

66
coral clades, or that one nudibranch clade was more generalist, occupying both hosts, while
the other clade was limited to host 2 (Fritts-Penniman et al. in prep). However, SNPs
provide higher resolution data and statistical power for population assignment than
traditional markers (Helyar et al. 2011). With SNPs, we saw that all individuals collected
from host clade 2 do in fact cluster together (Figure 2.2).
Looking only at putative neutral SNPs, a small number of nudibranchs collected from
clade 1 host corals showed significant probabilities of membership in multiple nudibranch
lineages. In some cases, individual samples had genetic signatures associated with both
coral host clades (Figure 2.2C, orange and blue), or allopatric populations from the same
coral host (Figure 2.2C, orange and maroon). This pattern could be evidence of either
shared ancestral polymorphism or recent gene flow (Hebert et al. 2013). For recently
diverged sympatric clades, it is difficult to distinguish between these two. For allopatric
populations, our phylogenetic results lend some insight into whether admixed individuals
have resulted from ongoing gene flow or ancestral polymorphism. We know that the east
and west populations diverged first, followed by coral-associated divergence in the east
(Figure 2.3). Any shared ancestral polymorphism from before divergence across the Sunda
Shelf should be seen throughout all populations, regardless of host. However, zero
individuals from host clade 2 show evidence of admixed ancestry with populations west of
the Sunda Shelf. Therefore, it is much more likely that the admixture seen between
allopatric populations on host clade 1 is due to recent gene flow. The Sunda Shelf is not a
hard geographic barrier; many marine invertebrates are well connected by gene flow
throughout this entire region, including the congener Phestilla lugubris (Carpenter et al.
2011, Fritts-Penniman et al. in prep).

67
BayeScan tests of population pairs spanning either the ecological or geographic
barrier yielded very high mean Fst values (ranging from 0.31 to 0.6) with most loci having an
Fst close to the mean, and no outliers (Figure 2.10). This is expected when gene flow is low
and genetic differentiation has proceeded relatively consistently across the genome, a
signature of neutral evolution (Foll & Gaggiotti 2008). Surprisingly, in three out of four
comparisons Fst values for the vast majority of loci were higher between sympatric host
populations than between populations across the Sunda Shelf (Figure 2.10), despite
phylogenetic evidence that divergence across the Sunda Shelf occurred first (Figure 2.3).
This result aligned with our ADMIXTURE analysis, which showed lower rates of admixture
between sympatric different-host populations than between allopatric, same-host
populations. If host-driven selection is strong, it may be easier for Phestilla minor to cross
the Sunda Shelf via pelagic larval dispersal than it is to settle on the wrong host. Such
habitat-driven isolation is a key mechanism for ecological speciation (Rundle & Nosil 2005).
Signatures of natural selection
It is clear that Phestilla minor is diverging on different coral host lineages. However,
to isolate the influence of adaptation to coral hosts from adaptation to local environmental
conditions, we compared pairwise genome scans of P. minor collected from the same
population from different host corals to scans for selection from allopatric P. minor
populations collected from the same host coral lineage. We detected a handful of outlier loci
in BayeScan, and hundreds in fhetboot, especially negative outliers presumed to be under
balancing selection (Table 2.5). We expected to see a stronger signal of balancing selection
(negative outliers) across allopatric populations that were on the same host, and a stronger

68
signal of divergent selection (positive outliers) across populations on different hosts.
However, there were no discernable trends; both negative and positive outliers were found
in similar proportions across both barriers (Table 2.5). However, when we removed outliers
from population structure analyses, it had a bigger effect on geographic variation than
ecological variation. This is most evident in the PCA, where populations across the Sunda
Shelf were distinguished with outliers included, but cluster more closely without outliers,
indicating that natural selection plays an important role in divergence across this barrier
(Figure 2.4). Within clade 2 coral host populations, no geographic structure is evident with
outliers, but without outliers we see some geographic clustering (Figure 2.5). Given the
large proportion of negative outliers, this may be indicative of the homogenizing effect of
balancing selection across clade 2 coral host populations (Mäkinen et al. 2008).
Similar studies found higher rates of outliers between different-host populations than
same-host populations, but also had much lower overall Fsts between populations (Egan et
al. 2008; Apple et al. 2010). As noted earlier, mean Fsts between Phestilla minor populations
pairs were very high, which can limit the power of an outlier test to identify loci genuinely
under divergent selection, especially when sample sizes and population numbers are low
(Beaumont & Balding 2004; Foll & Gaggiotti 2008). It is possible that these populations are
too divergent to accurately assess the role of natural selection in the process. However,
looking only at the distribution of outliers that we found, we see no evidence that natural
selection plays a larger role in divergence among sympatric populations from different coral
host clades than in allopatric populations from the same coral host clade.
A significant risk of Fst outlier detection methods is that loci identified from only one
analysis may be false positives, (Beaumont & Balding 2004; Foll & Gaggiotti 2008). Loci

69
truly under selection across coral hosts or across the Sunda Shelf should, therefore, be
identified regardless of the dataset analyzed. In particular, we expected that outliers would
overlap between population pairs, because many of our population pairs were not
independent; we tested the same barriers at different geographic scales. However, results
showed that outlier overlap occurs disproportionately in the tests of coral host divergence,
with very few overlapping outliers between tests across the Sunda Shelf (Table 2.6). For
example, 8 of the outliers detected as under divergent selection across hosts in Bali
(dataset 3A) were also detected as being under divergent selection across hosts throughout
all eastern populations, which includes Bali (dataset 2A). In comparison, only 1 outlier that
was detected across the Sunda Shelf between Bali and Cubadak (dataset 3B) was also
detected when testing this barrier across all sampling sites (dataset 2B). This
disproportionate recurrence of outliers provides strong evidence for the consistency of
natural selection between coral hosts across the range of Phestilla minor, but not across the
Sunda Shelf. In similar studies on phytophagous insects, recurring outliers are considered
to be candidates for further investigation into the mechanisms of selection (Egan et al.
2008; Soria-Carrasco et al. 2014). Since we are interested in the specific mechanism of
natural selection imposed by Porites corals on their nudibranch parasites, we took a closer
look at the 12 outliers that overlap exclusively in tests of coral host divergence, the “host-
specific” outliers.
There are two main ways in which coral hosts can impose selective pressure on
Phestilla nudibranchs: host recognition, and host compatibility. Phestilla nudibranchs in the
water column recognize chemical cues released by corals, which induce them to settle and
metamorphose on the coral below (Hadfield & Pennington 1990; Hadfield et al. 2006;

70
Ritson-Williams et al. 2007). While host recognition is essential to the evolution of host
specificity, in order for host specificity to evolutionarily favorable, there must also be a
selective advantage to life on that particular host, i.e., host compatibility. Selection may act
on a nudibranchs ability to overcome the coral’s defense, in order to live upon and consume
the coral tissue. Like all cnidarians, corals use stinging nematocysts for defense, and
several nudibranchs have evolved the ability to consume these nematocysts without harm,
some even retaining them for their own defensive use in a specialized organ called a
cnidosac (Martin 2003; Churchill et al. 2014). Phestilla nudibranchs do not have cnidosacs,
but they are still able to consume nematocysts without harm (Rudman 1981).
We analyzed BLAST results looking for gene matches that could potentially be
involved in host recognition or coral-feeding. The most promising hit was a locus for which
22 basepairs aligned at 91% identity with a scaffold from the California Sea Hare, Aplysia
californica, that is predicted to be a lysosomal membrane protein. Extensive research on the
movement of nematocysts through the nudibranch digestive tract indicates that in some
aeolid nudibranchs, nematocysts are retained in phagosomes rather than quickly fusing with
lysosomes and being digested, as is the normal outcome for victims of phagocytosis (Martin
2003; Greenwood 2009). In Phestilla, nematocysts are likely digested more rapidly, since
they do not store them for defense, but the mechanism that determines how nematocysts
are treated inside the digestive tract is still unknown. If membrane proteins aids in
recognition of nematocysts, these could either induce fusion and digestion by the lysosome,
or avoidance and retention of the nematocyst within the cerata. This would not be the first
time selection on lysosomal activity has been observed in a mollusk. In Mytilus edulis,
natural selection maintains an allele frequency cline in the Lap locus, which encodes an

71
aminopeptidase found in digestive cell lysosomes, between areas of differing salinity
(Koehn et al. 1980).
Ecological speciation
Genetic evidence for host-specific clades in Phestilla minor strongly suggests that
ecological divergence has occurred, and that natural selection played a role in this process.
However, the recovery of high level of neutral differentiation precludes determination of
whether divergence was initiated with or without gene flow. The ecological speciation
literature is full of empirical examples and models of the early stages of ecological
divergence-with-gene-flow, in which only loci under selection diverge, and the rest of the
genome remains homogenized (Pinho & Hey 2010; Andrew & Rieseberg 2013; Huang et al.
2014). However, there are fewer examples demonstrating later stages along the speciation
continuum (Nosil & Feder 2012; Powell et al. 2013). In Phestilla minor we have discovered
either a more advanced stage of divergence-with-gene-flow, or a case of secondary contact
between host races that evolved in allopatry. These processes are indistinguishable after
the fact, because they leave similar signatures on the genome. In allopatric ecological
divergence, natural selection and genetic drift act in concert, causing widespread genomic
divergence (Orr & Smith 1998). In divergence-with-gene-flow, when multiple loci are under
selection, genetic hitchhiking causes differentiation of quite a large proportion of the
genome, referred to as genome hitchhiking (Thibert-Plante & Hendry 2010; Flaxman et al.
2013). The end result is a genomic architecture that closely resembles that caused by
isolation by distance, referred to as isolation by adaptation (Nosil et al. 2008; Funk et al.
2011).

72
Evidence for isolation by adaptation has been found in many organisms, from
Atlantic cod (Berg et al. 2015) to phytophagous walking sticks (Nosil et al. 2008) and leaf
beetles (Funk et al. 2011). Models have shown that a high level of neutral divergence
between sympatric populations is particularly likely when divergent selection is acting
between two habitats that are distributed in a coarse mosaic over the landscape (Flaxman
et al. 2012). The current results cannot reject initiation of divergence in allopatry. However,
given the fact that these populations currently exist in sympatry, and both host corals have
very large, overlapping ranges in a mosaic distribution, we believe that a scenario of
isolation by adaptation as a result of divergence-with-gene-flow is more likely than allopatric
divergence. Furthermore, coralivorous snails living and feeding on the same Porites coral
hosts show very similar patterns of ecological differentiation (Simmonds 2016). It is more
likely that the similarities between these nudibranchs and snails results from differentiation
on hosts, rather than both diverging in allopatry and then expanding ranges independently
to yield concordant patterns of host differentiation.
Our research contributes to a growing body literature on ecological speciation in the
sea. Recent use of genomic techniques has shown evidence for ecological speciation in
coral reef fishes, such as in the genera Hypoplectrus (Puebla et al. 2014), Acanthurus
(Gaither et al. 2015), and Haemulon (Bernal et al. 2016). The evolution of host preference
and its effect on speciation, have been thoroughly explored in the phytophagous insect
literature (Janz & Nylin 2008; Hood et al. 2015; McClure et al. 2016), but relatively little in
marine systems, despite strong parallels (Krug 2011). Given the growing literature on the
variable responses of different corals to climate change and ocean acidification (Pandolfi et
al. 2011), it is becoming more important to recognize the role of specific coral species in

73
producing and maintaining marine biodiversity. Coral reefs provide a wealth of systems that
are yet untapped in the field of ecological speciation (Rocha et al. 2005; Krug 2011). We
encourage researchers interested in host shifting and host specialization as mechanisms for
speciation to turn to the sea for inspiration.

74
TABLES AND FIGURES
Table 2.1. Samples collected and sequenced.
Host Location Porites clade 1 Porites clade 2 West of Sunda Shelf Aceh 7 Cubadak 12 East of Sunda Shelf Bali 12 5 Komodo 9 Donggala 14 9 Bunaken 14 Lembeh 9 Raja Ampat 7 3
Total 84 17 Table 2.2. Subsets of data independently filtered and analyzed for tests of natural selection.
Set Barrier Populations Individuals SNPs 1 Both Aceh – host 1
Cubadak – host 1 Bali – host 1 Bali – host 2 Komodo – host 1 Donggala – host 1 Donggala – host 2 Bunaken – host 1 Lembeh – host 1 Raja Ampat – host 1 Raja Ampat – host 2 Total
5 8
12 5 9
11 7
11 9 6 3
86
4,966 2A Host
Bali – host 1 Bali – host 2 Komodo – host 1 Donggala – host 1 Donggala – host 2 Bunaken – host 1 Lembeh – host 1 Raja Ampat – host 1 Raja Ampat – host 2 Total
12 5 9
11 6
12 9 7 3
74
7,429

75
2B Sunda Shelf Aceh – host 1 Cubadak – host 1 Bali – host 1 Komodo – host 1 Donggala – host 1 Bunaken – host 1 Lembeh – host 1 Raja Ampat – host 1 Total
5 8
12 9
11 12 9 7
73
7,223 3A Host Bali – host 1
Bali – host 2 Total
12 5
17
18,730 3B Sunda Shelf Bali – host 1
Cubadak – host 1 Total
12 8
20
14,746 4A Host Donggala – host 1
Donggala – host 2 Total
11 9
20
11,645 4B Sunda Shelf Donggala – host 1
Cubadak – host 1 Total
11 8
19
12,567 5A Host Raja Ampat – host 1
Raja Ampat – host 2 Total
7 3
10
12,839 5B Sunda Shelf Raja Ampat – host 1
Cubadak – host 1 Total
7 9
16
11,396 Table 2.3. ADMIXTURE CV errors for K=1 through K=7, 86 samples across all sampling sites.
Table 2.4. Weir and Cockerhams’s Fst calculated in SNPrelate, with and without outlier loci. Population groups Fst - all loci Fst - outliers excluded ADMIXTURE K = 3 0.231 0.192 Across Host 0.213 0.188 Across Sunda Shelf 0.194 0.146
K All loci Outliers excluded
1 0.22176 0.19722 2 0.21477 0.19310 3 0.21157 0.19202 4 0.22174 0.21016 5 0.23169 0.21322 6 0.23658 0.21347 7 0.23217 0.20961

76
Table 2.5. Outlier test results for all sets of populations. We present the total number of outliers identified, the number of negative outliers (for Bayescan defined as outliers with a≤0,forfhetbootdefinedasoutlierswithFst ≤ 0), positive outliers (for Bayescan defined as outliers with a>1,forfhetbootdefinedasoutlierswithFst > 1), and the proportion of each relative to the total number of loci used in each test.
Table 2.6. Heat map showing overlap of outliers between population pairs having a coral host barrier, a geographic barrier, or both. Note that not all datasets are completely independent population pairs. Dataset 1 includes samples from all other datasets; dataset 2A includes samples from 3A, 4A, and 5A; dataset 2B includes samples from 3B, 4B, and 5B.
Barrier Both Coral Host Geography Data 1 2A 3A 4A 5A 2B 3B 4B 5B
Both 1 3 1 1 1 2
Coral host
2A 8 2 1 1 3A 1 4A 5A
Geography
2B 1 3B 1 4B 5B
BayeScan fhetboot
Data Populations#-Barrier
Totalloci -a Prop.- +a prop.+ -Fst Prop.- +Fst prop.+
1 3-Both 4,966 0 0 0 0 495 0.010 31 0.0061 11-Both 4,966 14 0.003 15 0.003 592 0.119 34 0.0072A 2-Host 7,429 0 0 0 0 996 0.134 43 0.0063A 2-Host 18,730 0 0 0 0 2,723 0.145 112 0.0064A 2-Host 11,645 0 0 0 0 1,081 0.093 84 0.0075A 2-Host 12,839 0 0 0 0 1,735 0.135 63 0.0052B 2-Geography 7,223 0 0 0 0 957 0.132 46 0.0063B 2-Geography 14,746 0 0 0 0 1,440 0.098 81 0.0054B 2-Geography 12,567 0 0 0 0 1,976 0.157 94 0.0075B 2-Geography 11,396 0 0 0 0 813 0.071 111 0.010
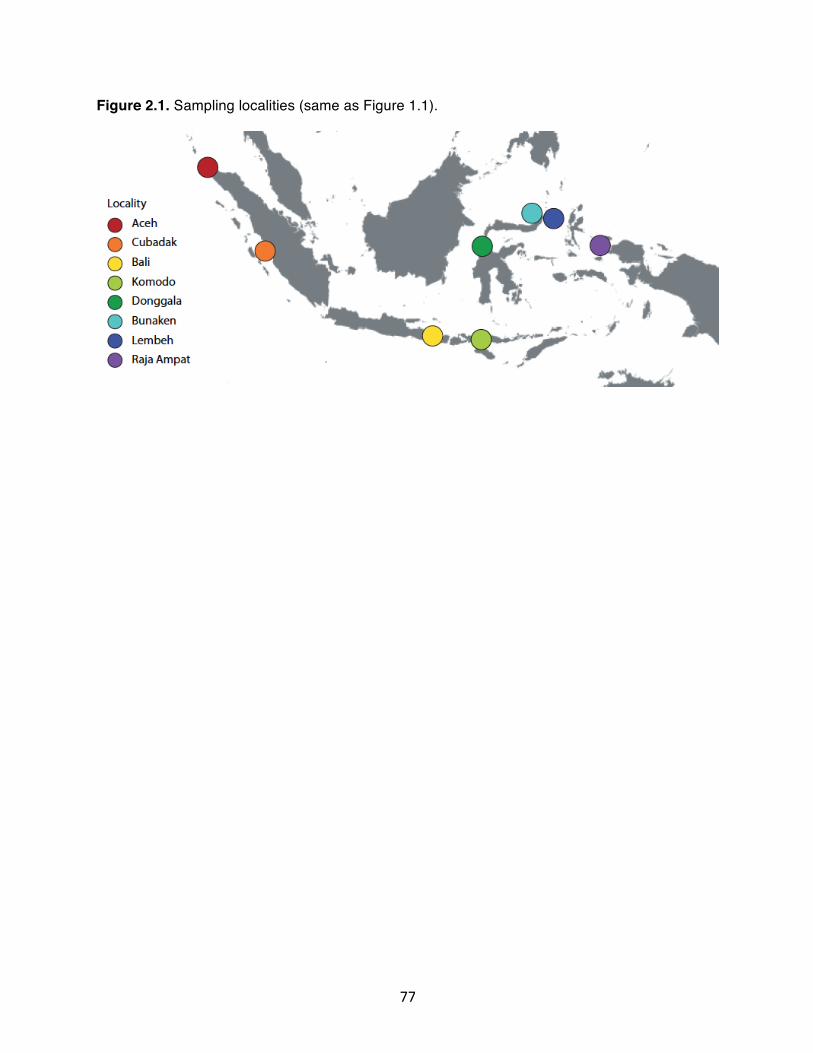
77
Figure 2.1. Sampling localities (same as Figure 1.1).

78
Figure 2.2. ADMXITURE results, K = 3. A) samples organized by geographic location, west to east, B) samples organized by location and coral host, C) samples organized by location and coral host, with outlier loci removed.

79
Figure 2.3. Phylogenetic tree generated by SNAPP using 3 samples per clade and aligned genotypes for A) all 4,966 SNPs and B) 4,090 non-outlier SNPs.

80
Figure 2.4. PCA of 86 individuals, color coded by ADMIXTURE cluster. A) 4,779 biallelic SNPs. B) 3,990 non-outlier SNPs.

81
Figure 2.5. PCA of 86 individuals, color coded by locality. A) 4,779 biallelic SNPs. B) 3,990 non-outlier SNPs.

82
Figure 2.6. BayeScan results for full dataset subdivided into 11 populations by locality and host. Vertical line indicates q = 0.05; all loci to the left of that threshold are outliers. Outliers on the upper half of the distribution are under divergent selection; those on the bottom half are under purifying selection.

83
Figure 2.7. Schematic diagram of population pairs for comparison of the effect of coral host and allopatry on genomic divergence.

84
Figure 2.8. Results from fhetboot for A) all individuals east of the Sunda Shelf, with populations defined by host coral clade, B) all individuals on host clade 1, with populations defined by side of the Sunda Shelf, C) all individuals in Bali, with populations defined by host coral clade, and D) individuals on host clade 1 from Bali and Cubadak. Outliers were defined as those falling outside the 99% confidence interval, shown in yellow.

85
Figure 2.9. Results from fhetboot for A) all individuals in Donggala, with populations defined by host coral clade, B) individuals on host clade 1 from Donggala and Cubadak.C) all individuals in Raja Ampat, with populations defined by host coral clade, and D) individuals on host clade 1 from Raja Ampat and Cubadak. Outliers were defined as those falling outside the 99% confidence interval, shown in yellow.

86
Figure 2.10. Distribution of Fsts as calculated by BayeScan. Each graph shows the results from two outlier tests: one where populations were defined by coral host clade (blue), one where populations were defined by side of the Sunda Shelf (red). A) Coral host populations east of the Sunda Shelf (blue) and allopatric populations on coral host 1 (red). B) Coral host populations in Bali (blue) and allopatric populations on coral host 1 in Bali and Cubadak (red). C) Coral host populations in Donggala (blue) and allopatric populations on coral host 1 in Donggala and Cubadak (red). D) Coral host populations in Raja Ampat (blue) and allopatric populations on coral host 1 in Raja Ampat and Cubadak (red).

87
REFERENCES
Alexander DH, Novembre J, Lange K (2009) Fast model-based estimation of ancestry in unrelated individuals. Genome Research, 19, 1655–1664.
Altschul SF, Gish W, Miller W, Myers EW, Lipman DJ (1990) Basic local alignment search
tool. Journal of Molecular Biology, 215, 403–410. Andrew RL, Ostevik KL, Ebert DP, Rieseberg LH (2012) Adaptation with gene flow across
the landscape in a dune sunflower. Molecular Ecology, 21, 2078–2091. Andrew RL, Rieseberg LH (2013) Divergence is focused on few genomic regions early in
speciation: Incipient speciation of sunflower ecotypes. Evolution, 67, 2468–2482. Apple JL, Grace T, Joern A, Amand PS, Wisely SM (2010) Comparative genome scan
detects host-related divergent selection in the grasshopper Hesperotettix viridis. Molecular Ecology, 19, 4012–4028.
Ballentine B, Horton B, Brown ET, Greenberg R (2013) Divergent selection on bill
morphology contributes to nonrandom mating between swamp sparrow subspecies. Animal Behaviour, 86, 467–473.
Beaumont MA, Balding DJ (2004) Identifying adaptive genetic divergence among
populations from genome scans. Molecular Ecology, 13, 969–980. Berg PR, Jentoft S, Star B et al. (2015) Adaptation to low salinity promotes genomic
divergence in Atlantic cod (Gadus morhua L.). Genome Biology and Evolution, 7, 1644–1663.
Bernal MA, Gaither MR, Simison WB, Rocha LA (2016) Introgression and selection shaped
the evolutionary history of sympatric sister-species of coral reef fishes (genus: Haemulon ). Molecular Ecology.
Bird CE, Fernandez-Silva I, Skillings DJ, Toonen RJ (2012) Sympatric Speciation in the
Post “Modern Synthesis” Era of Evolutionary Biology. Evolutionary Biology, 39, 158–180.
Bouckaert R, Heled J, Kühnert D et al. (2014) BEAST 2: A Software Platform for Bayesian
Evolutionary Analysis. PLoS Computational Biology, 10, e1003537. Brawand D, Wagner CE, Li YI et al. (2014) The genomic substrate for adaptive radiation in
African cichlid fish. Nature, 513, 375–381. Bryant D, Bouckaert R, Felsenstein J, Rosenberg NA, Roychoudhury A (2012) Inferring
species trees directly from biallelic genetic markers: Bypassing gene trees in a full coalescent analysis. Molecular Biology and Evolution, 29, 1917–1932.

88
Bush GL (1994) Sympatric speciation in animals: New wine in old bottles. Trends in Ecology and Evolution, 9, 285–288.
Carpenter KE, Barber PH, Crandall ED et al. (2011) Comparative Phylogeography of the
Coral Triangle and Implications for Marine Management. Journal of Marine Biology, 2011, 1–14.
Churchill CKC, Valdés Á, Ó Foighil D (2014) Molecular and morphological systematics of
neustonic nudibranchs (Mollusca : Gastropoda : Glaucidae : Glaucus), with descriptions of three new cryptic species. Invertebrate Systematics, 28, 174.
Coyne J, Orr HA (2004) Speciation. Sinauer Associates, Sunderland, MA. Danecek P, Auton A, Abecasis G et al. (2011) The variant call format and VCFtools.
Bioinformatics, 27, 2156–8. Dieckmann U, Doebeli MO (1999) On the origin of species by sympatric speciation. Nature,
400, 354–357. Egan SP, Nosil P, Funk DJ (2008) Selection and genomic differentiation during ecological
speciation: Isolating the contributions of host association via a comparative genome scan of Neochlamisus bebbianae leaf beetles. Evolution, 62, 1162–1181.
Faucci A, Toonen RJ, Hadfield MG (2007) Host shift and speciation in a coral-feeding
nudibranch. Proceedings of the Royal Society B: Biological Sciences, 274, 111–119. Feder JL, Egan SP, Nosil P (2012) The genomics of speciation-with-gene-flow. Trends in
Genetics, 28, 342–350. Flaxman SM, Feder JL, Nosil P (2012) Spatially explicit models of divergence and genome
hitchhiking. Journal of Evolutionary Biology, 25, 2633–2650. Flaxman SM, Feder JL, Nosil P (2013) Genetic hitchhiking and the dynamic buildup of
genomic divergence during speciation with gene flow. Evolution, 67, 2577–2591. Foll M, Gaggiotti O (2008) A genome-scan method to identify selected loci appropriate for
both dominant and codominant markers: a Bayesian perspective. Genetics, 180, 977–93.
Funk DJ, Egan SP, Nosil P (2011) Isolation by adaptation in Neochlamisus leaf beetles:
host-related selection promotes neutral genomic divergence. Molecular Ecology, 20, 4671–4682.
Gaither MR, Bernal MA, Coleman RR et al. (2015) Genomic signatures of geographic
isolation and natural selection in coral reef fishes. Molecular Ecology, 24, 1543–1557.

89
Garvin MR, Saitoh K, Gharrett a. J (2010) Application of single nucleotide polymorphisms to non-model species: a technical review. Molecular Ecology Resources, 10, 915–934.
Gavrilets S (2014) Models of speciation: Where are we now? Journal of Heredity, 105, 743–
755. Greenwood PG (2009) Acquisition and use of nematocysts by cnidarian predators. Toxicon,
54, 1065–1070. Grenier JL, Greenberg R (2005) A biogeographic pattern in sparrow bill morphology:
parallel adaptation to tidal marshes. Evolution, 59, 1588–1595. Hadfield MG, Faucci A, Koehl M a. R (2006) Measuring recruitment of minute larvae in a
complex field environment: The corallivorous nudibranch Phestilla sibogae (Bergh). Journal of Experimental Marine Biology and Ecology, 338, 57–72.
Hadfield M, Pennington J (1990) Nature of the metamorphic signal and its internal
transduction in larvae of the nudibranch Phestilla sibogae. Bulletin of Marine Science, 46, 455–464.
Hawthorne DJ, Via S (2001) Genetic linkage of ecological specialization and reproductive
isolation in pea aphids. Nature, 412, 904–907. Hebert JB, Scheffer SJ, Hawthorne DJ (2013) Reproductive Isolation between Host Races
of Phytomyza glabricola on Ilex coriacea and I. glabra. PLoS ONE, 8. Helyar SJ, Hemmer-Hansen J, Bekkevold D et al. (2011) Application of SNPs for population
genetics of nonmodel organisms: New opportunities and challenges. Molecular Ecology Resources, 11, 123–136.
Hendry AP (2009) Ecological speciation! Or the lack thereof? Canadian Journal of Fisheries
and Aquatic Sciences, 66, 1383–1398. Hood GR, Forbes AA, Powell THQ et al. (2015) Sequential divergence and the
multiplicative origin of community diversity. Proceedings of the National Academy of Sciences, 112, E5980–E5989.
Huang CL, Ho CW, Chiang YC et al. (2014) Adaptive divergence with gene flow in incipient
speciation of Miscanthus floridulus/sinensis complex (Poaceae). Plant Journal, 80, 834–847.
Janz N, Nylin S (2008) The Oscillation Hypothesis of Host-Plant Range and Speciation. In:
Specialization, Speciation, and Radiation: The Evolutionary Biology of Herbivorous Insects, pp. 203–215. University of California Press, Berkeley, CA.

90
Koehn RK, Newell RIE, Immermann F (1980) Maintenance of an Aminopeptidase Allele Frequency Cline by Natural Selection. Proceedings of the National Academy of Sciences, 77, 5385–5389.
Krug PJ (2011) Patterns of speciation in marine gastropods: A review of the phylogenetic
evidence for localized radiations in the sea. American Malacological Bulletin, 29, 169–186.
Lassalle F, Muller D, Nesme X (2015) Ecological speciation in bacteria: Reverse ecology
approaches reveal the adaptive part of bacterial cladogenesis. Research in Microbiology, 166, 729–741.
Lowry DB, Rockwood RC, Willis JH (2008) Ecological reproductive isolation of coast and
inland races of Mimulus guttatus. Evolution, 62, 2196–214. Mäkinen HS, Cano JM, Merilä J (2008) Identifying footprints of directional and balancing
selection in marine and freshwater three-spined stickleback (Gasterosteus aculeatus) populations. Molecular Ecology, 17, 3565–3582.
Martin R (2003) Management of nematocysts in the alimentary tract and in cnidosacs of the
aeolid nudibranch gastropod Cratena peregrina. Marine Biology, 143, 533–541. Matsubayashi KW, Ohshima I, Nosil P (2010) Ecological speciation in phytophagous
insects. Entomologia Experimentalis et Applicata, 134, 1–27. Mayr, E. (1963). Animal species and evolution. Belknap Press of Harvard University Press,
Cambridge, MA. McClure M, Elias M, Ehrlich P et al. (2016) Unravelling the role of host plant expansion in
the diversification of a Neotropical butterfly genus. BMC Evolutionary Biology, 16, 128. Michel AP, Sim S, Powell THQ et al. (2010) Widespread genomic divergence during
sympatric speciation. Proceedings of the National Academy of Sciences, 107, 9724–9729.
Midamegbe A, Vitalis R, Malausa T et al. (2011) Scanning the European corn borer
(Ostrinia spp.) genome for adaptive divergence between host-affiliated sibling species. Molecular Ecology, 20, 1414–1430.
Mitsui Y, Nomura N, Isagi Y, Tobe H, Setoguchi H (2011) Ecological barriers to gene flow
between riparian and forest species of ainsliaea (asteraceae). Evolution, 65, 335–349. Muñoz MM, Crawford NG, McGreevy TJ et al. (2013) Divergence in coloration and
ecological speciation in the Anolis marmoratus species complex. Molecular Ecology, 22, 2668–2682.

91
Nice CC, Fordyce JA, Shapiro AM, Ffrench-Constant R (2002) Lack of evidence for reproductive isolation among ecologically specialised lycaenid butterflies. Ecological Entomology, 27, 702–712.
Nosil P (2009) Adaptive population divergence in cryptic color-pattern following a reduction
in gene flow. Evolution, 63, 1902–1912. Nosil P, Egan SP, Funk DJ (2008) Heterogeneous genomic differentiation between walking-
stick ecotypes: “Isolation by adaptation” and multiple roles for divergent selection. Evolution, 62, 316–336.
Nosil P, Feder JL (2012) Genomic divergence during speciation: causes and
consequences. Philosophical Transactions of the Royal Society B: Biological Sciences, 367, 332–342.
Nunes VL, Beaumont MA, Butlin RK, Paulo OS (2011) Multiple approaches to detect
outliers in a genome scan for selection in ocellated lizards (Lacerta lepida) along an environmental gradient. Molecular Ecology, 20, 193–205.
Orr MR, Smith TB (1998) Ecology and speciation. Trends in Ecology & Evolution, 13, 502–
506. Osborne OG, Batstone TE, Hiscock SJ, Filatov DA (2013) Rapid speciation with gene flow
following the formation of Mt. Etna. Genome Biology and Evolution, 5, 1704–1715. Pandolfi JM, Connolly SR, Marshall DJ, Cohen AL (2011) Projecting coral reef futures under
global warming and ocean acidification. Science, 333, 418–422. Papadopulos AST, Price Z, Devaux C et al. (2013) A comparative analysis of the
mechanisms underlying speciation on Lord Howe Island. Journal of Evolutionary Biology, 26, 733–745.
Parchman TL, Benkman CW, Britch SC (2006) Patterns of genetic variation in the adaptive
radiation of New World crossbills (Aves: Loxia). Molecular Ecology, 15, 1873–1887. Peccoud J, Ollivier A, Plantegenest M, Simon J-C (2009) A continuum of genetic
divergence from sympatric host races to species in the pea aphid complex. Proceedings of the National Academy of Sciences, 106, 7495–7500.
Pinho C, Hey J (2010) Divergence with Gene Flow: Models and Data. Annual Review of
Ecology, Evolution, and Systematics, 41, 215–230. Powell THQ, Forbes AA, Hood GR, Feder JL (2014) Ecological adaptation and reproductive
isolation in sympatry: genetic and phenotypic evidence for native host races of Rhagoletis pomonella. Molecular Ecology, 23, 688–704.

92
Powell THQ, Hood GR, Murphy MO et al. (2013) Genetic divergence along the speciation continuum: The transition from host race to species in rhagoletis (diptera: Tephritidae). Evolution, 67, 2561–2576.
Puebla O, Bermingham E, McMillan WO (2014) Genomic atolls of differentiation in coral
reef fishes (Hypoplectrus spp., Serranidae). Molecular Ecology, 23, 5291–5303. Rice AM, Leichty AR, Pfennig DW (2009) Parallel evolution and ecological selection:
replicated character displacement in spadefoot toads. Proceedings of the Royal Society B: Biological Sciences, 276, 4189–4196.
Ritson-Williams R, Shjegstad SM, Paul VJ (2007) Larval metamorphic competence in four
species of Phestilla (Gastropoda; Opisthobranchia). Journal of Experimental Marine Biology and Ecology, 351, 160–167.
Rocha LA, Robertson DR, Roman J, Bowen BW (2005) Ecological speciation in tropical reef
fishes. Proceedings of the Royal Society B: Biological Sciences, 272, 573–579. Roda F, Ambrose L, Walter GM et al. (2013) Genomic evidence for the parallel evolution of
coastal forms in the Senecio lautus complex. Molecular Ecology, 22, 2941–2952. Rosenzweig M (1978) Competitive speciation. Biological Journal of the Linnean Society, 10,
275–289. Rudman WB (1981) Further studies on the anatomy and ecology of opisthobranch molluscs
feeding on the scleractinian coral Porites. Zoological Journal of the Linnean Society, 71, 373–412.
Rudman WB (1982) The taxonomy and biology of further aeolidacean and arminacean
nudibranch molluscs with symbiotic zooxanthellae. Zoological Journal of the Linnean Society, 74, 147–196.
Rundle HDD, Nagel L, Boughman JW, Schluter D, Wenrick Boughman J (2000) Natural
Selection and Parallel Speciation in Sympatric Sticklebacks. Science, 287, 306–308. Rundle HD, Nosil P (2005) Ecological speciation. Ecology Letters, 8, 336–352. Sanders KL, Rasmussen AR, Mumpuni et al. (2013) Recent rapid speciation and ecomorph
divergence in Indo-Australian sea snakes. Molecular Ecology, 22, 2742–2759. Schliewen UK, Tautz D, Paabo S (1994) Sympatric speciation suggested by monophyly of
crater lake cichlids. Nature, 368, 629–632. Schluter D (2009) Evidence for ecological speciation and its alternative. Science, 323, 737–
741.
93
Servedio MR, Doorn GS Van, Kopp M, Frame AM, Nosil P (2011) Magic traits in speciation: “magic” but not rare? Trends in Ecology & Evolution, 26, 389–397.
Silva DN, Talhinhas P, Cai L et al. (2012) Host-jump drives rapid and recent ecological
speciation of the emergent fungal pathogen Colletotrichum kahawae. Molecular Ecology, 21, 2655–2670.
Simmonds S (2016) Genomic Signatures of Natural Selection and Geographic Isolation in
Corallivorous Snails. (Doctoral dissertation). Retrieved from eSchholarship. http://escholarship.org/uc/item/4xs0b56d
Singer MC, McBride CS (2010) Multitrait, host-associated divergence among sets of
butterfly populations: implications for reproductive isolation and ecological speciation. Evolution, 64, 921–933.
Smadja CM, Butlin RK (2011) A framework for comparing processes of speciation in the
presence of gene flow. Molecular Ecology, 20, 5123–5140. Smith TB (1997) A Role for Ecotones in Generating Rainforest Biodiversity. Science, 276,
1855–1857. Soria-Carrasco V, Gompert Z, Comeault AA et al. (2014) Stick Insect Genomes Reveal
Natural Selection’s Role in Parallel Speciation. Science, 344, 738–742. Thibert-Plante X, Gavrilets S (2013) Evolution of mate choice and the so-called magic traits
in ecological speciation. Ecology Letters, 16, 1004–1013. Thibert-Plante X, Hendry AP (2010) When can ecological speciation be detected with
neutral loci? Molecular Ecology, 19, 2301–2314. Tsang LM, Chan BKK, Shih FL, Chu KH, Allen Chen C (2009) Host-associated speciation in
the coral barnacle Wanella milleporae (Cirripedia: Pyrgomatidae) inhabiting the Millepora coral. Molecular Ecology, 18, 1463–1475.
Via S (2012) Divergence hitchhiking and the spread of genomic isolation during ecological
speciation-with-gene-flow. Philosophical Transactions of the Royal Society B: Biological Sciences, 367, 451–460.
Via S, West J (2008) The genetic mosaic suggests a new role for hitchhiking in ecological
speciation. Molecular Ecology, 17, 4334–4345. Wang S, Meyer E, McKay JK, Matz M V (2012) 2b-RAD: a simple and flexible method for
genome-wide genotyping. Nature methods, 9, 808–10. Weir BS, Cockerham CC (1984) Estimating F-Statistics for the Analysis of Population
Structure. Evolution, 38, 1358.

94
Zheng X, Levine D, Shen J et al. (2012) A high-performance computing toolset for
relatedness and principal component analysis of SNP data. Bioinformatics, 28, 3326–3328.
95
CHAPTER 3
The roles of host and geography in promoting species diversity in
coral-associated nudibranchs
Introduction
The relative importance of natural selection and geographic barriers in the process
of speciation is one of the most enduring questions in evolutionary biology (Mayr 1942,
Mayr 1963, Maynard Smith 1966, Coyne & Orr 2004). After decades of debate, we now
know that natural selection can drive speciation without geographic barriers (Thoday &
Gibson 1970; Dieckmann & Doebeli 1999; Schluter 2001), but we still do not know how
important this process is in driving the diversification of life on Earth.
Ecological speciation, where disruptive selection favoring two different ecological
niches leads to reproductive isolation, has recently swept through the literature as a
mechanism for sympatric speciation in every branch of the tree of life (Rundle & Nosil 2005;
Schluter 2009). One mechanism for ecological speciation is when selection on traits
associated with resource use causes isolation between populations using different
resources (Schluter 2001). Adaptive resource specialization or resource shifts may be
important drivers of diversification in large taxonomic groups such as fish (Litsios et al.
2012; Burress 2014), insects (Nyman et al. 2007; Kjellberg & Proffit 2016), crustaceans
(Hurt et al. 2013; Malay & Michonneau 2014), and mollusks (Wägele 2004; Krug 2011).
Although ecological speciation can happen through a variety of mechanisms, such
as adaptation to trophic niche (Lu & Bernatchez 1999; Fan et al. 2012), or across
environmental gradients (Lowry et al. 2008; Bird et al. 2011), one of the most commonly

96
proposed mechanisms is through host shifting. In insects, many studies have shown that
specialization of phytophagous insects on their host plants, and subsequent host shifts, are
a driver of ecological speciation (Berlocher & Feder 2002; Hébert et al. 2016). Other
research on plant-host systems has focused on host range expansion and contraction, in
which a species colonizes new hosts, then as selection favors specialization, fragments into
multiple specialized species (Janz et al. 2006; McClure et al. 2016).
Like plants, corals play host to a variety of taxa, including algae, barnacles,
polychaete worms, and gastropods (Faucci et al. 2007; Tsang et al. 2009; Malay &
Michonneau 2014; Willette et al. 2015; Parkinson et al. 2016). The obligate relationship
between these organisms and their coral hosts (Hadfield & Pennington 1990) draws a
strong parallel to the well-studied terrestrial phytophagous insects. Therefore, if ecological
speciation is a driver of speciation in phytophagous plants, it is likely a driver of speciation in
coral-associated taxa as well. However, research on ecological speciation on coral reefs
lags far behind that in terrestrial and aquatic systems (Rocha et al. 2005; Miglietta et al.
2011). Instead, most studies still seek geographic explanations for species diversity, even
when there are no obvious geographic barriers to promote divergence (Briggs 2005; Barber
et al. 2006). As a result, we still have an incomplete understanding of diversification
processes in the marine environment, particularly biodiversity hotspots like the Coral
Triangle, the world’s most biodiverse marine ecosystem (Roberts et al. 2002).
Aeolid nudibranchs are an extremely diverse group of sea slugs known for
specialization on cnidarian prey (McDonald & Nybakken 1997; Carmona et al. 2013). While
most aeolids specialize on hydroids or anemones, some are known to live and feed on
specific scleractinian corals (Rudman 1981a, 1982; Faucci et al. 2007). As planktonic

97
larvae, a chemical cue produced by the coral induces nudibranchs to settle and
metamorphose (Hadfield & Pennington 1990). The large size of coral colonies combined
with the limited mobility of adult nudibranchs results in a tendency for individual nudibranchs
to stay on one host colony for their entire life, including mating (Krug 2011). This life-history
could promote reproductive isolation between populations feeding on different corals, and
has the potential to lead to ecological speciation, possibly in sympatry. In fact, phylogenetic
analysis suggests that host shifting has occurred at least twice in Phestilla (Faucci et al.
2007) and previous work revealed cryptic adaptive divergence between sympatric
populations of Phestilla minor on different Porites host species (Fritts-Penniman et al. in
prep). Combined, these results suggest that diversification in this group may be driven by
ecological speciation.
A significant challenge in understanding the role of host-shifting in the diversification
of corallivorous nudibranchs is that nudibranch taxonomy is lagging, with species being
discovered more frequently than taxonomists can describe them. For example, the newest
field guide to Indo-Pacific nudibranchs and sea slugs contains as many described and
undescribed species (Gosliner et al. 2015). To understand the processes contributing to
diversification, we must first have accurate and comprehensive taxonomic and phylogenetic
information.
Corallivory has been reported in 8 nudibranch species: Cuthona poritophages,
Pinufius rebus, and six species in the genus Phestilla, 2 of which are yet undescribed.
Recent work suggests that all of these species may actually belong to one clade, implying
that scleractinian-feeding has only evolved once (Gosliner et al. in review). However, the
lack of systematic study precludes strong conclusions about the phylogenetic relationships

98
within this unique group of nudibranch, and how diversification may be associated with
specialization on different coral hosts.
The aims of this study are to gain insight into the evolutionary history of coral-host
association in nudibranchs and to assess the relative roles of host shifting and geography in
diversification of coral-associated nudibranchs. Toward these aims we a) conducted
exploratory field sampling to discover species with previously unknown host associations, b)
used genetic sequencing to detect cryptic species, and c) built a phylogenetic tree of all
scleractinian-associated nudibranchs to determine how frequently and where host shifting
has occurred throughout evolutionary history.
Methods
Sample collection and DNA extraction
To maximize taxonomic diversity of coral hosts, we focused our collections on
Indonesia because it spans the Coral Triangle, the region with the highest coral species
richness in the world (Veron et al. 2007). We also collected in Hawaii because it is well
known for high levels of endemism for marine species (Alison Kay & Palumbi 1987). While
Phestilla is most commonly observed on Porites, Faucci et al. (2007) indicate that they are
found on at least two other host genera. As such, to discover potential novel host shifts, we
surveyed a wide range of coral taxa, more than are known to host Phestilla.
Phestilla are notoriously difficult to find on large coral heads, but are commonly
found on the undersides of small unattached or broken corals. We located Phestilla through
close inspection of loose coral pieces while using snorkel and SCUBA, and collected
99
individual nudibranchs by hand. We photographed all nudibranchs on their host coral in the
field prior to collection. Individuals were kept alive for ≤ 6 hours in small vials of seawater
until sample processing. We anesthetized and relaxed all specimens in the freezer before
transferring them to 95% ethanol for long-term preservation. We recorded the specific coral
host for all samples, with as many as 12 nudibranchs coming from one small coral. For all
nudibranchs, we recorded the host coral from which it was collected. Because Porites
taxonomy is problematic (Forsman et al. 2009) and species are morphologically plastic, in
Indonesia we collected host coral tissues from Porites hosting Phestilla nudibranchs to
genetically confirm perceived differences among hosts. In Hawaii our permits prohibited the
collection coral tissue, so we used local coral sequences from a collaborator at University of
Hawaii (Tisthammer et al. unpublished).
In addition to field collected samples, we also received 3 Phestilla specimens from
the Los Angeles County Museum of Natural History: 1 each from Clipperton Isles, Guam,
and Mexico. These samples had no host information, but we included them as part of our
search for cryptic diversity. The sample from Mexico was of particular interest because we
thought it might be the species Phestilla panamica, the only coral-associated nudibranch
described in the Eastern Pacific.
We extracted DNA from all nudibranchs and corals using Qiagen DNEasy Kits and
Omega Bio-Tek E.Z.N.A. Mollusc DNA Kits. For nudibranchs we isolated foot tissue for
extraction when possible, but for individuals smaller than 5 mm, we used half the body, and
for those smaller than 2 mm we used the entire body. We excluded cerata (the projections
of the gut covering the bodies of most aeolid nudibranchs) from the DNA extractions as they
often contain recently ingested coral tissue (Rudman 1982).

100
Standard Molecular Markers
We sequenced two mitochondrial (cytochrome oxidase subunit I, or COI, and the
ribosomal RNA gene 16S) and one nuclear gene (histone 3, or H3) that are commonly used
for gastropod systematics and phylogenetics (Faucci et al. 2007; Moore & Gosliner 2011;
Ornelas-Gatdula et al. 2011; Carmona et al. 2013; Cooke et al. 2014). We supplemented
the dataset with previously published sequences from Genbank (Benson et al. 2005; Faucci
et al. 2007; Carmona et al. 2013).
To identify cryptic species and clades, we first amplified COI from all 406
nudibranchs using the universal primers LCO1490 and HCO2198 (Folmer et al. 1994)
under the following PCR conditions: 2 minutes at 94ºC; 35 cycles of 94ºC for 30 seconds,
40ºC for 30 seconds, and 72ºC for 30 seconds; with a final extension of 7 minutes at
72ºC. Based on the COI results we chose a subset of 132 samples to amplify 16S using the
primers 16sar-L and 16sbr-H (Palumbi et al. 2002) with the same PCR settings as COI but
with an annealing temperature of 50ºC. We then chose an even smaller subset with a just a
few representatives from each mitochondrial clade to amplify H3, using the primers HexAF
and HexAR (Colgan et al. 1998) and the following PCR conditions: 3 minutes at 94ºC; 35
cycles of 94ºC for 35 seconds, 50ºC for 60 seconds, and 72ºC for 75 seconds; with a final
extension of 2 minutes at 72ºC. For coral hosts we amplified a section of the nuclear
histone 2 (H2) coding region using the primers zpH2AH4f (5’-
GTGTACTTGGCTGCYGTRCT-3’) and zpH4Fr (5’-GACAACCGAGAATGTCCGGT-3’)
under the following PCR conditions: 2 minutes at 96ºC; 34 cycles of 96ºC for 20 seconds,
58.5ºC for 20 seconds, and 72ºC for 90 seconds; and a final extension of 5 minutes at 72ºC

101
(Tisthammer et al. unpublished). We sequenced amplified DNA in both directions with the
ABI 3730 sequencer at UC Berkeley’s DNA Sequencing Facility.
Phylogenetic analyses
We assembled and edited all Sanger sequences in Geneious 6.1.7 (Kearse et al.
2012) and verified the quality of sequences with successful translation to amino acid protein
code. We combined these sequences with 55 additional Phestilla COI and 44 16S
sequences from GenBank published by Faucci et al. (2007) and Wecker et al. (2015), and 3
COI, 16S, and H3 outgroup sequences from Carmona et al. (2013). We aligned Porites H2
sequences from the Indonesian corals we sampled with sequences from Hawaiian Porites
lobata, Porites compressa, Porites evermanni, with one Porites superfusa sequence as an
outgroup (Tisthammer et al. unpublished). We aligned sequence data using the MUSCLE
algorithm as implemented in Geneious, and created concatenated alignments of first
COI+16S, then all three genes in Text Wrangler. We used the Akaike information criterion in
Jmodeltest (Guindon & Gascuel 2003; Darriba et al. 2012) to determine the best model of
evolution for each gene.
We conducted Bayesian phylogenetic analyses in MrBayes 3.2.2 (Ronquist &
Huelsenbeck 2003; Ronquist et al. 2012) as implemented in Geneious 6.1.7, using the
partitioned option for the multi-gene alignments. We ran analyses for 1,000,000
generations, sampling every 200 generations, with a 10% burn-in, and assessed support for
individual nodes using posterior probabilities. We conducted maximum likelihood analyses
using RAxML (Stamatakis 2014) with rapid bootstrapping using the XSEDE system on the
CIPRES web portal (Miller et al. 2010), and assessed support for nodes using proportion

102
out of 1,000 bootstraps. To assess the impact the addition of each gene had on node
support in the phylogenetic tree, we ran MrBayes and RAxML again on each gene set using
only the 41 samples for which we had all three genes sequenced.
To determine which clades might be considered separate species, we used
Automatic Barcode Gap Detection (ABGD, Puillandre et al. 2012). ABGD uses DNA
barcodes such as COI to partition samples into putative species based on the barcode gap,
which occurs when divergence among individuals within the species is less than that
between species. We analyzed the COI and COI+16S sequence alignments (excluding
outgroups) using the online tool (http://wwwabi.snv.jussieu.fr/public/abgd/abgdweb.html)
with the default range of 0.001 to 0.1 for prior intraspecific divergence (P) and 1.5 for
relative gap width (x), with corrected Jukes-Cantor and Kimura distances as well as simple
distances. We analyzed the COI+16S+H3 alignment with the same settings except for a
relative gap width of 1.
To determine whether geographic or ecological isolation are important for creating
and maintaining species boundaries, we used the partitioning of COI haplotypes by ABGD
to assign all 439 specimens to a clade, then classified each clade based on a) host coral to
the species or genus level, and b) the known geographic range. We then compared the
overlap of coral host range and geographic range to see which factor was most often a
source of isolation for nudibranch species.
Results
In total we collected 404 nudibranchs living on 9 species of coral host from 8
localities broadly distributed across Indonesia, and on 4 host species from 7 sites around
103
the island of Oahu, Hawaii (Table 3.1). Most notable among our sampling efforts was the
discovery of 3 morphologically distinct species, living on 3 different coral hosts new to
Phestilla. Photographs taken in the field show that these nudibranchs have astounding
camouflage with their preferred coral host (Figure 3.1, new species in B, E, F). SEM images
from select Phestilla specimens show evidence for divergence of the primary feeding
apparatus, the radula (Figure 3.2), which is known to vary with prey type, and is a classic
trait used in gastropod taxonomy (Radwin & Wells 1968; Rudman 1981b; Jensen 1993).
We sequenced 589 bp of COI in 383 individuals, 398 bp of 16S in 132 individuals,
and 328 bp of H3 in 38 individuals, and combined them with sequences from GenBank. We
also received a COI sequence from a nudibranch found by M. Massimo on a Montipora
coral in an aquarium in Italy, bringing the total to 439 individuals (Table 3.2). ABGD analysis
of all 439 COI sequences revealed a barcode gap between genetic distances of 0.05 and
0.06 (Figure 3.3A), and 19 putative species with prior intraspecific divergence from 0.02-
0.06, which is similar to intraspecific divergence levels seen previously in this genus (Faucci
et al. 2007). Samples collected as either Phestilla minor or Phestilla sp. 1 formed 7 of these
19 species. A representative subset of the samples is shown in Figure 3.4, with the same
topology as the tree containing all 439 individuals (Supplementary Figure S3.1). This tree
shows a deep division between 2 main clades: the Phestilla minor-like species complex in
the top clade, and all other species in the bottom clade. Included in this bottom clade are
the only two species of scleractinian-feeding nudibranchs that are not currently classified as
Phestilla: Cuthona poritophages (Rudman 1979) and Pinufius rebus (Marcus and Marcus
1960). Color-coding the tree by coral host shows that all genus-level host shifts, and a
couple species-level shifts, have occurred in this bottom clade.

104
ABGD analysis of 179 concatenated COI and 16S sequences revealed a barcode
gap between genetic distances of 0.03 and 0.05 (Figure 3.3B). Corresponding to this
barcode gap, a prior intraspecific distance of 0.0359 or 0.0599 shows 17 putative species,
with the first 3 COI clades grouped together into 1 species. All 19 clades seen on the COI
tree were also recovered in the COI+16S tree, but the deeper nodes are unresolved (Figure
3.5). It is unclear where Cuthona poritophages and Pinufius rebus fit in relation to Phestilla,
but Cuthona sp. 35 comes out as an outgroup rather than clustering with Cuthona
poritophages within the broader coral-feeding clade.
We were missing H3 sequences for 4 lineages from the COI+16S tree (7, 14, 15, 18)
because these lineages were composed entirely of samples from Faucci et al. (2007) who
did not sequence H3. We included these samples in the 3 gene phylogenetic analyses by
coding H3 as missing data for 7 individuals across these 4 clades. ABGD analysis of this
dataset did not show a clear barcode gap (Figure 3.3C), but this method does not perform
well on datasets with fewer than 3 individuals per species (Puillandre et al. 2012). The
recovered tree shows all 19 lineages with similar topology to the previous trees, but differs
in the placement of the non-Phestilla species: Cuthona poritophages now falls outside of
Phestilla, and Pinufius rebus now clusters with the upper clade, sister to the Phestilla minor
species complex (Figure 3.6). However, this differs slightly in the maximum likelihood tree,
which again places Cuthona poritophages within Phestilla (Figure 3.7).
When we limited analyses to the 41 samples in 15 lineages that were sequenced at
all 3 genes, the topology of the 3 gene tree (Figure 3.8) had higher support values and was
better resolved than trees built with either COI (Figure 3.9) or COI+16S (Figure 3.10). Of the
19 putative species identified by ABGD in COI, not a single one is hosted by more than one

105
genus of coral, and 11 of 19 were only collected from a single coral host species (Table
3.3). Of the remaining 8 species, 7 are found on more than 1 Porites species, and 1 is found
on more than one Tubastrea species. Of the 11 species that appear to have specialized on
a single host species, 6 of them (clades 7, 8, 9, 10, 14, 15) are the only nudibranch species
known to live on the host (Table 3.3). Phestilla sp. (clade 8) occurred only on Montipora
porites, Phestilla sp. (clade 9) only on Pavona explanulata, Phestilla sp., (clade 10) only on
Pavona decussata, Phestilla melanobrachia (clade 13) only on Tubastrea coccina, Phestilla
sp. 2, (clade 14) only on Goniopora fruticose, and Phestilla sp. 2, (clade 15) only on
Goniopora djiboutiensis. The other 5 overlap in host use with other nudibranch species,
including some of their closest relatives (Table 3.3). Geographically, 5 species are known to
occur in both the Indian and Pacific Oceans, 1 species only occurs in the Indian Ocean, and
the remaining 13 occur in the Pacific Ocean. However, Phestilla cf. minor clade 4 and
Pinufius rebus both have well-supported sub-clades showing divergence between the
Indian and Pacific sides of the Sunda Shelf. Within the Pacific, 8 putative species (3, 7, 8, 9,
10, 14, 15, and 18) have only been sampled from one location each, but they occur in
sympatry with other closely related species.
Phylogenetic analyses of H2 for all Porites hosts revealed very little genetic
divergence of perceived morphotypes, and thus little confidence in differences among
species, with the exception of Porites cylindrica and Porites evermanni (Figure 3.11). Two
major clades are shown, one of which is composed entirely of P. cylindrica (clade 2). Some
corals identified in the field as P. cylindrica did sort into clade 1 with Porites attenuata, and
were likely misidentified. However, Phestilla species do accurately distinguish between
these coral clades. We have already shown that clades 1A and 1B have undergone
106
divergence based on host membership to these coral clades (Fritts-Penniman et al. in
prep). Importantly, the two nudibranch clades we have identified that are specific to P.
cylindrica only occur on clade 2 corals. No individuals from Phestilla cf. minor clade 1 were
collected from the misidentified Porites cylindrica corals; their hosts, which we also
presented in Figure 1.6 (chapter 1), are highlighted here in color. Similarly, the individuals
from clade 12 were also collected from clade 2 P. cylindrica. Only clade 4, which does not
show any host-based divergence, was collected from the clade 1 “P. cylindrica.” We cannot
be confident about other potential examples of host specificity on Porites species, such as
seen in clades 3 and 7, because these nudibranch clades are poorly sampled, and the coral
species (Porites annae and P. rus) have not been confirmed to be genetically distinct.
Discussion
Phylogenetic analyses reveal high levels of phyletic diversity within the genus
Phestilla, uncovering 17-19 distinct evolutionary lineages from only 6 named species,
indicating that there may be multiple cryptic species in this genus. While deeper tree
topology varied among analyses, the clade assignment for any given individual is identical
across all 3 genes. Given the high support at the tips in the COI dataset, COI is an
appropriate barcode for clade assignment, and can be used to detect cryptic diversity in this
group. Cryptic diversity was particularly high in P. minor, which contained up to 7 cryptic
lineages. Previous phylogeographic research has recovered cryptic lineages in a wide
variety of marine molluscs throughout the Coral Triangle and Indo-Pacific Region (Meyer et
al. 2005; Crandall et al. 2007; DeBoer et al. 2008; Cheng et al. 2014), with cryptic diversity
strongly tied to geography. However, while some of these Phestilla lineages are associated

107
with geography, many are associated with different coral hosts, suggesting that geography
and coral host and play a significant role in the evolutionary history of this genus.
The recovery of potentially cryptic species that is equal or greater than the number of
described species of Phestilla is not unusual, as there are hundreds of undescribed species
of nudibranchs (Gosliner et al. 2015). What is remarkable is that Phestilla is known largely
from Porites corals, and we discovered 3 completely new species in the Coral Triangle that
live on corals not previously unknown to host Phestilla. Each of these three lineages was
found on a single species of coral (Montipora porites, Pavona decussata, or Pavona
explanulata), and have unique morphological traits showing adaptation to life on these
corals. These ecological associations add to a growing body of evidence that suggests
ecological divergence is likely an important process in shaping patterns of evolution within
Phestilla nudibranchs (Faucci et al. 2007, Fritts-Penniman et al. in prep).
Geographic divergence
Our results show two main clades of scleractinian-associated nudibranchs, with very
different patterns of geographic and ecological divergence. One clade, comprised of P.
minor and Pinufius rebus, is restricted to Porites hosts throughout the Indian and Pacific
Oceans. Within this group, the primary driver of divergence appears to be geographic
isolation. Within Pinufius rebus (clade 19), there are two clades representing the Pacific and
Indian Ocean respectively. Similarly, clade 2 of Phestilla cf. minor from the Indian Ocean is
sister to clade 1 from the Pacific Ocean, and clade 4 of P. cf. minor is partitioned based on
Indian and Pacific Ocean localities. The diversification of Pacific and Indian Ocean
populations of marine taxa is a well known pattern attributed to historical sea level changes,

108
when the Sunda Shelf was exposed and created a land barrier between the two oceans
(Voris 2000). Many species, such as stomatopods (Barber et al. 2006), snails (Crandall et
al. 2007, Simmonds 2016), sea stars (Crandall et al. 2008), and giant clams (DeBoer et al.
2008) show evidence of allopatric divergence across this barrier. Our previous work on
genomic divergence between Phestilla cf. minor clades 1 and 2 indicated that both neutral
and adaptive processes contribute to divergence across this geographic barrier (Fritts-
Penniman et al. in prep).
Similarly, Phestilla cf. minor populations in Hawaii are also very distinct (Figure 3.6).
Lineages 5 and 6 are composed mostly of samples from Oahu, with just one individual from
Bunaken included in lineage 5 and a few individuals from Guam and Raja Ampat in lineage
6 (Table 3.1). In Phestilla cf. lugubris there is also support for a distinct Hawaiian clade
which include specimens collected as Phestilla sibogae (Faucci et al. 2007), although it has
not diverged enough to qualify as a distinct species in ABGD (Figure 3.5). The taxonomic
validity of P. sibogae has been under question due to lack of differentiation from P. lugubris,
the two of which were thought to occur in sympatry (Faucci et al. 2007). Results from this
study suggest that Hawaiian populations may comprise a weakly diverged endemic lineage,
despite the fact that samples collected from Mexico and French Polynesia were not
genetically distinct. Regional endemism is a common finding in the Hawaiian islands, and
has been observed in other nudibranch genera (Gosliner 2002). Many Hawaiian marine
invertebrate species (Alison Kay & Palumbi 1987) and coral reef fishes (Hourigan & Reese
1987) have formed due to isolation on the periphery of a broader Indo-West-Pacific species
range. This process of peripatric speciation is thought to be one of the driving sources of
biodiversity in the Coral Triangle, where species that formed on the periphery eventually

109
accumulate (Fitzpatrick et al. 2011; Cowman & Bellwood 2013). These instances of
geographic divergence fit the classic models of allopatric and peripatric speciation (Coyne &
Orr 2004). Well known geographic processes act to limit gene flow among populations, over
time leading to reproductive isolation and speciation. Given the repeated occurrence of
geographic lineages within Porites-associated nudibranchs, this is clearly an important
mechanism for diversification.
Ecological divergence
While the Phestilla cf. minor and Pinufius rebus clade are found exclusively on
Porites and show divergence among Pacific and Indian Oceans, the remainder of Phestilla
occur exclusively in the Pacific Ocean and appear to have undergone many host shifts,
occurring on a diversity of coral hosts. Given the widespread use of Porites as a host
throughout the tree, Porites was most likely the ancestral host. This ancestral state is
maintained in Phestilla lugubris, which utilizes a wide range of Porites species as hosts.
However, the remaining 7 lineages live on single species of Porites. Unfortunately, with the
exception of Phestilla melanobrachia, each of these purported species was only collected
from a single location, so we do not have information about their geographic ranges.
However, their coral hosts are all broadly co-distributed in the Coral Triangle (Veron et al.
2016), and in our experience, Phestilla are found wherever there hosts are present. Given
the lack of any obvious geographic barriers to drive divergence of these species, it is likely
that host shifting or specialization, rather than allopatric divergence, is the mechanism for
speciation.

110
One of the challenges of studying speciation is that we rarely get to witness it in
action, and we often need to make inferences about processes that happened in the distant
past (Losos & Glor 2003). By observing host-associated ecological divergence that is recent
and ongoing, we gain confidence that this process is likely to have contributed to
divergence of Phestilla in the past. In depth study of Phestilla cf. minor demonstrates
ongoing divergence on Porites cylindrica, here shown as clade 1B, which has diverged from
clade 1A (Fritts-Penniman et al. in prep). This ecologically isolated clade does not yet
represent a monophyletic group in analyses using very few genes, but genome-wide SNPs
show very strong differentiation (Fritts-Penniman et al. in prep). This pattern is observed in
P. lugubris as well (clades 11A and 11B).
The majority of host-shifting and host specialization scientific literature focuses on
plant-insect systems (Berlocher & Feder 2002; Janz & Nylin 2008; Matsubayashi et al.
2010). In phytophagous insects, the evolution of host use is driven by both phylogenetic
relatedness and geographic range overlap of host plants (Janz & Nylin 2008; Calatayud et
al. 2016). Closely related insects tend to feed on closely related plants, but can sometimes
shift to unrelated, but nearby, host plants (López-Vaamonde et al. 2003; Calatayud et al.
2016). We see similar patterns in Phestilla. No single lineage feeds on more than one
genus of coral, and the relationships among coral hosts are roughly mirrored in the
relationships among their nudibranch parasites. For example, the two lineages that feed on
Goniopora corals are sister taxa, as are the two that feed on Pavona corals. Looking at
broader taxonomic levels, Porites and Goniopora are both genera in the family Poritidae
and Tubastrea is in their sister family, Dendrophylliidae (Kitahara et al. 2010). Similarly, the
nudibranch lineages feeding on Tubastrea and Goniopora are sister taxa, and share a

111
common ancestor with Phestilla lugubris on Porites. Acroporidae, the coral family containing
Montipora, and Agariciidae the family of Pavona, are also closely related; as are their
nudibranch parasites (Kitahara et al. 2010). Parallel relationships between host and
parasites, such as these, are seen throughout the tree of life (López-Vaamonde et al. 2003;
Janz & Nylin 2008; Calatayud et al. 2016).
Ecological divergence has now been observed several times in marine gastropods.
The corallivorous snail Coralliophila radula has also demonstrated divergence across
Porites hosts in the Indo-Pacific (Simmonds 2016). The snail Littorina saxatilis has become
a model system for adaptive divergence with its two ecotypes that are adapted to different
zones of the rocky intertidal (Hollander et al. 2015; Ravinet et al. 2015). In the nudibranch
Pteraeolidia ianthina, cryptic species were identified having symbiotic relationships with
different photosynthetic Symbiodinum dinoflagellates (Wilson & Burghardt 2015). In
Sacoglossan sea slugs, specific associations with algal prey and host switching have been
indicated as potential drivers of speciation (Jensen 1997). A number of additional examples
have been reviewed thoroughly by Krug (2011), highlighting the potential for future work on
ecological speciation in the sea.
Host shifting versus host range expansion and specialization
One interpretation of our results is that the ancestral host for all scleractinian-feeding
nudibranchs is Porites, the most common host genus, with shifts to Montipora, Goniopora,
Tubastrea, and Pavona corals at different points in evolutionary history. However, we have
already noted that these shifts have not occurred randomly across the genus; they are all
concentrated in one clade, where each branch is found on a different host genus or species

112
(Figure 3.4). However, theory suggests that when a resource is abundant, interspecific
competition is not high enough to drive a resource shift (Futuyma & Moreno 1988) and in
the Coral Triangle, Porites corals are very abundant. An alternative hypothesis is that the
ancestor was more general in its coral host preferences, and what we see here is the
evolution of specialization. This has been described as the Oscillation Hypothesis in the
phytophagous plant literature (Janz & Nylin 2008; Hamm & Fordyce 2015).
The difference between a model of pure host shifting and that of oscillation between
generalist and specialist states is subtle, but key to understanding the exact mechanism of
speciation. In the oscillation hypothesis, species expand their host range to be more
generalist, then over time becomes segmented into numerous species with a specific host
preference. Evolution from generalism to specialization is commonly observed in
phytophagous plants (Janz et al. 2006; Janz & Nylin 2008). In Porites-associated Phestilla,
we see a number of putative specialist clades that are sister to Porites generalists,
supporting host range expansion and contraction as the mechanism of divergence.
However, we also see many putative species that occur on completely different genera of
corals, and there are no clades that occur on more than one genus. While we cannot be
certain about the ancestral host state, the lack of any multi-host-genus generalist
nudibranch species indicates that these species underwent true host shifts.
Adaptations to coral host
Ecological speciation increases morphological diversity as well as cryptic species
diversity in this group. Species on different coral host genera are very divergent
morphologically, while geographic variants, such as the cryptic clades within Phestilla cf.

113
minor, tend to be more similar. While all coral-associated nudibranchs have some
mechanism of camouflage with their coral, in certain species it is more complex than in
others. Phestilla species that feed/live on Porites, Goniopora, and Montipora corals all have
the same mechanism of camouflage: take on the color of your coral prey by being
essentially transparent, with ingested coral tissue stored in the cerata (Figure 3.6 A, B, C).
Pinufius rebus, which live on Porites, and Phestilla living on Pavona and Tubastrea, corals,
blend in not only with the color, but the texture of their coral host (Figure 3.6 D, E, F).
Not only is it important for coral-associated nudibranchs to be cryptic, but it is also
critical that they consume coral tissue without being stung by nematocysts (Martin 2003).
Feeding on nematocysts may be facilitated by specialized functions of digestive cells, as
suggested by previous work on genomic signatures of adaptation in Phestilla (Fritts-
Penniman et al. in prep). Also involved in coral feeding are the jaws and radula. As the only
hard parts in the body in nudibranchs, these structures are commonly used for taxonomy,
and links have been made between radular morphology and feeding function in other sea
slugs (Jensen 1993). However, hard corals are a unique prey type, and not enough data
has been collected specifically from scleractinian-feeding nudibranchs to connect form to
function. We are beginning to collect these data now (Figure 3.2), and will pursue this
question in future work.
Cryptic speciation and systematics
The existence of at 17-19 scleractinian coral-associated nudibranch species, 7 of
which are cryptic clades within what is currently identified as Phestilla minor, has important
implications for nudibranch taxonomy. The use of genetic tools in marine invertebrate

114
phylogeography and systematics has revealed that species diversity can be many times
more than thought based on external morphology (Knowlton 1993; Meyer et al. 2005;
Barber & Boyce 2006; Gosliner & Fahey 2011; Chen & Hare 2011; Pola et al. 2012; Krug et
al. 2013). In nudibranchs, internal structures such as radulae and jaws can be divergent
between externally cryptic species, and do exhibit interspecific differences in Phestilla.
However, with no external indicators of speciation, it is difficult to know when to look inside.
Only broad geographic sampling and genetic testing are reliable indicators of cryptic
speciation in sea slugs. Recent molecular work on the nudibranch genus Notobryon (Pola
et al. 2012) and the slug genera Elysia and Plakobranchus (Krug et al. 2013) have
uncovered many cryptic species. Similarly, broad ecological sampling is necessary to find
new ecological variants. Even when species are morphologically distinct from each other,
such as those living on Pavona corals, they are still very cryptic relative to their
environment. By sampling across large geographic and ecological scales, our dataset
combined with that of Faucci et al. (2007) has multiplied the number of known scleractinian
coral-associated nudibranch species by 3. There are currently about 1,500 known species
of nudibranchs in the Coral Triangle (Gosliner et al. 2015). If this scale of sampling was
repeated on every single one of them, the number of nudibranch species could increase to
as many as 4,500.
Future directions
Understanding the role of adaptation to coral host in the diversification of coral-
associated nudibranchs in a very large task, and there is much work still to be done. Our
sampling of the two non-Phestilla scleractinian-associated nudibranchs, Cuthona

115
poritophages and Pinufius rebus, places them within the Phestilla clade, corroborating the
evidence that feeding on scleractinian corals has evolved only once in nudibranchs
(Gosliner et al. in review). This result has interesting implications for our future work
comparing the evolutionary history of nudibranch association with both scleractinian and
soft corals, and the contribution that each has made to overall nudibranch diversity.
However, the relative placement of Pinufius, Cuthona, and Phestilla in the tree is still
inconsistent with 3 genes. Additional data are necessary to determine their true evolutionary
relationships.
Given how many cryptic species we discovered in this study, it is likely that there are
still more undiscovered scleractinian-associated nudibranchs. Our first priority must be to
find and include all coral-feeding nudibranchs in further analyses. We will continue this work
with an even larger dataset, including the addition of genome-wide loci that are already in
development. In addition to better resolving the deeper nodes of the tree, using more loci
sequenced from across the genome will enable us to better assess the impact of host shifts
on evolutionary rates of divergence. Lastly, we will apply more robust species delimitation
techniques, and take an integrative approach that considers both genetic and morphological
data, such as that recently applied in sea slugs (Krug et al. 2013). Once all scleractinian-
associated nudibranchs are accounted for in the phylogenetic tree, we will be able to use
the tree to test hypotheses of ecological and allopatric speciation, and gain deeper
understanding of the processes generating diversity in this group.
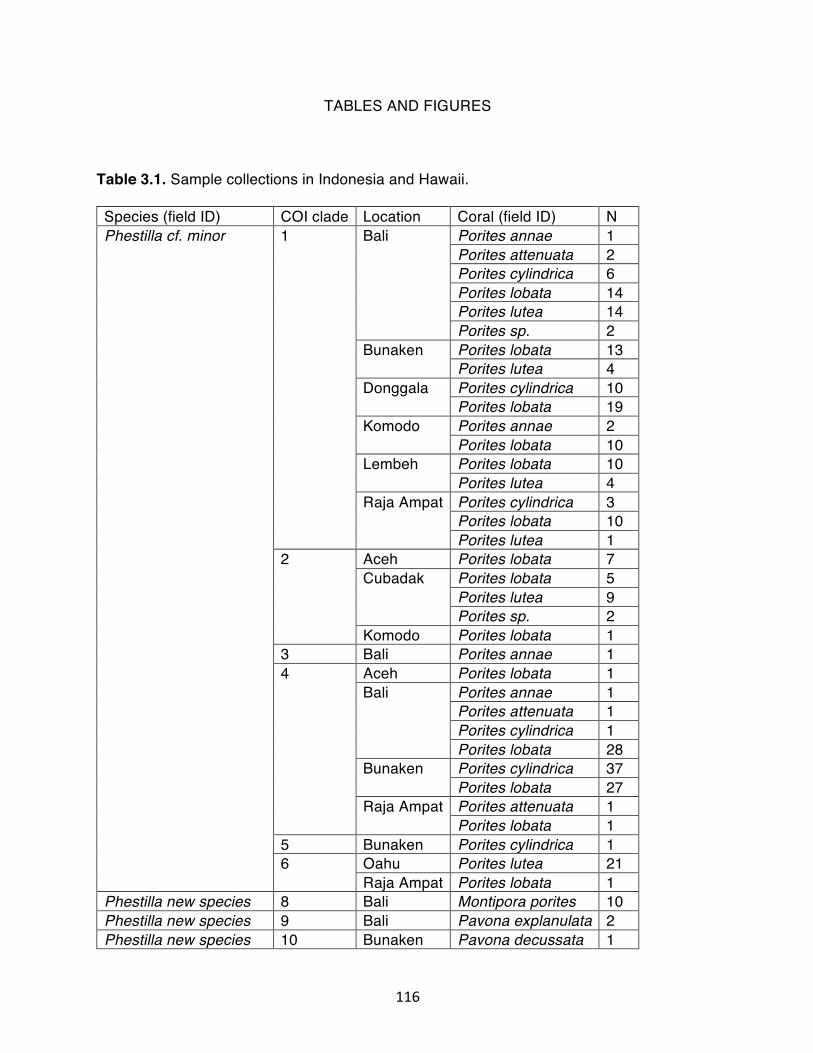
116
TABLES AND FIGURES Table 3.1. Sample collections in Indonesia and Hawaii. Species (field ID) COI clade Location Coral (field ID) N Phestilla cf. minor
1
Bali Porites annae 1 Porites attenuata 2 Porites cylindrica 6 Porites lobata 14 Porites lutea 14 Porites sp. 2
Bunaken
Porites lobata 13 Porites lutea 4
Donggala
Porites cylindrica 10 Porites lobata 19
Komodo Porites annae 2 Porites lobata 10
Lembeh
Porites lobata 10 Porites lutea 4
Raja Ampat Porites cylindrica 3 Porites lobata 10 Porites lutea 1
2
Aceh Porites lobata 7 Cubadak
Porites lobata 5 Porites lutea 9 Porites sp. 2
Komodo Porites lobata 1 3 Bali Porites annae 1 4
Aceh Porites lobata 1 Bali
Porites annae 1 Porites attenuata 1 Porites cylindrica 1 Porites lobata 28
Bunaken
Porites cylindrica 37 Porites lobata 27
Raja Ampat
Porites attenuata 1 Porites lobata 1
5 Bunaken Porites cylindrica 1 6
Oahu Porites lutea 21 Raja Ampat Porites lobata 1
Phestilla new species 8 Bali Montipora porites 10 Phestilla new species 9 Bali Pavona explanulata 2 Phestilla new species 10 Bunaken Pavona decussata 1

117
Phestilla lugubris 11 Aceh Porites lobata 9 Bali
Porites lobata 10 Porites lutea 2 Porites sp. 1
Bunaken Porites lobata 14 Porites cylindrica 2
Cubadak
Porites lobata 7 Porites lutea 6
Donggala Porites lobata 6 Komodo Porites lobata 1 Lembeh Porites lobata 4 Oahu Porites compressa 7
Porites lutea 1 Porites lobata 2
Raja Ampat
Porites lobata 5 Porites lutea 1
Phestilla cf. lugubris
12
Bali Porites cylindrica 2 Bunaken Porites cylindrica 1
Phestilla melanobrachia 13 Oahu Tubastrea coccinea 1 Cuthona poritophages
16
Aceh Porites lobata 2 Bunaken
Porites lobata 2 Porites lutea 2
Cuthona poritophages
17
Bunaken Porites lutea 1 Raja Ampat Porites lutea 2
Pinufius rebus
19
Bunaken Porites lobata 2 Cubadak Porites lobata 1 Lembeh Porites lobata 2
Total 380

118
Table 3.2. Samples acquired from Los Angeles County Natural History Museum (LACNHM) and GenBank. Species (field ID) Clade Location Coral (field ID) N Source Phestilla cf. minor
1 Palau Porites lutea 2 Faucci et al. 2007 5 Oahu Porites compressa 3
6 Guam Porites annae 5 Phestilla lugubris
11
Clipperton Isles
unknown 1 LACNHM
Guam Porites rus 3 Faucci et al. 2007
unknown 1 LACNHM Mexico unknown 1
Moorea Porites rus 1 Wecker et al. 2015
Phestilla melanobrachia
13
Guam Tubastrea coccinea 3 Faucci et al. 2007 Oahu Tubastrea coccinea 3
Palau Tubastrea micrantha 3 Phestilla minor II
16 Palau Porites lutea 1 18 Palau Porites lutea 2
Phestilla new species
8 Aquarium in Italy
Montipora porites 1 Personal correspon-dence
Phestilla sibogae
11 French Frigate Shoals
Porites compressa 1 Faucci et al. 2007
Guam Porites lutea 3 Oahu Porites compressa 3 Palau
Porites cylindrica 2 Porites rus 2
Phestilla sp. 1 1 Palau Porites cylindrica 4 4 Guam Porites cylindrica 3 7 Palau Porites rus 4
Phestilla sp. 2
14 Guam Goniopora fruticosa 3 15 Palau Goniopora djiboutiensis 1
Cuthona sp. 35 1 Carmona et al. 2013
Cuthona sp. A 1 Phyllodesmium horridum
1
Total 59

119
Table 3.3. Coral hosts and geographic range of 19 putative Phestilla species, based on this dataset alone. Number indicates the number of individuals from that Phestilla clade found on that coral.
Sampled from Phestilla clade
Coral host 1 2 3 4 5 6 7 8 9 10 11 12 13 14 15
Pacific 1 3 2 23 76 25 2 Indian 2 13 9 2 Bali 3 1 Indo-Pacific 4 1 2 41 57 Pacific 5 3 1 Pacific 6 5 1 21 Palau 7 4 Bali 8 11 Bali 9 2 Bunaken 10 1 Indo-Pacific 11 11 4 56 13 6 1 Pacific 12 4 Pacific 13 7 3 Guam 14 3 Palau 15 1 Indo-Pacific 16 2 3 Indo-Pacific 17 3 Palau 18 2 Indo-Pacific 19 5
Coral hosts:
1. Goniopora djiboutiensis 2. Goniopora fruticosa 3. Montipora porites 4. Pavona decussata 5. Pavona explanulata 6. Porites annae 7. Porites attenuata 8. Porites compressa 9. Porites cylindrica 10. Porites lobata 11. Porites lutea 12. Porites rus 13. Porites sp. (unknown) 14. Tubastrea coccinea 15. Tubastrea micrantha

120
Figure 3.1. Cryptic coloration and texture of Phestilla species: A) Clade 1: Phestilla cf minor on Porites lobata B) Clade 8: Phestilla sp. collected from Montipora porites, C) Clade 16: Cuthona poritophages on Porites lobata, D) Clade 19: Pinufius rebus on Porites lobata, E) Clade 9: Phestilla sp. collected from Pavona explanulata, F) Clade 10 Phestilla sp. collected from Pavona decussata.

121
Figure 3.2. SEM images of radulae from A) Clade 16: Cuthona poritophages collected from Porites lobata, B) Clade 8: Phestilla sp. collected from Montipora porites, C) Clade 12: Phestilla cf lugubris collected from Porites cylindrica, D) Clade 4: Phestilla cf. minor collected from Porites cylindrica, E) Clade 13: Phestilla melanobrachia collected from Tubastrea coccinea.

122
Figure 3.3. Jukes-Cantor genetic distances calculated with Automatic Barcode Gap Discovery for A) 439 COI sequences, B) 179 concatenated COI+16S sequences, and C) 48 concatenated COI+16S+H3 sequences. Presumed intraspecific divergence shown in orange, interspecific divergence in yellow.

123
Figure 3.4. Bayesian tree of 88 COI sequences. Node labels show posterior probability. Clades color-coded by host species, or genus for those that occur on more than one species. Black bars indicate the two major clades: all Phestilla minor-like species in the top clade, and all other species in the bottom clade.

124
Figure 3.5. Bayesian tree of 71 concatenated mitochondrial COI and 16S sequences. Node labels show posterior probability. Clades color-coded by host species, or genus for those that occur on more than one species.

125
Figure 3.6. Bayesian tree of 48 concatenated COI, 16S, and H3 sequences. Node labels show posterior probability. Clades color-coded by host species, or genus for those that occur on more than one species. Black bars highlight the different placement of Pinufius rebus and Cuthona poritophages relative to the mitochondrial gene trees.

126
Figure 3.7. Maximum likelihood tree of 48 concatenated COI, 16S, and H3 sequences. Node labels show bootstrap proportion. Clades color-coded by host species, or genus for those that occur on more than one species. Black bar highlights the placement of Cuthona poritophages inside the clade rather than as an outgroup, as it is in the Bayesian tree.

127
Figure 3.8. Bayesian tree of 41 concatenated COI, 16S, and H3 sequences, using only samples with all 3 genes sequenced, which excludes clades 7, 14, 15, and 18. Node labels show posterior probability on top and maximum likelihood on bottom. Clades color-coded by host species, or genus for those that occur on more than one species.
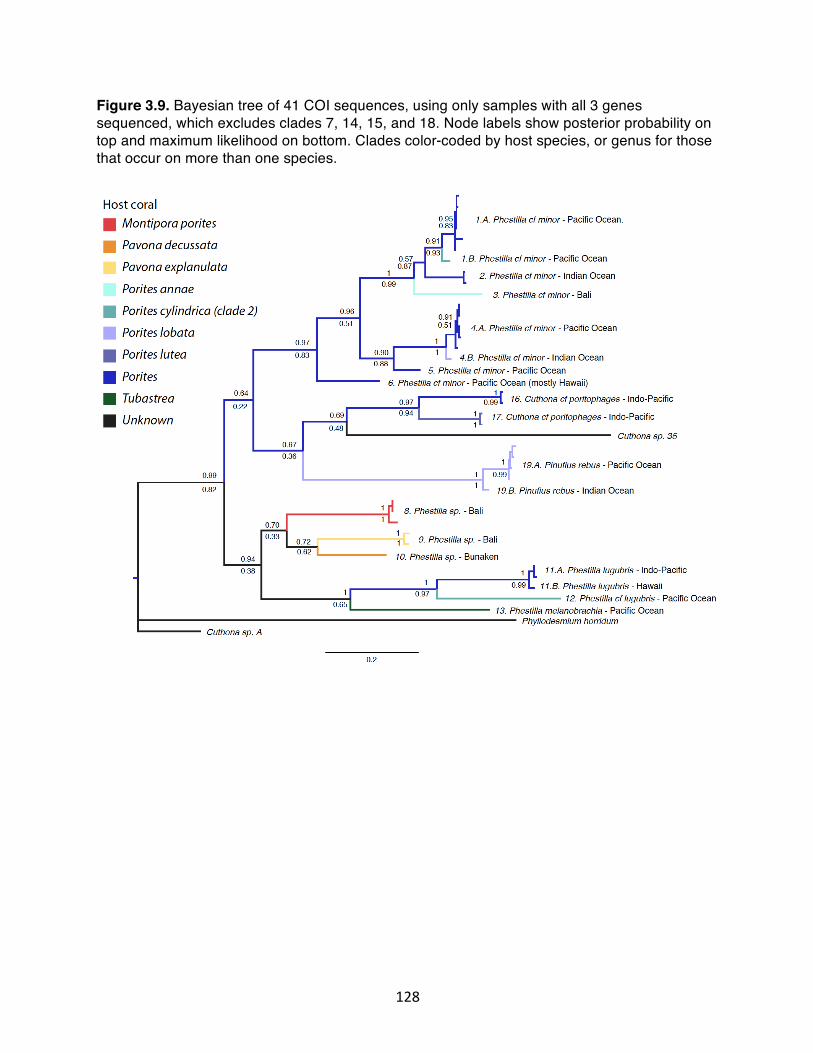
128
Figure 3.9. Bayesian tree of 41 COI sequences, using only samples with all 3 genes sequenced, which excludes clades 7, 14, 15, and 18. Node labels show posterior probability on top and maximum likelihood on bottom. Clades color-coded by host species, or genus for those that occur on more than one species.

129
Figure 3.10. Bayesian tree of 41 concatenated mitochondrial COI and 16S sequences, using only samples with all 3 genes sequenced, which excludes clades 7, 14, 15, and 18. Node labels show posterior probability on top and maximum likelihood on bottom. Clades color-coded by host species, or genus for those that occur on more than one species.

130
Figure 3.11. Bayesian tree of 81 Porites H2 sequences. Node labels show posterior probability on top and maximum likelihood on bottom. Corals from Figure 1.6 highlighted.

131
Supplement Figure S3.1. Bayesian tree of 439 COI sequences. Node labels show posterior probability.

132
REFERENCES
Alison Kay E, Palumbi SR (1987) Endemism and evolution in Hawaiian marine invertebrates. Trends in Ecology & Evolution, 2, 183–186.
Barber P, Boyce SL (2006) Estimating diversity of Indo-Pacific coral reef stomatopods
through DNA barcoding of stomatopod larvae. Proceedings of the Royal Society of London B: Biological Sciences, 273.
Barber PH, Erdmann M V, Palumbi SR (2006) Comparative phylogeography of three
codistributed stomatopods: origins and timing of regional lineage diversification in the Coral Triangle. Evolution, 60, 1825–1839.
Benson DA, Karsch-Mizrachi I, Lipman DJ, Ostell J, Wheeler DL (2005) GenBank. Nucleic
acids research, 33, D34-8. Berlocher SH, Feder JL (2002) Sympatric speciation in phytophagous insects: moving
beyond controversy? Annual Review of Entomology, 47, 773–815. Bird CE, Holland BS, Bowen BW, Toonen RJ (2011) Diversification of sympatric broadcast-
spawning limpets (Cellana spp.) within the Hawaiian archipelago. Molecular Ecology, 20, 2128–2141.
Briggs JC (2005) The marine East Indies: Diversity and speciation. Journal of
Biogeography, 32, 1517–1522. Burress ED (2014) Cichlid fishes as models of ecological diversification: patterns,
mechanisms, and consequences. Hydrobiologia, 748, 7–27. Calatayud J, Hórreo JL, Madrigal-González J et al. (2016) Geography and major host
evolutionary transitions shape the resource use of plant parasites. Proceedings of the National Academy of Sciences, 113, 9840–5.
Carmona L, Pola M, Gosliner TM, Cervera JL (2013) A Tale That Morphology Fails to Tell:
A Molecular Phylogeny of Aeolidiidae (Aeolidida, Nudibranchia, Gastropoda). PLoS ONE, 8, e63000.
Chen G, Hare MP (2011) Cryptic diversity and comparative phylogeography of the estuarine
copepod Acartia tonsa on the US Atlantic coast. Molecular Ecology, 1–17. Cheng SH, Anderson FE, Bergman A et al. (2014) Molecular evidence for co-occurring
cryptic lineages within the Sepioteuthis cf. lessoniana species complex in the Indian and Indo-West Pacific Oceans. Hydrobiologia, 725, 165–188.
Colgan DJ, McLauchlan A, Wilson GDF et al. (1998) Histone H3 and U2 snRNA DNA
sequences and arthropod molecular evolution. Australian Journal of Zoology, 46, 419.

133
Cooke S, Hanson D, Hirano Y et al. (2014) Cryptic diversity of Melanochlamys sea slugs
(Gastropoda, Aglajidae) in the North Pacific. Zoologica Scripta, 43, 351–369. Cowman PF, Bellwood DR (2013) The historical biogeography of coral reef fishes: global
patterns of origination and dispersal. Journal of Biogeography, 40, 209–224. Coyne J, Orr HA (2004) Speciation. Sinauer Associates, Sunderland, MA. Crandall ED, Frey MA, Grosberg RK, Barber PH (2007) Contrasting demographic history
and phylogeographical patterns in two Indo-Pacific gastropods. Molecular Ecology, 17, 611–626.
Crandall ED, Jones ME, Muñoz MM et al. (2008) Comparative phylogeography of two
seastars and their ectosymbionts within the Coral Triangle. Molecular Ecology, 17, 5276–5290.
Darriba D, Taboada GL, Doallo R, Posada D (2012) jModelTest 2: more models, new
heuristics and parallel computing. Nature Methods, 9, 772–772. DeBoer TS, Subia MD, Ambariyanto et al. (2008) Phylogeography and limited genetic
connectivity in the endangered boring giant clam across the coral triangle. Conservation Biology, 22, 1255–1266.
Dieckmann U, Doebeli MO (1999) On the origin of species by sympatric speciation. Nature,
400, 354–357. Fan S, Elmer KR, Meyer A (2012) Genomics of adaptation and speciation in cichlid fishes:
recent advances and analyses in African and Neotropical lineages. Philosophical Transactions of the Royal Society B: Biological Sciences, 367, 385–94.
Faucci A, Toonen RJ, Hadfield MG (2007) Host shift and speciation in a coral-feeding
nudibranch. Proceedings of the Royal Society B: Biological Sciences, 274, 111–119. Fitzpatrick JM, Carlon DB, Lippe C, Robertson DR (2011) The West Pacific diversity hotspot
as a source or sink for new species? Population genetic insights from the Indo-Pacific parrotfish Scarus rubroviolaceus. Molecular Ecology, 20, 219–234.
Folmer O, Black M, Hoeh W, Lutz R, Vrijenhoek R (1994) DNA primers for amplification of
mitochondrial cytochrome c oxidase subunit I from diverse metazoan invertebrates. Molecular Marine Biology and Biotechnology, 3, 294–9.
Forsman ZH, Barshis DJ, Hunter CL, Toonen RJ (2009) Shape-shifting corals: molecular
markers show morphology is evolutionarily plastic in Porites. BMC Evolutionary Biology, 9, 45.

134
Futuyma DJ, Moreno G (1988) The evolution of ecological specialization. Annual Review of Ecology and Systematic, 19, 207–33.
Gosliner T (2002) Biodiversity, endemism, and evolution of opisthobranch gastropods on
Indo-Pacific coral reefs. Proceedings 9th International Coral Reef Symposium, Bali, Indonesia, 2.
Gosliner TM, Fahey SJ (2011) Previously undocumented diversity and abundance of cryptic
species: A phylogenetic analysis of Indo-Pacific Arminidae Rafinesque, 1814 (Mollusca: Nudibranchia) with descriptions of 20 new species of Dermatobranchus. Zoological Journal of the Linnean Society, 161, 245–356.
Gosliner TM, Valdés Á, Behrens DW (2015) Nudibranch & Sea Slug Identification: Indo-
Pacific. New World Publications. Guindon S, Gascuel O (2003) A simple, fast, and accurate algorithm to estimate large
phylogenies by maximum likelihood. Systematic Biology, 52, 696–704. Hadfield M, Pennington J (1990) Nature of the metamorphic signal and its internal
transduction in larvae of the nudibranch Phestilla sibogae. Bulletin of Marine Science, 46, 455–464.
Hamm CA, Fordyce JA (2015) Patterns of host plant utilization and diversification in the
brush-footed butterflies. Evolution, 69, 589–601. Hébert JB, Scheffer SJ, Hawthorne DJ (2016) Evidence for ecological speciation via a host
shift in the holly leaf miner, Phytomyza glabricola (Diptera: Agromyzidae). Ecology and Evolution, 1–13.
Hollander J, Galindo J, Butlin RK (2015) Selection on outlier loci and their association with
adaptive phenotypes in Littorina saxatilis contact zones. Journal of Evolutionary Biology, 28, 328–337.
Hourigan TF, Reese ES (1987) Mid-ocean isolation and the evolution of Hawaiian reef
fishes. Trends in Ecology & Evolution, 2, 187–191. Hurt C, Silliman K, Anker A, Knowlton N (2013) Ecological speciation in anemone-
associated snapping shrimps (Alpheus armatus species complex). Molecular Ecology, 22, 4532–4548.
Janz N, Nylin S (2008) The Oscillation Hypothesis of Host-Plant Range and Speciation. In:
Specialization, Speciation, and Radiation: The Evolutionary Biology of Herbivorous Insects, pp. 203–215. University of California Press, Berkeley, CA.
Janz N, Nylin S, Wahlberg N et al. (2006) Diversity begets diversity: host expansions and
the diversification of plant-feeding insects. BMC Evolutionary Biology, 6, 4.

135
Jensen KR (1993) Morphological adaptations and plasticity of radular teeth of the
Sacoglossa (= Ascoglossa) (Mollusca: Opisthobranchia) in relation to their food plants. Biological Journal of the Linnean Society, 48, 135–155.
Jensen KR (1997) Evolution of the Sacoglossa (Mollusca, Opisthobranchia) and the
ecological associations with their food plants. Evolutionary Ecology, 11, 301–335. Kearse M, Moir R, Wilson A et al. (2012) Geneious Basic: An integrated and extendable
desktop software platform for the organization and analysis of sequence data. Bioinformatics, 28, 1647–1649.
Kitahara M V, Cairns SD, Stolarski J, Blair D, Miller DJ (2010) A Comprehensive
Phylogenetic Analysis of the Scleractinia (Cnidaria, Anthozoa) Based on Mitochondrial CO1 Sequence Data. PLoS ONE, 5.
Kjellberg F, Proffit M (2016) Tracking the elusive history of diversification in plant-
herbivorous insect-parasitoid food webs: Insights from figs and fig wasps. Molecular Ecology, 25, 843–845.
Knowlton N (1993) Sibling Species in the Sea. Annual Review of Ecology and Systematics,
24, 189. Krug PJ (2011) Patterns of speciation in marine gastropods: A review of the phylogenetic
evidence for localized radiations in the sea. American Malacological Bulletin, 29, 169–186.
Krug PJ, Vendetti JE, Rodriguez AK et al. (2013) Integrative species delimitation in
photosynthetic sea slugs reveals twenty candidate species in three nominal taxa studied for drug discovery, plastid symbiosis or biological control. Molecular Phylogenetics and Evolution, 69, 1101–1119.
Litsios G, Sims C a, Wüest RO et al. (2012) Mutualism with sea anemones triggered the
adaptive radiation of clownfishes. BMC Evolutionary Biology, 12, 212. López-Vaamonde C, Godfray HCJ, Cook JM (2003) Evolutionary Dynamics of Host-Plant
Use in a Genus of Leaf-Mining Moths. Evolution, 57, 1804–1821. Losos JB, Glor RE (2003) Phylogenetic comparative methods and the geography of
speciation. Trends in Ecology and Evolution, 18, 220–227. Lowry DB, Rockwood RC, Willis JH (2008) Ecological reproductive isolation of coast and
inland races of Mimulus guttatus. Evolution, 62, 2196–214.

136
Lu G, Bernatchez L (1999) Correlated Trophic Specialization and Genetic Divergence in Sympatric Lake Whitefish Ecotypes (Coregonus clupeaformis): Support for the Ecological Speciation Hypothesis. Evolution, 53, 1491–1505.
Malay MCMD, Michonneau F (2014) Phylogenetics and morphological evolution of coral-
dwelling barnacles (Balanomorpha: Pyrgomatidae). Biological Journal of the Linnean Society, 113, 162–179.
Marcus E, Marcus E (1960) Opisthobranchia aus dem Roten Meer und von den Malediven.
1959 (12). Akademie der Wissenschaften und der Literatur; in Kommission bei F. Steiner, Wisebaden.
Martin R (2003) Management of nematocysts in the alimentary tract and in cnidosacs of the
aeolid nudibranch gastropod Cratena peregrina. Marine Biology, 143, 533–541. Matsubayashi KW, Ohshima I, Nosil P (2010) Ecological speciation in phytophagous
insects. Entomologia Experimentalis et Applicata, 134, 1–27. Maynard Smith J (1966) Sympatric speciation. American Naturalist, 637-650. Mayr E (1942) Systematics and the Origin of Species from the Viewpoint of a Zoologist.
Harvard University Press, Cambridge, MA. Mayr E (1963). Animal species and evolution. Belknap Press of Harvard University Press,
Cambridge, MA. McClure M, Elias M, Ehrlich P et al. (2016) Unravelling the role of host plant expansion in
the diversification of a Neotropical butterfly genus. BMC Evolutionary Biology, 16, 128. McDonald G, Nybakken J (1997) A list of the worldwide food habits of nudibranchs. Veliger,
40. Meyer CP, Geller JB, Paulay G (2005) Fine scale endemism on coral reefs: archipelagic
differentiation in turbinid gastropods. Evolution, 59, 113–125. Miglietta MP, Faucci A, Santini F (2011) Speciation in the sea: Overview of the symposium
and discussion of future directions. Integrative and Comparative Biology, 51, 449–455. Miller MA, Pfeiffer W, Schwartz T (2010) Creating the CIPRES Science Gateway for
inference of large phylogenetic trees. 2010 Gateway Computing Environments Workshop, GCE 2010.
Moore EJ, Gosliner TM (2011) Molecular phylogeny and evolution of symbiosis in a clade of
Indopacific nudibranchs. Molecular Phylogenetics and Evolution, 58, 116–123.

137
Nyman T, Bokma F, Kopelke J-P et al. (2007) Reciprocal diversification in a complex plant-herbivore-parasitoid food web. BMC Biology, 5, 49.
Ornelas-Gatdula E, Dupont A, Valdes A (2011) The tail tells the tale: taxonomy and
biogeography of some Atlantic Chelidonura (Gastropoda: Cephalaspidea: Aglajidae) inferred from nuclear and mitochondrial gene data. Zoolical Journal of the Linnean Society, 163, 1077–1095.
Palumbi S, Martin A, Romano S (2002) The simple fool’s guide to PCR. Publication of the
University of Hawaii, 1–45. Parkinson JE, Baumgarten S, Michell CT et al. (2016) Gene Expression Variation Resolves
Species and Individual Strains among Coral-Associated Dinoflagellates within the Genus Symbiodinium. Genome Biology and Evolution, 8, 665–680.
Pola M, Camacho-García YE, Gosliner TM (2012) Molecular data illuminate cryptic
nudibranch species: The evolution of the Scyllaeidae (Nudibranchia: Dendronotina) with a revision of Notobryon. Zoological Journal of the Linnean Society, 165, 311–336.
Puillandre N, Lambert A, Brouillet S, Achaz G (2012) ABGD, Automatic Barcode Gap
Discovery for primary species delimitation. Molecular Ecology, 21, 1864–1877. Radwin GE, Wells HW (1968) Comparative Radular Morphology and Feeding Habits of
Muricid Gastropods From the Gulf of Mexico. Bulletin of Marine Science, 18, 72–85. Ravinet M, Westram A, Johannesson K et al. (2015) Shared and nonshared genomic
divergence in parallel ecotypes of Littorina saxatilis at a local scale. Molecular Ecology, 25, 287–305.
Roberts CM, McClean CJ, Veron JEN et al. (2002) Marine biodiversity hotspots and
conservation priorities for tropical reefs. Science, 295, 1280–4. Rocha LA, Robertson DR, Roman J, Bowen BW (2005) Ecological speciation in tropical reef
fishes. Proceedings of the Royal Society B: Biological Sciences, 272, 573–579. Ronquist F, Huelsenbeck JP (2003) MrBayes 3: Bayesian phylogenetic inference under
mixed models. Bioinformatics, 19, 1572–1574. Ronquist F, Teslenko M, van der Mark P et al. (2012) MrBayes 3.2: Efficient Bayesian
Phylogenetic Inference and Model Choice Across a Large Model Space. Systematic Biology, 61, 539–542.
Rudman WB (1979) The ecology and anatomy of a new species of aeolid opisthobranch
mollusc; a predator of the scleractinian coral Porites. Zoological Journal of the Linnean Society, 65, 339–350.

138
Rudman W (1981a) Further studies on the anatomy and ecology of opisthobranch molluscs feeding on the scleractinian coral Porites. Zoological Journal of the Linnean Society, 71, 373–412.
Rudman WB (1981b) Further studies on the anatomy and ecology of opisthobranch
molluscs feeding on the scleractinian coral Porites. Zoological Journal of the Linnean Society, 71, 373–412.
Rudman WB (1982) The taxonomy and biology of further aeolidacean and arminacean
nudibranch molluscs with symbiotic zooxanthellae. Zoological Journal of the Linnean Society, 74, 147–196.
Rundle HD, Nosil P (2005) Ecological speciation. Ecology Letters, 8, 336–352. Schluter D (2001) Ecology and the origin of species. Trends in Ecology and Evolution, 16,
372–380. Schluter D (2009) Evidence for ecological speciation and its alternative. Science, 323, 737–
741. Simmonds S (2016) Genomic Signatures of Natural Selection and Geographic Isolation in
Corallivorous Snails. (Doctoral dissertation). Retrieved from eSchholarship. http://escholarship.org/uc/item/4xs0b56d
Stamatakis A (2014) RAxML version 8: a tool for phylogenetic analysis and post-analysis of
large phylogenies. Bioinformatics, 30, 1312–3. Thoday J, Gibson J (1970) The probability of isolation by disruptive selection. American
Naturalist, 104, 500. Tsang LM, Chan BKK, Shih FL, Chu KH, Allen Chen C (2009) Host-associated speciation in
the coral barnacle Wanella milleporae (Cirripedia: Pyrgomatidae) inhabiting the Millepora coral. Molecular Ecology, 18, 1463–1475.
Veron JEN, Devantier LM, Turak E, Green AL (2007) Delineating the Coral Triangle. Global
Biodiversity, 1–14. Veron JEN, Stafford-Smith MG, Turak E, DeVantier LM (2016) Corals of the World.
Accessed 08/12/2016, version 0.01 (Beta). http://www.coralsoftheworld.org/page/home/.
Voris HK (2000) Maps of Pleistocene sea levels in Southeast Asia: shorelines, river
systems and time durations. Journal of Biogeography, 27, 1153–1167. Wägele H (2004) Potential key characters in Opisthobranchia (Gastropoda, Mollusca)
enhancing adaptive radiation. Organisms Diversity and Evolution, 4, 175–188.

139
Wecker P, Fournier A, Bosserelle P et al. (2015) Dinoflagellate diversity among nudibranchs
and sponges from French Polynesia: Insights into associations and transfer. Comptes Rendus Biologies, 338, 278–283.
Willette DA, Iñiguez AR, Kupriyanova EK et al. (2015) Christmas tree worms of Indo-Pacific
coral reefs: untangling the Spirobranchus corniculatus (Grube, 1862) complex. Coral Reefs, 34, 899–904.
Wilson NG, Burghardt I (2015) Here be dragons - phylogeography of Pteraeolidia ianthina
(Angas, 1864) reveals multiple species of photosynthetic nudibranchs (Aeolidina: Nudibranchia). Zoological Journal of the Linnean Society, 175, 119–133.

![V. SPECIATION A. Allopatric Speciation B. Parapatric Speciation (aka Local or Progenitor - Derivative) C. Adaptive Radiation D. Sympatric Speciation [Polyploidy]](https://img.pdfslide.net/doc/110x75/56649d3f5503460f94a186e2/v-speciation-a-allopatric-speciation-b-parapatric-speciation-aka-local.jpg)