Embed Size (px)
Citation preview

ETR 125, Energy & Wetlands Research Group, CES, IISc 2017
1 © Ramachandra T V, Bharath Setturu, Subash Chandran M D, Rao G R, Vishnu D. Mukri, Joshi N V. 2017. Ecologically Sensitive Regions in the Kali River Basin, Karnataka:
Delineation based on Ecological Principles and People’s Livelihood, ENVIS Technical Report 125, Sahyadri Conservation Series 68, Energy & Wetlands Research Group, CES, Indian
Institute of Science, Bangalore 560012
Ecologically Sensitive Regions in the Kali River Basin, Karnataka:
Delineation based on Ecological Principles and People’s Livelihood
RESEARCH HIGHLIGHTS:
Ecologically Sensitive Regions (ESRs) are the ‘ecological units’ with exceptional biotic and
abiotic elements. Identification of ESRs considering spatially both ecological and social
dimensions of environmental variables, helps in ecological and conservation planning as per
Biodiversity Act, 2002, Government of India.
Ecologically Sensitive Regions (ESR) should be prioritized based on conservation values
and threat levels and not under ‘political pressure’ or ‘threats from the economically
influential section of the society’ under the guise of ‘public pressure’.
The worth of forests in the district is evident from the revenue of Rs. 9707 to 15,171 crores per
year from the provisioning goods and services. This amounts to about Rs. 2 lakh per hectare
per year (Details in the Annexure).
The land use analysis highlights the decline of evergreen forest cover from 61.79 to 38.5 %
(1973-2016);
The Kali River basin has rich biodiversity with endemic flora and fauna;
Vital habitat for tiger (Panthera tigris), leopard, wild dog (dhole) and sloth bear;
Constitute an important elephant corridor between Karnataka and Maharashtra;
Important birds are Malabar Trogon, Malabar Pied Hornbill, Malabar Grey Hornbill, Indian
Grey Hornbill, Great Indian Hornbill, Emerald Dove, Ceylon Frog mouth, Pompador Pigeon
etc.;
ESR provide scope for habitat improvement, enhance the environmental services, reduce edge
effects, connectivity, reducing fragmentation of forests and also provides a physical barrier
from human encroachment.
Ecological importance is evident from the occurrence of perennial streams with catchment
having more than 65% native species of vegetation, while the streams are seasonal in the
catchment dominated by monoculture plantations (6-8 months) and agriculture (water retention
in streams is only for four months of monsoon).
The current move of de-notifying Kali tiger reserve area of 75% Eco Sensitive Zone will have
more adverse effect on ecology, hydrology and sustainability of natural resources. This
senseless action would enhance the instances of human animal conflicts, while eroding the
water security and people’s livelihood.
In this backdrop, Delineated ESRs outside PAs (Protected areas) in Kali river basin requiring
urgent protection from rising threat levels.
ESR delineations are to be on ecological principles with the vigorous scientific analyses
than shortsighted political strategies

ETR 125, Energy & Wetlands Research Group, CES, IISc 2017
2 © Ramachandra T V, Bharath Setturu, Subash Chandran M D, Rao G R, Vishnu D. Mukri, Joshi N V. 2017. Ecologically Sensitive Regions in the Kali River Basin, Karnataka:
Delineation based on Ecological Principles and People’s Livelihood, ENVIS Technical Report 125, Sahyadri Conservation Series 68, Energy & Wetlands Research Group, CES, Indian
Institute of Science, Bangalore 560012
ESRs at village levels are identified considering the integrated ecological framework with bio-
geo climatic variables.
ESR 1: highly sensitive regions requiring stringent conservation measures involving all stakeholders
including VFCs (Village forest committees).
ESR 2 represents a zone of higher conservation and forms a transition for highest conservation and moderate
conservation regions.
ESR 3 represents moderate conservation region and only regulated development is allowed in these areas.
ESR 4 represents least diversity areas and the developments are allowed as per the requirement by strict
vigilance from regulatory authorities. It is recommended that these regions are also has a lot of scope for
further enrichment of environment by stakeholders and forest department intervention.
SNO ESR TYPE AREA (Ha)
1 ESR-1 1,13,018.23
2 ESR-2 25,729.16
3 ESR-3 32,668.15
4 ESR-4 618.09
TOTAL AREA 1,72,033.6
ESR analyses reveal that 10 km buffer region is ecologicallyfragile zone and to be protected as Eco-
sensitive regions as per the norms of Environmental (Protection) Act, 1986.
Kali river basin covers a total of 524 villages spread across three districts (uttara Kannada, Belgaum
and Dharwad).
203 villages are in ESR 1, 73 villages in ESR-2, 77 villages in ESR-3, and 181 villages are in ESR 4.
The Kali river basin spread across the Uttara Kannada district has 331 villages and 190 villages are in
ESR-1.
Proritisation of ESRs helps in the implementation of sustainable developmental framework with the
appropriate conservation strategies through the involvement of local stakeholders.
The Community-based Conservation (CBC) of ESR 2 & 3 by invloving local communities, in the
conservation decision-making and sustainable management would help in the conservation of
biological diversity (or wildlife) as well as addressing the needs of people’s livelihood.
Proposed de-notification of eco-sensitive regions in the Kali River basin would create large-scale
environmental disturbances that have the potential of adversely changing the character of the natural
landscapes. This would spell ecological and economic catastrophe with the impending threat to water
security and people’s livelihood. Decision makers in the democratic India need to ensure the
sustenance of natural resources and prosperity of the local people than eroding the resource base
through unplanned senseless developmental activities.
DISTRICT NAME ESR-1 ESR-2 ESR-3 ESR-4 TOTAL
UTTARA KANNADA 190 45 48 48 331
BELGAUM 13 25 27 20 85
DHARWAD 0 3 2 103 108
KALI RIVER BASIN 203 73 77 171 524

ETR 125, Energy & Wetlands Research Group, CES, IISc 2017
3 © Ramachandra T V, Bharath Setturu, Subash Chandran M D, Rao G R, Vishnu D. Mukri, Joshi N V. 2017. Ecologically Sensitive Regions in the Kali River Basin, Karnataka:
Delineation based on Ecological Principles and People’s Livelihood, ENVIS Technical Report 125, Sahyadri Conservation Series 68, Energy & Wetlands Research Group, CES, Indian
Institute of Science, Bangalore 560012
Ecologically Sensitive Regions in the Kali River Basin, Karnataka: Delineation based on Ecological Principles and People’s Livelihood
Executive Summary:
Ecologically Sensitive Regions (ESRs) are the ‘ecological units’ with exceptional biotic and
abiotic elements. Identification of ESRs considering spatially both ecological and social
dimensions of environmental variables, helps in ecological and conservation planning as per
Biodiversity Act, 2002, Government of India. The current research attempts to integrate ecological
and environmental considerations into administration, and prioritizes regions at Panchayat levels
(local administrative unit) in Uttara Kannada district, Central Western Ghats, Karnataka state
considering attributes (biological, Geo climatic, Social, etc.) as ESR (1-4) through weightage score
metrics.
The Western Ghats one among 35 global hotspots of biodiversity. The Ghats are a range of hills
which were once covered with extensive forest all along the length from Gujarat to Kerala,
constitutes 5% of India’s landmass with 30% of plants and animals. The high level of fragility of
the Western Ghats ecosystems is due to its inherent geomorphological, climatic and biological
characteristics. The region consists of evergreen and semi evergreen forest with the exceptional
biodiversity of endemic flora and fauna: 4,600 species of flowering plants with 38% endemics,
330 butterflies with 11% endemics, 197 reptiles with 52% endemics, 529 birds with 4% endemics,
161 mammals with 9% endemics, 343 fishes with 31% endemics and 248 amphibians with 62%
endemics. The Western Ghats with increasing dry period northwards, exhibit a progressive decline
in tree endemics from south to the north. Of the 320 tree species considered endemic, 85% occur
at 8-10° N, which receive maximum of 8-10 months of rainfall. At 10-12 °N, the region has 71%
endemics, 43% in 12-14 °N, 22% in 14-16 °N, 17% in 16-18 °N and only 9% tree endemics north
of 18° (the locality with only 3-4 rainy months). The rich biodiversity coupled with higher
endemism is due to the humid tropical climate, topographical and geological characteristics, and
geographical isolation (Arabian Sea to the west and the semiarid Deccan Plateau to the east). The
Western Ghats is a thin north- south aligned strip of narrow forested hills with specific
geographical, climatological, geological, hydrological and biological aspects. Maintaining
ecological integrity by designating as Ecologically Sensitive Areas would aid in the long-term

ETR 125, Energy & Wetlands Research Group, CES, IISc 2017
4 © Ramachandra T V, Bharath Setturu, Subash Chandran M D, Rao G R, Vishnu D. Mukri, Joshi N V. 2017. Ecologically Sensitive Regions in the Kali River Basin, Karnataka:
Delineation based on Ecological Principles and People’s Livelihood, ENVIS Technical Report 125, Sahyadri Conservation Series 68, Energy & Wetlands Research Group, CES, Indian
Institute of Science, Bangalore 560012
preservation of biodiversity. The Western Ghats are the sources of all the rivers of the Deccan and
the coast. The protection of forests in the river catchment are essential for water and food security
with the sustained supply of water to the peninsular India and conservation of key species.
Protected areas (PA), national parks (NP), sanctuaries, nature reserves, wildlife refuges, wilderness
areas have been created through policy initiatives in order to protect the native habitat of endemic
species. Thus, PA system has evolved strategically to protect and maintain biological diversity,
cultural resources at local to global scales. Subsequently, the concept of ecologically sensitive
areas and community conserved areas has led to newer and wider frameworks for conservation at
the landscape level, with an appropriate legal sanctity through the Environment Protection Act
1986. Section 3(2)(v) of the Act empowers the central government to take all such measures that
it deems necessary to protect and improve the quality of the environment and prevent
environmental degradation. It allows for the restriction of areas in which certain developmental
activities can be prohibited. Further, section 5(1) of the Environment (Protection) Rules (EPR),
1986, specifies certain criteria like topographic and climatic features of an area, biological
diversity of the area, environmentally compatible land use, extensive cultivation, proximity to the
protected areas, etc. that can be considered while prohibiting or restricting certain operations in
different areas. Maintaining ecological integrity in the protected area with buffer region is essential
as most of protected landscapes are open systems that face anthropogenic and other biotic threats
from adjacent areas. Alterations in landscape structure with a reduction in contiguous forests
would increase the likelihood of invasive plants and animal range expansions, alter hydrologic
regime (water availability), which leads to the erosion of integrity of the protected ecosystems.This
necessitates identification and demarcation of effective ESRs considering the existing level of
impacts and their future spatial spread.
The river basin consists of prime protected areas namely the Kali Tiger Reserve and Hornbill
conservation reserve. Earlier, Anshi National Park and Dandeli Wildlife Sanctuary were together
granted the status of Project Tiger Reserve, and declared as 'Anshi Dandeli Tiger Reserve' (2007)
and subsequently renamed as Kali Tiger Reserve (December 2015). The Kali Tiger Reserve
(KTR) is a part of 8,800 Sq Km of tiger conservation landscape comprising Protected Areas and

ETR 125, Energy & Wetlands Research Group, CES, IISc 2017
5 © Ramachandra T V, Bharath Setturu, Subash Chandran M D, Rao G R, Vishnu D. Mukri, Joshi N V. 2017. Ecologically Sensitive Regions in the Kali River Basin, Karnataka:
Delineation based on Ecological Principles and People’s Livelihood, ENVIS Technical Report 125, Sahyadri Conservation Series 68, Energy & Wetlands Research Group, CES, Indian
Institute of Science, Bangalore 560012
reserved forests of Dandeli Wildlife Sanctuary towards north of KTR abutting Bhimghad Wildlife
Sanctuary and further connects Radhanagari and Koyna Wildlife Sanctuaries in Maharashtra and
Protected Areas in Goa State. Similarly reserve forests on the northeast of KTR forms permeable
landscapes for tigers. The reserved forests in the south, connects KTR with Bedthi and
Aghanashini Conservation Reserves and further down to Mookambika and Sharavathi Valley
Wildlife Sanctuaries.
The unplanned developmental activities and ad-hoc policy measures in PAs are altering forest
landscape structure, affecting the biodiversity, soil retention capacity, hydrologic regime, loss of
carbon sequestration potential, etc. Deforestation has been considered as one of the drivers of
global warming and consequent changes in the climate. Forests of Karnataka are experiencing
landscape dynamics from post-independence period due to the implementation of large-scale
developmental projects and deceitful policy measures. The Kali river basin is acting as a lifeline
for Uttara Kannada, parts of Belgaum and Dharwad districts through sustained hydrological and
other services. In this regard, spatiotemporal land use analyses and ecological sensitive regions
(ESR) of Kali river basin has been prepared. The land use analysis highlights the decline of
evergreen forest cover from 61.79 to 38.5 % (1973-2016). The natural forest cover has been
replaced with exotic species such as Acacia, Eucalyptus and Teak etc.. This has led to change in
major forest cover of Dandeli, Haliyal, and parts of Supa regions. The construction of series of
dams and reservoirs have submerged large-scale forest land by affecting ecology.
ESRs are demarcated at the village level in the Kali River basin considering bio-geo climatic
variables. The Kali river basin covers total 524 villages of across three districts – Uttara Kannada,
Belgaum and Dharwad (Table 3). Among these, 203 villages are in ESR-1, 73 villages are in ESR-
2 shows, 77 villages in ESR-3, and 181 villages in ESR-4. The Uttara Kannada district has 331
villages out of which 190 villages are in ESR-1. Forests of these villages need to be protected and
further degradation should not be allowed. The ESR 1 & ESR 2 is referred as ‘no go area’ with
respect to developments and ESR 4 is referred as a least possible eco-sensitive region. The
Community-based Conservation (CBC) of ESR 2 & 3 is anticipated as conservation of biological
diversity (or wildlife) based on the involvement of local communities, in decision-making. This
approach will help in improving local ecology by their inputs.
Keyword: Ecologically Sensitive Region (ESR), Biodiversity, Ecology, sustainability,

ETR 125, Energy & Wetlands Research Group, CES, IISc 2017
6 © Ramachandra T V, Bharath Setturu, Subash Chandran M D, Rao G R, Vishnu D. Mukri, Joshi N V. 2017. Ecologically Sensitive Regions in the Kali River Basin, Karnataka:
Delineation based on Ecological Principles and People’s Livelihood, ENVIS Technical Report 125, Sahyadri Conservation Series 68, Energy & Wetlands Research Group, CES, Indian
Institute of Science, Bangalore 560012
Ecologically Sensitive Regions in the Kali River Basin, Karnataka
1.0 Introduction
Ecosystems are the distinct biological entities that sustain the biosphere and characterised by a
range of functions: nutrient cycling, bio-geo chemical cycle, hydrologic cycling, etc. Ecological
sensitivity of ecosystems refers to their ability to cope with various kinds of environmental
disturbances that have the potential of adversely changing the character of the natural landscapes.
The conservation and sustainable management of ecosystems are the vital components in the
pursuit of development goals that are ecologically, economically and socially sustainable.
Sustainable development of a region requires a synoptic ecosystem approach that relates to the
dynamics of natural variability and the effects of human interventions on key indicators of
biodiversity and productivity (Ramachandra et al. 2007). This requires an understanding of the
complex functioning of ecosystems, diversity of resources, values, ecological services and their
significant ability in influencing climate at local as well as global scale.
Landscape with a mosaic of interconnected forest and non-forest patches constitute a
complex ecological, economic and socio-cultural systems. Forests are playing a crucial role in
sustaining life on the earth through maintaining ecological diversity, regulating climate, carbon
sequestration, protecting soil and hydrology etc., They provide abundant resources and livelihoods
for the world’s population (Gibson et al., 2011; Hansen et al., 2013). Forest ecosystems offer
numerous resources such as timber and non-timber forest products (NTFP), medicinal resources,
fuelwood and as well provide recreational values (Kindstrand et al. 2008). They act as prime
biodiversity repositories (Li et al., 2009) and mitigate global warming (Cabral et al., 2010) by
absorbing 30 % of fossil fuel CO2 emissions (Pan et al., 2011). The goods and services provided
by forested landscapes are vital to the socioeconomic development of human populations (DeFries
et al., 2004) and their survival (Ramachandra et al., 2016). However, the forests are being altered
due to the uncontrolled anthropogenic activities such as industrialization, agriculture,
deforestation, etc. affecting their structure and health. Forests cover about 31% today at globally
as opposed to 50% of the earth's land area 8000 years ago depleted with the expanded extents of
croplands, pastures, plantations, and urban areas (FAO, 2011). The Earth's land surface has lost 40
percent of natural forest by 1990 due to the expansion of cropland and permanent pasture
(Ramachandra & Shruthi, 2007). The rapid conversion of forests for agriculture, timber

ETR 125, Energy & Wetlands Research Group, CES, IISc 2017
7 © Ramachandra T V, Bharath Setturu, Subash Chandran M D, Rao G R, Vishnu D. Mukri, Joshi N V. 2017. Ecologically Sensitive Regions in the Kali River Basin, Karnataka:
Delineation based on Ecological Principles and People’s Livelihood, ENVIS Technical Report 125, Sahyadri Conservation Series 68, Energy & Wetlands Research Group, CES, Indian
Institute of Science, Bangalore 560012
production, infrastructure activities and other anthropogenic uses has generated vast, human-
dominated landscapes with potentially calamitous consequences for biodiversity to sustain.
Despite realizing the importance of these ecosystems, increasing awareness global deforestation
rates have remained alarmingly high over the past decades (DeFries et al., 2010).
Land use Land cover (LULC) information of a forested landscape serves as a basis for
understanding bio-geophysical processes and anthropogenic pressures on the ecosystem. The land
cover is referred as biophysical attributes of the earth’s surface and land use as human purpose or
intent applied to effective usage of these biophysical attributes (Lambin et al., 2001). LULC
changes include the land transformation from one land use to another, leading to land degradation
with the decline of biological, ecological, hydrological and economic productivity. LULC change
resulting in deforestation has been recognized as an important driver of global environmental
change. This necessitates quantification of LULC changes to evolve sustainable natural resource
management strategies. The uncontrolled LU changes in forest landscapes subdivide the
continuous native forests to more and smaller sizes and isolated forest patches (Laurance et al.,
2002; Bharath et al., 2012). Fragmentation is enumerated as a process of breaking contiguous
natural forest patches into smaller tracts of forest surrounded by other land uses, causing a
disruption in continuity of the natural landscape (Ramachanra et al., 2016). Habitat fragmentation
with subsequent edge effects caused by linear projects, infrastructure developments influence
ecosystem goods and services including carbon sequestration, hydrologic regime, and biodiversity
(Vinay et al., 2013; Bharath et al., 2014). The edge effect will lead to often perishing of large trees
and being replaced by short-lived pioneers, resulting in decreases in forest biomass and basal area
(Harper et al., 2005). The edges will aggravate predation (Cagnolo et al., 2006), fire susceptibility,
microclimate and enhance carbon emissions. The unrestrained deforestation rates will alter
microclimate of the region, lead to increase in land surface temperate and proliferation of exotic
species (Ramachandra et al., 2017).
The protected areas (PAs), national parks (NP), sanctuaries, nature/wildlife reserves, wildlife
refuges, wilderness areas are created to reduce the magnitude of land conversion, protecting native
habitat, biodiversity, and endemic species. Uncontrolled developmental activities, alarming
deforestation rates in forested areas stress the requirement of PAs to increase awareness and reduce
negative impacts on humankind. The protective measures based on global initiatives have resulted

ETR 125, Energy & Wetlands Research Group, CES, IISc 2017
8 © Ramachandra T V, Bharath Setturu, Subash Chandran M D, Rao G R, Vishnu D. Mukri, Joshi N V. 2017. Ecologically Sensitive Regions in the Kali River Basin, Karnataka:
Delineation based on Ecological Principles and People’s Livelihood, ENVIS Technical Report 125, Sahyadri Conservation Series 68, Energy & Wetlands Research Group, CES, Indian
Institute of Science, Bangalore 560012
in exponential growth of the world’s PAs over the past decades. The global forest cover of 7.7%
has the status of protection under IUCN’s four strictest protection categories (I-IV) as estimated
using earth observation satellite data from MODIS 2005 and the extent of the protected forest
using the World Database of Protected Areas (WDPA) for the year 2008 (Schmitt et al., 2009).
PAs have become a cornerstone of the global conservation for the persistence of biodiversity and
other natural processes in situ, through constraints on incompatible land uses (Possingham et al.,
2006). The basic role of PAs is to separate elements of biodiversity from processes that threaten
their existence in the wild (Hansen et al., 2007). Despite the high level of protection afforded
national parks and other protected areas, many are not functioning as originally envisioned due to
lack of proper management and socio-regulatory support. Exotic species are increasingly invading
protected areas and anthropogenic activities expanding and intensifying in the surrounding of
protected areas, resulting in changes in biodiversity ecological functions.
Conservation of forest ecosystem has become a critical task as increased high intensities of
anthropogenic disturbances in the form of LULC changes as compared to natural disturbance
processes (Kivinen and Kumpula, 2013). This has led to inspiring systematic conservation
planning approach as an increasingly vital tool for protecting the nature around the world.
Ecologically sensitive regions are defined under conservation planning approach as ‘‘large units
of land or water containing a geographically distinct assemblage of species, natural communities,
and environmental conditions” (Olson et al., 2001). ESR has the capacity to support and maintain
the balanced and integrated ecosystem in a particular region under protective measures. Systematic
conservation by prioritization of sensitive regions has become an effective and economical method
(Myers et al., 2000) and is widely used to improve ecosystem by conservation practices. With
respect to Indian scenario, Union Ministry of Environment Forests and Climate change (MoEFCC)
has taken an initiative to protect forests and maintenance under section 3of Environment
(Protection) Act 1986 (EPA). Central Government can prohibit or restrict the location of industries
and carry out certain operations on the basis of considerations like the ecological sensitivity under
section 5 of EPA 1986. The MoEFCC had set up Pronab Sen Committee in the year 2000 to
identify parameters for designating ESRs in the country to counter the rapid deterioration of the
environment, both nationally and internationally (MoEF, 2000). The committee has defined

ETR 125, Energy & Wetlands Research Group, CES, IISc 2017
9 © Ramachandra T V, Bharath Setturu, Subash Chandran M D, Rao G R, Vishnu D. Mukri, Joshi N V. 2017. Ecologically Sensitive Regions in the Kali River Basin, Karnataka:
Delineation based on Ecological Principles and People’s Livelihood, ENVIS Technical Report 125, Sahyadri Conservation Series 68, Energy & Wetlands Research Group, CES, Indian
Institute of Science, Bangalore 560012
ecological sensitivity or fragility as permanent and irreparable loss of extant life forms from the
world; or significant damage to the natural processes of evolution and speciation.
The comprehensive knowledge about LULC has become increasingly important for planning and
visualization of future growth to overcome the problems of haphazard, uncontrolled development
in ecologically sensitive regions (Kennedy et al., 2009). Temporal remote sensing data, geographic
information systems (GIS) techniques, free and open source software technologies are providing
efficient methods for the analysis of LULC dynamics required for planning and protection
(Ramachandra et al., 2014). The forests of Uttara Kannada are undergoing deforestation, while the
forest under protected areas showing the very little risk of being converted to other land uses. The
new unplanned developmental activities, un eco-friendly tourism activities are gaining more
priority and resulting in an irreplaceable loss in PAs. There is a miserable move to de-notify 75%
of Kali tiger reserve (KTR) eco-sensitive zone area (ESZ) (a major portion of Kali river basin) to
assist senseless developmental activities in the eco-sensitive regions. Gazette notification dated
November, 2016
The Central Government proposed 1201.94 km2 as Eco-sensitive zone as per the sub-section (1),
read with clause (v) and clause (xiv) of sub-section (2) and sub-section (3) of section 3 of the
Environment (Protection) Act, 1986 (29 of 1986) under sub-rule (3) of rule 5 of the Environment
(Protection) Rules, 1986. However, subsequent request by the State (due to political pressure and
the protests from the economically influential sections of the society), ESZ was reduced from
1201.94 km2 to 312.52 km2. The de-notification of PAs eco-sensitive zone would affect the
pristine forests influencing the water and food security apart from fragile ecology. In this regard,
the current research (i) delineates ecological sensitive regions at village levels based on bio-geo
climatic variables and (ii) understand land use dynamics in Kali river basin (Kali tiger reserve).
1.1 Study area: Kali River basin, Central Western Ghats - Kali river basin is the lifeline of
district and source for major agriculture, horticulture, and energy production. Kali river has a
catchment area of 5085.9 km2 spread across districts of Uttara Kannada (Ankola, Karwar, Supa,
Yellapur, Haliyal), Dharwad (Kalgatgi, Dharwad) and Belgaum (Khanapura, Bialhongal).
Uttara Kannada district forest region also referred as Kanara circle, comprises of 5 Territorial
Forest Divisions and a wildlife division (Figure 1). The divisions are (i) Haliyal forest (includes

ETR 125, Energy & Wetlands Research Group, CES, IISc 2017
10 © Ramachandra T V, Bharath Setturu, Subash Chandran M D, Rao G R, Vishnu D. Mukri, Joshi N V. 2017. Ecologically Sensitive Regions in the Kali River Basin, Karnataka:
Delineation based on Ecological Principles and People’s Livelihood, ENVIS Technical Report 125, Sahyadri Conservation Series 68, Energy & Wetlands Research Group, CES, Indian
Institute of Science, Bangalore 560012
taluks of Haliyal, part of Supa taluk); (ii) Honnavar forest division (comprises taluks of part of
Ankola, Kumta, Honnavar, Bhatkal); (iii) Karwar division (covers part of Ankola, Karwar, part
of Supa taluks); (iv) Sirsi division (covers Sirsi, Siddapura taluks); (v) Yellapur division (covers
Yellapur, Mundgod taluks).
Dandeli wildlife division (ADTR-Anshi Dandeli tiger reserve; KTR – Kali Tiger Reserve) covers
a major portion of Supa taluk. The total forest area of Uttara Kannada district is 8296 km2, (as per
the legal status) including areas released for various non-forestry activities and recent orders of
regularization of encroachment. The forest area under the control of the Forest Department is 7759
km2 (93.53% of the total forest area). The forest area under revenue and other departments are
536 km2. These divisions harbors varieties of endemic flora and fauna.
Population in the Kali River catchment has increased from 4,97,892 (in 2001) to 5,42,036 (in
2011) as per the Census of India (http://censusindia.gov.in) and is projected to increase to 5,66,065
in the year 2016 at the decadal growth rate of 8.8%. Population density in the catchment is 111
persons per square kilometer as on 2016. Major Population is contained at towns such as Dandeli,
Haliyar, Dharwad, Karwar, Yellapura, Ramnagar, Virje, Majali, Ammadalli.
The major vegetation types of Kali basin can be broadly grouped as ‘natural vegetation’ which
includes evergreen, moist deciduous and dry deciduous forests, ‘plantations or monocultures’
which includes plantations of Tectona grandis (Teak), Eucalyptus sp. (Bluegum) Casuarina
equisetifolia, Acacia auriculiformis, Acacia nilotica, and other exotics. The list of flora species
available in the region has provided in Annexure 1. The most threatened and vulnerable species
such as Wisneria triandra, Holigarna beddomei, Holigarna grahamii, Garcinia gummi_gutta,
Hopea ponga, Diospyros candolleana, Diospyros paniculata, Diospyros saldanhae,
Cinnamomum malabatrum, Myristica malabarica and Psydrax umbellate are found in the basin.
The forests are suffering from many detrimental developmental activities and policy interventions,
subsequently leading to the heavy removal of lofty trees across the district.
The dams/reservoirs (Supa dam, Bommanahalli reservoir, Tattihalla reservoir, Kodasalli dam,
Kadra dam, Kaneri dam) in Kali river basin are getting sustained water due to pristine forest cover
in Kali Tiger Reserve (KTR). The ADTR/KTR harbors diverse flora and faunal species with an
area of 1427.35 km2. The KTR was formed by merging Anshi national park, Dandeli Hornbill

ETR 125, Energy & Wetlands Research Group, CES, IISc 2017
11 © Ramachandra T V, Bharath Setturu, Subash Chandran M D, Rao G R, Vishnu D. Mukri, Joshi N V. 2017. Ecologically Sensitive Regions in the Kali River Basin, Karnataka:
Delineation based on Ecological Principles and People’s Livelihood, ENVIS Technical Report 125, Sahyadri Conservation Series 68, Energy & Wetlands Research Group, CES, Indian
Institute of Science, Bangalore 560012
reserve and Dandeli tiger reserve in the year 2010. The KTR has seen several drastic changes in
its boundaries due to various policy initiatives from past 60 decades. It was originally notified as
a game sanctuary covering an area of 127 km2 (on 10th May 1956). In 1975, it was declared as a
wildlife sanctuary with an expanded area of 5,729 km2 under project tiger. To facilitate
development projects such as hydroelectric, nuclear, a naval base, roads, transmission lines,
mining and other industries area of the sanctuary was reduced to 834 km2 in 1987. The
transmission lines of Kaiga nuclear power project has bisected thick forests, created numerous
edges and resulted to fragmentation of forests. The major thick woods were removed for power
lines to supply Hubli-Dharwad district, that in turn helped timber lobbies. The area further reduced
as Anshi national park of 475 km2 through a final notification issued on 09th March 1998. Then
realizing sensitiveness of region, ADTR has formed (1427.35 km2) by merging undisturbed
reserve forests in Anshi, Dandeli of Supa, Haliyal tauks as a final notification in 2010. In
December 2015, ADTR was renamed as Kali Tiger Reserve. The Kali Tiger Reserve (KTR) is a
part of 8,800 km2 of tiger conservation landscape comprising Protected Areas and reserved forests
of Dandeli Wildlife Sanctuary towards the north of KTR abutting Bhimghad Wildlife Sanctuary
and further connects Radhanagari and Koyna Wildlife Sanctuaries in Maharashtra. The reserved
forests in the south connects KTR with Bedthi and Aghanashini Conservation Reserves and
further down to Mookambika and Sharavathi Valley Wildlife Sanctuaries.
Figure 1 (a): Study area-Kali river basin.

ETR 125, Energy & Wetlands Research Group, CES, IISc 2017
12 © Ramachandra T V, Bharath Setturu, Subash Chandran M D, Rao G R, Vishnu D. Mukri, Joshi N V. 2017. Ecologically Sensitive Regions in the Kali River Basin, Karnataka:
Delineation based on Ecological Principles and People’s Livelihood, ENVIS Technical Report 125, Sahyadri Conservation Series 68, Energy & Wetlands Research Group, CES, Indian
Institute of Science, Bangalore 560012
Figure 1 (b, c): Flora and Faunal diversity of Kali River Basin.

ETR 125, Energy & Wetlands Research Group, CES, IISc 2017
13 © Ramachandra T V, Bharath Setturu, Subash Chandran M D, Rao G R, Vishnu D. Mukri, Joshi N V. 2017. Ecologically Sensitive Regions in the Kali River Basin, Karnataka:
Delineation based on Ecological Principles and People’s Livelihood, ENVIS Technical Report 125, Sahyadri Conservation Series 68, Energy & Wetlands Research Group, CES, Indian
Institute of Science, Bangalore 560012
2.0 Method:
Figure 2 outlines the protocol adopted for the analysis. Multiresolution RS data has been acquired
through the sensors of U.S. Geological Survey Earth Observation Satellites (EOS). The RS data
used in the study are Landsat multispectral sensor (MSS-1973), Operational Land Imager (OLI-
2016) and online Google Earth data (http://earth.google.com). The ancillary data is used to assist
the interpretation of different land use types from remote sensing data. Topographic maps provided
ground control points to rectify remotely sensed data and scanned paper maps (topographic maps).
Survey of India (SOI) toposheets (1:50000 and 1:250000 scales) and vegetation map of South
India developed by French Institute (1986) of scale 1:250000 was digitized to identify various
forest cover types and temporal analyses to find out the changes in vegetation. Pre-calibrated GPS
(Global Positioning System - Garmin GPS unit) for field measurements. Ground control points are
used to geometrically correct remote sensing data and also to validate the classified land use
information. The supervised classification scheme of Gaussian maximum likelihood classifier
(GMLC) scheme is adopted for land use analysis under 10 different land use categories using
GRASS GIS (Geographical Analysis Support System). GRASS is a free and open source
geospatial software with the robust functionalities for processing vector and raster data available
at (http://wgbis.ces.iisc.ernet.in/grass/). The training data (60%) collected has been used for
classification, while the balance is used for accuracy assessment to validate the classification. The
test samples are then used to create error matrix (also referred as confusion matrix) kappa (κ)
statistics and overall (producer's and user's) accuracies to assess the classification accuracies
(Lillesand et al., 2014).
The study area is divided into 5’×5’ equal area grids (97) covering approximately 9 km2 to account
the changes at micro scale. The data of various themes were collected based on literature,
unpublished datasets, and field surveys. A detailed database has been created for various themes
covering all aspects from land to estuarine ecosystem. The initial workflow has derived a series of
maps pertaining to various themes. The weightage metric score has been computed to captures the
priorities associated with various themes (Figure 3). Developing a weightage metric score analysis
requires combining knowledge from a wide array of disciplines (Termorshuizen & Opdam, 2009),
planning should acknowledge and actively integrate present and future needs for landscape. The
approach has chosen a framework proposed by Beinat, 1997 for weightaging eco-sensitive regions

ETR 125, Energy & Wetlands Research Group, CES, IISc 2017
14 © Ramachandra T V, Bharath Setturu, Subash Chandran M D, Rao G R, Vishnu D. Mukri, Joshi N V. 2017. Ecologically Sensitive Regions in the Kali River Basin, Karnataka:
Delineation based on Ecological Principles and People’s Livelihood, ENVIS Technical Report 125, Sahyadri Conservation Series 68, Energy & Wetlands Research Group, CES, Indian
Institute of Science, Bangalore 560012
because it provides an objective and transparent system for combining multiple data sets together
to infer the significance. The weightage is defined in Equation 1.
𝑊𝑒𝑖𝑔ℎ𝑎𝑡𝑔𝑒 = ∑ 𝑊𝑖𝑉𝑖𝑛𝑖=1 …(1)
Where n is the number of data sets, Vi is the value associated with criterion i, and Wi is the weight
associated with that criterion. Each criterion is described by an indicator mapped to a value
normalized between 10 to 1. The value 10 corresponds to very higher priority for conservation
whereas 1 is converse to above. The value 7, 5 and 3 corresponds to high, moderate, low levels of
conservation. In particular, the weightages, which is based on an individual proxy and draws
extensively on GIS techniques, stands out as the most effective method. The final ESR map will
result as a guide for the conservation of most sensitive regions and rest. The map can be used by
decisionmakers as a basis for effective planning.
Figure 2: Method followed for land use analysis

ETR 125, Energy & Wetlands Research Group, CES, IISc 2017
15 © Ramachandra T V, Bharath Setturu, Subash Chandran M D, Rao G R, Vishnu D. Mukri, Joshi N V. 2017. Ecologically Sensitive Regions in the Kali River Basin, Karnataka:
Delineation based on Ecological Principles and People’s Livelihood, ENVIS Technical Report 125, Sahyadri Conservation Series 68, Energy & Wetlands Research Group, CES, Indian
Institute of Science, Bangalore 560012
Figure 3: Computation of ecologically sensitive regions.
3.0 Results:
Spatiotemporal land use analysis: The forests of Kali river basin are acting as a rich resource
base in the Western Ghats of Uttara Kannada district and providing a livelihood for various people.
The land use analysis of Kali river basin depicts the spatiotemporal changes in this biodiversity-
rich region from year 1973 to 2016 (Figure 4 and Table 1). The evergreen forest cover was lost
due to hydroelectric, infrastructure projects and monoculture plantations from 61.79 to 38.5 %
(1973-2016). The natural forest cover has been replaced by the colonial forest department with
exotic species such as Acacia, Eucalyptus, and Teak etc. This has led to change in major forest
cover of Dandeli, Haliyal, and parts of Supa regions. The construction of series of dams and
reservoirs have submerged large-scale forest land by affecting ecology. The transmission lines of

ETR 125, Energy & Wetlands Research Group, CES, IISc 2017
16 © Ramachandra T V, Bharath Setturu, Subash Chandran M D, Rao G R, Vishnu D. Mukri, Joshi N V. 2017. Ecologically Sensitive Regions in the Kali River Basin, Karnataka:
Delineation based on Ecological Principles and People’s Livelihood, ENVIS Technical Report 125, Sahyadri Conservation Series 68, Energy & Wetlands Research Group, CES, Indian
Institute of Science, Bangalore 560012
Kaiga nuclear powerhouse have bisected greater forest patches across the basin. The land
conversion is major problem noticed i.e. conversion of forest to agriculture; agriculture to
coco/areca nut plantations. The rehabilitation due to river valley projects, reservoirs have altered
interior forests by the creation of more edges. The major portion of deciduous forest cover (7.82-
2.24 %) in the eastern portion of the basin has been transformed to agriculture area from 9 to 17.7
% by 2016.
SNO Year 1973 2016
Category Ha % Ha %
1 Evergreen to semi evergreen forest 314265.07 61.79 195829.13 38.50
2 Moist deciduous forest 76713.55 15.08 72231.41 14.20
3 Dry deciduous forest 39765.85 7.82 11369.70 2.24
4 Scrub forest/grass land 12857.72 2.53 17138.54 3.37
5 Teak/Bamboo/Acacia/Eucalyptus/Other plantations 8383.26 1.65 76666.09 15.07
6 Crop land 46783.90 9.20 90086.56 17.71
7 Coconut/Areca nut /Cashew nut plantations 54.26 0.01 8805.30 1.73
8 Open fields 5703.57 1.12 9449.90 1.86
9 Built-up 1985.22 0.39 8433.95 1.66
10 Water 2068.93 0.41 18570.75 3.65
Total 508581.33
Table 1: Temporal changes in land use of Kali river basin.
Figure 4: Land use dynamics in the Kali river basin.

ETR 125, Energy & Wetlands Research Group, CES, IISc 2017
17 © Ramachandra T V, Bharath Setturu, Subash Chandran M D, Rao G R, Vishnu D. Mukri, Joshi N V. 2017. Ecologically Sensitive Regions in the Kali River Basin, Karnataka:
Delineation based on Ecological Principles and People’s Livelihood, ENVIS Technical Report 125, Sahyadri Conservation Series 68, Energy & Wetlands Research Group, CES, Indian
Institute of Science, Bangalore 560012
Land uses in the KTR region (Figure 5) shows a forest loss from 91.5 to 71.85% due to protection
and inaccessibility as compared to Kali river basin. The dense core forests were lost due to the
construction of series of dams on river Kali and some area was replaced by plantations. The core
forest remained, which is mostly concentrated Supa taluk and Kali river valley regions. Roads are
another driver aid in the loss of core forest cover. The eastern portions of KTR region have major
teal plantations constitute 7.6% of land mass. There is continuous pressure in the periphery area
of KTR due to increase in the population of surrounding villages. The moist deciduous cover has
gained by replacing semi-evergreen cover from 4.8 to 11.12 % due to degradation in northern
portions. The core portion is still intact and supporting diverse flora and faunal species from
extinction. If the de-notification of KTR has considered, then it will be a great loss to ecology.
Pre-independence era tigers and elephants were distributed across the forests of Uttara Kannada,
now they are confined to only Kali river basin due to various other reasons. The entire basin is
acting as the lifeline for wildlife to thrive as it is the only habitat for key species such as tigers and
elephants in the district. The accuracy of classification has been verified with sample data collected
from the field and google earth. The overall accuracy of classification is 89, 91 % respectively for
1973 and 2016.
SNO Year 1973 2016
Category Ha % Ha %
1 Evergreen to semi evergreen forest 130660.7 91.5 102,558.63 71.85
2 Moist deciduous forest 6836.6 4.8 15,872.42 11.12
3 Dry deciduous forest 258.3 0.2 775.2 0.54
4 Scrub forest/grass land 2021.8 1.4 4297.06 3.01
5 Teak/Bamboo/Acacia/Eucalyptus/Other plantations 1202.8 0.8 10851.49 7.60
6 Crop land 895.2 0.6 4136.89 2.90
7 Coconut/Areca nut /Cashew nut plantations 0.0 0.0 0 0.00
8 Open fields 463.0 0.3 3019.57 2.12
9 Built-up 42.6 0.0 304.75 0.21
10 Water 354.5 0.2 919.45 0.64
Total 142735.5
Table 2: Temporal changes in land use of KTR.

ETR 125, Energy & Wetlands Research Group, CES, IISc 2017
18 © Ramachandra T V, Bharath Setturu, Subash Chandran M D, Rao G R, Vishnu D. Mukri, Joshi N V. 2017. Ecologically Sensitive Regions in the Kali River Basin, Karnataka:
Delineation based on Ecological Principles and People’s Livelihood, ENVIS Technical Report 125, Sahyadri Conservation Series 68, Energy & Wetlands Research Group, CES, Indian
Institute of Science, Bangalore 560012
Figure 5: Land use analysis of ADTR (KTR).
4.0 Ecological Sensitive Regions (ESR) of Kali Basin:
ESR demarcation was done to get a detailed picture of Kali basin considering various themes for
conservation planning. The various themes are selected and evaluated based on literature and field-
based measurements. The land use analysis highlights (Figure 6a) the major forest cover (> 80%)
has confined to KTR region, eastern parts are totally degraded due to higher pressure. The natural
forest cover left today is 54.94 % only. The wide-scale land clearing and subsequent agricultural
expansion, exotic plantations resulted in damage of large patches. The major developmental
projects further disturbed the landscape and reduced the distribution of forest cover. The forest
cover weightages (Figure 6b) shows higher, moderate ranking is observed in KTR and its
surrounding regions. The interior forest cover is considered as another important variable, which
emphasizes conservation connectivity and ecological functionalities (Figure 7a). The cultivation
in the nearby plots and roads are badly affecting natural cover. The more edge and perforated
ETR 125, Energy & Wetlands Research Group, CES, IISc 2017
19 © Ramachandra T V, Bharath Setturu, Subash Chandran M D, Rao G R, Vishnu D. Mukri, Joshi N V. 2017. Ecologically Sensitive Regions in the Kali River Basin, Karnataka:
Delineation based on Ecological Principles and People’s Livelihood, ENVIS Technical Report 125, Sahyadri Conservation Series 68, Energy & Wetlands Research Group, CES, Indian
Institute of Science, Bangalore 560012
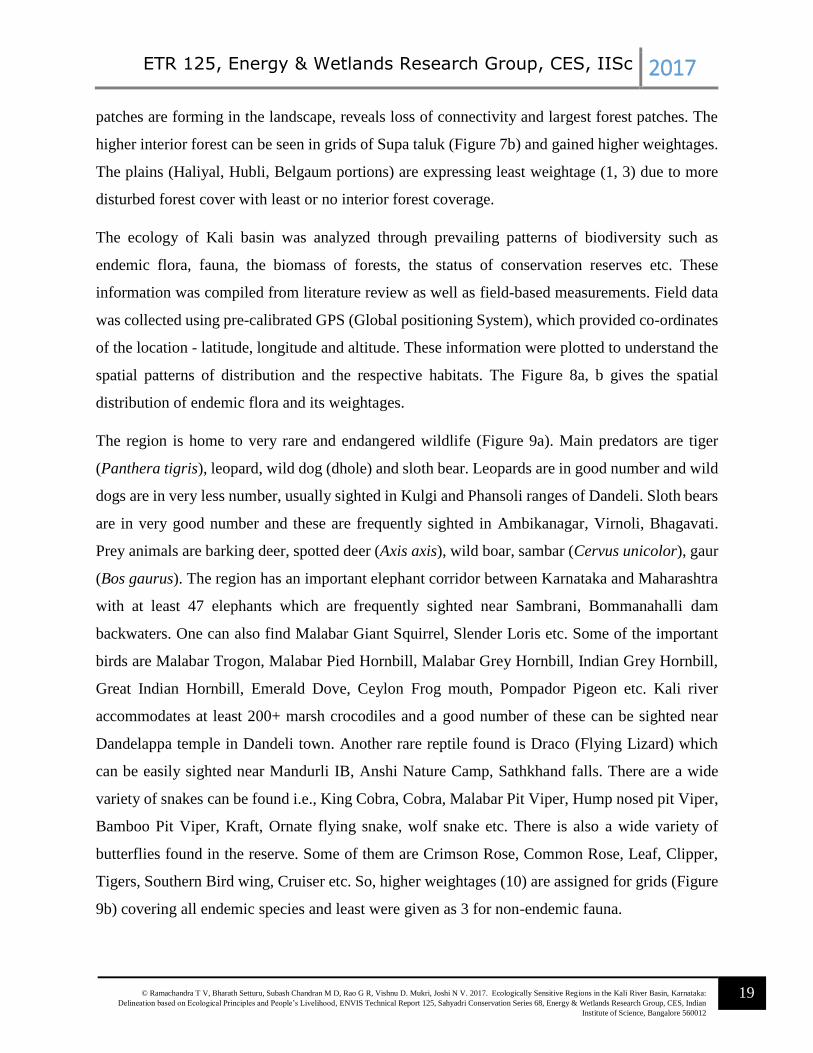
patches are forming in the landscape, reveals loss of connectivity and largest forest patches. The
higher interior forest can be seen in grids of Supa taluk (Figure 7b) and gained higher weightages.
The plains (Haliyal, Hubli, Belgaum portions) are expressing least weightage (1, 3) due to more
disturbed forest cover with least or no interior forest coverage.
The ecology of Kali basin was analyzed through prevailing patterns of biodiversity such as
endemic flora, fauna, the biomass of forests, the status of conservation reserves etc. These
information was compiled from literature review as well as field-based measurements. Field data
was collected using pre-calibrated GPS (Global positioning System), which provided co-ordinates
of the location - latitude, longitude and altitude. These information were plotted to understand the
spatial patterns of distribution and the respective habitats. The Figure 8a, b gives the spatial
distribution of endemic flora and its weightages.
The region is home to very rare and endangered wildlife (Figure 9a). Main predators are tiger
(Panthera tigris), leopard, wild dog (dhole) and sloth bear. Leopards are in good number and wild
dogs are in very less number, usually sighted in Kulgi and Phansoli ranges of Dandeli. Sloth bears
are in very good number and these are frequently sighted in Ambikanagar, Virnoli, Bhagavati.
Prey animals are barking deer, spotted deer (Axis axis), wild boar, sambar (Cervus unicolor), gaur
(Bos gaurus). The region has an important elephant corridor between Karnataka and Maharashtra
with at least 47 elephants which are frequently sighted near Sambrani, Bommanahalli dam
backwaters. One can also find Malabar Giant Squirrel, Slender Loris etc. Some of the important
birds are Malabar Trogon, Malabar Pied Hornbill, Malabar Grey Hornbill, Indian Grey Hornbill,
Great Indian Hornbill, Emerald Dove, Ceylon Frog mouth, Pompador Pigeon etc. Kali river
accommodates at least 200+ marsh crocodiles and a good number of these can be sighted near
Dandelappa temple in Dandeli town. Another rare reptile found is Draco (Flying Lizard) which
can be easily sighted near Mandurli IB, Anshi Nature Camp, Sathkhand falls. There are a wide
variety of snakes can be found i.e., King Cobra, Cobra, Malabar Pit Viper, Hump nosed pit Viper,
Bamboo Pit Viper, Kraft, Ornate flying snake, wolf snake etc. There is also a wide variety of
butterflies found in the reserve. Some of them are Crimson Rose, Common Rose, Leaf, Clipper,
Tigers, Southern Bird wing, Cruiser etc. So, higher weightages (10) are assigned for grids (Figure
9b) covering all endemic species and least were given as 3 for non-endemic fauna.

ETR 125, Energy & Wetlands Research Group, CES, IISc 2017
20 © Ramachandra T V, Bharath Setturu, Subash Chandran M D, Rao G R, Vishnu D. Mukri, Joshi N V. 2017. Ecologically Sensitive Regions in the Kali River Basin, Karnataka:
Delineation based on Ecological Principles and People’s Livelihood, ENVIS Technical Report 125, Sahyadri Conservation Series 68, Energy & Wetlands Research Group, CES, Indian
Institute of Science, Bangalore 560012
Biomass is considered as another significant variable in the analysis. The biomass data of
Ramachandra et al., 2013 is considered as a base to derive the important regions of biomass and
their protection. The analysis was calculated based on total standing biomass forest's vegetation
(as per Brown, 1997; Ramachandra et al., 2000) and using field data with the remote sensing data.
The dataset has used multiple regression equations for various regions. Statistically, significant
regression equations were obtained for computation. The field transacts wise basal area were
estimated using allometric equations. The basal area is also computed using regression equations
and compared with field transact wise estimations. The biomass at each grid wise is estimated
based on forest coverage (Figure 10a). The forests of Supa region have higher biomass (>1200
Gg) and eastern part deciduous to dry deciduous forests of Haliyal region have least biomass (<
200 Gg). The higher biomass regions are assigned greater weightages and vice versa (Figure 10b).
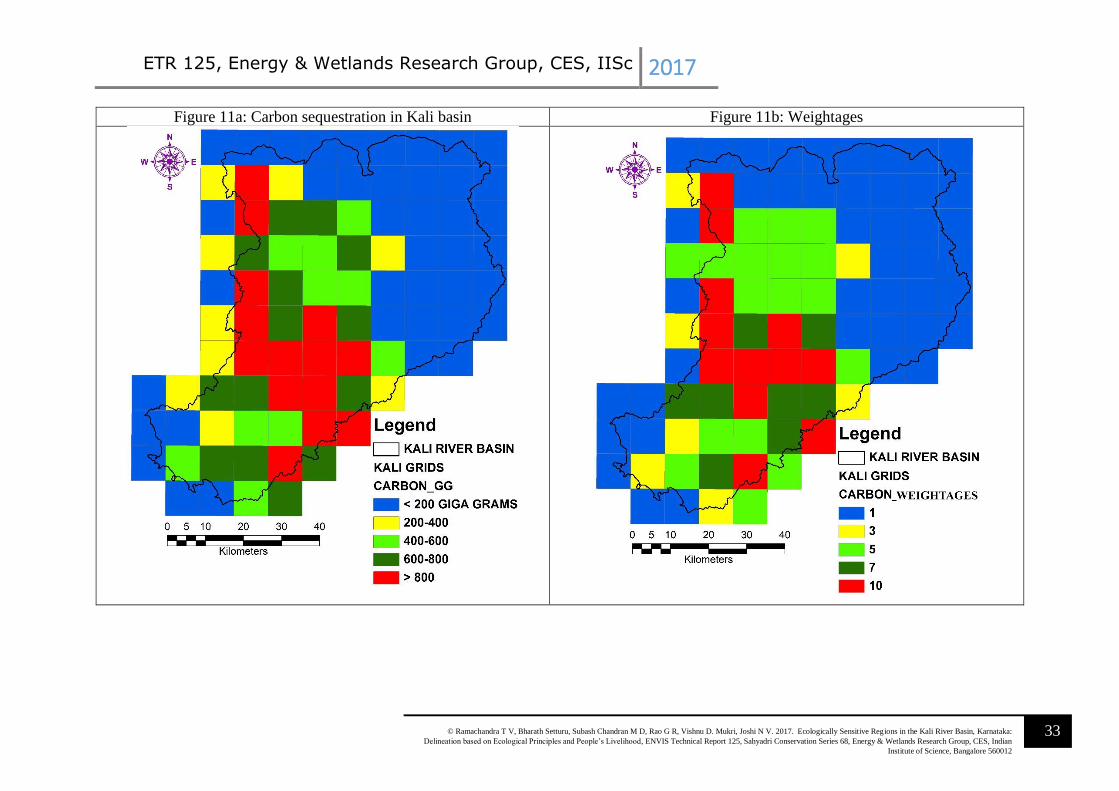
Net Carbon uptake by the forests of is estimated as half of the biomass as per standards and
literature. Since these regions are warehouse of carbon and degrading or disturbing these regions
will result in a higher carbon emission with the loss of carbon sequestration potential. This will
lead to an imbalance in the ecosystem and global warming, so higher conservation values are
assigned (Figure 11a, b). The uniform higher weightages (Figure 12a, b) are assigned to KTR as
it is acting as key eco-sensitive regions with diverse biodiversity.
Geo-climatic information of region has been analyzed to identify sensitive zones by considering
altitude, slope, and rainfall. The high altitude regions are prone to landslides due to heavy rain, has
extreme weather conditions, low humidity. The Figure 13a shows the altitude map of the district,
highest elevation is 1758 m in Supa taluk. The weightage map is generated by considering > 600
mt as a higher priority for conservation and > 400 m is moderate and rest is least concern (Figure
13b). Slope map (Figure 14a) is generated to identify the regions which are more sensitive;
alteration of these regions will have a higher impact. Increase in the population makes people move
towards sensitive areas like highlands without considering the slope because of soil fertility,
market based economy and agricultural intensification. In such areas, land scape disturbances will
lead to soil erosion, landslides, secondary plant succession, and ultimately to land abandonment.
The slope > 12 degrees is considered as a more sensitive region and assigned higher weightage
(Figure 14b). The rainfall pattern of the district is analyzed to mark the sensitive regions for
conservation. Most of the KTR region (Figure 15a) is falling in the high rainfall zone, except
ETR 125, Energy & Wetlands Research Group, CES, IISc 2017
21 © Ramachandra T V, Bharath Setturu, Subash Chandran M D, Rao G R, Vishnu D. Mukri, Joshi N V. 2017. Ecologically Sensitive Regions in the Kali River Basin, Karnataka:
Delineation based on Ecological Principles and People’s Livelihood, ENVIS Technical Report 125, Sahyadri Conservation Series 68, Energy & Wetlands Research Group, CES, Indian
Institute of Science, Bangalore 560012
eastern parts of Haliyal. The endemic species are well distributed in higher rainfall region. The
diversity, endemism, and rainfall are interrelated each other. The disturbance in these regions will
have a major impact on the landscape. The Figure 15b shows weightage map considering higher
rainfall gradient with greater weightage followed by moderate and low. Hydrology of the region
is analyzed by sub basin wise to account perennial, seasonal flows of the region. Perennial flows
of a region depict health of the ecosystem. The Figure 16a shows the stream flow at each grid of
the district. The KTR, Supa region shows water availability of 12 months in the streams due to
higher rainfall and forest cover. The weightages are assigned (Figure 16b) by considering perennial
regions as high and seasonal flows as lower.
Environmentally sound alternative sources of energy are considered for prioritization to highlight
the potentiality of them. Solar, Wind, Bioenergy data sets are collected and analyzed and
weightages assigned (Figure 17-19). The entire region receives an average solar insolation of 5.42
kWh/m2/day annually and has more than 300 clear sunny days. This solar potential can be utilized
to meet the domestic and irrigation electricity demand. Domestic demand of the household in a
rural region is about 50 to 100 kWh per month. The solar potential assessment reveals that
domestic demand can be supplied by installing rooftop SPV modules since less the 5% of the
rooftop is required in the majority of the houses and irrigation demand can be met by installing PV
modules in a wasteland where less than 3% of available wasteland area is sufficient. Bioresource
availability is computed based on the compilation of data on the area and productivity of
agriculture and horticulture crops, forests and plantations. Sector-wise energy demand is computed
based on the National Sample Survey Organisation (NSSO study) data, primary survey data and
from the literature. The supply/demand ratio in the district ranges from less than 0.5 to more the
2. If the ratio is less than 1 (demand >supply) then that place is fuelwood deficit place and where
the ratio is more than 1 (supply >demand) then that place is referred as fuelwood surplus region.
Wind resource assessment shows Wind speed varies from 1.9 m/s (6.84 km/hr.) to 3.93 m/s (14.15
km/hr.) throughout the year with a minimum in October and maximum in June and July.
Hybridizing wind energy systems with other locally available resources (solar, bioenergy) would
assure the reliable energy supply to meet the energy demand at decentralized levels.
The forest dwelling communities of the region are considered as one of the key variables in
prioritization (as per Forest Dwellers Act 2005 or Forests Rights Act 2005). These people are

ETR 125, Energy & Wetlands Research Group, CES, IISc 2017
22 © Ramachandra T V, Bharath Setturu, Subash Chandran M D, Rao G R, Vishnu D. Mukri, Joshi N V. 2017. Ecologically Sensitive Regions in the Kali River Basin, Karnataka:
Delineation based on Ecological Principles and People’s Livelihood, ENVIS Technical Report 125, Sahyadri Conservation Series 68, Energy & Wetlands Research Group, CES, Indian
Institute of Science, Bangalore 560012
directly and indirectly being contingent on forest resources. The forest dwelling communities are
Kunbis, Siddis, Goulis, Gondas. They are socially and politically backward and most of them
depend on casual labor, trading forest products for their livelihood. The presence of tribes
considered as higher weightages and absence is assigned least value (Figure 0a, b). Population
density is considered as another proxy of ESR mapping. The population density of each grid is
analyzed (Figure 21a) based on census data of 2011. It is evident that higher the population present,
higher the resource extraction (Figure 21b). The higher population density has considered as least
priority weightages (1) and lower density regions are projected as higher conservation priority
weightages (10).
Estuarine ecosystems are a tiny ribbon of land, but the emissions from their destruction are nearly
one-fifth of those attributed to deforestation worldwide (Pendelton et al., 2012). The major
mangrove species present are Rhizophora mucronata, Sonneratia alba, Avicennia marina,
Avicennia officinalis, Kandelia candel, Rhizophora apiculata, Sonneratia caseolaris. The farmers
also plant rows of mangrove trees just outside these bunds to fortify them from collapse. This
traditional system of estuarine cultivation with mangrove planting was a sustainable system. Kali
Estuary has major dams with hydro power stations have affected mangroves, fish yield, and other
substances. The weightages are assigned as per the data analyzed emphasizing productivity (Figure
22).
The weightage metric score associated with each theme has been computed and it resulted in
ecologically sensitive regions (ESR) of 1, 2, 3 and 4. Figure 23 shows 47 grids represent ESR 1, 9
grids represent ESR 2, 8 grids represent ESR 3 and the rest 23 grids represent ESR 4. The 54% of
the area of grids represents ESR 1, 10.34% of the area shows ESR 2, 9.19 % of the area shows
ESR 3 and only 26.44 % area covers ESR 4. The Figure 24 and table 5 shows village level
ecological sensitive region map with 4 categories. The ESR 1 represents zone of highest
conservation, no further degradation allowed. ESR 1 can be treated as a high sensitive region of
the district and more conservation is to be imposed by regulatory authorities as well as VFCs
(Village forest committees). ESR 2 represents a zone of higher conservation and forms a transition
for highest conservation and moderate conservation regions. ESR 3 represents moderate
conservation region and only regulated development is allowed in these areas. ESR 4 represents
least diversity areas and the developments are allowed as per the requirement by strict vigilance

ETR 125, Energy & Wetlands Research Group, CES, IISc 2017
23 © Ramachandra T V, Bharath Setturu, Subash Chandran M D, Rao G R, Vishnu D. Mukri, Joshi N V. 2017. Ecologically Sensitive Regions in the Kali River Basin, Karnataka:
Delineation based on Ecological Principles and People’s Livelihood, ENVIS Technical Report 125, Sahyadri Conservation Series 68, Energy & Wetlands Research Group, CES, Indian
Institute of Science, Bangalore 560012
from regulatory authorities. It is recommended that these regions are also has a lot of scope for
further enrichment of environment by stakeholders and forest department intervention. In ESR 2
& ESR 3 further developments are allowed by an only critical review from regulatory and
extensive consultations with stakeholders. Small scale tourism should be encouraged adopting
benefit sharing with local communities such as homestay, spice farms, eco-friendly boating etc.
The uncontrolled development should be discouraged in and around of pristine lakes, primeval
forest patches, perennial water bodies. The site specific (clustered base) sustainable developments
can be taken up at each panchayat, which least affect the ecosystem.
The village wise ESR delineation has shown in Figure 24 and Annexure 2 provides taluk wise
categorized ESR villages. The village wise ESR analysis shows Kali river basin covers total 524
villages of across three districts (Table 3). The ESR-1 shows 203 villages, ESR-2 shows 73
villages, ESR-3, 4 shows 77 and 181 villages respectively. The Uttara Kannada district has 331
villages out of which 190 villages depict ESR-1. Forests of these villages need to be protected and
further degradation should be allowed. The controlled and regulated activities in each ESR region
has shown in Table 4. The ADTR region its periphery of Kali basin is shown as a high conservation
priority zone (Figure 25) signifies the need for conservation by arresting further degradation.
Table 3: ESR Villages under various districts of Kali river basin.
SNO DISTRICT NAME ESR-1 ESR-2 ESR-3 ESR-4 TOTAL
1 UTTARA KANNADA 190 45 48 48 331
2 BELGAUM 13 25 27 20 85
3 DHARWAD 0 3 2 103 108
KALI RIVER BASIN 203 73 77 171 524
Table 4: Activities that can be allowed in ESR -1, 2 3 & 4.
SNO ACTIVITIES ECOLOGICALLY SENSITIVE REGIONS
ESR-1 ESR-2 ESR-3 ESR-4
1
ENERGY (A) Solar (Roof top)
(B) Wind power
(C) Bio energy
(D) Coal based (Thermal
power)
(E) Gas or liquid fuel based

ETR 125, Energy & Wetlands Research Group, CES, IISc 2017
24 © Ramachandra T V, Bharath Setturu, Subash Chandran M D, Rao G R, Vishnu D. Mukri, Joshi N V. 2017. Ecologically Sensitive Regions in the Kali River Basin, Karnataka:
Delineation based on Ecological Principles and People’s Livelihood, ENVIS Technical Report 125, Sahyadri Conservation Series 68, Energy & Wetlands Research Group, CES, Indian
Institute of Science, Bangalore 560012
(F) Hydro power (Major)
(G) Hydro power (Micro) (H) Nuclear power
2
FORESTS
(A) Land use change (Forest
to non-forest usages)
(B) Monoculture plantations
(C) Extraction of medicinal
plants (with strict
regulations)
(D) Forest improvement
through VFCs
(E) NTFP collection (Strict
regulation by
department)
3
AGRICULTURE (A) Agro forestry
(B) Organic farming (C) Land use change /
Encroachments
(D) Genetically modified
crops
(E) Animal Husbandry
4
HORTICULTURE (A) Organic farming
(B) Nitrogen and Phosphorus
(N&P) fertilizers Dosage as
prescribed by
Agriculture department (C) Endosulfan
(D) Pesticide
(E) Watermelon &
Muskmelon farming
5
INDUSTRIES (Larger scale) (A) Agro processing industries
(B) Information Technology
industries (IT) (C) Red category (Polluting)
industries
(D) Garment industries
(E) New establishment of
Industries
(Allowed only
after critical review by
local stake holders and
experts)
(F) Nonpolluting (Green)
Industries

ETR 125, Energy & Wetlands Research Group, CES, IISc 2017
25 © Ramachandra T V, Bharath Setturu, Subash Chandran M D, Rao G R, Vishnu D. Mukri, Joshi N V. 2017. Ecologically Sensitive Regions in the Kali River Basin, Karnataka:
Delineation based on Ecological Principles and People’s Livelihood, ENVIS Technical Report 125, Sahyadri Conservation Series 68, Energy & Wetlands Research Group, CES, Indian
Institute of Science, Bangalore 560012
6
INDUSTRIES (Small scale) (A) Garment industries
(B) Domestic (Home based)
industries
a. Papad
b. Mango processing c. Areca nut processing &
Coir industries d. Milk products and
processing
e. Dry fruits & Spices f. Fruit processing (Ex:
Kokum Juice (Garcinia
indica))
g. Fish products processing h. Bee keeping and bee
nurseries i. Pongamia plantations for
biofuel (in private lands) j. Bio pesticides
manufacturing k. Poultry farms and
powdered eggs l. Vegetable dyes; fruits and
vegetables preservation m. Medicinal plants
cultivation and processing n. Aromatic plants and
essential oil distillation;
orchids and cut flowers
harvesting industries
7
TOURISM INDUSTRY
(A) Ecotourism
(B) Organic village and home
stay
(C) VFC managed tourism (D) VFC managed home stay
tourism in higher forest
cover regions and
protected areas
(E) Arts and handicrafts
museum and trade center
8
MINING AND MINERAL
EXTRACTION
(A) Iron ore
(B) Manganese

ETR 125, Energy & Wetlands Research Group, CES, IISc 2017
26 © Ramachandra T V, Bharath Setturu, Subash Chandran M D, Rao G R, Vishnu D. Mukri, Joshi N V. 2017. Ecologically Sensitive Regions in the Kali River Basin, Karnataka:
Delineation based on Ecological Principles and People’s Livelihood, ENVIS Technical Report 125, Sahyadri Conservation Series 68, Energy & Wetlands Research Group, CES, Indian
Institute of Science, Bangalore 560012
(C) Bauxite
(D) Limestone (E) Quartz (F) Sand extraction (on
sustainable basis by
Ban on exporting)
9
WASTE DISPOSAL
(A) Hazardous waste
processing units
(B) Solid waste disposal (For composting and
manure preparation)
(C) Liquid waste discharge (Treatment plants
(STP) for processing) (D) Recycling and waste
processing and units
(compliant with PCB)
10
TRANSPORTATION
(Allowed only after
strict EIA) (A) Roads and express ways
(B) Rail and freight corridors Subject to EIA; Strict regulation and social audit
(C) Up gradation of existing
infrastructure
(Subject to
EIAs, strict
regulation and social audit)
Remarks The ESR-1 represents zone of highest conservation, no further degradation allowed. ESR-2 has the
potentiality to become as ESR-1 provided with strict regulations and improvement of forests and its
environs by more protection. A small change in ESR-2 will have more adverse effects in ESR-1.
Forest Rights Act to be implemented in its true spirit by reaching out to people.
Monoculture plantations are not allowed, existing exotics should be replaced by planting endemic
species.
Promote decentralized electricity, use of renewable energy sources such as (solar, wind power).
The local bio resource based industry should be promoted. All should be strictly regulated and be
subject to social audit.
Adapt development projects which will have a least environmental impact by involving local
community members in decision making and environmental monitoring.
No new major roads, railway lines are allowed, except when highly essential and subject to EIA, by
imposing strict regulation and social audit.
Tourism Master Plan should be based on MOEF regulations (after taking into account social and
environmental costs).
Controlled activities are permitted based on socio economic importance and activities such as
depriving wetlands, natural forests, the introduction of alien invasive species are not permitted.
ETR 125, Energy & Wetlands Research Group, CES, IISc 2017
27 © Ramachandra T V, Bharath Setturu, Subash Chandran M D, Rao G R, Vishnu D. Mukri, Joshi N V. 2017. Ecologically Sensitive Regions in the Kali River Basin, Karnataka:
Delineation based on Ecological Principles and People’s Livelihood, ENVIS Technical Report 125, Sahyadri Conservation Series 68, Energy & Wetlands Research Group, CES, Indian
Institute of Science, Bangalore 560012
KTR region is a sensitive habitat for wild flora and fauna. Asper Wildlife Conservation Strategy
2002, Union government had proposed a 10 km buffer region as eco fragile zones (Eco-Sensitive
Zones) around protected areas / national parks under Environmental (Protection) Act, 1986. Eco-
Sensitive Zones are being specified by the union government as transition zones around protected
forest areas, that would minimize forest depletion and human-animal conflict. These are intended
to provide habitat improvement, enhance the environmental services, reduce edge effects,
connectivity, reducing fragmentation of forests and also provides a physical barrier from human
encroachment. Eco-Sensitive Zones are areas adjacent to protected areas/ national parks, on which
land use is partially restricted to give an added layer of protection while providing valued benefits
to neighboring rural communities. But, in the last two years due to various political pressures, the
Environment Ministry approved a reduction of Eco-Sensitive Zones (from 10 km to 100m) by a
series of notifications for a number of national parks and wildlife sanctuaries. Honorable Supreme
Court while taking serious objections to these senseless reductions, has directed that a 10-km limit
was to be treated as the Eco-Sensitive Zones. The guidelines for Eco-Sensitive Zones proposed
that the boundary had to be site specific, decided in consultation with a field based team comprising
representatives from the forest department, revenue department and Panchayat Raj institution. The
objective of Eco-Sensitive Zones are not anti-people and do not intend to hamper their everyday
activities. But, it makes sure under a legal framework to support ecologically sensitive habitats
from further degradation of forests.
In the case of KTR, there is a serious move of reducing its Eco-Sensitive Zone (reduction of area
by 75%) to 100 m and also reducing the total area of the reserve by 30 %. In this regard, Figure 26
represent ESR of KTR region with 85 villages covered under three taluks. Annexure 3 provides
taluk wise village list for KTR region. Figure 27 represents villages covered in 10 km Eco-
Sensitive Zones of KTR region. The eco-sensitive region covers total 155 villages in which 97
falls in ESR-1, 26 falls under ESR-2 and 28, 4 falls under ESR-3,4 respectively (Annexure 4). The
Eco-Sensitive Zone needs to be enriched with native species to reduce further degradation. The
state government should focus on sustainable development than de-notifying region.

ETR 125, Energy & Wetlands Research Group, CES, IISc 2017
28 © Ramachandra T V, Bharath Setturu, Subash Chandran M D, Rao G R, Vishnu D. Mukri, Joshi N V. 2017. Ecologically Sensitive Regions in the Kali River Basin, Karnataka:
Delineation based on Ecological Principles and People’s Livelihood, ENVIS Technical Report 125, Sahyadri Conservation Series 68, Energy & Wetlands Research Group, CES, Indian
Institute of Science, Bangalore 560012
LAND
Figure 6a: Forest cover of Kali river basin Figure 6b: Forest cover weightage map

ETR 125, Energy & Wetlands Research Group, CES, IISc 2017
29 © Ramachandra T V, Bharath Setturu, Subash Chandran M D, Rao G R, Vishnu D. Mukri, Joshi N V. 2017. Ecologically Sensitive Regions in the Kali River Basin, Karnataka:
Delineation based on Ecological Principles and People’s Livelihood, ENVIS Technical Report 125, Sahyadri Conservation Series 68, Energy & Wetlands Research Group, CES, Indian
Institute of Science, Bangalore 560012
Figure 7a: Interior forest coverage of Kali basin Figure 7b: Interior forest weightage map

ETR 125, Energy & Wetlands Research Group, CES, IISc 2017
30 © Ramachandra T V, Bharath Setturu, Subash Chandran M D, Rao G R, Vishnu D. Mukri, Joshi N V. 2017. Ecologically Sensitive Regions in the Kali River Basin, Karnataka:
Delineation based on Ecological Principles and People’s Livelihood, ENVIS Technical Report 125, Sahyadri Conservation Series 68, Energy & Wetlands Research Group, CES, Indian
Institute of Science, Bangalore 560012
Ecology
Figure 8a: Floral diversity of Uttara Kannada Figure 8b: Weightages of flora

ETR 125, Energy & Wetlands Research Group, CES, IISc 2017
31 © Ramachandra T V, Bharath Setturu, Subash Chandran M D, Rao G R, Vishnu D. Mukri, Joshi N V. 2017. Ecologically Sensitive Regions in the Kali River Basin, Karnataka:
Delineation based on Ecological Principles and People’s Livelihood, ENVIS Technical Report 125, Sahyadri Conservation Series 68, Energy & Wetlands Research Group, CES, Indian
Institute of Science, Bangalore 560012
Figure 9a: Faunal diversity Figure 9b: Weightages of fauna

ETR 125, Energy & Wetlands Research Group, CES, IISc 2017
32 © Ramachandra T V, Bharath Setturu, Subash Chandran M D, Rao G R, Vishnu D. Mukri, Joshi N V. 2017. Ecologically Sensitive Regions in the Kali River Basin, Karnataka:
Delineation based on Ecological Principles and People’s Livelihood, ENVIS Technical Report 125, Sahyadri Conservation Series 68, Energy & Wetlands Research Group, CES, Indian
Institute of Science, Bangalore 560012
Figure 10a: Biomass of forests in Kali basin Figure 10b: Biomass weightages of forests
ETR 125, Energy & Wetlands Research Group, CES, IISc 2017
33 © Ramachandra T V, Bharath Setturu, Subash Chandran M D, Rao G R, Vishnu D. Mukri, Joshi N V. 2017. Ecologically Sensitive Regions in the Kali River Basin, Karnataka:
Delineation based on Ecological Principles and People’s Livelihood, ENVIS Technical Report 125, Sahyadri Conservation Series 68, Energy & Wetlands Research Group, CES, Indian
Institute of Science, Bangalore 560012
Figure 11a: Carbon sequestration in Kali basin Figure 11b: Weightages

ETR 125, Energy & Wetlands Research Group, CES, IISc 2017
34 © Ramachandra T V, Bharath Setturu, Subash Chandran M D, Rao G R, Vishnu D. Mukri, Joshi N V. 2017. Ecologically Sensitive Regions in the Kali River Basin, Karnataka:
Delineation based on Ecological Principles and People’s Livelihood, ENVIS Technical Report 125, Sahyadri Conservation Series 68, Energy & Wetlands Research Group, CES, Indian
Institute of Science, Bangalore 560012
Figure 12a: Conservation reserves of Kali basin Figure 12b: Weightages of reserves

ETR 125, Energy & Wetlands Research Group, CES, IISc 2017
35 © Ramachandra T V, Bharath Setturu, Subash Chandran M D, Rao G R, Vishnu D. Mukri, Joshi N V. 2017. Ecologically Sensitive Regions in the Kali River Basin, Karnataka:
Delineation based on Ecological Principles and People’s Livelihood, ENVIS Technical Report 125, Sahyadri Conservation Series 68, Energy & Wetlands Research Group, CES, Indian
Institute of Science, Bangalore 560012
Geo-Climatic
Figure 13a: Altitude (m) of Uttara Kannada Figure 13b: Weightages of altitude (m)

ETR 125, Energy & Wetlands Research Group, CES, IISc 2017
36 © Ramachandra T V, Bharath Setturu, Subash Chandran M D, Rao G R, Vishnu D. Mukri, Joshi N V. 2017. Ecologically Sensitive Regions in the Kali River Basin, Karnataka:
Delineation based on Ecological Principles and People’s Livelihood, ENVIS Technical Report 125, Sahyadri Conservation Series 68, Energy & Wetlands Research Group, CES, Indian
Institute of Science, Bangalore 560012
Figure 14a: Slope (%) map of Uttara Kannada Figure 14b: Weightage map of slope values

ETR 125, Energy & Wetlands Research Group, CES, IISc 2017
37 © Ramachandra T V, Bharath Setturu, Subash Chandran M D, Rao G R, Vishnu D. Mukri, Joshi N V. 2017. Ecologically Sensitive Regions in the Kali River Basin, Karnataka:
Delineation based on Ecological Principles and People’s Livelihood, ENVIS Technical Report 125, Sahyadri Conservation Series 68, Energy & Wetlands Research Group, CES, Indian
Institute of Science, Bangalore 560012
Figure 15a: Rainfall map of Uttara Kannada Figure 15b: Weightage map based on rainfall

ETR 125, Energy & Wetlands Research Group, CES, IISc 2017
38 © Ramachandra T V, Bharath Setturu, Subash Chandran M D, Rao G R, Vishnu D. Mukri, Joshi N V. 2017. Ecologically Sensitive Regions in the Kali River Basin, Karnataka:
Delineation based on Ecological Principles and People’s Livelihood, ENVIS Technical Report 125, Sahyadri Conservation Series 68, Energy & Wetlands Research Group, CES, Indian
Institute of Science, Bangalore 560012
Hydrology
Figure 16a: Stream flow status of Uttara Kannada Figure 16b: Weightages for stream flow

ETR 125, Energy & Wetlands Research Group, CES, IISc 2017
39 © Ramachandra T V, Bharath Setturu, Subash Chandran M D, Rao G R, Vishnu D. Mukri, Joshi N V. 2017. Ecologically Sensitive Regions in the Kali River Basin, Karnataka:
Delineation based on Ecological Principles and People’s Livelihood, ENVIS Technical Report 125, Sahyadri Conservation Series 68, Energy & Wetlands Research Group, CES, Indian
Institute of Science, Bangalore 560012
Energy
Figure 17: Solar energy Figure 18: Wind energy

ETR 125, Energy & Wetlands Research Group, CES, IISc 2017
40 © Ramachandra T V, Bharath Setturu, Subash Chandran M D, Rao G R, Vishnu D. Mukri, Joshi N V. 2017. Ecologically Sensitive Regions in the Kali River Basin, Karnataka:
Delineation based on Ecological Principles and People’s Livelihood, ENVIS Technical Report 125, Sahyadri Conservation Series 68, Energy & Wetlands Research Group, CES, Indian
Institute of Science, Bangalore 560012
Figure 19(a): Bio energy Figure 19(b): Weightages based on productivity

ETR 125, Energy & Wetlands Research Group, CES, IISc 2017
41 © Ramachandra T V, Bharath Setturu, Subash Chandran M D, Rao G R, Vishnu D. Mukri, Joshi N V. 2017. Ecologically Sensitive Regions in the Kali River Basin, Karnataka:
Delineation based on Ecological Principles and People’s Livelihood, ENVIS Technical Report 125, Sahyadri Conservation Series 68, Energy & Wetlands Research Group, CES, Indian
Institute of Science, Bangalore 560012
Social aspects
Figure 20a: Forest dwelling communities of Uttara Kannada Figure 20b: Weightage map of forest dwelling communities

ETR 125, Energy & Wetlands Research Group, CES, IISc 2017
42 © Ramachandra T V, Bharath Setturu, Subash Chandran M D, Rao G R, Vishnu D. Mukri, Joshi N V. 2017. Ecologically Sensitive Regions in the Kali River Basin, Karnataka:
Delineation based on Ecological Principles and People’s Livelihood, ENVIS Technical Report 125, Sahyadri Conservation Series 68, Energy & Wetlands Research Group, CES, Indian
Institute of Science, Bangalore 560012
Figure 21a: Population density map Figure 21b: Weightage associated with population density

ETR 125, Energy & Wetlands Research Group, CES, IISc 2017
43 © Ramachandra T V, Bharath Setturu, Subash Chandran M D, Rao G R, Vishnu D. Mukri, Joshi N V. 2017. Ecologically Sensitive Regions in the Kali River Basin, Karnataka:
Delineation based on Ecological Principles and People’s Livelihood, ENVIS Technical Report 125, Sahyadri Conservation Series 68, Energy & Wetlands Research Group, CES, Indian
Institute of Science, Bangalore 560012
Estuarine diversity
Figure 22: Estuarine diversity weightage map

ETR 125, Energy & Wetlands Research Group, CES, IISc 2017
44 © Ramachandra T V, Bharath Setturu, Subash Chandran M D, Rao G R, Vishnu D. Mukri, Joshi N V. 2017. Ecologically Sensitive Regions in the Kali River Basin, Karnataka:
Delineation based on Ecological Principles and People’s Livelihood, ENVIS Technical Report 125, Sahyadri Conservation Series 68, Energy & Wetlands Research Group, CES, Indian
Institute of Science, Bangalore 560012
Figure 23: Ecologically Sensitive Regions of Kali river basin

ETR 125, Energy & Wetlands Research Group, CES, IISc 2017
45 © Ramachandra T V, Bharath Setturu, Subash Chandran M D, Rao G R, Vishnu D. Mukri, Joshi N V. 2017. Ecologically Sensitive Regions in the Kali River Basin, Karnataka:
Delineation based on Ecological Principles and People’s Livelihood, ENVIS Technical Report 125, Sahyadri Conservation Series 68, Energy & Wetlands Research Group, CES, Indian
Institute of Science, Bangalore 560012
Figure 24: Ecologically Sensitive Regions of across various villages of basin

ETR 125, Energy & Wetlands Research Group, CES, IISc 2017
46 © Ramachandra T V, Bharath Setturu, Subash Chandran M D, Rao G R, Vishnu D. Mukri, Joshi N V. 2017. Ecologically Sensitive Regions in the Kali River Basin, Karnataka:
Delineation based on Ecological Principles and People’s Livelihood, ENVIS Technical Report 125, Sahyadri Conservation Series 68, Energy & Wetlands Research Group, CES, Indian
Institute of Science, Bangalore 560012
Figure 25: Ecologically Sensitive Regions of and KTR (ADTR)
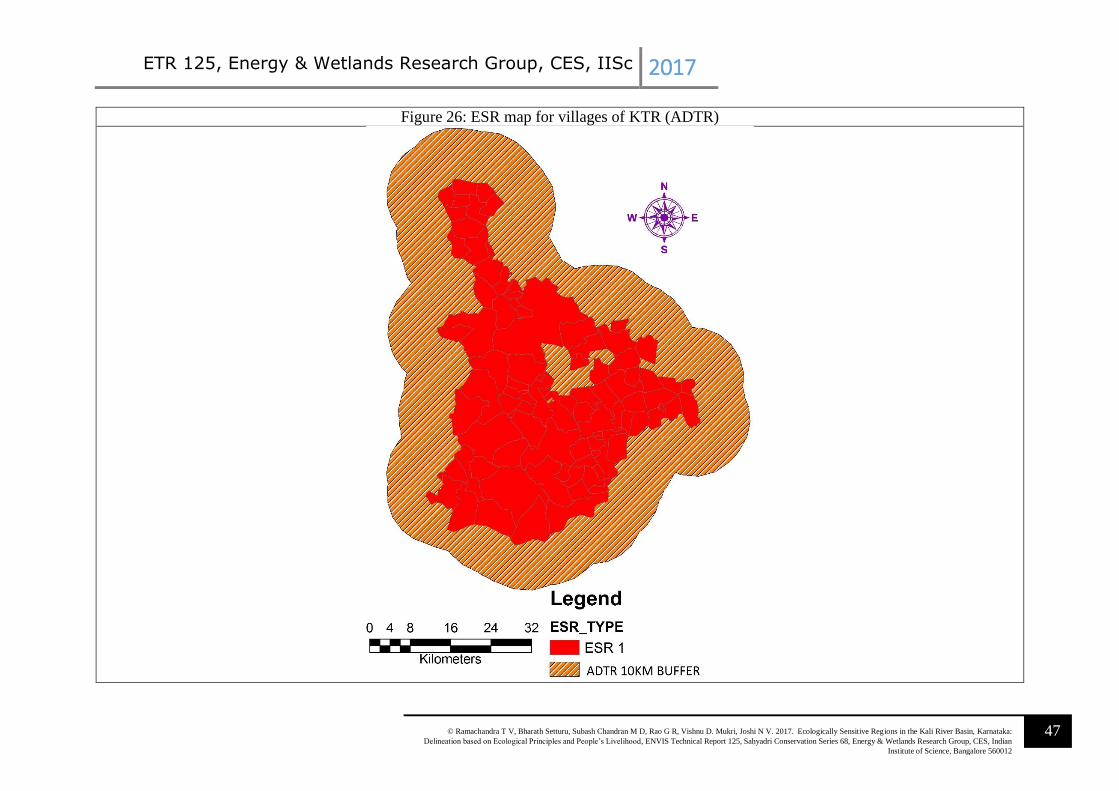
ETR 125, Energy & Wetlands Research Group, CES, IISc 2017
47 © Ramachandra T V, Bharath Setturu, Subash Chandran M D, Rao G R, Vishnu D. Mukri, Joshi N V. 2017. Ecologically Sensitive Regions in the Kali River Basin, Karnataka:
Delineation based on Ecological Principles and People’s Livelihood, ENVIS Technical Report 125, Sahyadri Conservation Series 68, Energy & Wetlands Research Group, CES, Indian
Institute of Science, Bangalore 560012
Figure 26: ESR map for villages of KTR (ADTR)

ETR 125, Energy & Wetlands Research Group, CES, IISc 2017
48 © Ramachandra T V, Bharath Setturu, Subash Chandran M D, Rao G R, Vishnu D. Mukri, Joshi N V. 2017. Ecologically Sensitive Regions in the Kali River Basin, Karnataka:
Delineation based on Ecological Principles and People’s Livelihood, ENVIS Technical Report 125, Sahyadri Conservation Series 68, Energy & Wetlands Research Group, CES, Indian
Institute of Science, Bangalore 560012
Figure 27: Village wise Ecologically Sensitive Regions of KTR with 10 km buffer

ETR 125, Energy & Wetlands Research Group, CES, IISc 2017
49 © Ramachandra T V, Bharath Setturu, Subash Chandran M D, Rao G R, Vishnu D. Mukri, Joshi N V. 2017. Ecologically Sensitive Regions in the Kali River Basin, Karnataka:
Delineation based on Ecological Principles and People’s Livelihood, ENVIS Technical Report 125, Sahyadri Conservation Series 68, Energy & Wetlands Research Group, CES, Indian
Institute of Science, Bangalore 560012
References:
1. Bharath Setturu, Bharath Aithal, H., Sanna Durgappa, D., Ramachandra T. V., 2012,
Landscape Dynamics through Spatial Metrics, Proceedings of India Geospatial Conference,
Epicenter, Gurgaon, India, 7-9 February, 2012.
2. Bharath Setturu, Rajan K S, Ramchandra T. V., 2014. Visualization of Forest Changes in
Uttara Kannada, Vol. 8, Proceedings Lake 2014, 13-15 November.
3. Cabral, A.I.R., Vasconcelos, M.J., Oom, D. and Sardinha, R., 2011. Spatial dynamics and
quantification of deforestation in the central-plateau woodlands of Angola (1990–2009).
Applied Geography, 31(3), pp.1185-1193.
4. Cagnolo, L., Cabido, M. and Valladares, G., 2006. Plant species richness in the Chaco Serrano
Woodland from central Argentina: ecological traits and habitat fragmentation effects.
Biological Conservation, 132(4), pp.510-519.
5. DeFries, R.S., Foley, J.A. and Asner, G.P., 2004. Land‐use choices: Balancing human needs
and ecosystem function. Frontiers in Ecology and the Environment, 2(5), pp.249-257.
6. DeFries, R.S., Rudel, T., Uriarte, M. and Hansen, M., 2010. Deforestation driven by urban
population growth and agricultural trade in the twenty-first century. Nature Geoscience, 3(3),
p.178.
7. FAO, 2011. State of the World's Forests. Research and Extension, FAO, Viale delle Terme di
Caracalla, 00153. Rome, Italy.
8. Gibson, L., Lee, T.M., Koh, L.P., Brook, B.W., Gardner, T.A., Barlow, J., Peres, C.A.,
Bradshaw, C.J., Laurance, W.F., Lovejoy, T.E. and Sodhi, N.S., 2011. Primary forests are
irreplaceable for sustaining tropical biodiversity. Nature, 478(7369), p.378.
9. Hansen, A.J., DeFries R., 2007. Ecological mechanisms linking protected areas to surrounding
lands Ecol. Appl., 974-988.
10. Hansen, M.C., Potapov, P.V., Moore, R., Hancher, M., Turubanova, S., Tyukavina, A., Thau,
D., Stehman, S.V., Goetz, S.J., Loveland, T.R. and Kommareddy, A., 2013. High-resolution
global maps of 21st-century forest cover change. science, 342(6160), pp.850-853.
11. Harper, K.A., Macdonald, S.E., Burton, P.J., Chen, J., Brosofske, K.D., Saunders, S.C.,
Euskirchen, E.S., Roberts, D.A.R., Jaiteh, M.S. and Esseen, P.A., 2005. Edge influence on

ETR 125, Energy & Wetlands Research Group, CES, IISc 2017
50 © Ramachandra T V, Bharath Setturu, Subash Chandran M D, Rao G R, Vishnu D. Mukri, Joshi N V. 2017. Ecologically Sensitive Regions in the Kali River Basin, Karnataka:
Delineation based on Ecological Principles and People’s Livelihood, ENVIS Technical Report 125, Sahyadri Conservation Series 68, Energy & Wetlands Research Group, CES, Indian
Institute of Science, Bangalore 560012
forest structure and composition in fragmented landscapes. Conservation Biology, 19(3),
pp.768-782.
12. Kennedy, R.E., Townsend, P.A., Gross, J.E., Cohen, W.B., Bolstad, P., Wang, Y.Q. and
Adams, P., 2009. Remote sensing change detection tools for natural resource managers:
Understanding concepts and tradeoffs in the design of landscape monitoring projects. Remote
sensing of environment, 113(7), pp.1382-1396.
13. Kindstrand, C., Norman, J., Boman, M. and Mattsson, L., 2008. Attitudes towards various
forest functions: A comparison between private forest owners and forest officers. Scandinavian
Journal of Forest Research, 23(2), pp.133-136.
14. Kivinen, S. and Kumpula, T., 2014. Detecting land cover disturbances in the Lappi reindeer
herding district using multi-source remote sensing and GIS data. International Journal of
Applied Earth Observation and Geoinformation, 27, pp.13-19.
15. Lambin, E. F., Geist, H., Lepers, E., 2003. Dynamics of land use and land cover change in
tropical regions. Environment and Resources, 28, 205–241.
16. Laurance, W.F., Lovejoy, T.E., Vasconcelos, H.L., Bruna, E.M., Didham, R.K., Stouffer, P.C.,
Gascon, C., Bierregaard, R.O., Laurance, S.G., Sampaio, E., 2002. Ecosystem decay of
Amazonian forest fragments: a 22-year investigation. Conservation Biology 16, pp. 605–618.
17. Li, M., Huang, C., Zhu, Z., Wen, W., Xu, D. and Liu, A., 2009. Use of remote sensing coupled
with a vegetation change tracker model to assess rates of forest change and fragmentation in
Mississippi, USA. International Journal of Remote Sensing, 30(24), pp.6559-6574.
18. Lillesand, T., Kiefer, R.W. and Chipman, J., 2014. Remote sensing and image interpretation.
John Wiley & Sons, Newyork.
19. Olson, D.M., Dinerstein, E., Wikramanayake, E.D., Burgess, N.D., Powell, G.V.N.,
Underwood, E.C., D’Amico, J.A., Itoua, I., Strand, H.E., Morrison, J.C., Loucks, C.J., Allnutt,
T.F., Ricketts, T.H., Kura, Y., Lamoreux, J.F., Wettengel, W.W., Hedao, P., Kassem, K.R.,
2001. Terrestrial ecoregions of the world: a new map of life on earth. BioScience 51, 933–938.
20. MoEF, 2000. Report of the Committee on identifying parameters for designating Ecologically
Sensitive Areas in India (Pronab Sen Committee Report).
21. Myers, N., Mittermeier, R., Mittermeier, C., da Fonseca, G., Kent, J., 2000. Biodiversity
hotspots for conservation priorities, Nature, 403 (6772), 853-858.

ETR 125, Energy & Wetlands Research Group, CES, IISc 2017
51 © Ramachandra T V, Bharath Setturu, Subash Chandran M D, Rao G R, Vishnu D. Mukri, Joshi N V. 2017. Ecologically Sensitive Regions in the Kali River Basin, Karnataka:
Delineation based on Ecological Principles and People’s Livelihood, ENVIS Technical Report 125, Sahyadri Conservation Series 68, Energy & Wetlands Research Group, CES, Indian
Institute of Science, Bangalore 560012
22. Pan, Y., Birdsey, R.A., Fang, J., Houghton, R., Kauppi, P.E., Kurz, W.A., Phillips, O.L.,
Shvidenko, A., Lewis, S.L., Canadell, J.G. and Ciais, P., 2011. A large and persistent carbon
sink in the world’s forests. Science, 333(6045), pp.988-993.
23. Possingham, H.P., Wilson, K.A., Aldeman, S. J. and Vynne, C. H., 2006. Protected areas:
goals, limitations, and design. Pages 509–551 in Groom, M.J., Meffe, G.K. and Carroll, C.R.,
editors. Principles of conservation biology. Third edition. Sinauer Associates, Sunderland,
Massachusetts, USA.
24. Ramachandra T.V. and Shruthi, B.V., 2007. Spatial mapping of renewable energy potential,
Renewable and Sustainable Energy Reviews, 11(7):1460-1480.
25. Ramachandra TV, Chandran MDS, Gururaja KV, Sreekantha (2007) Cumulative
Environmental Impact Assessment, Nova Science Publishers, New York.
26. Ramachandra, T.V., Setturu Bharath and Aithal Bharath., 2014. Spatio-temporal dynamics
along the terrain gradient of diverse landscape, Journal of Environmental Engineering and
Landscape Management, 22:1, 50-63, doi:http://dx.doi.org/10.3846/16486897.2013.808639.
27. Ramachandra, T.V., Setturu, B. and Chandran, S., 2016. Geospatial analysis of forest
fragmentation in Uttara Kannada District, India. Forest Ecosystems, 3(1), p.10.
28. Ramachandra, T.V., Bharath, S. and Gupta, N., 2017. Modelling landscape dynamics with LST
in protected areas of Western Ghats, Karnataka. Journal of Environmental Management, Aug
9, Article in press.
29. Reddy, C.S., Satish, K.V., Jha, C.S., Diwakar, P.G., Murthy, Y.K. and Dadhwal, V.K., 2016.
Development of deforestation and land cover database for Bhutan (1930–2014).
Environmental monitoring and assessment, 188(12), p.658.
30. Schmitt, C.B., Burgess, N.D., Coad, L., Belokurov, A., Besançon, C., Boisrobert, L.,
Campbell, A., Fish, L., Gliddon, D., Humphries, K. and Kapos, V., 2009. Global analysis of
the protection status of the world’s forests. Biological Conservation, 142(10), pp.2122-2130.
31. Vinay, S., Bharath, S., Bharath, H.A., Ramachandra, T.V., 2013. Hydrologic model with
landscape dynamics for drought monitoring. In proceeding of: Joint International Workshop
of ISPRS WG VIII/1 and WG IV/4 on Geospatial Data for Disaster and Risk Reduction,
Hyderabad, November (pp. 21-22).