Embed Size (px)
Citation preview
Ecology
Energy Flow
Ecosystem Structure
Interactions Among Species
Population Dynamics
Reproductive Patterns
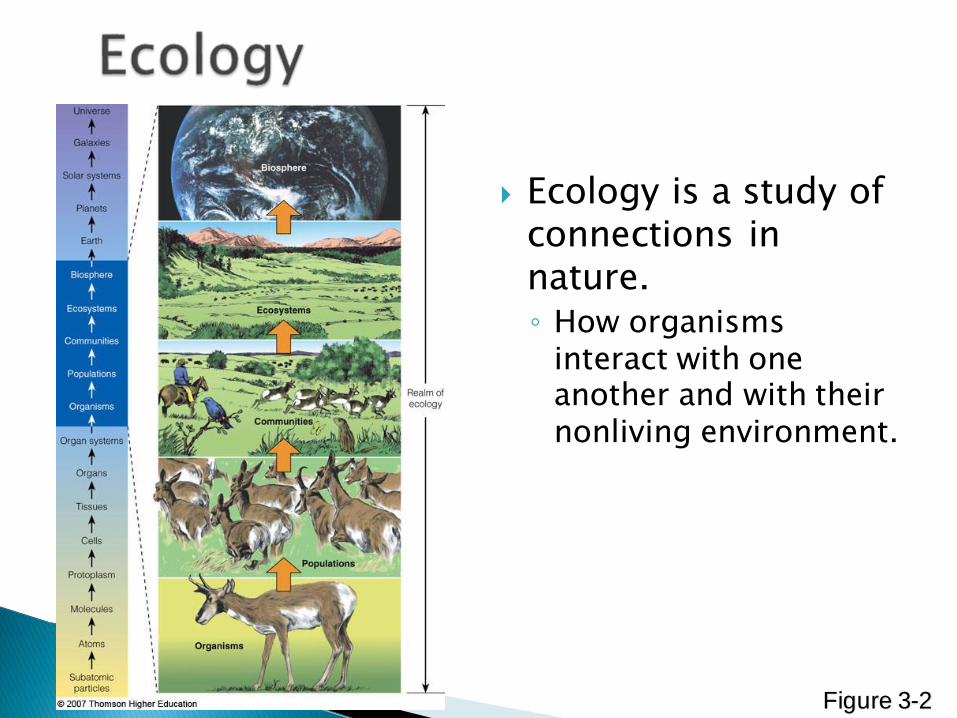
Ecology is a study of connections in nature.◦ How organisms
interact with one another and with their nonliving environment.
Figure 3-2
• Ecosystem- A community of different species interacting together & with the chemical & physical factors making up its non-living environment.
• Species- groups of organisms that can mate and produce fertile offspring (5 to 100 million on earth).
• Population- A group of individual organisms of the same species living w/in a particular area.
• Communities- The population of all species living & interacting in an area.
• Habitat- The place where an organism or a population lives.
• Niche- The total way of life or role of a species in an ecosystem. – All the physical, chemical, and biological conditions a species needs to live
& reproduce in an ecosystem.
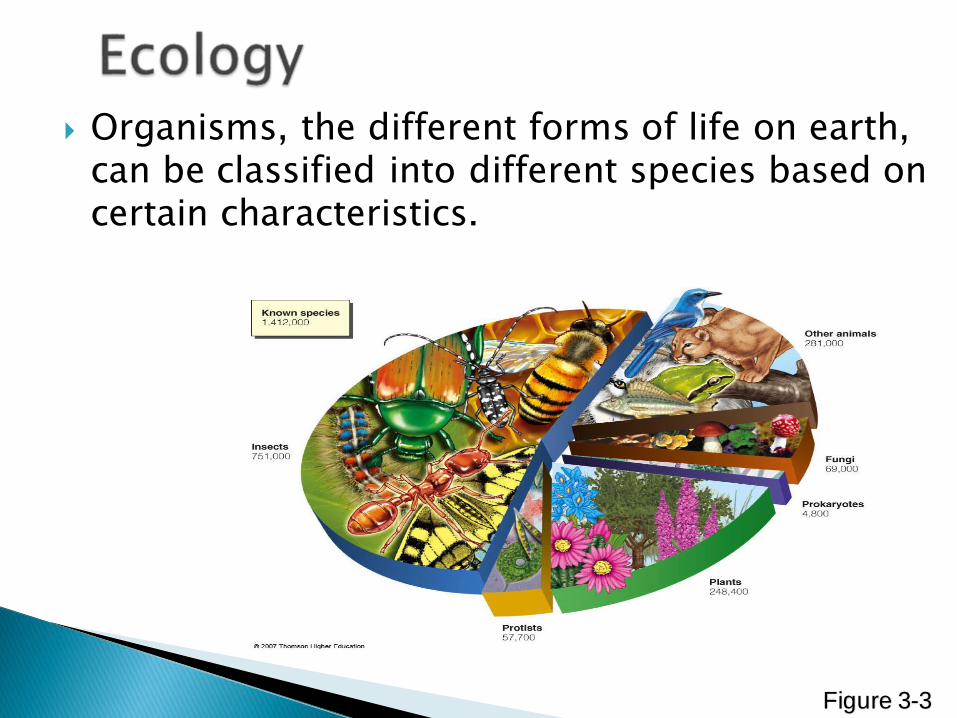
Organisms, the different forms of life on earth, can be classified into different species based on certain characteristics.
Figure 3-3
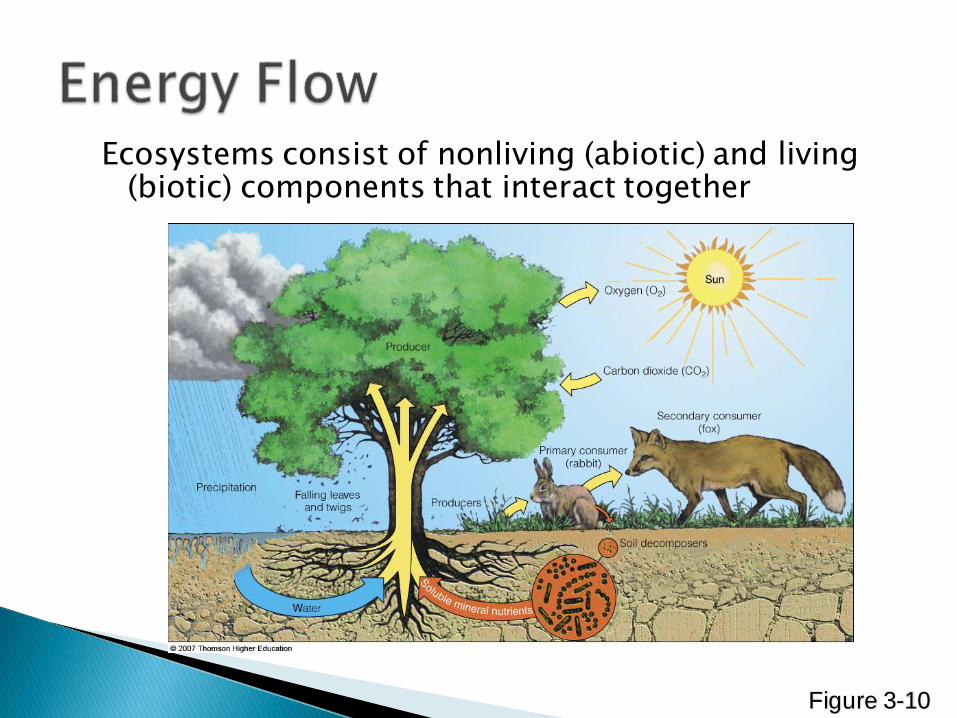
Ecosystems consist of nonliving (abiotic) and living (biotic) components that interact together
Figure 3-10
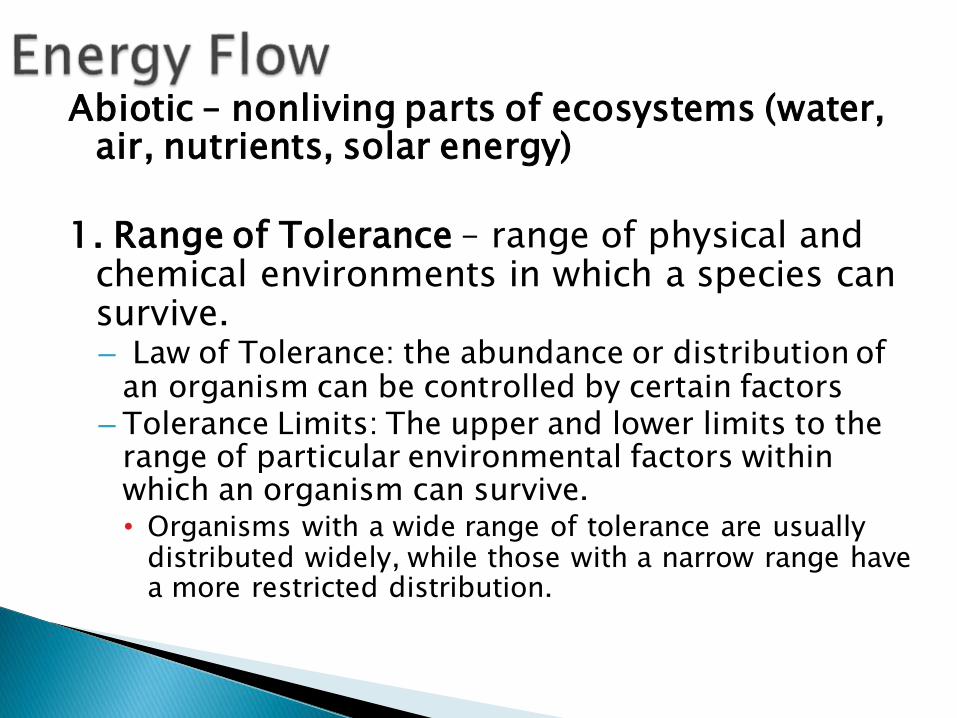
Abiotic – nonliving parts of ecosystems (water, air, nutrients, solar energy)
1. Range of Tolerance – range of physical and chemical environments in which a species can survive.– Law of Tolerance: the abundance or distribution of
an organism can be controlled by certain factors– Tolerance Limits: The upper and lower limits to the
range of particular environmental factors within which an organism can survive.• Organisms with a wide range of tolerance are usually
distributed widely, while those with a narrow range have a more restricted distribution.
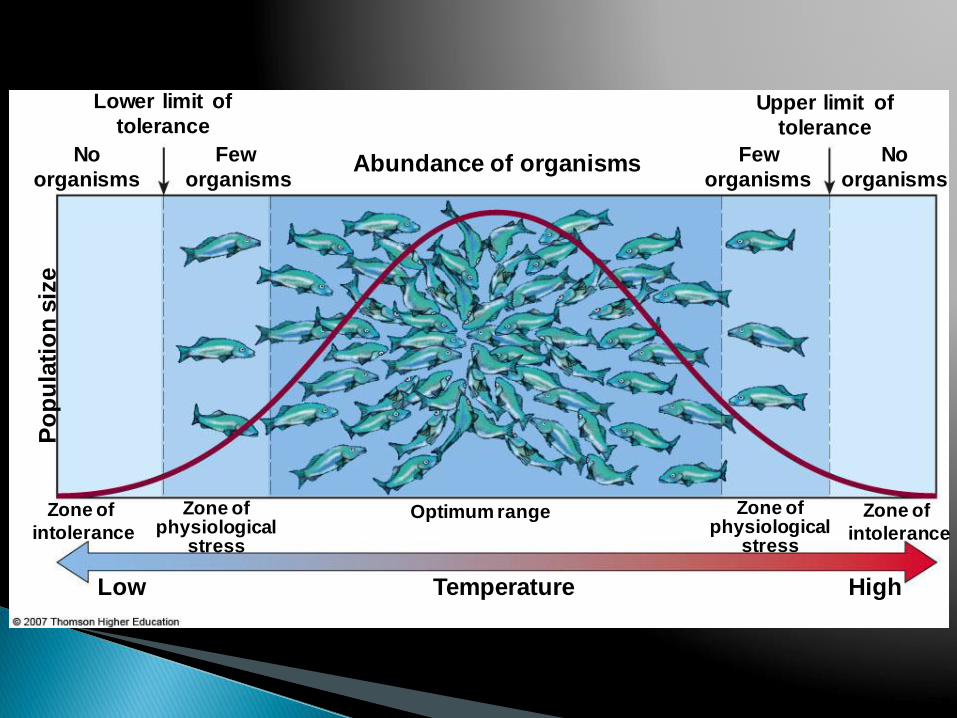
Fig. 3-11, p. 58
Zone of
intoleranceOptimum rangeZone of
physiological stress
Zone of physiological
stress
Zone of
intolerance
TemperatureLow High
No
organisms
Few
organisms
Upper limit of
tolerance
Po
pu
lati
on
siz
e
Abundance of organismsFew
organisms
No
organisms
Lower limit of
tolerance
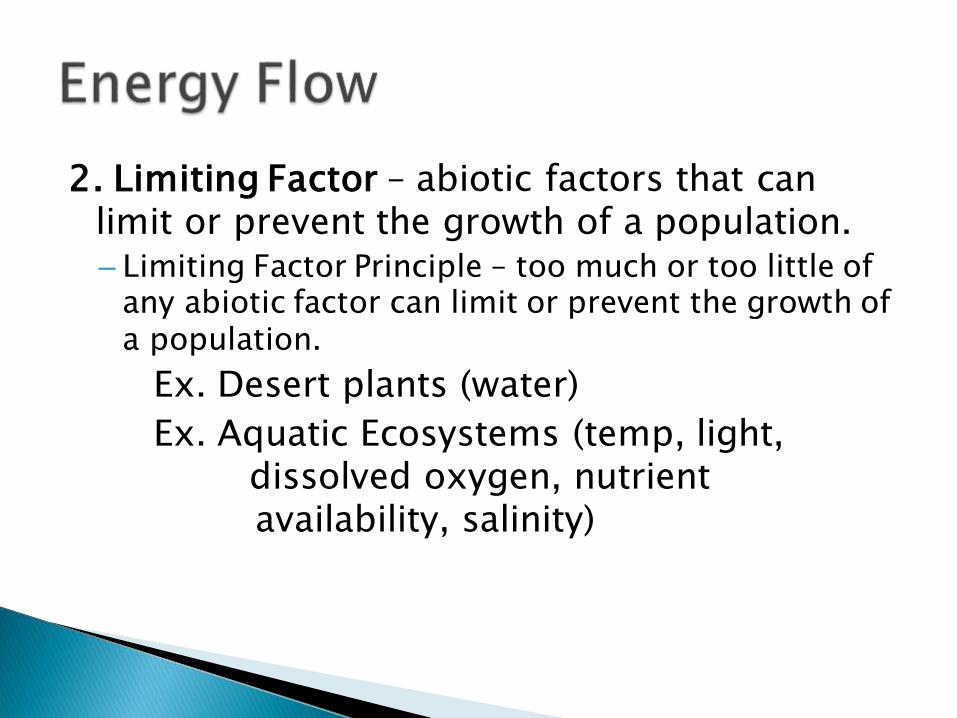
2. Limiting Factor – abiotic factors that can limit or prevent the growth of a population.– Limiting Factor Principle – too much or too little of
any abiotic factor can limit or prevent the growth of a population.
Ex. Desert plants (water)
Ex. Aquatic Ecosystems (temp, light, dissolved oxygen, nutrient availability, salinity)
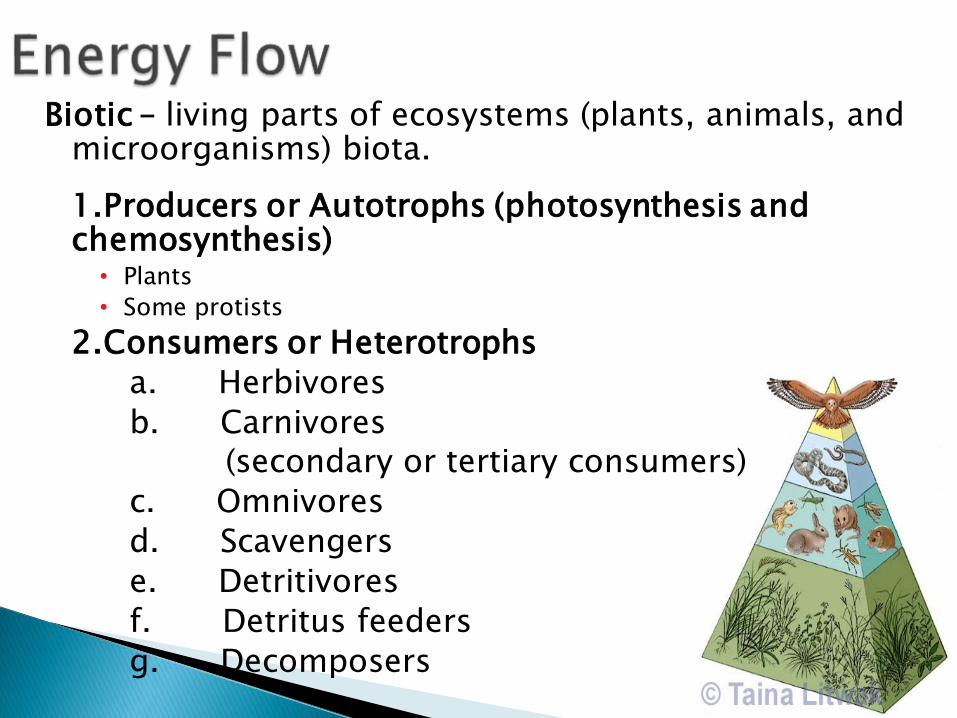
Biotic – living parts of ecosystems (plants, animals, and microorganisms) biota.
1.Producers or Autotrophs (photosynthesis and chemosynthesis)
• Plants
• Some protists
2.Consumers or Heterotrophs
a. Herbivores
b. Carnivores (secondary or tertiary consumers)
c. Omnivores
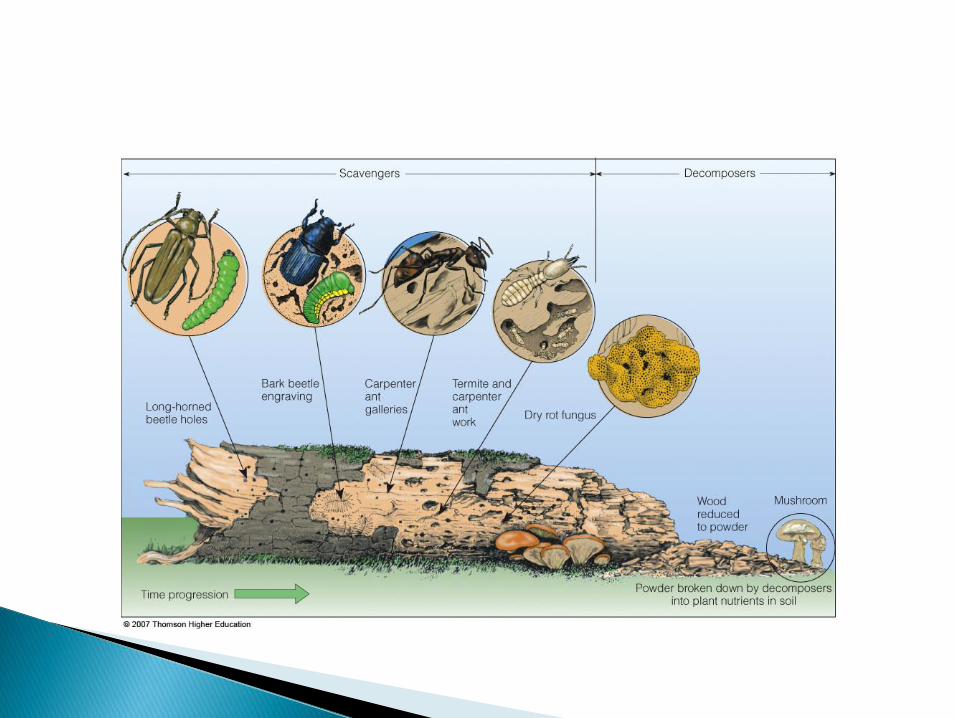
d. Scavengers
e. Detritivores
f. Detritus feeders
g. Decomposers
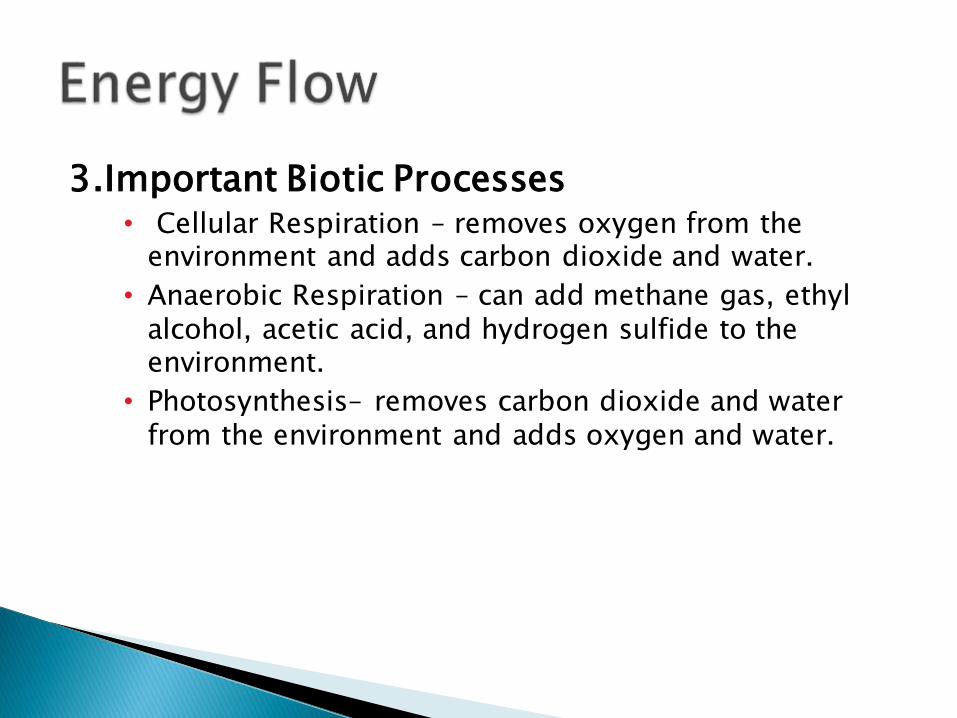
3.Important Biotic Processes• Cellular Respiration – removes oxygen from the
environment and adds carbon dioxide and water.
• Anaerobic Respiration – can add methane gas, ethyl alcohol, acetic acid, and hydrogen sulfide to the environment.
• Photosynthesis– removes carbon dioxide and water from the environment and adds oxygen and water.
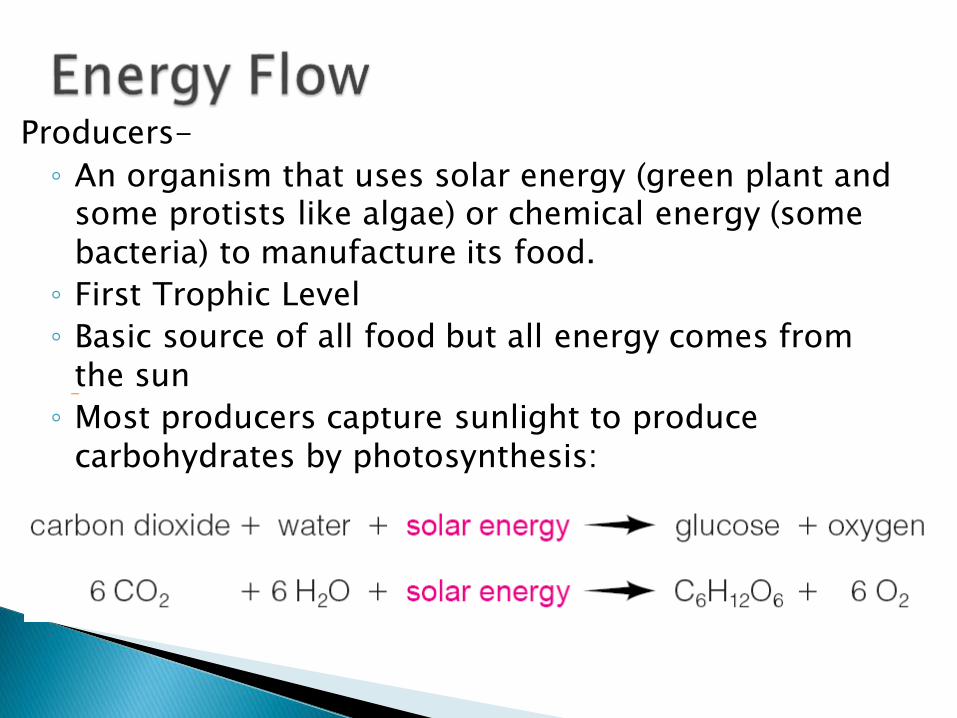
Producers-
◦ An organism that uses solar energy (green plant and some protists like algae) or chemical energy (some bacteria) to manufacture its food.
◦ First Trophic Level
◦ Basic source of all food but all energy comes from the sun
◦ Most producers capture sunlight to produce carbohydrates by photosynthesis:
Biomass
• Biomass is dry weight of organic matter produced by plants & represents the chemical energy stored at each energy level.
• Stems, roots and leaves
• Can be used as electrical energy from wood, garbage & agricultural waste.
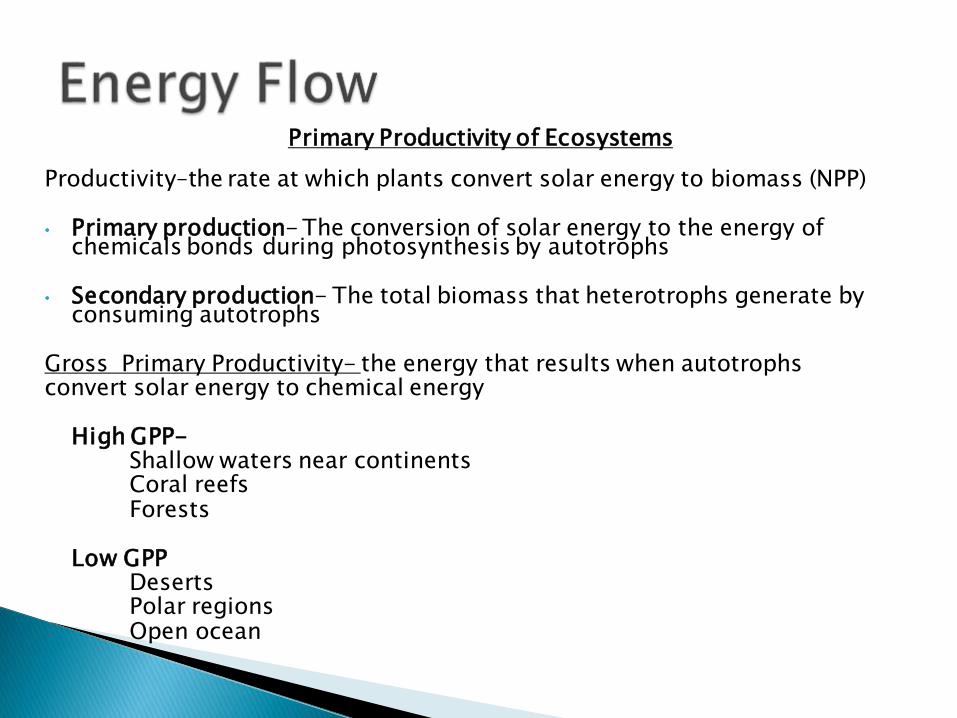
Primary Productivity of Ecosystems
Productivity–the rate at which plants convert solar energy to biomass (NPP)
• Primary production- The conversion of solar energy to the energy of chemicals bonds during photosynthesis by autotrophs
• Secondary production- The total biomass that heterotrophs generate by consuming autotrophs
Gross Primary Productivity- the energy that results when autotrophs convert solar energy to chemical energy
High GPP-Shallow waters near continentsCoral reefsForests
Low GPPDesertsPolar regionsOpen ocean
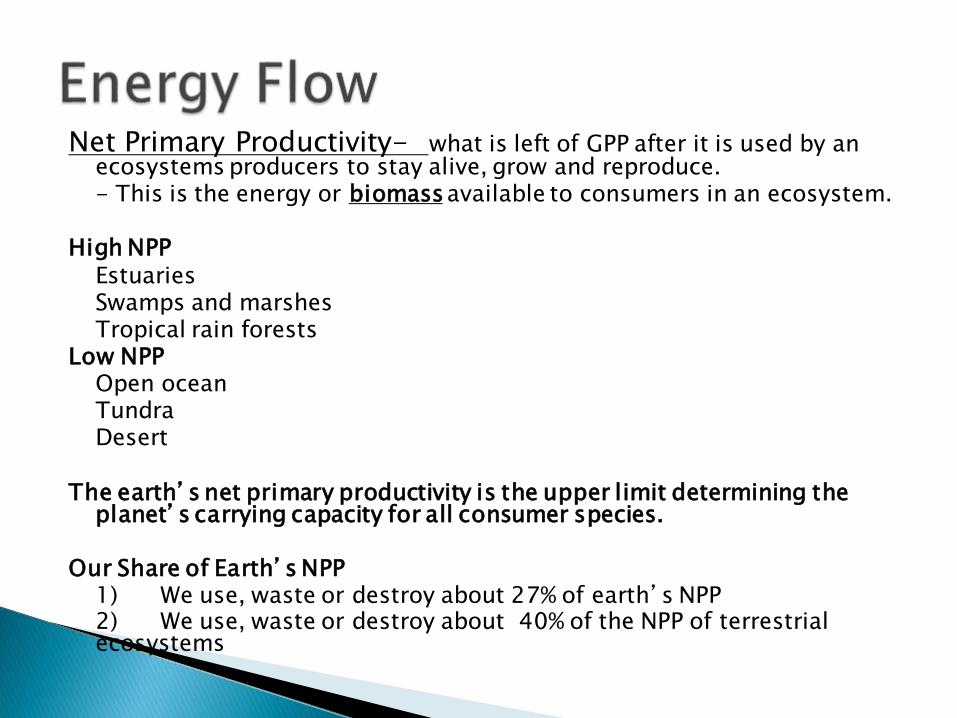
Net Primary Productivity- what is left of GPP after it is used by an ecosystems producers to stay alive, grow and reproduce. - This is the energy or biomassavailable to consumers in an ecosystem.
High NPPEstuariesSwamps and marshesTropical rain forests
Low NPPOpen oceanTundraDesert
The earth’s net primary productivity is the upper limit determining the planet’s carrying capacity for all consumer species.
Our Share of Earth’s NPP1) We use, waste or destroy about 27% of earth’s NPP2) We use, waste or destroy about 40% of the NPP of terrestrial ecosystems
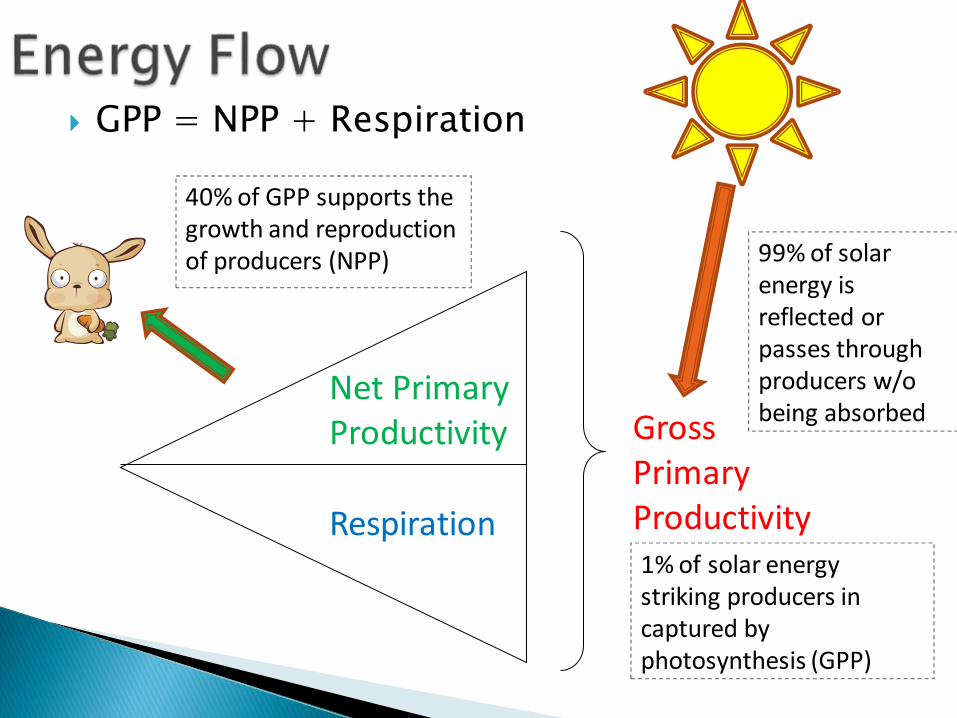
GPP = NPP + Respiration
Net Primary Productivity
Respiration
Gross Primary Productivity
99% of solar energy is reflected or passes through producers w/o being absorbed
1% of solar energy striking producers in captured by photosynthesis (GPP)
40% of GPP supports the growth and reproduction of producers (NPP)
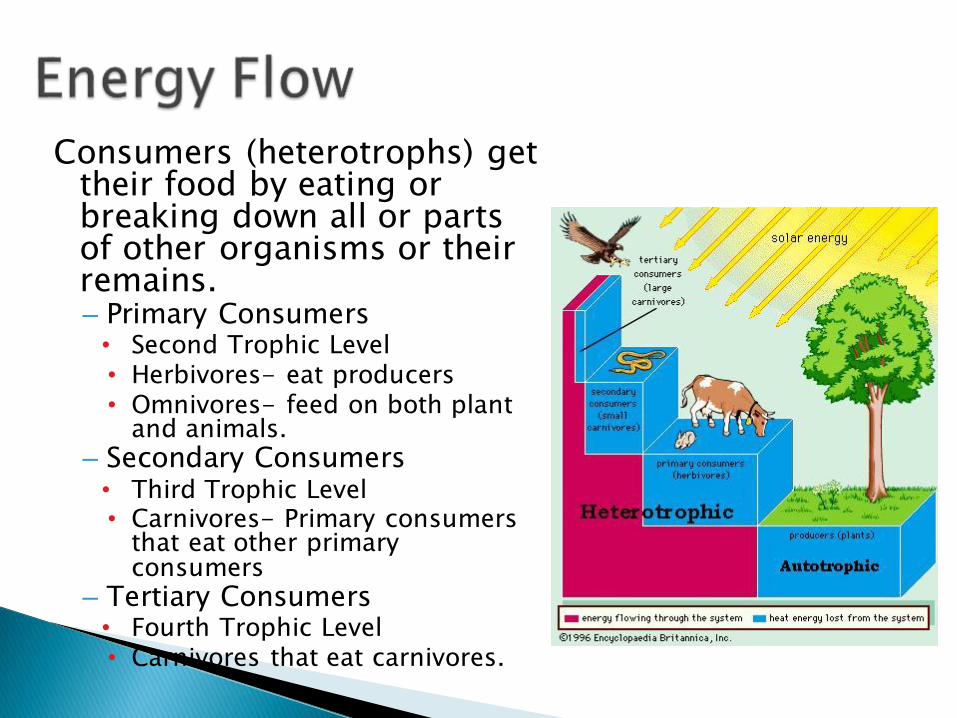
Consumers (heterotrophs) get their food by eating or breaking down all or parts of other organisms or their remains.– Primary Consumers• Second Trophic Level• Herbivores- eat producers• Omnivores- feed on both plant
and animals.– Secondary Consumers• Third Trophic Level• Carnivores- Primary consumers
that eat other primary consumers
– Tertiary Consumers• Fourth Trophic Level• Carnivores that eat carnivores.
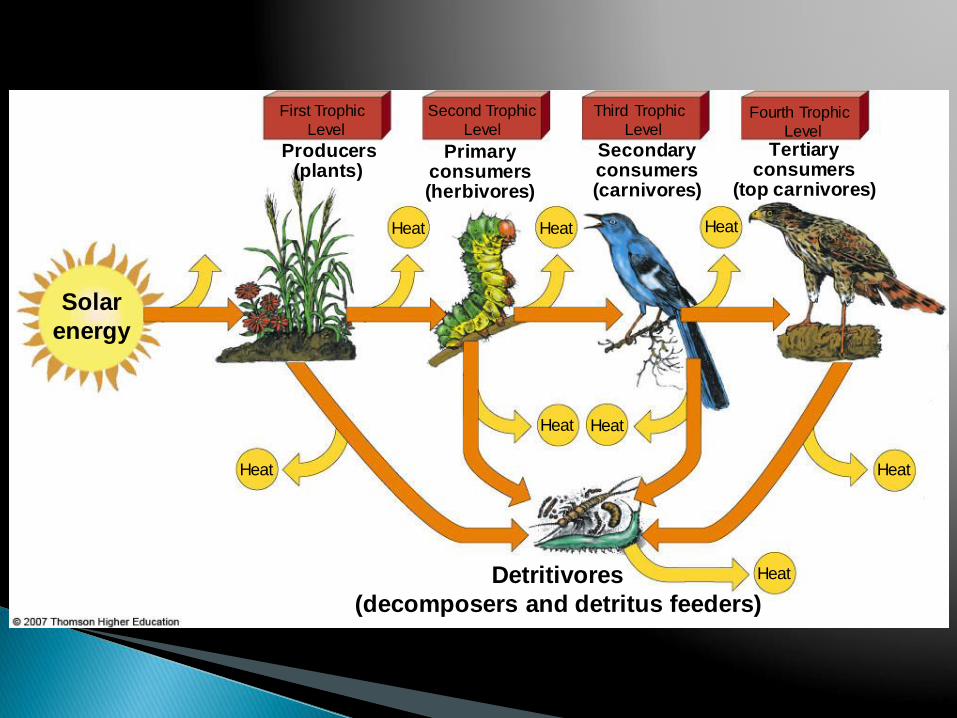
Fig. 3-17, p. 64
Heat
Heat
Heat
Heat
Heat
Heat Heat Heat
Detritivores
(decomposers and detritus feeders)
First Trophic
Level
Second Trophic
Level
Third Trophic
LevelFourth Trophic
Level
Solar
energy
Producers(plants)
Primary consumers(herbivores)
Secondary consumers(carnivores)
Tertiary consumers
(top carnivores)
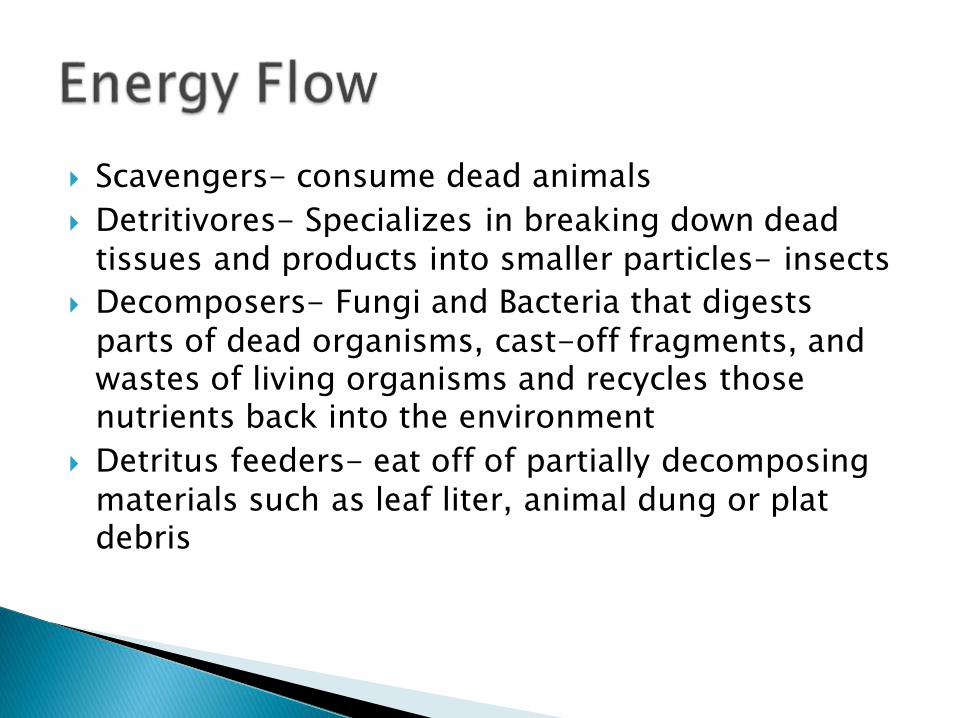
Scavengers- consume dead animals
Detritivores- Specializes in breaking down dead tissues and products into smaller particles- insects
Decomposers- Fungi and Bacteria that digests parts of dead organisms, cast-off fragments, and wastes of living organisms and recycles those nutrients back into the environment
Detritus feeders- eat off of partially decomposing materials such as leaf liter, animal dung or plat debris
Decomposition As plant or animal matter dies it will break
down and return the chemicals back to the soil.
This happens very quickly in tropical rainforest which results in low-nutrient soils.
Grasslands have the deepest and most nutrient rich of all soils
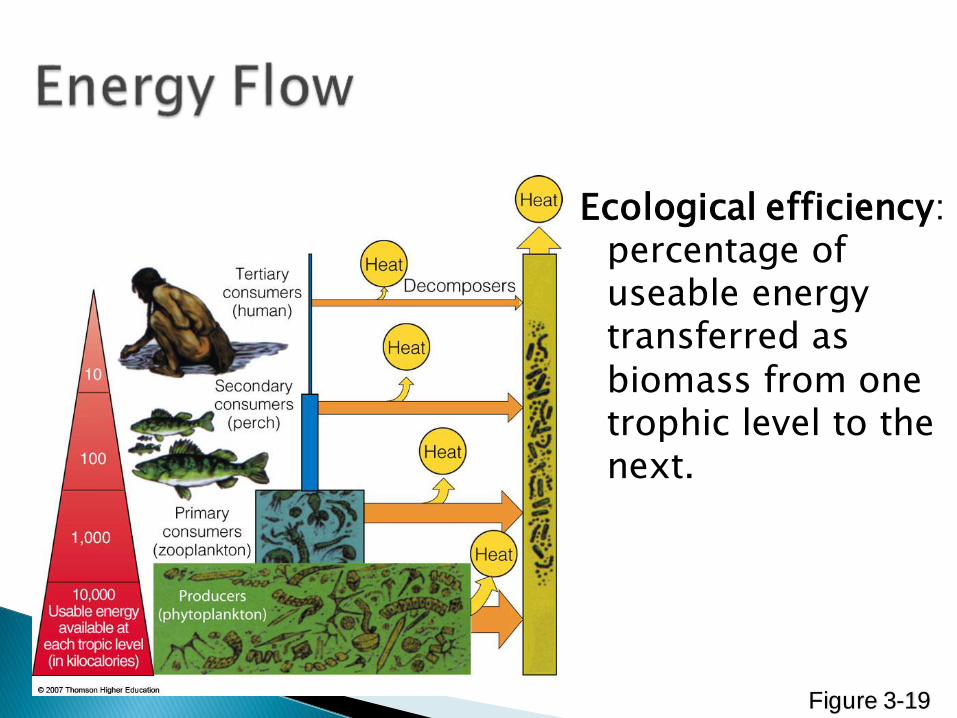
Ecological efficiency: percentage of useable energy transferred as biomass from one trophic level to the next.
Figure 3-19
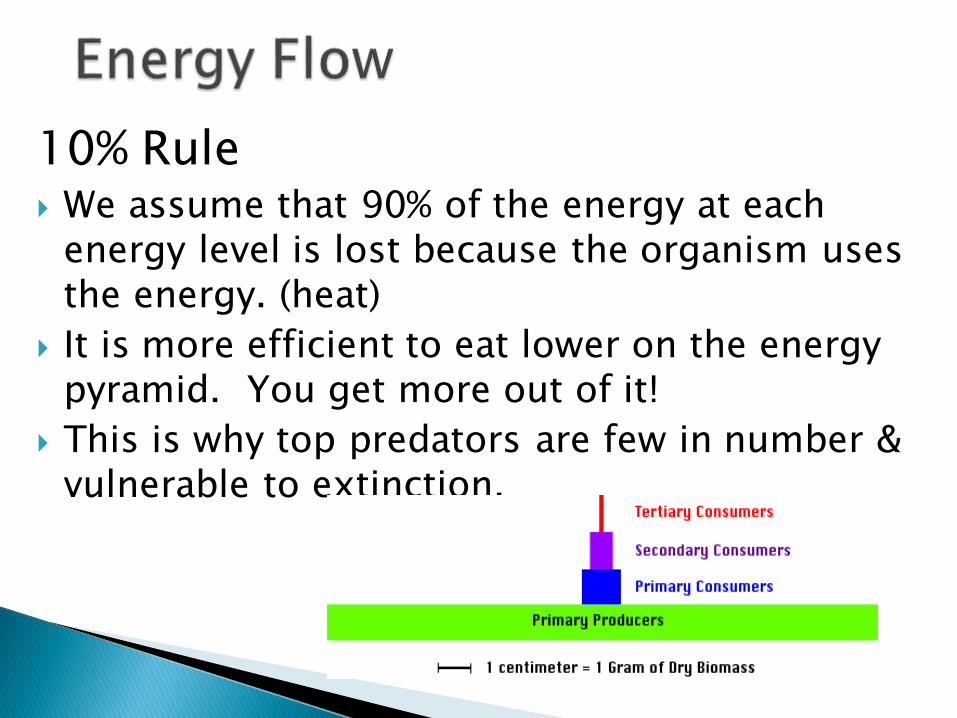
10% Rule We assume that 90% of the energy at each
energy level is lost because the organism uses the energy. (heat)
It is more efficient to eat lower on the energy pyramid. You get more out of it!
This is why top predators are few in number & vulnerable to extinction.

Shows the decrease in usable energy available at each succeeding trophic level in a food chain or web.
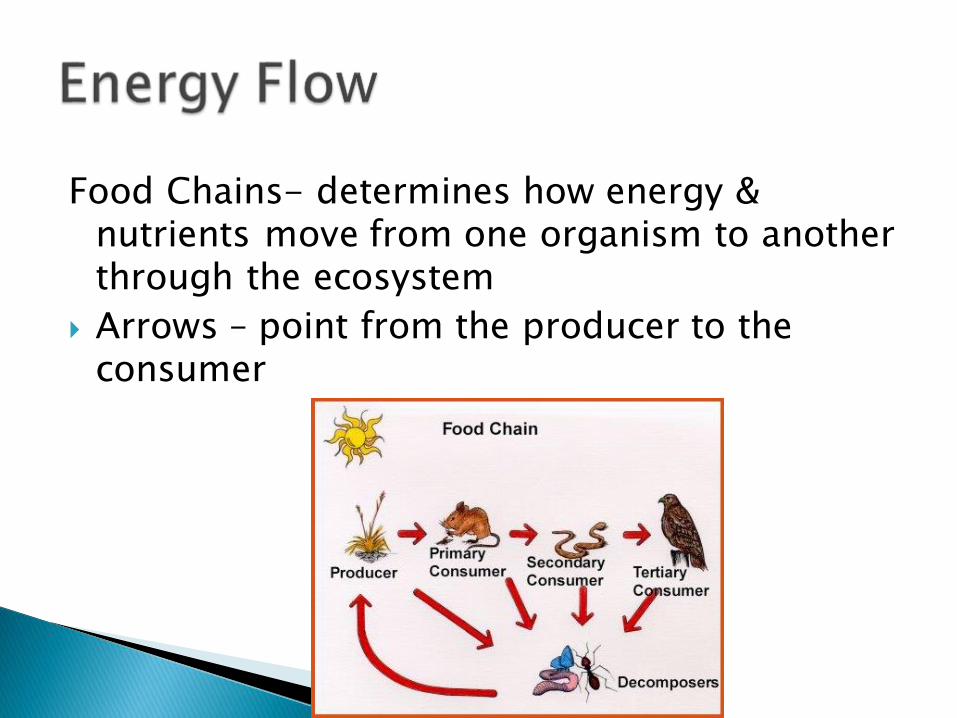
Food Chains- determines how energy & nutrients move from one organism to another through the ecosystem
Arrows – point from the producer to the consumer
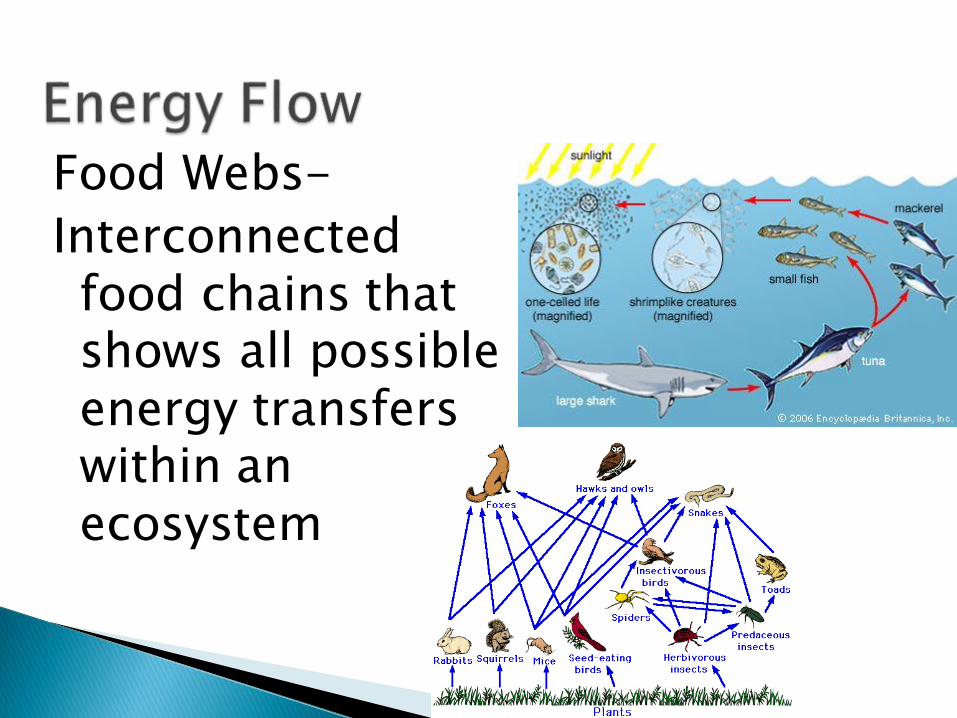
Food Webs-
Interconnected food chains that shows all possible energy transfers within an ecosystem
Different Species Playing Different Roles
• Biological communities differ in the types and numbers of species they contain and the ecological roles those species play.
• Species diversity: the number of different species it contains (species richness) combined with the abundance of individuals within each of those species (species evenness).
• Types of species-– Indicator– Keystone– Foundation– Umbrella
– Native vs. Non-indigenous/Invasive

Indicator Species◦ Biological Smoke Alarm
◦ Have a very small limit of tolerance
◦ Serve as early warnings of damage to a community or an ecosystem.
Trout species- indicator of water quality
sensitive to temperature and oxygen levels of water
Lichen – indicator of air quality
Sensitive to toxic gases like sulfer and ozone
Frogs- indicator of water pollution
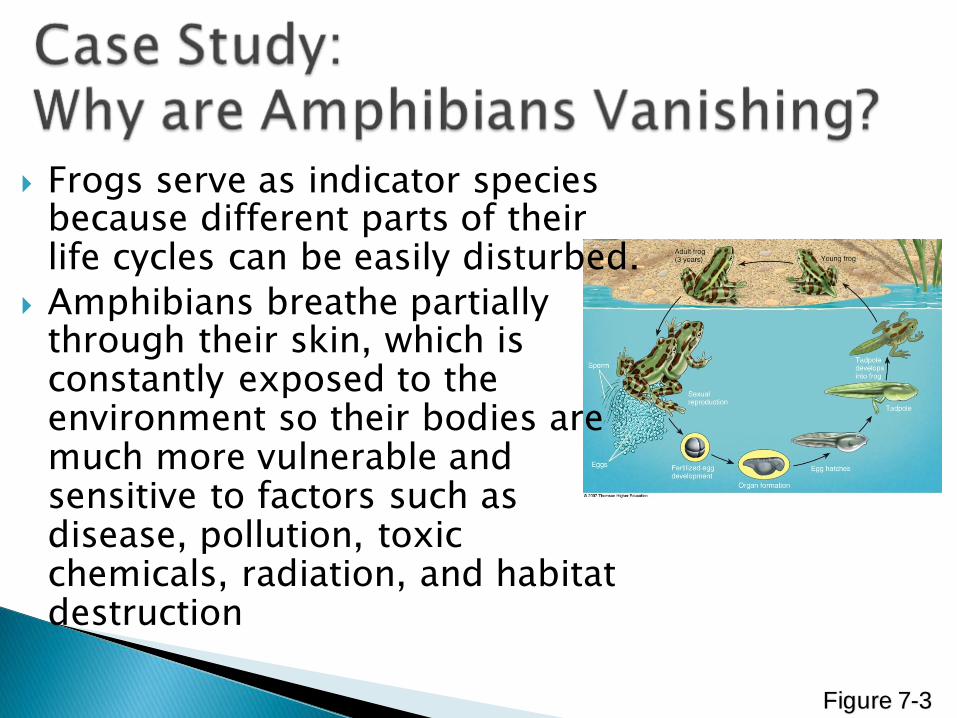
Frogs serve as indicator species because different parts of their life cycles can be easily disturbed.
Amphibians breathe partially through their skin, which is constantly exposed to the environment so their bodies are much more vulnerable and sensitive to factors such as disease, pollution, toxic chemicals, radiation, and habitat destruction
Figure 7-3
Habitat loss and fragmentation.
Prolonged drought.
Pollution.
Increases in ultraviolet radiation.
Parasites.
Viral and Fungal diseases.
Overhunting.
Natural immigration or deliberate introduction of nonnative predators and competitors.
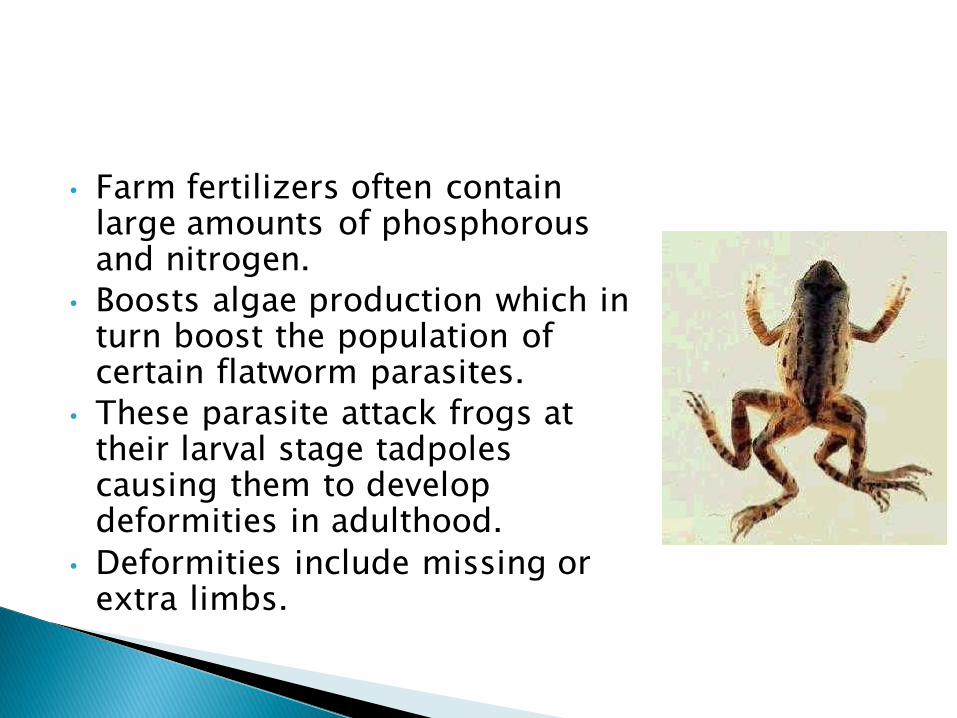
• Farm fertilizers often contain large amounts of phosphorous and nitrogen.
• Boosts algae production which in turn boost the population of certain flatworm parasites.
• These parasite attack frogs at their larval stage tadpoles causing them to develop deformities in adulthood.
• Deformities include missing or extra limbs.
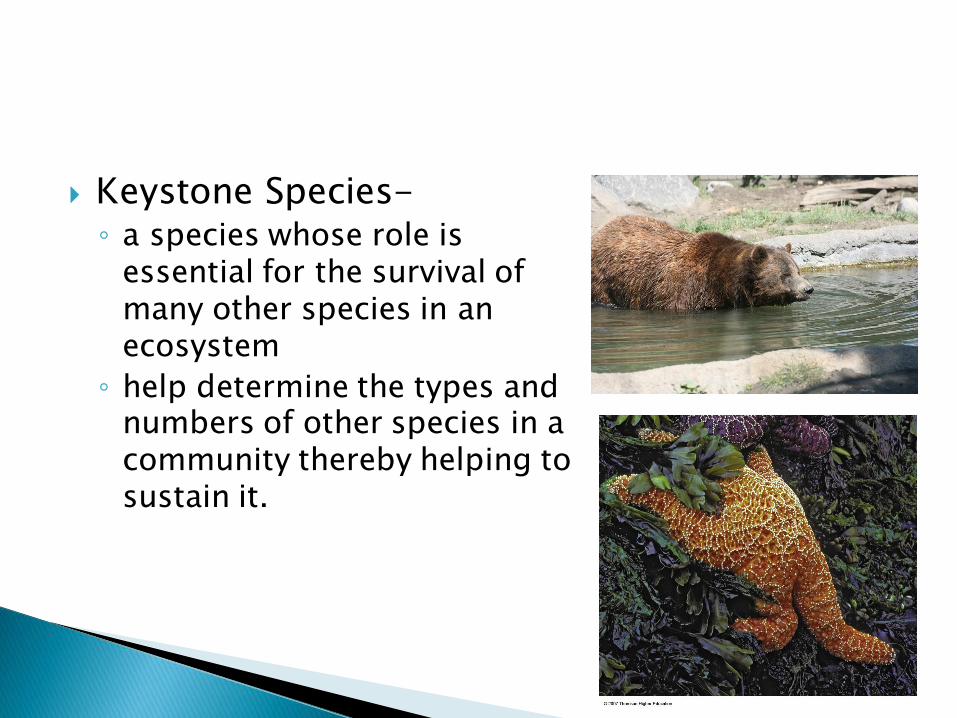
Keystone Species-◦ a species whose role is
essential for the survival of many other species in an ecosystem
◦ help determine the types and numbers of other species in a community thereby helping to sustain it.
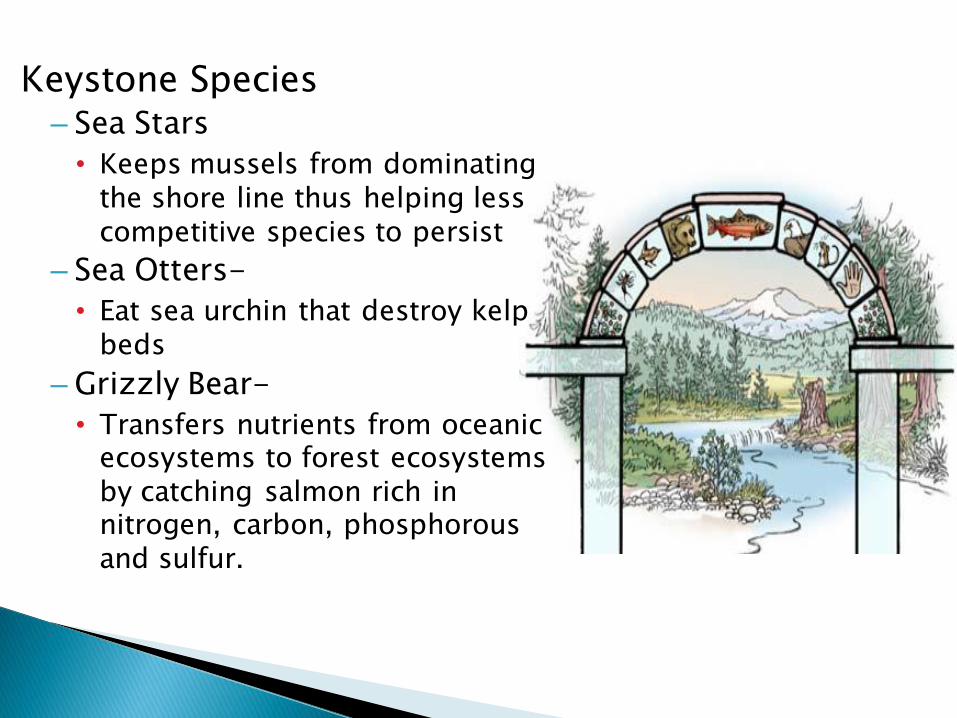
Keystone Species– Sea Stars
• Keeps mussels from dominating the shore line thus helping less competitive species to persist
– Sea Otters-
• Eat sea urchin that destroy kelp beds
– Grizzly Bear-
• Transfers nutrients from oceanic ecosystems to forest ecosystems by catching salmon rich in nitrogen, carbon, phosphorous and sulfur.
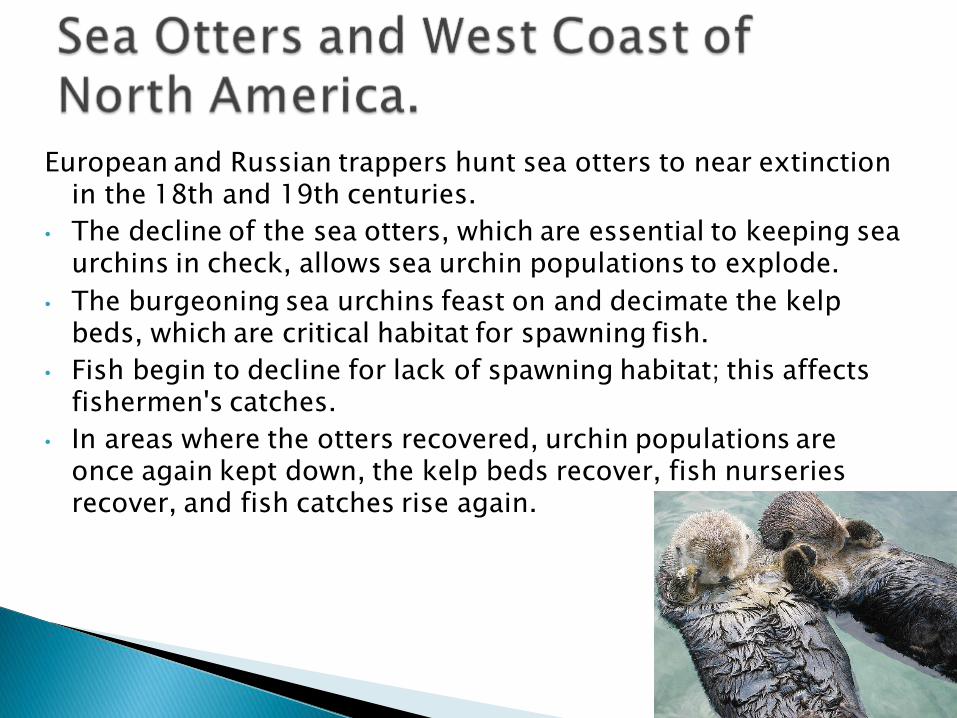
European and Russian trappers hunt sea otters to near extinction in the 18th and 19th centuries.
• The decline of the sea otters, which are essential to keeping sea urchins in check, allows sea urchin populations to explode.
• The burgeoning sea urchins feast on and decimate the kelp beds, which are critical habitat for spawning fish.
• Fish begin to decline for lack of spawning habitat; this affects fishermen's catches.
• In areas where the otters recovered, urchin populations are once again kept down, the kelp beds recover, fish nurseries recover, and fish catches rise again.
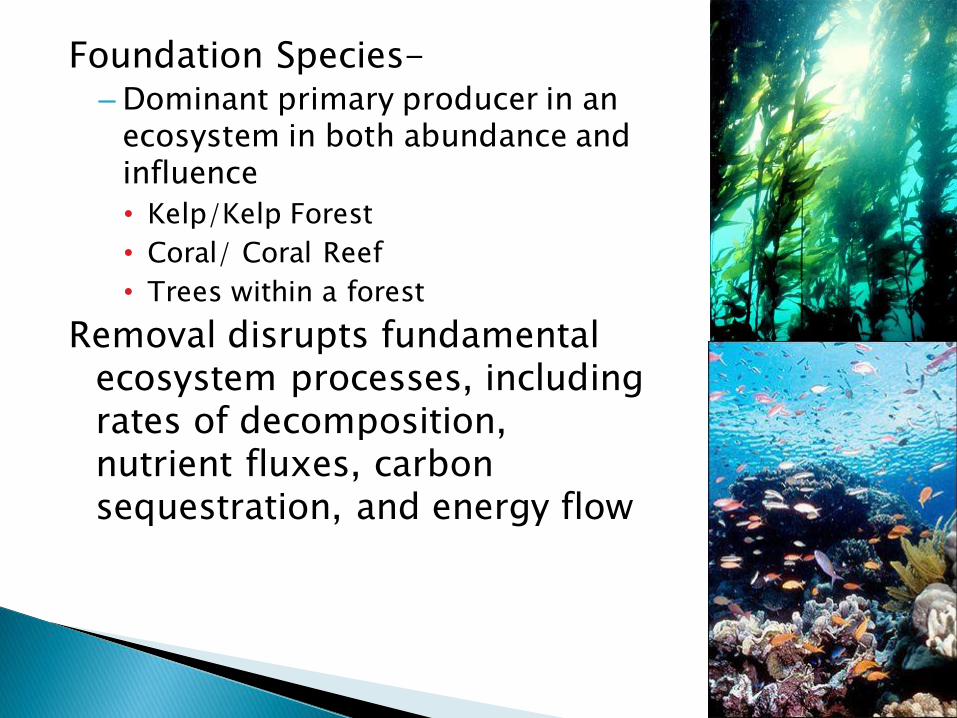
Foundation Species-– Dominant primary producer in an
ecosystem in both abundance and influence
• Kelp/Kelp Forest
• Coral/ Coral Reef
• Trees within a forest
Removal disrupts fundamental ecosystem processes, including rates of decomposition, nutrient fluxes, carbon sequestration, and energy flow
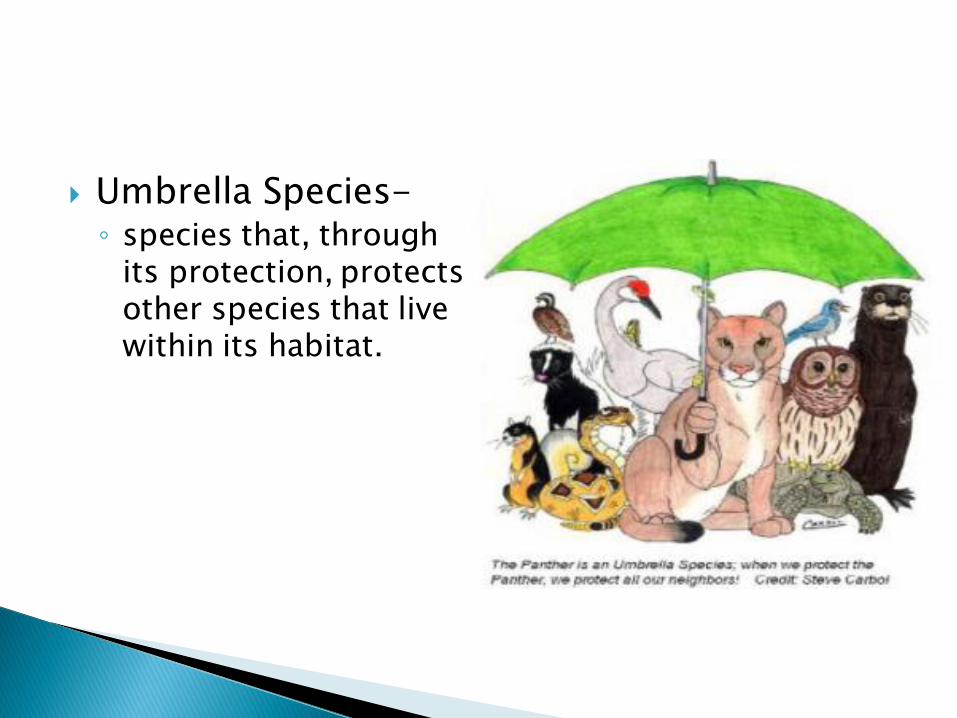
Umbrella Species-◦ species that, through
its protection, protects other species that live within its habitat.
Native species-◦ those that normally live and thrive in a particular
community.
Invasive species-◦ those that migrate, deliberately or accidentally
introduced into a community.
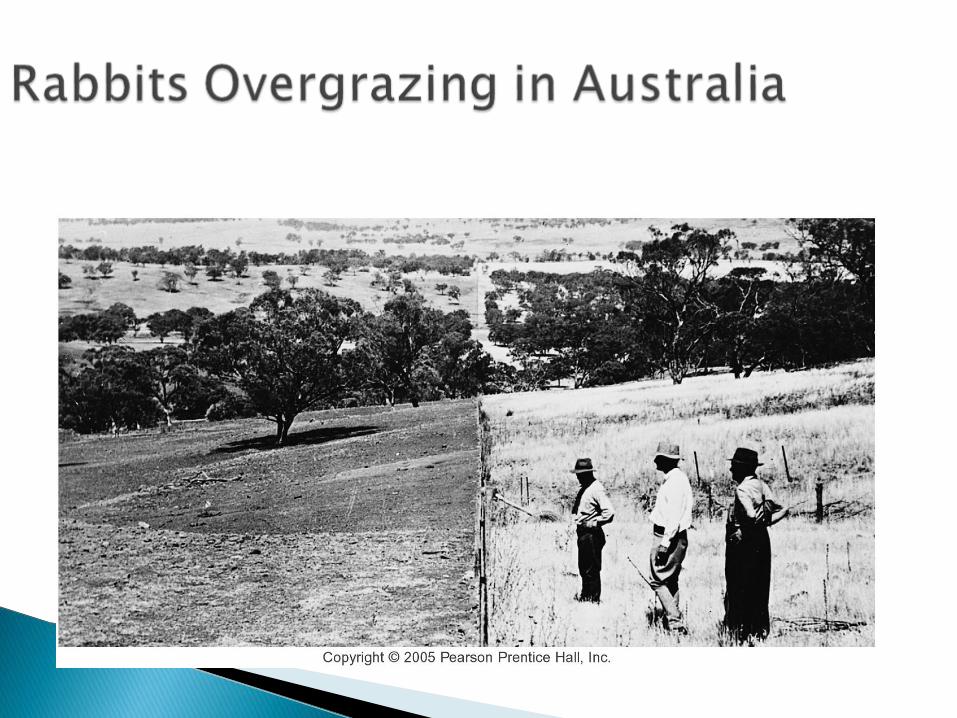
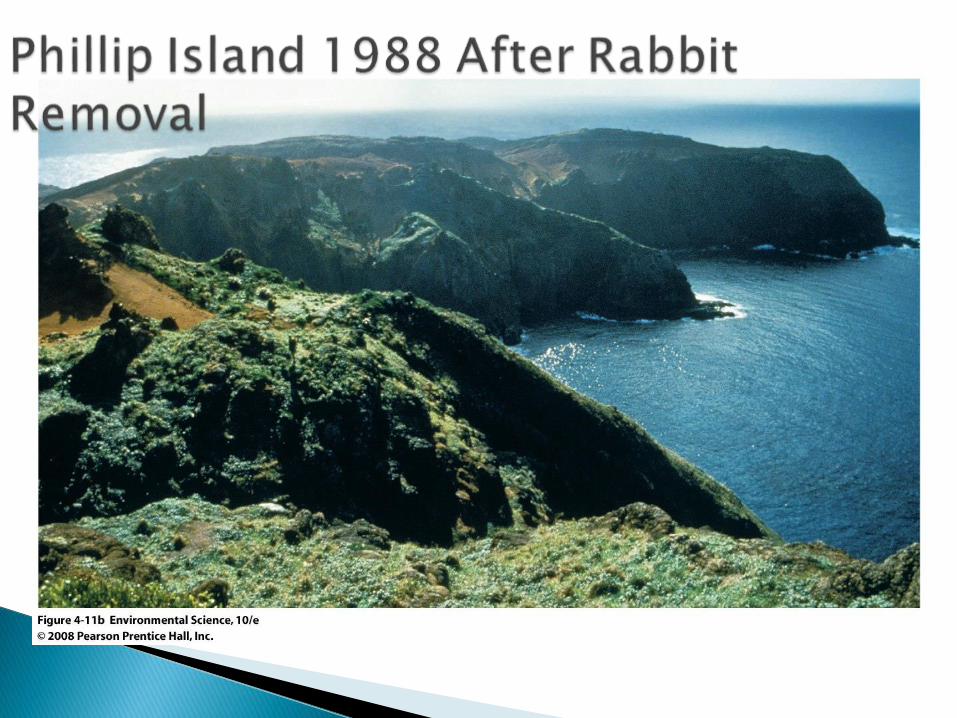
Introduced into Australia from England in 1859
No natural enemies – rabbit population exploded
Overabundant herbivore population devastated natural vegetation.
Used disease-causing viruses to control rabbit pop.
Using disease as control measure – why will this procedure fail in the long-term?
Would this particular virus be considered a parasite or a predator?
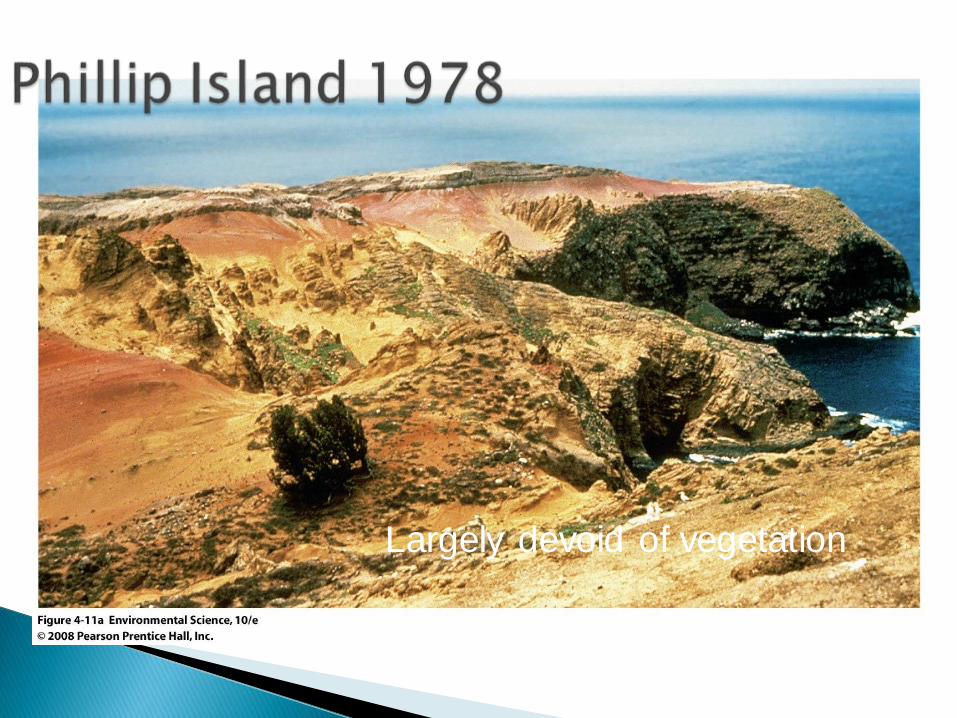
Largely devoid of vegetation
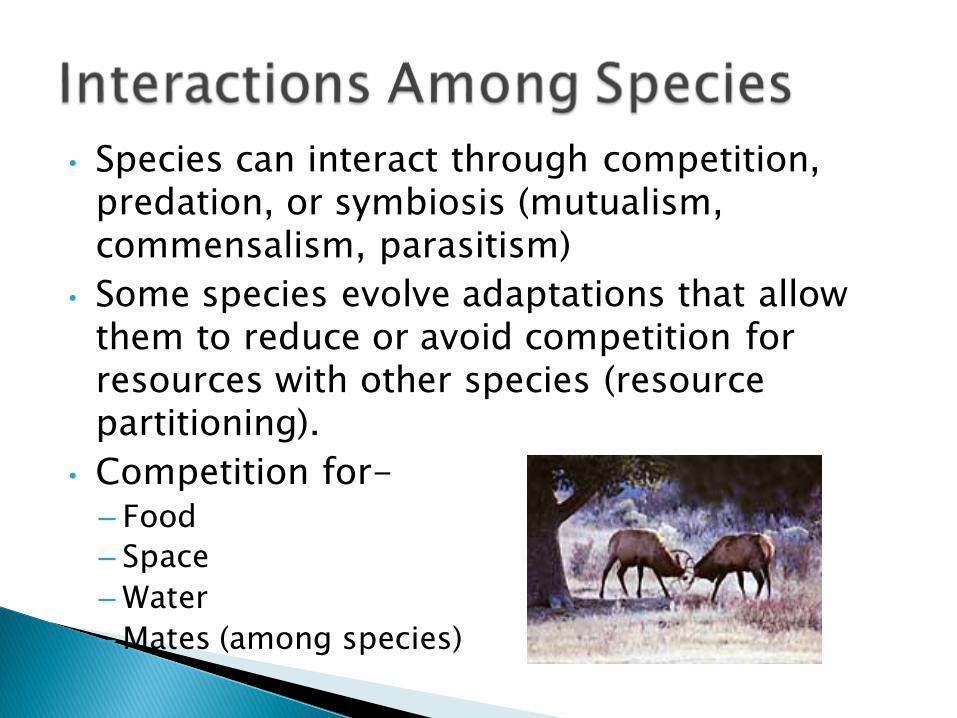
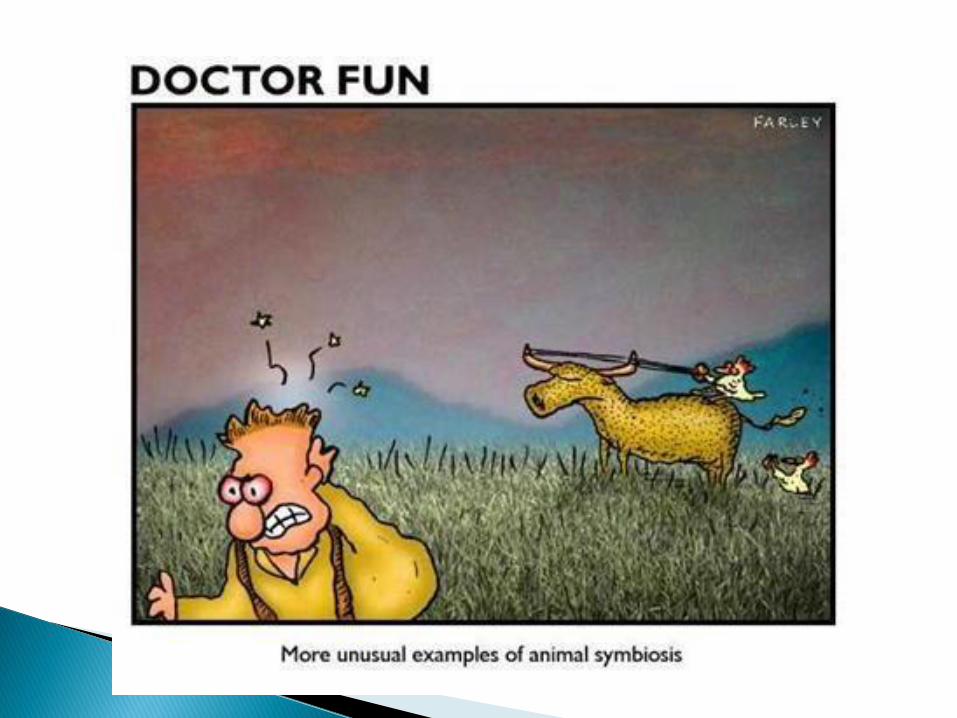
• Species can interact through competition, predation, or symbiosis (mutualism, commensalism, parasitism)
• Some species evolve adaptations that allow them to reduce or avoid competition for resources with other species (resource partitioning).
• Competition for-– Food
– Space
– Water
– Mates (among species)
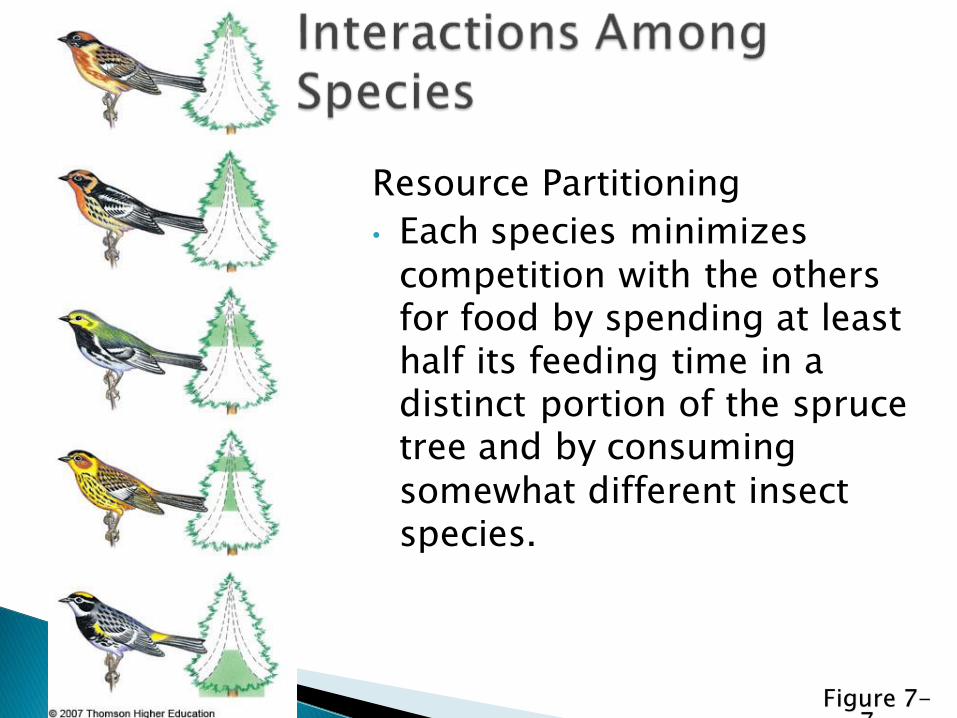
Resource Partitioning
• Each species minimizes competition with the others for food by spending at least half its feeding time in a distinct portion of the spruce tree and by consuming somewhat different insect species.
Figure 7-7

Predation◦ Predator (organisms that captures & feeds on parts
or all of another animal) vs. Prey (organisms that is captured & serves as a source of food for another animal).

Predator/Prey populations are often cyclical
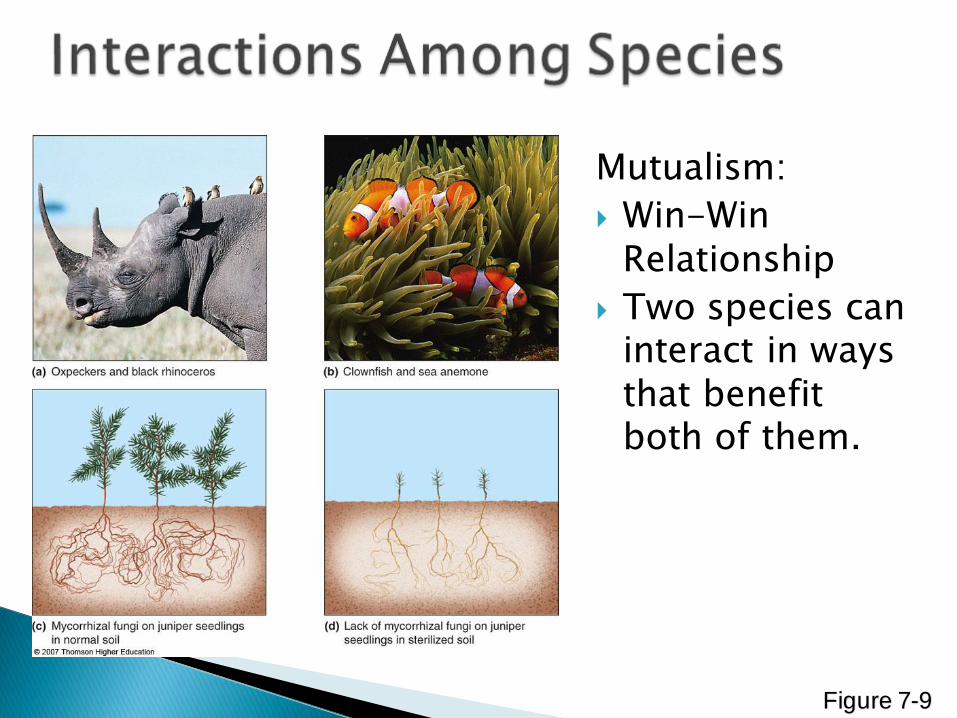
Mutualism:
Win-Win Relationship
Two species can interact in ways that benefit both of them.
Figure 7-9
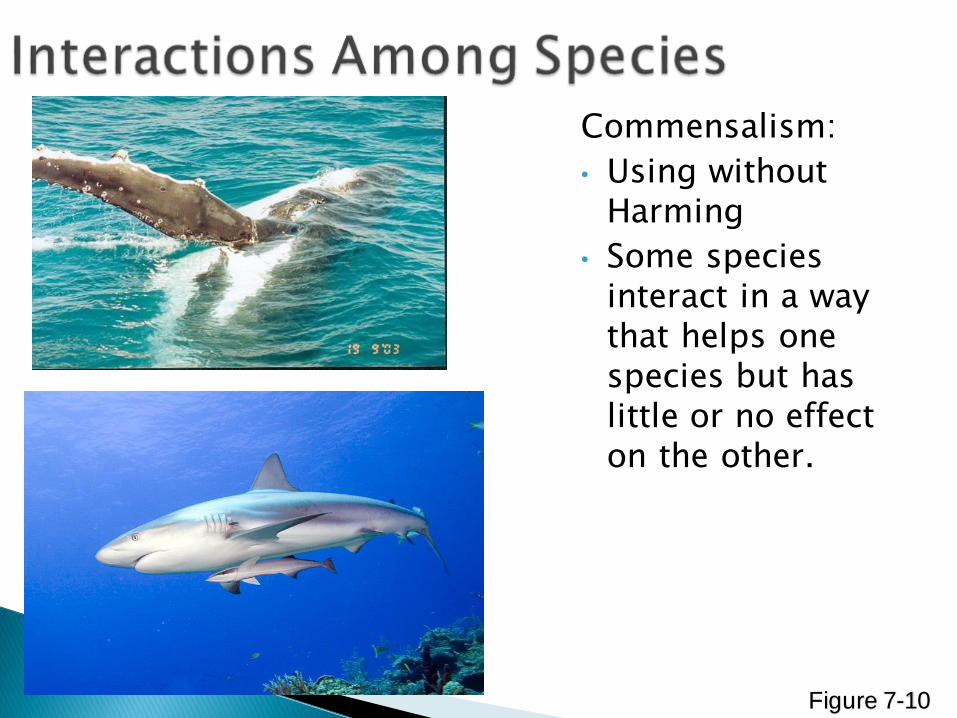
Commensalism:
• Using without Harming
• Some species interact in a way that helps one species but has little or no effect on the other.
Figure 7-10
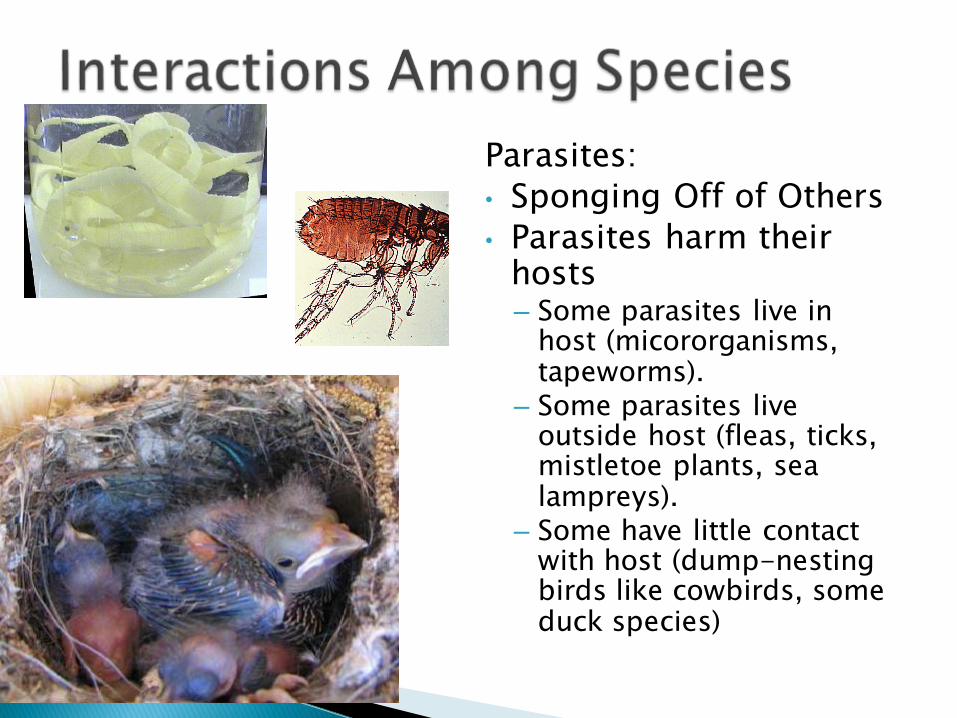
Parasites:
• Sponging Off of Others
• Parasites harm their hosts– Some parasites live in
host (micororganisms, tapeworms).
– Some parasites live outside host (fleas, ticks, mistletoe plants, sea lampreys).
– Some have little contact with host (dump-nesting birds like cowbirds, some duck species)
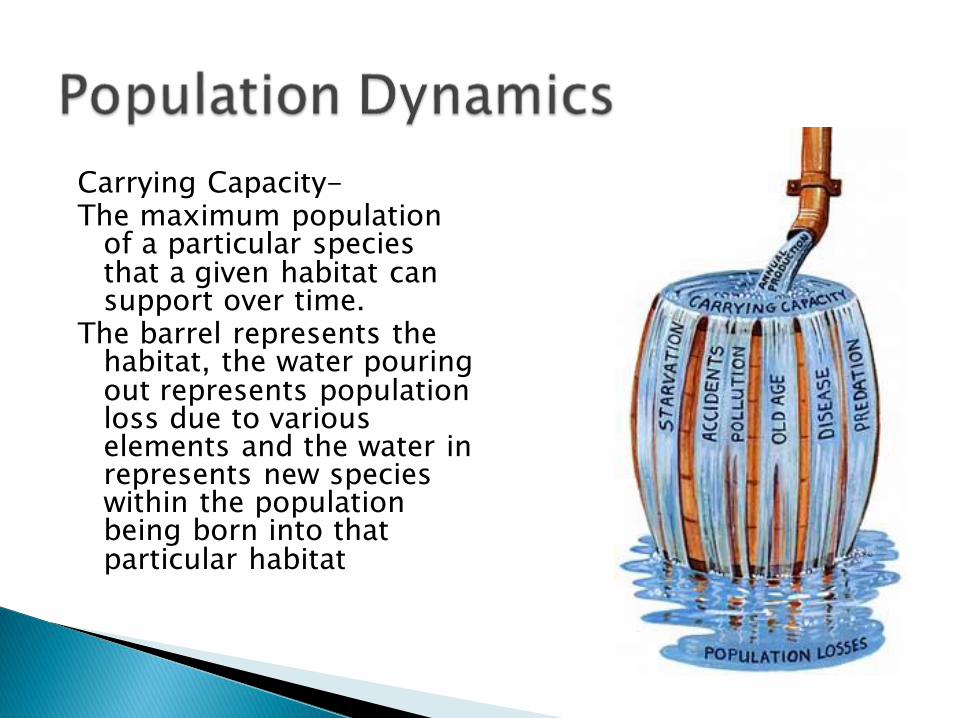
Carrying Capacity-The maximum population
of a particular species that a given habitat can support over time.
The barrel represents the habitat, the water pouring out represents population loss due to various elements and the water in represents new species within the population being born into that particular habitat
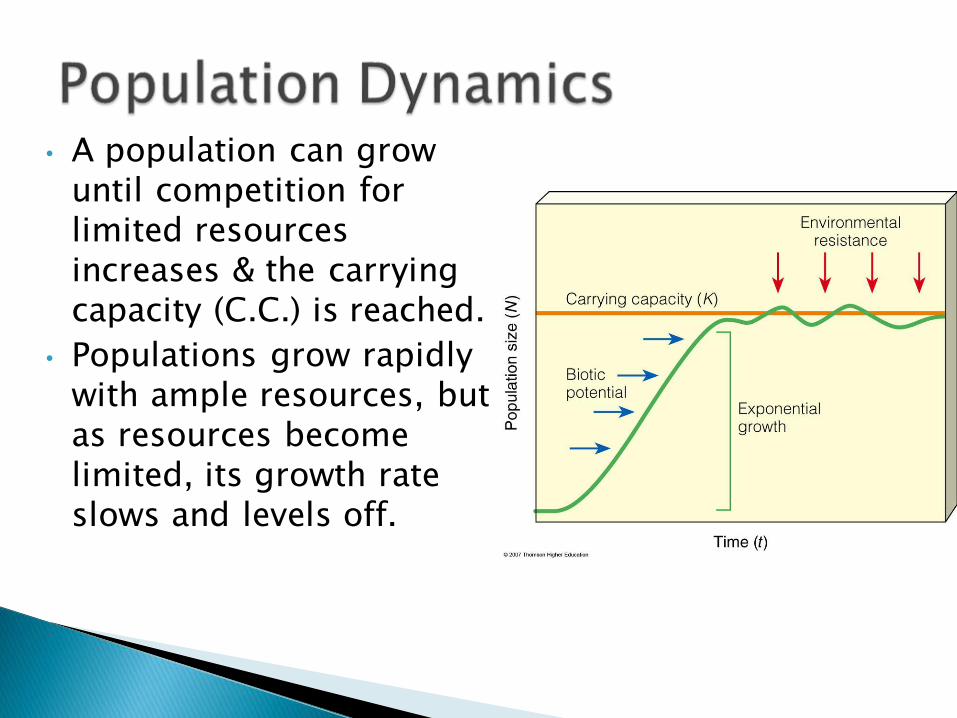
• A population can grow until competition for limited resources increases & the carrying capacity (C.C.) is reached.
• Populations grow rapidly with ample resources, but as resources become limited, its growth rate slows and levels off.
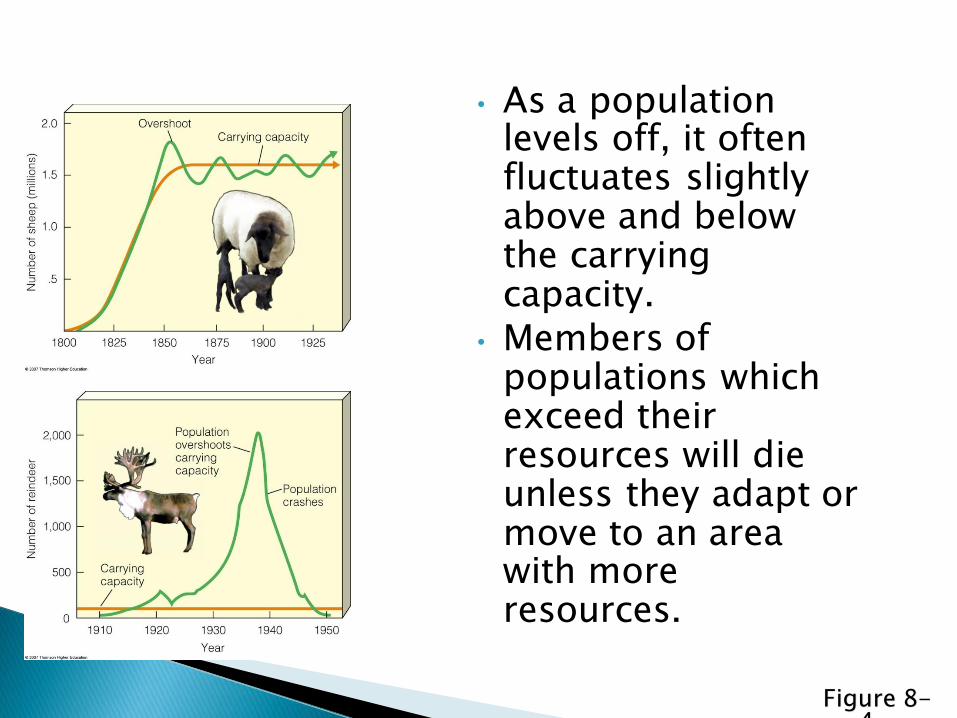
• As a population levels off, it often fluctuates slightly above and below the carrying capacity.
• Members of populations which exceed their resources will die unless they adapt or move to an area with more resources.
Figure 8-4
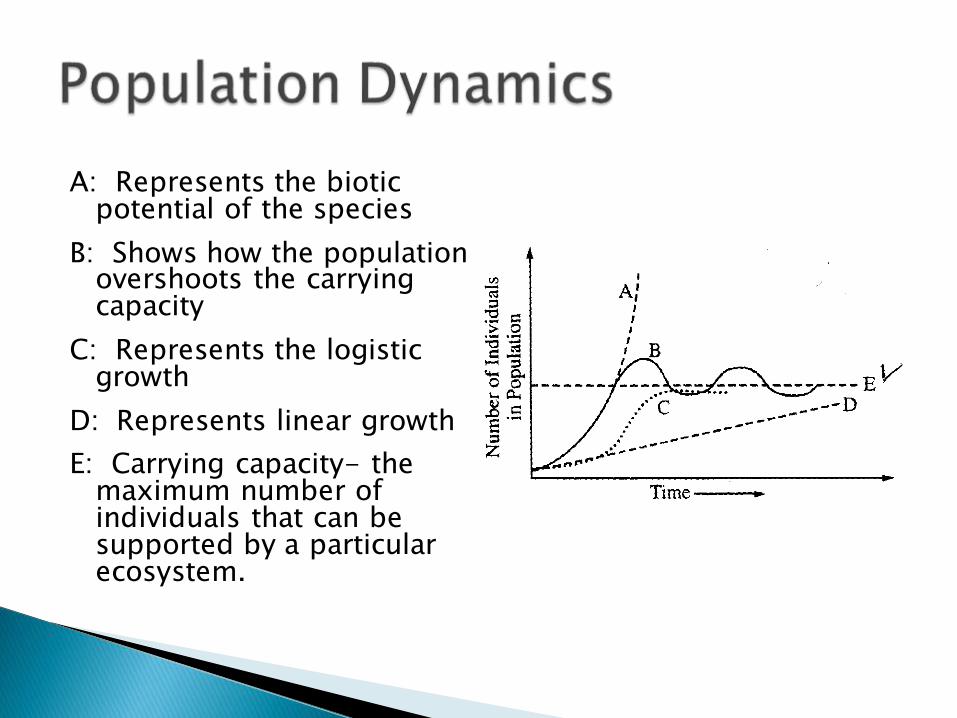
A: Represents the biotic potential of the species
B: Shows how the population overshoots the carrying capacity
C: Represents the logistic growth
D: Represents linear growth
E: Carrying capacity- the maximum number of individuals that can be supported by a particular ecosystem.
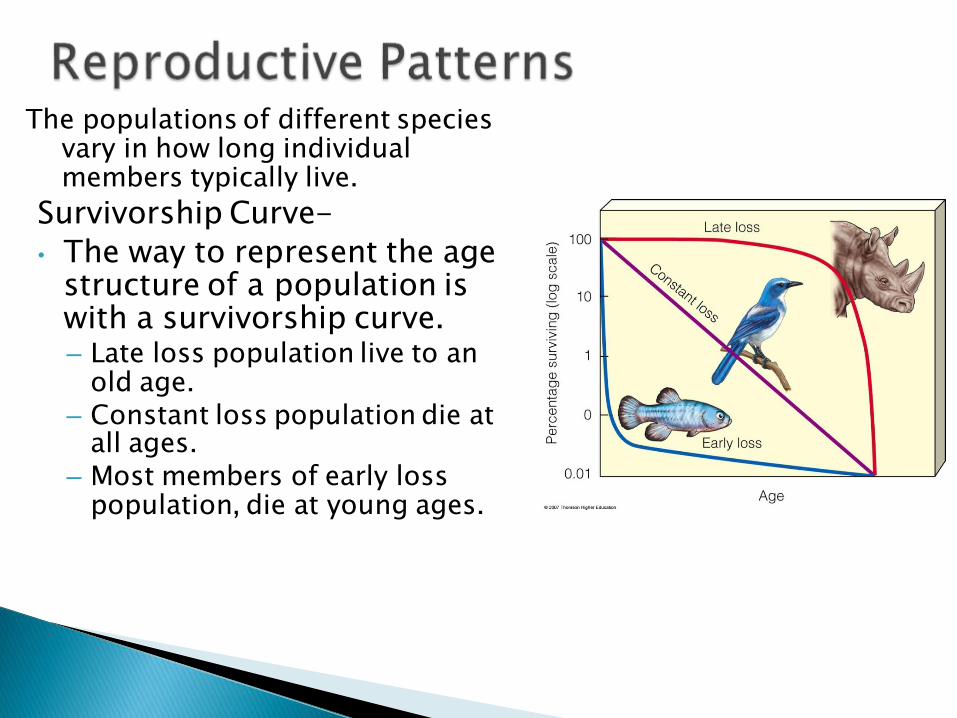
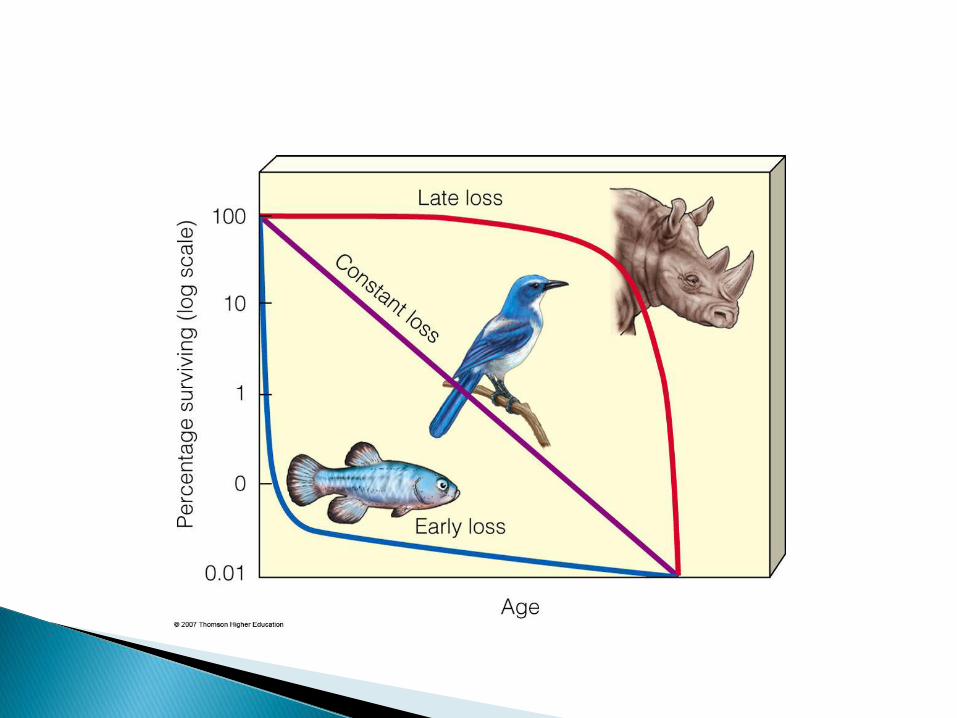
The populations of different species vary in how long individual members typically live.
Survivorship Curve-
• The way to represent the age structure of a population is with a survivorship curve.– Late loss population live to an
old age.– Constant loss population die at
all ages.– Most members of early loss
population, die at young ages.
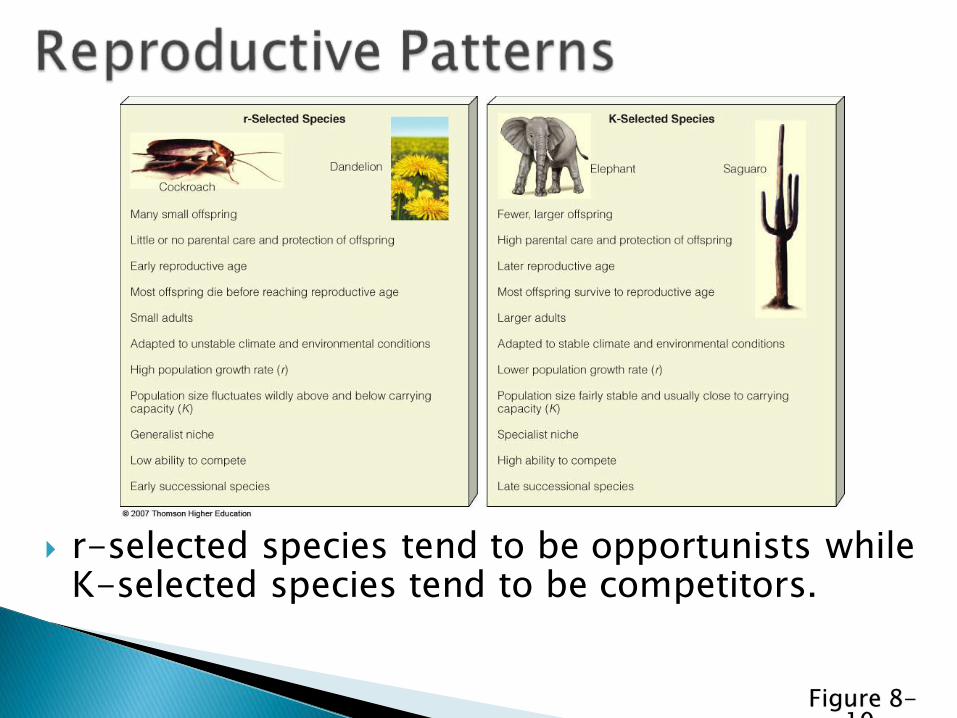
r-selected species tend to be opportunists while K-selected species tend to be competitors.
Figure 8-10

Reproductive Patterns:Opportunists and Competitors
• Large number of smaller offspring with little parental care (r-selected species).
• Fewer, larger offspring with higher invested parental care (K-selected species).
Figure 8-9