Embed Size (px)
Citation preview
8/3/2019 Ecology of Wintering
http://slidepdf.com/reader/full/ecology-of-wintering 1/12
Ibis (2002), 144, 602–613
© 2002 British Ornithologists’ Union
BlackwellScience,Ltd
Feeding ecology of wintering terns in Guinea-Bissau
ALEX BRENNINKMEIJER,1,2* ERIC W. M. STIENEN,1,3‡ MARCEL KLAASSEN4† &
MARCEL KERSTEN3
1Alterra Green World Research, Postbox 47, 6700 AA Wageningen, The Netherlands
2Altenburg & Wymenga, Ecological Consultancy, Postbox 32, 9269 ZR Veenwouden, The Netherlands 3Zoological Laboratory, University of Groningen, Postbox 14, 9750 AA Haren, The Netherlands
4Max Planck Institut für Verhaltensphysiologie, D-82346 Andechs, Germany
We studied the feeding ecology of Little Terns Sterna albifrons, Sandwich Terns S. sandvi-censis and Royal Terns S. maxima in the Archipélago dos Bijagós (11°40′N, 15°45′ W) inGuinea-Bissau (West Africa) during the winter of 1992/1993. More than 95% of all preytaken by these terns were roundfish, ranging in weight from 0.3 to 40 g. Birds usually fedalone, but sometimes they were observed feeding in mixed-species flocks consisting of 15 –200 individuals. Capture rate (n fish per hour foraging) in these flocks was higher than that
of solitary birds. However, smaller fish were caught by birds foraging in flocks, so food intakerate (g/h) did not differ between solitary and flock-feeding birds. The relationships betweenforaging behaviour of the three tern species and abiotic factors, such as time, tide and waterclarity, have been investigated. Capture rate of Royal Terns increased with water clarity. ForLittle Terns and Sandwich Terns, food intake rate was lower in the most turbid waters com-pared to clearer waters. There was very little foraging activity during high tide. For LittleTerns and Royal Terns, food intake rate was about twice as high during receding and lowtides as during an incoming tide. Food intake rate averaged 8 g/h in Little Terns, 60 g/h inSandwich Terns and 45 g/h in Royal Terns. With a rough model, we estimate the maximumrate of daily energy expenditure of terns wintering in the tropics at 3 × BMR (defined asenergy expenditure of inactive bird at thermoneutrality in a post-absorptive state during theresting phase of the daily cycle). From an energetic viewpoint, wintering Sandwich Terns
in Guinea-Bissau seem to have an easy living.
During the last century, some populations of marinetern species in Europe, Central America and Asiahave shown large fluctuations in numbers (Cramp1985, del Hoyo et al . 1996). Besides hunting (Mead1978, Meininger 1988) and poisoning (Koeman &Van Genderen 1966), crashes have been caused bydecreases in prey fish availability (Heubeck 1988,Monaghan et al . 1992, Wright 1996, Suddaby &Ratcliffe 1997). Fish stock size and abiotic factors, such
as water clarity (Eriksson 1985, Haney & Stone 1988),wind speed (Dunn 1973, Veen 1977), water temper-ature, salinity and water current (Hunt & Schneider
1987), have been suggested to influence fish avail-ability by affecting the behaviour of fish as well as thebehaviour of their potential avian predators. Crasheswere not always followed by a complete recovery,which may have been due to problems in the winter-ing as well as in the breeding areas (Brenninkmeijer& Stienen 1992, Stienen & Brenninkmeijer 1992).
We studied the feeding ecology of wintering LittleTerns Sterna albifrons, Sandwich Terns S. sandvicensis
and Royal Terns S. maxima in the coastal waters of Guinea-Bissau. The total number of terns wintering in1992/93 in these waters has been estimated at 62 000(S. Asbirk unpubl. data, J.S. Salvig unpubl. data). Most of the Royal Terns in Guinea-Bissau probably breed inSenegal or Mauritania (Keijl et al . 2000), whereas theLittle and Sandwich Terns originate from Europeanbreeding colonies (Cramp 1985). The coastal watersof Guinea-Bissau are of great international import-ance to terns, since more than 25% (10 000) of the
*Corresponding author.Email: [email protected]†Present address: Netherlands Institute of Ecology, Centre forLimnology, Rijksstraatweg 6, 3631 AC Nieuwersluis, TheNetherlands.‡Present address: Institute of Nature Conservation, KlienKliniekstraat 25, B-1070 Brussels, Belgium.
8/3/2019 Ecology of Wintering
http://slidepdf.com/reader/full/ecology-of-wintering 2/12
© 2002 British Ornithologists’ Union, Ibis , 144, 602–613
Feeding ecology of wintering terns 603
40 000 Western Palearctic Little Terns, 5% (7500) of the 150 000 Western Palearctic Sandwich Terns and10% (7500) of the 75 000 West African Royal Ternsspend the northern winter in the area (J.S. Salvigunpubl. data, Rose & Scott 1997, Keijl et al . 2000).
In this paper, relationships between the forag-ing behaviour of the three tern species and abioticfactors, such as time, tide and water clarity, arediscussed. Furthermore, a simple model shows theenergetic consequences of the differences in feedingbehaviour of the three species.
METHODS
Study site
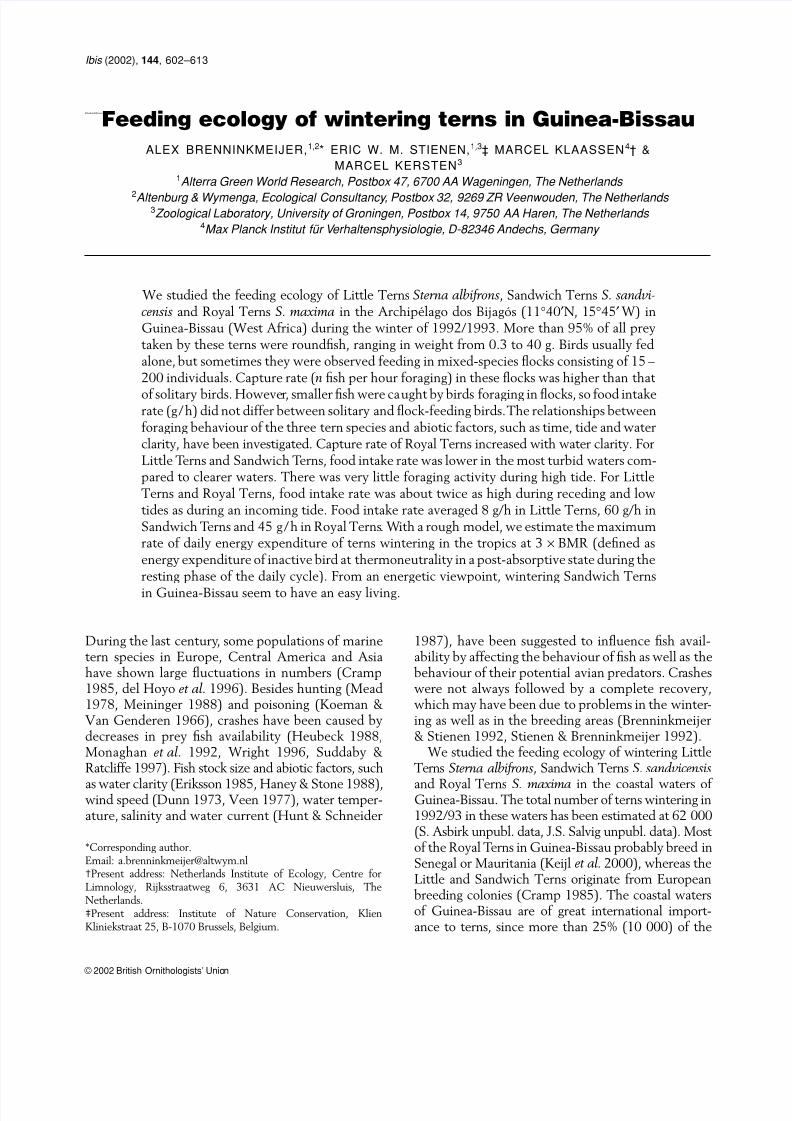
Fieldwork was carried out on 32 days between 15 No-vember 1992 and 7 February 1993, at 12 sites in theArchipélago dos Bijagós (11°40′N, 15°45′ W), a
group of islands and intertidal mudflats off the coast of Guinea-Bissau (Fig. 1). Each site was visited byboat for a period of 1–8 days. The sites holding thehighest tern densities were chosen for study, althoughnot all sites were accessible by boat or provided suit-
able observation opportunities. Site selection was basedon the following considerations. The lowest densityof foraging terns was measured in the harbour of Bissau (1 tern/km2), while high densities were foundaround the Isle of Orangozinho (197 terns/km2,Brenninkmeijer et al . 1998). The maximum densityof foraging terns at the 12 study sites averaged46.9 ± 47.1 (sd) terns/km2, which is close to the aver-age density of terns in the entire area (62 000 ternsat 1570 km2 of tidal area, J.S. Salvig unpubl. data).However, at the study sites even more terns werepresent, as some were always roosting on the beachesor on the tidal flats, suggesting that the sites chosenfor study held relatively high numbers of terns.
Figure 1. Study area in Guinea-Bissau with average water clarities (m) per study site (1: Cavalos 2.00– 3.25 m, 2: Rubane 0.70–1.75 m,
3: Maio 0.20–2.00 m, 4: Bolama 0.45–1.50 m, 5: Bissau 0.20–0.25 m, 6: Areias 0.40–0.60 m, 7: Orangozinho 0.70–0.90 m, 8: Prabis
0.50–0.70 m, 9: Porcos 0.70–1.25 m, 10: Enu 1.75–2.00 m, 11: Egumbane 0.35–0.90 m, 12: Galinhas 0.40–1.25 m).
8/3/2019 Ecology of Wintering
http://slidepdf.com/reader/full/ecology-of-wintering 3/12
604 A. Brenninkmeijer et al.
© 2002 British Ornithologists’ Union, Ibis , 144, 602–613
Study on fish
For logistic and technical reasons (most sites werenot suitable for hauling a net over the bottom), speciescomposition was measured at only two sites in the
centre of the Archipélago (Maio and Rubane). Nev-ertheless, 236 beam trawl catches at 31 different sitesin the Archipélago showed that species composition of roundfish was essentially the same at all sites except Bissau (Van der Veer 1998). Species composition wasmeasured by hauling a beach seine net (length 22 m,depth 1 m, mesh width 10 × 10 mm) over the bottomtowards the shore over a distance of c. 500 m. Theseobservations were made at the same time as ourtern investigations, on 11 (Maio), 25 (Rubane), 30December 1992 (Maio) and 18 January 1993 (Maio).In total, 22 catches were conducted at regular inter-vals over a full tidal cycle. The total length of eachfish caught was measured in 0.5-cm classes.
Because the mass of individual small fishes couldnot be measured accurately on a rolling vessel, wedetermined fish volume instead by putting fish in abeaker with water. Subsequently, the water volumeincrease, being the fish volume, was read off withan accuracy of 0.1 mL. Fish volume was convertedinto fresh mass assuming a specific mass of 1 g/cm3.Throughout the paper, fish mass is given as freshmass, unless otherwise indicated.
Behavioural observations on birdsForaging terns were observed between 07:00 h and19:00 h on 32 observation days for a total of 214 h.The number of terns using the observation area,measuring c. 12 500 m2 (taking a semicircular areaof about 90 m in radius), was counted at least onceper hour by telescope (magnification 20– 60 times).Of all terns flying in the observation area, one wasselected randomly to study its feeding behaviour foras long as possible. Flying immatures were not dis-tinguished from adults, since their winter plumagesare very similar. Although terns sometimes foraged
in flocks, most observations refer to terns foragingalone. Observations stopped when the tern flew out of the observation area, since prey size could not beestimated accurately from a distance greater than90 m. Terns that did not dive for fish during theobservation period were omitted from further ana-lysis. Because of the method used, individual forag-ing periods were highly variable and lasted between19 and 2280 s (average 299 ± 280 (sd) s). Foragingbehaviour was observed for 16.8 h in Little Terns,
11.9 h in Sandwich Terns and 7.8 h in Royal Terns.Prey size (total length, cm) was estimated with ref-erence to the tern’s bill length (this culmen length,from tip to feathers, is for Little Tern: 2.9 cm;Sandwich Tern: 5.4 cm; Royal Tern: 6.2 cm; Cramp
1985) and classified in 3-cm length classes. Priorto data collection, fish size estimates of eachobserver were calibrated by holding fishes of vari-ous sizes in front of a stuffed tern. Nevertheless, it was sometimes impossible to estimate prey lengthin the field. Afterwards, these unknown prey weregiven the average fish length per category of theknown prey. Capture rate (the number of prey perhour foraging) was determined for each birdobserved. Data on prey size were pooled per ternspecies and per category (flock or solitary foraging,water clarity, phase of the tidal cycle). Food intakerate (g/h foraging) was calculated for each category bymultiplying capture rate with the average prey mass.
Abiotic measurements
For the analyses of foraging behaviour, four tidal phaseswere distinguished: high tide (HT) (from 45 minbefore HT until 45 min after HT), receding tide (RT)(from 45 min after HT until 05:15 hours after HT),low tide (LT) (from 45 min before LT until 45 minafter LT), and incoming tide IT (from 05:15 hoursbefore HT until 45 min before HT); data fromAdmiralty Tide Tables. The daylight period (07:00 –
19:00 h) was divided into five periods (before 10:00,10:01–12:00, 12:01–14:00, 14:01–16:00, after 16:00 h).
Water clarity was measured with a Secchi disk at hourly intervals during most foraging observationsand beach seine days. Water clarity generally increasedgradually from the beach towards the channel. Toobtain a characteristic water clarity value per site perhour, water clarity was measured every 25 m alonga transect approximately 250 m perpendicular tothe shoreline, and the average taken. No significant day-to-day variation in water clarity was observed at any site when tidal phase was considered. Therefore,
for each site and tidal phase an average clarity value wasused in the statistical analyses of foraging behaviour.
Statistics
Data processing and statistics were conducted usingSPSS/PC, versions 4.0 and 6.0. Two-tailed tests andconfidence intervals of 0.05 were used in all cases.All figures and tables show weighted means (fortime) of capture rate and food intake rate.
8/3/2019 Ecology of Wintering
http://slidepdf.com/reader/full/ecology-of-wintering 4/12
© 2002 British Ornithologists’ Union, Ibis , 144, 602–613
Feeding ecology of wintering terns 605
RESULTS
Water clarity
Water clarity varied from 0.2 m in the shallow,
brackish waters near the capital of Bissau to 3.25 min the very south of the Archipélago dos Bijagós(Fig. 1). Corrected for place, there was no relation-ship between water clarity and time of day (ANCOVA,F 4,154 = 0.385, P = 0.819), nor between water clarityand tide (ANCOVA, F 3,155 = 4.068, P = 0.077).
Prey selection
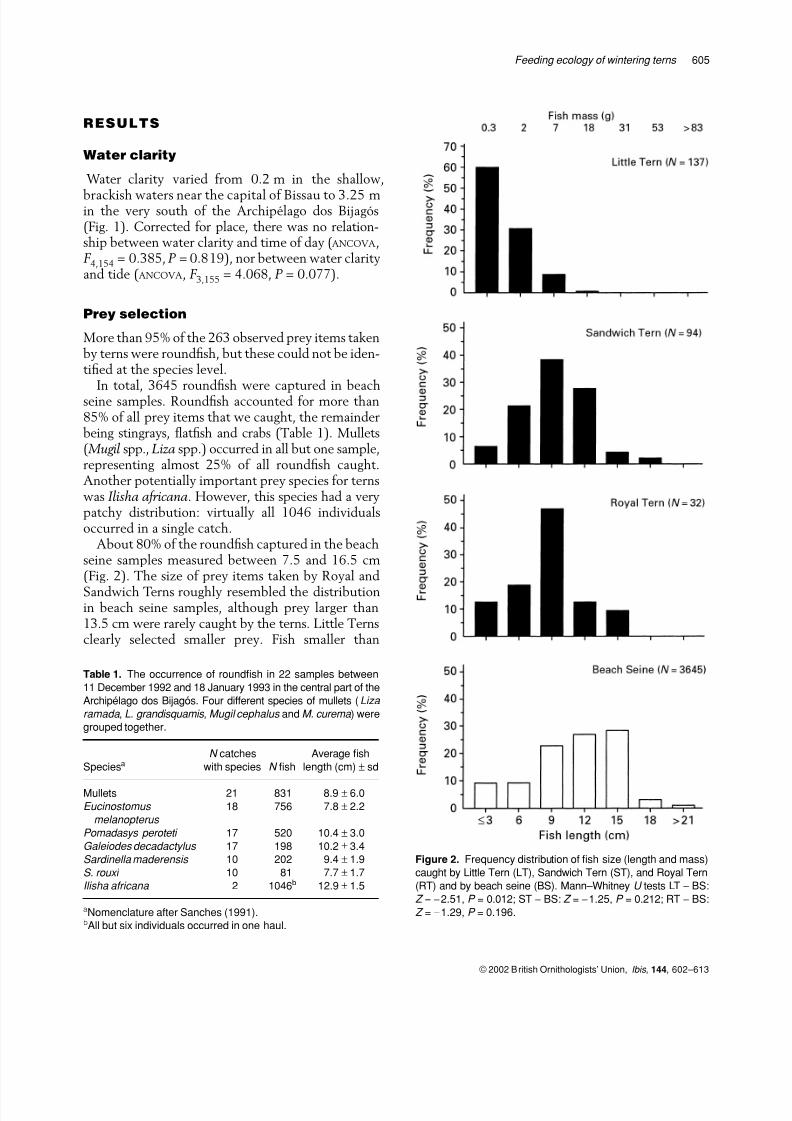
More than 95% of the 263 observed prey items takenby terns were roundfish, but these could not be iden-tified at the species level.
In total, 3645 roundfish were captured in beachseine samples. Roundfish accounted for more than85% of all prey items that we caught, the remainderbeing stingrays, flatfish and crabs (Table 1). Mullets( Mugil spp., Liza spp.) occurred in all but one sample,representing almost 25% of all roundfish caught.Another potentially important prey species for ternswas Ilisha africana. However, this species had a verypatchy distribution: virtually all 1046 individualsoccurred in a single catch.
About 80% of the roundfish captured in the beachseine samples measured between 7.5 and 16.5 cm(Fig. 2). The size of prey items taken by Royal and
Sandwich Terns roughly resembled the distributionin beach seine samples, although prey larger than13.5 cm were rarely caught by the terns. Little Ternsclearly selected smaller prey. Fish smaller than
Table 1. The occurrence of roundfish in 22 samples between
11 December 1992 and 18 January 1993 in the central part of the
Archipélago dos Bijagós. Four different species of mullets (Liza
ramada , L. grandisquamis , Mugil cephalus and M. curema ) were
grouped together.
SpeciesaN catches
with species N fish
Average fish
length (cm) ± sd
Mullets 21 831 8.9 ± 6.0
Eucinostomus
melanopterus
18 756 7.8 ± 2.2
Pomadasys peroteti 17 520 10.4 ± 3.0
Galeiodes decadactylus 17 198 10.2 ± 3.4
Sardinella maderensis 10 202 9.4 ± 1.9
S. rouxi 10 81 7.7 ± 1.7
Ilisha africana 2 1046b 12.9 ± 1.5
aNomenclature after Sanches (1991).bAll but six individuals occurred in one haul.
Figure 2. Frequency distribution of fish size (length and mass)
caught by Little Tern (LT), Sandwich Tern (ST), and Royal Tern
(RT) and by beach seine (BS). Mann–Whitney U tests LT − BS:
Z = −2.51, P = 0.012; ST − BS: Z = −1.25, P = 0.212; RT − BS:
Z = −1.29, P = 0.196.
8/3/2019 Ecology of Wintering
http://slidepdf.com/reader/full/ecology-of-wintering 5/12
606 A. Brenninkmeijer et al.
© 2002 British Ornithologists’ Union, Ibis , 144, 602–613
7.5 cm were significantly more abundant in their
diet (90%) than in the beach seine samples (18%)( X 1
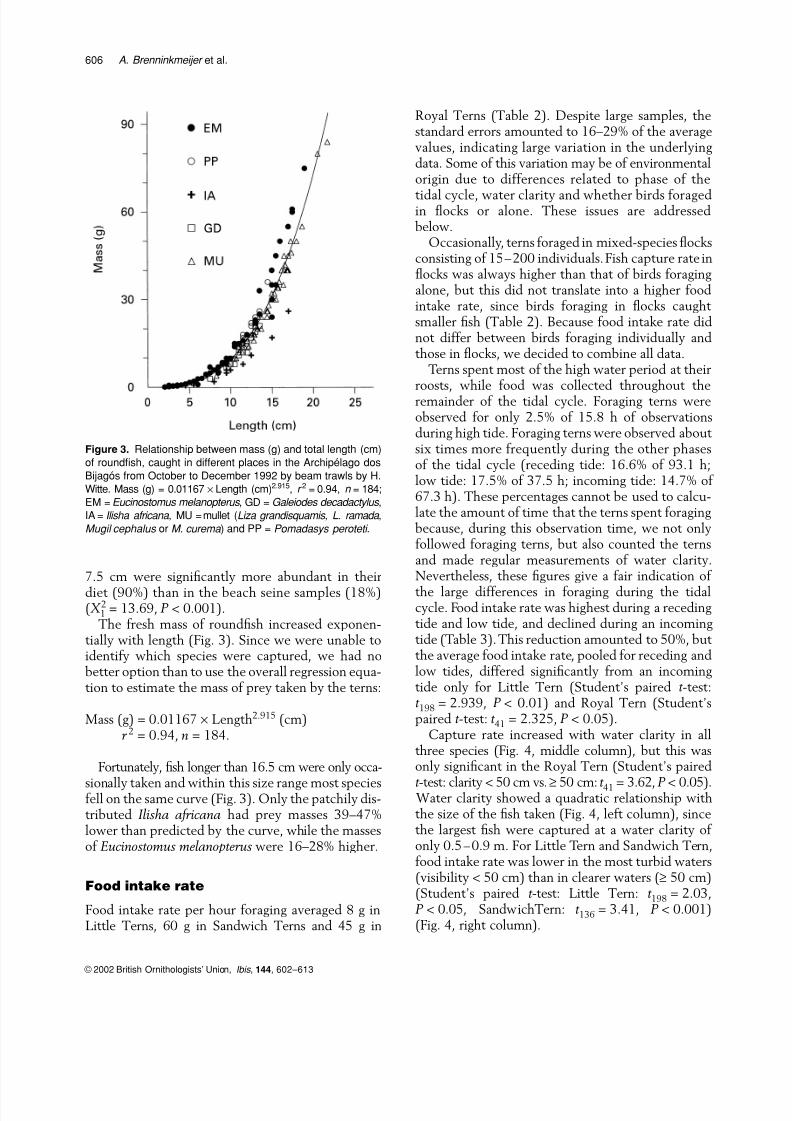
2 = 13.69, P < 0.001).The fresh mass of roundfish increased exponen-
tially with length (Fig. 3). Since we were unable toidentify which species were captured, we had nobetter option than to use the overall regression equa-tion to estimate the mass of prey taken by the terns:
Mass (g) = 0.01167 × Length2.915 (cm)r 2 = 0.94, n = 184.
Fortunately, fish longer than 16.5 cm were only occa-
sionally taken and within this size range most speciesfell on the same curve (Fig. 3). Only the patchily dis-tributed Ilisha africana had prey masses 39–47%lower than predicted by the curve, while the massesof Eucinostomus melanopterus were 16–28% higher.
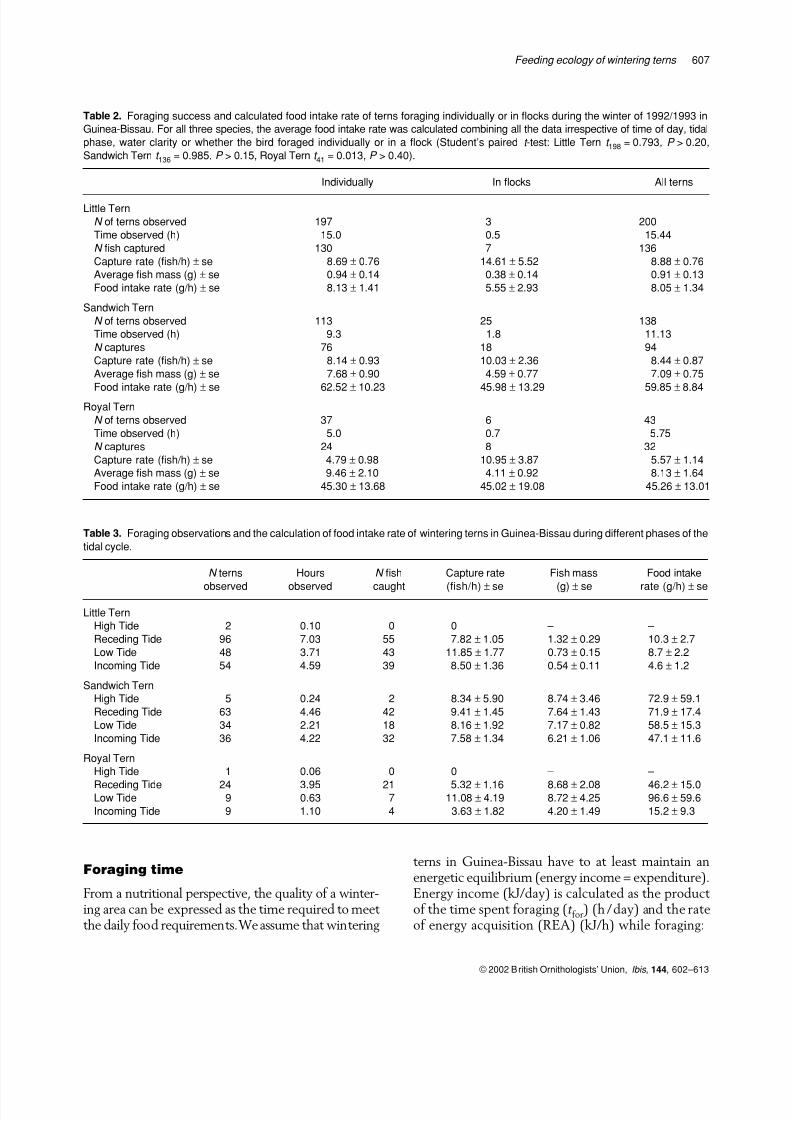
Food intake rate
Food intake rate per hour foraging averaged 8 g inLittle Terns, 60 g in Sandwich Terns and 45 g in
Royal Terns (Table 2). Despite large samples, thestandard errors amounted to 16–29% of the averagevalues, indicating large variation in the underlyingdata. Some of this variation may be of environmentalorigin due to differences related to phase of the
tidal cycle, water clarity and whether birds foragedin flocks or alone. These issues are addressedbelow.
Occasionally, terns foraged in mixed-species flocksconsisting of 15–200 individuals. Fish capture rate inflocks was always higher than that of birds foragingalone, but this did not translate into a higher foodintake rate, since birds foraging in flocks caught smaller fish (Table 2). Because food intake rate didnot differ between birds foraging individually andthose in flocks, we decided to combine all data.
Terns spent most of the high water period at theirroosts, while food was collected throughout theremainder of the tidal cycle. Foraging terns wereobserved for only 2.5% of 15.8 h of observationsduring high tide. Foraging terns were observed about six times more frequently during the other phasesof the tidal cycle (receding tide: 16.6% of 93.1 h;low tide: 17.5% of 37.5 h; incoming tide: 14.7% of 67.3 h). These percentages cannot be used to calcu-late the amount of time that the terns spent foragingbecause, during this observation time, we not onlyfollowed foraging terns, but also counted the ternsand made regular measurements of water clarity.Nevertheless, these figures give a fair indication of
the large differences in foraging during the tidalcycle. Food intake rate was highest during a recedingtide and low tide, and declined during an incomingtide (Table 3). This reduction amounted to 50%, but the average food intake rate, pooled for receding andlow tides, differed significantly from an incomingtide only for Little Tern (Student’s paired t -test:t 198 = 2.939, P < 0.01) and Royal Tern (Student’spaired t -test: t 41 = 2.325, P < 0.05).
Capture rate increased with water clarity in allthree species (Fig. 4, middle column), but this wasonly significant in the Royal Tern (Student’s paired
t -test: clarity < 50 cm vs.≥ 50 cm: t 41 = 3.62, P < 0.05). Water clarity showed a quadratic relationship withthe size of the fish taken (Fig. 4, left column), sincethe largest fish were captured at a water clarity of only 0.5–0.9 m. For Little Tern and Sandwich Tern,food intake rate was lower in the most turbid waters(visibility < 50 cm) than in clearer waters (≥ 50 cm)(Student’s paired t -test: Little Tern: t 198 = 2.03,P < 0.05, SandwichTern: t 136 = 3.41, P < 0.001)(Fig. 4, right column).
Figure 3. Relationship between mass (g) and total length (cm)
of roundfish, caught in different places in the Archipélago dos
Bijagós from October to December 1992 by beam trawls by H.
Witte. Mass (g) = 0.01167 × Length (cm)2.915, r 2 = 0.94, n = 184;
EM = Eucinostomus melanopterus , GD = Galeiodes decadactylus ,
IA = Ilisha africana , MU = mullet (Liza grandisquamis , L. ramada ,
Mugil cephalus or M. curema ) and PP = Pomadasys peroteti .
8/3/2019 Ecology of Wintering
http://slidepdf.com/reader/full/ecology-of-wintering 6/12
© 2002 British Ornithologists’ Union, Ibis , 144, 602–613
Feeding ecology of wintering terns 607
Foraging time
From a nutritional perspective, the quality of a winter-ing area can be expressed as the time required to meet the daily food requirements. We assume that wintering
terns in Guinea-Bissau have to at least maintain anenergetic equilibrium (energy income = expenditure).Energy income (kJ/day) is calculated as the product of the time spent foraging (t for) (h /day) and the rateof energy acquisition (REA) (kJ/h) while foraging:
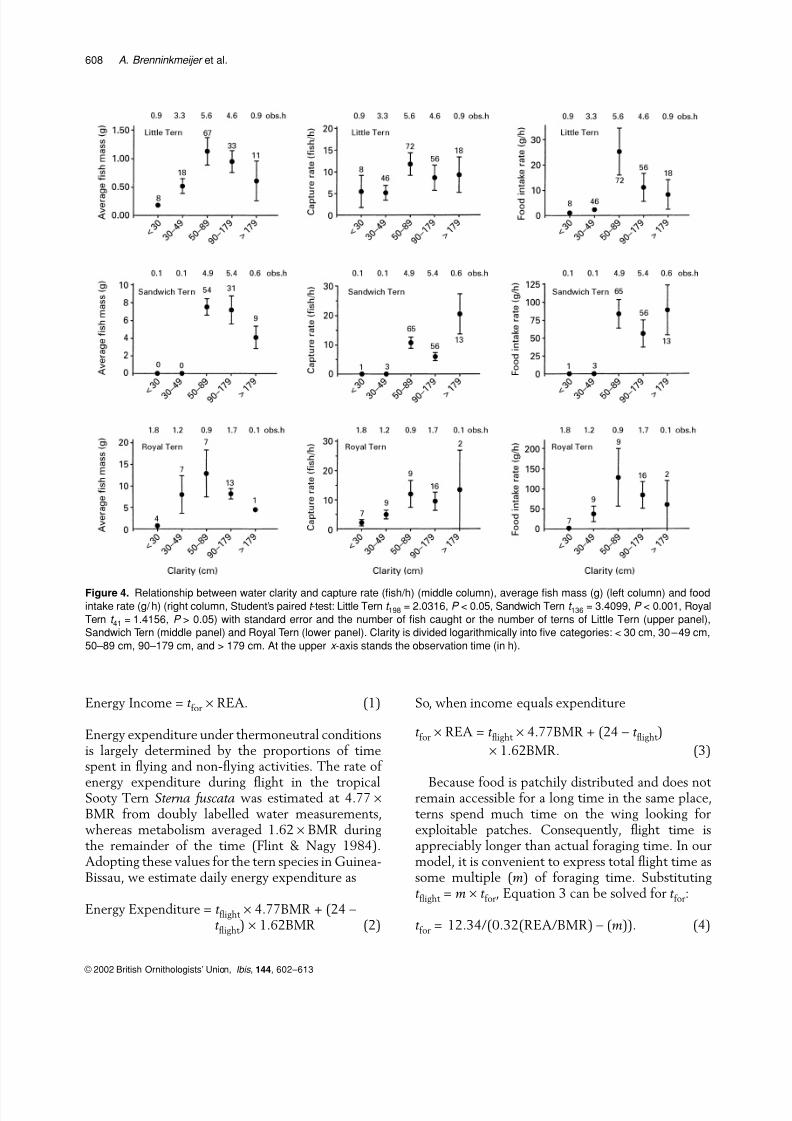
Table 2. Foraging success and calculated food intake rate of terns foraging individually or in flocks during the winter of 1992/1993 in
Guinea-Bissau. For all three species, the average food intake rate was calculated combining all the data irrespective of time of day, tidal
phase, water clarity or whether the bird foraged individually or in a flock (Student’s paired t -test: Little Tern t 198 = 0.793, P > 0.20,
Sandwich Tern t 136 = 0.985, P > 0.15, Royal Tern t 41 = 0.013, P > 0.40).
Individually In flocks All terns
Little Tern
N of terns observed 197 3 200
Time observed (h) 15.0 0.5 15.44
N fish captured 130 7 136
Capture rate (fish/h) ± se 8.69 ± 0.76 14.61 ± 5.52 8.88 ± 0.76
Average fish mass (g) ± se 0.94 ± 0.14 0.38 ± 0.14 0.91 ± 0.13
Food intake rate (g/h) ± se 8.13 ± 1.41 5.55 ± 2.93 8.05 ± 1.34
Sandwich Tern
N of terns observed 113 25 138
Time observed (h) 9.3 1.8 11.13
N captures 76 18 94
Capture rate (fish/h) ± se 8.14 ± 0.93 10.03 ± 2.36 8.44 ± 0.87
Average fish mass (g) ± se 7.68 ± 0.90 4.59 ± 0.77 7.09 ± 0.75
Food intake rate (g/h)±
se 62.52±
10.23 45.98±
13.29 59.85±
8.84Royal Tern
N of terns observed 37 6 43
Time observed (h) 5.0 0.7 5.75
N captures 24 8 32
Capture rate (fish/h) ± se 4.79 ± 0.98 10.95 ± 3.87 5.57 ± 1.14
Average fish mass (g) ± se 9.46 ± 2.10 4.11 ± 0.92 8.13 ± 1.64
Food intake rate (g/h) ± se 45.30 ± 13.68 45.02 ± 19.08 45.26 ± 13.01
Table 3. Foraging observations and the calculation of food intake rate of wintering terns in Guinea-Bissau during different phases of the
tidal cycle.
N terns
observed
Hours
observed
N fish
caught
Capture rate
(fish/h) ± se
Fish mass
(g) ± se
Food intake
rate (g/h) ± se
Little Tern
High Tide 2 0.10 0 0 – –
Receding Tide 96 7.03 55 7.82 ± 1.05 1.32 ± 0.29 10.3 ± 2.7
Low Tide 48 3.71 43 11.85 ± 1.77 0.73 ± 0.15 8.7 ± 2.2
Incoming Tide 54 4.59 39 8.50 ± 1.36 0.54 ± 0.11 4.6 ± 1.2
Sandwich Tern
High Tide 5 0.24 2 8.34 ± 5.90 8.74 ± 3.46 72.9 ± 59.1
Receding Tide 63 4.46 42 9.41 ± 1.45 7.64 ± 1.43 71.9 ± 17.4
Low Tide 34 2.21 18 8.16 ± 1.92 7.17 ± 0.82 58.5 ± 15.3
Incoming Tide 36 4.22 32 7.58 ± 1.34 6.21 ± 1.06 47.1 ± 11.6
Royal Tern
High Tide 1 0.06 0 0 – –
Receding Tide 24 3.95 21 5.32 ± 1.16 8.68 ± 2.08 46.2 ± 15.0Low Tide 9 0.63 7 11.08 ± 4.19 8.72 ± 4.25 96.6 ± 59.6
Incoming Tide 9 1.10 4 3.63 ± 1.82 4.20 ± 1.49 15.2 ± 9.3
8/3/2019 Ecology of Wintering
http://slidepdf.com/reader/full/ecology-of-wintering 7/12
608 A. Brenninkmeijer et al.
© 2002 British Ornithologists’ Union, Ibis , 144, 602–613
Energy Income = t for × REA. (1)
Energy expenditure under thermoneutral conditionsis largely determined by the proportions of timespent in flying and non-flying activities. The rate of
energy expenditure during flight in the tropicalSooty Tern Sterna fuscata was estimated at 4.77 ×
BMR from doubly labelled water measurements,whereas metabolism averaged 1.62 × BMR duringthe remainder of the time (Flint & Nagy 1984).Adopting these values for the tern species in Guinea-Bissau, we estimate daily energy expenditure as
Energy Expenditure = t flight × 4.77BMR + (24 − t flight ) × 1.62BMR (2)
So, when income equals expenditure
t for × REA = t flight × 4.77BMR + (24 − t flight )
× 1.62BMR. (3)
Because food is patchily distributed and does not remain accessible for a long time in the same place,terns spend much time on the wing looking forexploitable patches. Consequently, flight time isappreciably longer than actual foraging time. In ourmodel, it is convenient to express total flight time assome multiple (m) of foraging time. Substitutingt flight = m × t for, Equation 3 can be solved for t for:
t for = 12.34/(0.32(REA/BMR) − (m)). (4)
Figure 4. Relationship between water clarity and capture rate (fish/h) (middle column), average fish mass (g) (left column) and foodintake rate (g/ h) (right column, Student’s paired t -test: Little Tern t 198 = 2.0316, P < 0.05, Sandwich Tern t 136 = 3.4099, P < 0.001, Royal
Tern t 41 = 1.4156, P > 0.05) with standard error and the number of fish caught or the number of terns of Little Tern (upper panel),
Sandwich Tern (middle panel) and Royal Tern (lower panel). Clarity is divided logarithmically into five categories: < 30 cm, 30–49 cm,
50–89 cm, 90–179 cm, and > 179 cm. At the upper x -axis stands the observation time (in h).
8/3/2019 Ecology of Wintering
http://slidepdf.com/reader/full/ecology-of-wintering 8/12
© 2002 British Ornithologists’ Union, Ibis , 144, 602–613
Feeding ecology of wintering terns 609
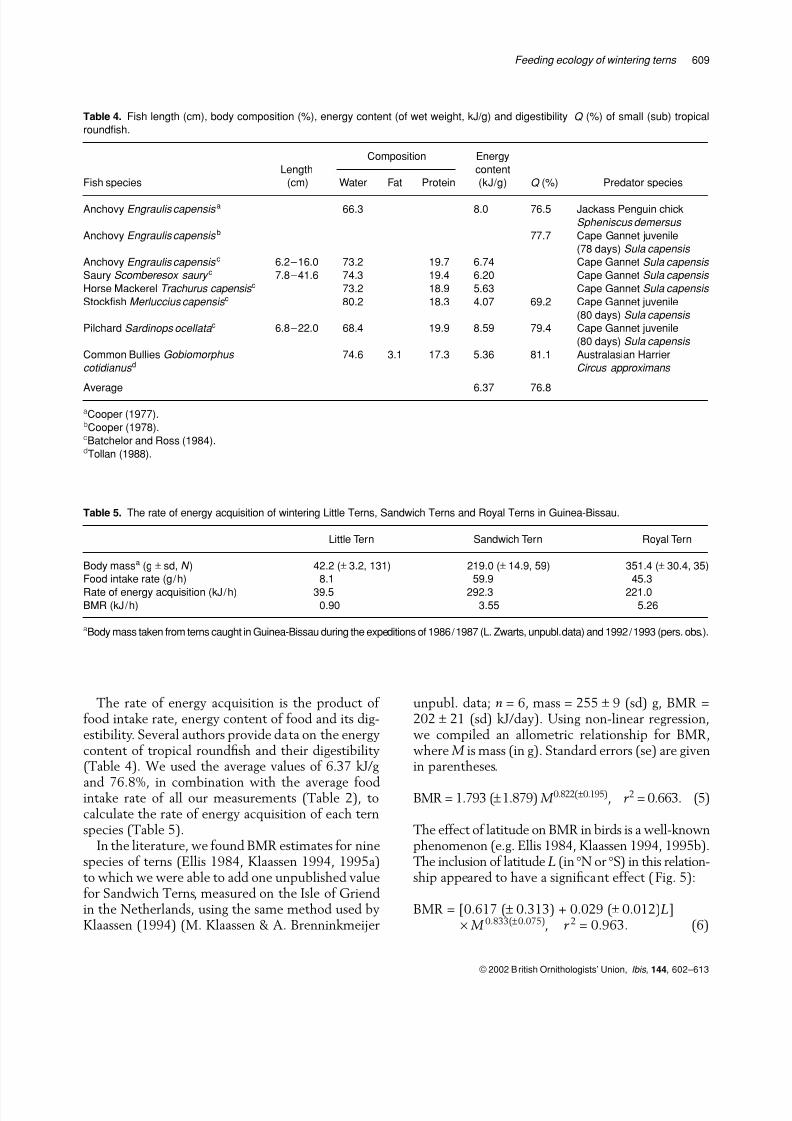
The rate of energy acquisition is the product of food intake rate, energy content of food and its dig-estibility. Several authors provide data on the energycontent of tropical roundfish and their digestibility(Table 4). We used the average values of 6.37 kJ/g
and 76.8%, in combination with the average foodintake rate of all our measurements (Table 2), tocalculate the rate of energy acquisition of each ternspecies (Table 5).
In the literature, we found BMR estimates for ninespecies of terns (Ellis 1984, Klaassen 1994, 1995a)to which we were able to add one unpublished valuefor Sandwich Terns, measured on the Isle of Griendin the Netherlands, using the same method used byKlaassen (1994) (M. Klaassen & A. Brenninkmeijer
unpubl. data; n = 6, mass = 255 ± 9 (sd) g, BMR =202 ± 21 (sd) kJ/day). Using non-linear regression,we compiled an allometric relationship for BMR,where M is mass (in g). Standard errors (se) are givenin parentheses.
BMR = 1.793 (±1.879) M 0.822(±0.195), r 2 = 0.663. (5)
The effect of latitude on BMR in birds is a well-knownphenomenon (e.g. Ellis 1984, Klaassen 1994, 1995b).The inclusion of latitude L (in °N or °S) in this relation-ship appeared to have a significant effect ( Fig. 5):
BMR = [0.617 (± 0.313) + 0.029 (± 0.012)L]× M 0.833(±0.075), r 2 = 0.963. (6)
Table 4. Fish length (cm), body composition (%), energy content (of wet weight, kJ/g) and digestibility Q (%) of small (sub) tropical
roundfish.
Fish species
Length
(cm)
Composition Energy
content
(kJ/g) Q (%) Predator speciesWater Fat Protein
Anchovy Engraulis capensis a 66.3 8.0 76.5 Jackass Penguin chick
Spheniscus demersus
Anchovy Engraulis capensis b 77.7 Cape Gannet juvenile
(78 days) Sula capensis
Anchovy Engraulis capensis c 6.2–16.0 73.2 19.7 6.74 Cape Gannet Sula capensis
Saury Scomberesox saury c 7.8–41.6 74.3 19.4 6.20 Cape Gannet Sula capensis
Horse Mackerel Trachurus capensis c 73.2 18.9 5.63 Cape Gannet Sula capensis
Stockfish Merluccius capensis c 80.2 18.3 4.07 69.2 Cape Gannet juvenile
(80 days) Sula capensis
Pilchard Sardinops ocellata c 6.8–22.0 68.4 19.9 8.59 79.4 Cape Gannet juvenile
(80 days) Sula capensis
Common Bullies Gobiomorphus
cotidianus d74.6 3.1 17.3 5.36 81.1 Australasian Harrier
Circus approximans
Average 6.37 76.8aCooper (1977). bCooper (1978).
cBatchelor and Ross (1984). dTollan (1988).
Table 5. The rate of energy acquisition of wintering Little Terns, Sandwich Terns and Royal Terns in Guinea-Bissau.
Little Tern Sandwich Tern Royal Tern
Body massa (g ± sd, N ) 42.2 (± 3.2, 131) 219.0 (± 14.9, 59) 351.4 (± 30.4, 35)
Food intake rate (g/h) 8.1 59.9 45.3
Rate of energy acquisition (kJ/h) 39.5 292.3 221.0BMR (kJ/h) 0.90 3.55 5.26
aBody mass taken from terns caught in Guinea-Bissau during the expeditions of 1986/1987 (L. Zwarts, unpubl. data) and 1992/1993 (pers. obs.).
8/3/2019 Ecology of Wintering
http://slidepdf.com/reader/full/ecology-of-wintering 9/12
610 A. Brenninkmeijer et al.
© 2002 British Ornithologists’ Union, Ibis , 144, 602–613
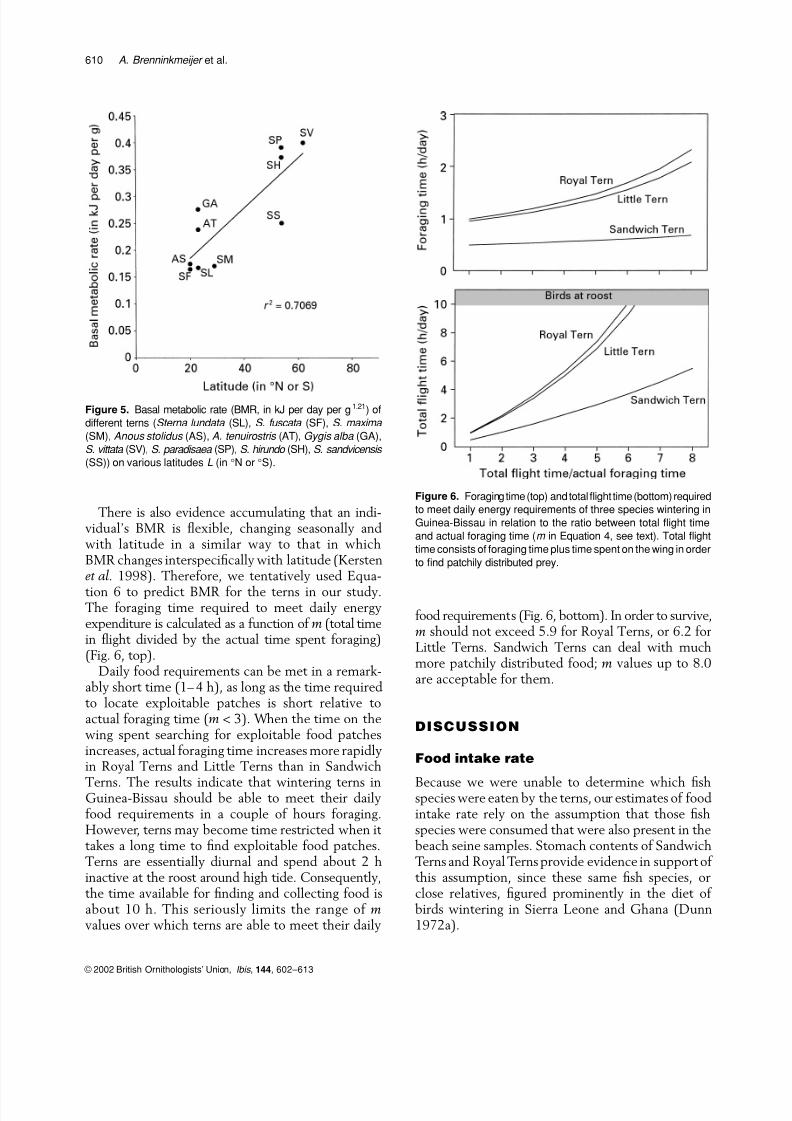
There is also evidence accumulating that an indi-vidual’s BMR is flexible, changing seasonally andwith latitude in a similar way to that in whichBMR changes interspecifically with latitude (Kerstenet al . 1998). Therefore, we tentatively used Equa-
tion 6 to predict BMR for the terns in our study.The foraging time required to meet daily energyexpenditure is calculated as a function of m (total timein flight divided by the actual time spent foraging)(Fig. 6, top).
Daily food requirements can be met in a remark-ably short time (1– 4 h), as long as the time requiredto locate exploitable patches is short relative toactual foraging time (m < 3). When the time on thewing spent searching for exploitable food patchesincreases, actual foraging time increases more rapidlyin Royal Terns and Little Terns than in Sandwich
Terns. The results indicate that wintering terns inGuinea-Bissau should be able to meet their dailyfood requirements in a couple of hours foraging.However, terns may become time restricted when it takes a long time to find exploitable food patches.Terns are essentially diurnal and spend about 2 hinactive at the roost around high tide. Consequently,the time available for finding and collecting food isabout 10 h. This seriously limits the range of mvalues over which terns are able to meet their daily
food requirements (Fig. 6, bottom). In order to survive,m should not exceed 5.9 for Royal Terns, or 6.2 forLittle Terns. Sandwich Terns can deal with muchmore patchily distributed food; m values up to 8.0are acceptable for them.
DISCUSSION
Food intake rate
Because we were unable to determine which fishspecies were eaten by the terns, our estimates of foodintake rate rely on the assumption that those fishspecies were consumed that were also present in thebeach seine samples. Stomach contents of SandwichTerns and Royal Terns provide evidence in support of this assumption, since these same fish species, orclose relatives, figured prominently in the diet of birds wintering in Sierra Leone and Ghana (Dunn1972a).
Figure 5. Basal metabolic rate (BMR, in kJ per day per g1.21) of
different terns (Sterna lundata (SL), S. fuscata (SF), S. maxima
(SM), Anous stolidus (AS), A. tenuirostris (AT), Gygis alba (GA),
S. vittata (SV), S. paradisaea (SP), S. hirundo (SH), S. sandvicensis
(SS)) on various latitudes L (in °N or °S).
Figure 6. Foraging time (top) and total flight time (bottom) required
to meet daily energy requirements of three species wintering in
Guinea-Bissau in relation to the ratio between total flight time
and actual foraging time (m in Equation 4, see text). Total flight
time consists of foraging time plus time spent on the wing in order
to find patchily distributed prey.
8/3/2019 Ecology of Wintering
http://slidepdf.com/reader/full/ecology-of-wintering 10/12
© 2002 British Ornithologists’ Union, Ibis , 144, 602–613
Feeding ecology of wintering terns 611
Relatively large standard errors surround the ratesof food intake calculated from our data. This is dueto the stochastic nature of prey captures in combina-tion with the large variation in mass of individual fishcaptured. For instance, the few fish in the largest size
classes accounted for more than 50% of the biomassconsumed by each tern species. Theoretically, thisproblem can be solved by making longer observations,but given the high mobility and low site tenacity of foraging terns, this is impossible in practice. Conse-quently, we have to accept that only major environ-mental factors affecting food intake rate can be detected.
In our study, terns did not benefit from flock for-aging. Despite a higher capture rate, food intake ratedid not increase because terns foraging in flockscaught smaller fish. Other studies on fish-eatingbirds have shown that birds foraging in flocks havehigher capture rates than those foraging solitarily(Krebs 1974, Götmark et al . 1986, Hafner et al .1993, Van Eerden & Voslamber 1995, Reid 1997).Yet only two studies have also measured higher foodintake rates (Krebs 1974, Hafner et al . 1993). Althoughour observations indicate that food intake rate wassimilar in flocks to that in solitary feeding, the ternsprobably gain greatly from joining a flock becausethis shortens search time.
Surprisingly, water clarity had a more pronouncedeffect on the size of fish captured than on capturerate. Average fish mass was highest at water claritybetween 50 and 90 cm. We have no idea why the
average fish mass declined when water clarityimproved beyond 90 cm. Fish captured in clearwater were considerably larger than those capturedin the most turbid waters, but few very large indi-viduals were captured. Recently, Mous (2000) reportedon the vertical distribution of fish in relation to waterclarity in Lake IJsselmeer, the Netherlands. Heshowed that larger fish move towards the surface aswater turbidity increases. This suggests that changesin fish availability rather than visibility might beresponsible for the fact that fewer large fish werecaptured in the clearest waters. Consequently, food
intake rate increased with water clarity up to 50–90 cm, but not beyond. In general, water clarityincreased with distance from the mainland, which iswhere most tern concentrations were also encoun-tered. The most turbid waters occurred at the rivermouth of the Rio Geba, around Bissau, Areias andPrabis (localities 5, 6 and 8, Fig. 1). With the excep-tion of Areias (6), which is an important roost areafor terns, only small numbers of terns were observedon these sites.
Wintering area quality
The question arises: is Guinea-Bissau a good winter-ing area for terns? Capture rates of wintering Sand-wich Terns in Guinea-Bissau were 12–41% lower
than those of conspecifics in Sierra Leone (Dunn1972b). For Royal Terns in Guinea-Bissau, capturerates were 29–57% lower compared with conspe-cifics wintering on Bonaire, Netherlands Antilles(Buckley & Buckley 1974). Unfortunately, there isno comparable information about foraging LittleTerns in other wintering areas or in other years. So,Guinea-Bissau appears to be a poorer wintering areathan Bonaire or Sierra Leone. However, feeding con-ditions between Guinea-Bissau and other winteringareas are difficult to compare, because the most important factor, food intake rate, is only knownfrom Guinea-Bissau in one year.
Besides large standard errors, there are severalother sources of random and systematic errors, suchas fish length estimation in the field (with an inac-curacy of a quarter of a bill length), the conversionof fish length into fish mass, and the assumption of BMR and flight cost, which make the model lessaccurate. Still, it was useful to make this rough model.Not only does it show the differences between thethree tern species, but it also gives a rough indica-tion of the quality of Guinea-Bissau as a winteringarea for terns. We hope that this will stimulateother researchers to conduct similar investigations in
wintering areas.In our model, daily energy expenditure was calcu-
lated as the sum of energies expended during flight and non-flight activities. Daily energy expenditureincreases linearly with flight time, because the pre-sumed rate of energy expenditure was almost threetimes as high during flight (4.77BMR) as during‘non-flight’ (1.62BMR). When food becomes morepatchily distributed, terns need more time to locateexploitable patches and flight time increases until amaximum of 10 h per day. Consequently, daily energyexpenditure will reach its maximum under these
circumstances. This maximum rate of daily energyexpenditure can be estimated provisionally for ternswintering in the tropics: DEE = (10 × 4.77BMR +14 × 1.62BMR)/24 = about 3 × BMR (kJ/h).
This is a rather moderate value, given that sus-tainable rates of energy expenditure in other birdspecies are in the order of 4 –5 × BMR (Drent & Daan1980).
Actual rates of daily energy expenditure arealmost certainly lower, since terns are not likely to
8/3/2019 Ecology of Wintering
http://slidepdf.com/reader/full/ecology-of-wintering 11/12
612 A. Brenninkmeijer et al.
© 2002 British Ornithologists’ Union, Ibis , 144, 602–613
forage all day. Therefore, from an energetic point of view, wintering terns in Guinea-Bissau seem to havean easy living. Since the observed rates of food intakewhile foraging are high (Table 5), the crucial factordetermining whether terns are able to meet their
food requirements is the time required to locateexploitable food patches. With respect to thisparameter, Sandwich Terns are better off than eitherLittle Terns or Royal Terns. Sandwich Terns canafford to search for more than 1 h to find a patch,which they can exploit for 10 min. Little Terns andRoyal Terns must find a similar patch within 30 min.
Consequently, we should expect Sandwich Terns tobe more widely distributed throughout the Archipélagodos Bijagós than the other two species. SandwichTerns may occupy parts of the archipelago where thedensity of exploitable patches is too low for LittleTern and Royal Tern. Finally, we predict that, in thoseparts of the archipelago where the three speciesoccur together, Sandwich Terns spend more timeinactive during low water than the other two species.
We thank the Ministerio do Desenvolvimento Rural eda Agricultura (their ministry of agriculture) and theDireccao Geral dos Servicos Florestais e Caca of Guinea-Bissau for allowing us to work in the Archipélago dosBijagós and for supporting our project in various ways. InGuinea-Bissau, we received help from numerous peopleand organizations, such as the Foundation Dutch Volun-teers (SNV) and the IUCN Biosphere Project. The finan-cial support of the expedition, organized by Wim Wolff
and Ekko Smith, was obtained from the National Geo-graphic Society, Directorate NBLF of the NetherlandsMinistry of Agriculture, Nature Conservation and Fishery(LNV), Netherlands Foundation for Sea Research (SOZ),Netherlands Foundation for Advancement of TropicalResearch (WOTRO), Beijerink-Popping Fund, PrinsBernhard Fund, Danish Forest and Nature Directorate, theNetherlands Institute for Forestry and Nature Research(IBN-DLO), the Foundation Working Group Interna-tional Wader and Waterfowl Research (WIWO), theDepartment of Nature Conservation of the AgriculturalUniversity of Wageningen (LUW), the Flevoland Directo-rate of the Ministry of Transport, Public Works and WaterManagement (RWS), and the British Broadcasting Corpo-
ration (BBC). We would like to thank all the participantsof the 1992/1993 Guinea-Bissau expedition, especially Dik Bekker, Luis Malabe da Fonseca, Jan van de Kam, Jan vander Kamp, Alquiea Quade, Bernard Spaans and Pieter Wybenga for their logistic contribution and overall help inthe field, and Sten Asbirk, Norbert Dankers, Jacob Salvig,Hans Witte and Leo Zwarts for supplementary tern andfish data. Our final thanks go to Arie Spaans, Piet vanTienen, Jan Veen and Wim Wolff and two anonymousreferees for their helpful comments on earlier versions of this paper. This paper is publication 2089, Netherlands
Institute of Ecology, Centre for Limnology, Nieuwersluis,the Netherlands.
REFERENCES
Batchelor, A.L. & Ross, G.J.B. 1984. The diet and implications
of dietary change of Cape Gannets on Bird Island, Algoa Bay.Ostrich 55: 45–63.
Brenninkmeijer, A., Klaassen, M. & Stienen, E.W.M. 1998.
Ecology of wintering terns. In Wolff, W.J. (ed.) Waders in
Guinea-Bissau, October 1992–May 1993 . The end of the
East-Atlantic Flyway : 49–56. Zeist: WIWO-report 39.
Brenninkmeijer, A. & Stienen, E.W.M. 1992. Ecological profile
of the Sandwich Tern (Sterna sandvicensis). RIN-report 92/
17. Wageningen: Institute of Forestry and Nature Research.
(In Dutch with summary in English.)
Buckley, F.G. & Buckley, P.A. 1974. Comparative feeding
ecology of wintering adult and juvenile Royal Terns (Aves:
Laridae, Sterninae). Ecology 55: 1053–1063.
Cooper, J. 1977. Energetic requirements for growth of the Jack-
ass Penguin. Zool . Africana 12: 201– 213.
Cooper, J. 1978. Energetic requirements for growth and main-tenance of the Cape Gannet (Aves: Sulidae). Zool . Africana
13: 305–317.
Cramp, S. (ed.) 1985. The Birds of the Western Palearctic , Vol. 4.
Oxford: Oxford University Press.
Drent, R.H. & Daan, S. 1980. The prudent parent: energetic
adjustments in avian breeding. Ardea 68: 225–252.
Dunn, E.K. 1972a. Studies on Terns, with Particular Reference
to Feeding Ecology . PhD Thesis, Durham University.
Dunn, E.K. 1972b. Effect of age on the fishing ability of Sand-
wich Terns Sterna sandvicensis . Ibis 114: 360– 366.
Dunn, E.K. 1973. Changes in fishing ability of terns associated with
windspeed and sea surface conditions.Nature 244: 520– 521.
Ellis, H.I. 1984. Energetics of free-ranging seabirds. In Whittow,
G.C. & Rahn, H. (eds) Seabird Energetics : 203–234. New
York: Plenum.
Eriksson, M.O.G. 1985. Prey detectability for fish-eating birds in
relation to fish density and water transparency. Ornis Scand .16: 1– 7.
Flint, E.N. & Nagy, K.A. 1984. Flight energetics of free-living
Sooty Terns. Auk 101: 288–294.
Götmark, F., Winkler, D.W. & Anderson, M. 1986. Flock-feeding
on fish schools increasing individual success in gulls. Nature
319: 589– 591.
Hafner, H., Dugan, P.J., Kersten, M., Pineau, O. & Wallace, J.P.
1993. Flock feeding and food intake in Little Egrets Egretta
garzetta and their effects on food provisioning and repro-
ductive success. Ibis 135: 25–32.
Haney, J.C. & Stone, A.E. 1988. Seabird foraging tactics and
water clarity: are plunge divers really in the clear? Mar . Ecol .Prog . Series 49: 1–9.
Heubeck, M. 1988. Shetland’s seabirds in dire straits. BTO
News 158: 1– 2.
del Hoyo, J., Elliott, A. & Sargatal, J. 1996. Handbook of the
Birds of the World 3: Hoatzin to Auks . Barcelona: Lynx Edicions.
Hunt, G.L. Jr & Schneider, D.C. 1987. Scale dependent
processes in the physical and biological environment of
marine birds. In Croxall, J.D. (ed.) Seabirds, Feeding Ecology
and Role in Marine Ecosystems : 7–41. Cambridge: CUP.
Keijl, G., Brenninkmeijer, A., Schepers, F.J., Brasseur, R.E.,
Ndiaye, A., Stienen, E.W.M. & Veen, J. 2000. Oiseaux
8/3/2019 Ecology of Wintering
http://slidepdf.com/reader/full/ecology-of-wintering 12/12
© 2002 British Ornithologists’ Union, Ibis , 144, 602–613
Feeding ecology of wintering terns 613
nicheurs sur les côtes du Parc National Langue de Barbarie
et du Parc National du Sine-Saloum, Sénégal . Report IBN-
DLO 99/6. Zeist, The Netherlands: WIWO.
Kersten, M., Bruinzeel, L.W., Wiersma, P. & Piersma, T. 1998.
Reduced basal metabolic rate of migratory waders wintering
in coastal Africa. Ardea 86: 71–80.
Klaassen, M. 1994. Growth and energetics of tern chicks fromtemperate and polar environments. Auk 111: 525– 544.
Klaassen, M. 1995a. Erratum: Klaassen (1994). Auk 112: 264.
Klaassen, M. 1995b. Moult and basal metabolic costs in males
of two subspecies of Stonechats: the European Saxicola
torquata rubicula and the East African S. t. axillaris . Oecolo-
gia 104: 424–432.
Koeman, J.H. & van Genderen, H. 1966. Some preliminary
notes on residues of chlorinated hydrocarbon insecticides in
birds and mammals in the Netherlands. J . Appl . Ecol . 3: 99–
106.
Krebs, J.R. 1974. Colonial nesting and social feeding as strate-
gies for exploiting food resources in the Great Blue Heron
Ardea herodias . Behaviour 51: 99–134.
Mead, C.J. 1978. Tern mortality in West Africa as shown by
British and Dutch ringing results. Ibis 120: 110.Meininger, P.L. 1988. A Preliminary Investigation of Tern
Catching in Senegal, Winter 1987/88 . ICBP study report 35.
Cambridge: International Council for Bird Preservation.
Monaghan, P., Uttley, J.D. & Burns, M.D. 1992. Effect of
changes in food availability on reproductive effort in Arctic
Terns Sterna paradisaea . Ardea 80: 71–81.
Mous, P. 2000. Interactions Between Fisheries and Birds in
Ijsselmeer, the Netherlands . PhD Thesis, Wageningen
University.
Reid, J. 1997. The foraging of Common Sterna hirundo and
Sandwich S. sandvicensis Terns in Teesmouth. Ibis 139: 601.
Rose, P.M. & Scott, D.A. 1997. Waterfowl Population Estimates:
Wetlands , 2nd edn. Wageningen, The Netherlands: Interna-
tional Publishers.
Sanches, J.G. 1991. Catálogo Dos Principais Peixes Marinhos
Da República Da Guiné-Bissau . Lisbon: Publicaçoes avulsas
do INIP.
Stienen, E.W.M. & Brenninkmeijer, A. 1992. Ecological profile of the Common Tern (Sterna hirundo). RIN-report 92/18.
Wageningen: Institute of Forestry and Nature Research. (In
Dutch with summary in English.)
Suddaby, D. & Ratcliffe, N. 1997. The effects of fluctuating food
availability on breeding Arctic Terns (Sterna paradisaea ). Auk
114: 524– 530.
Tollan, A.M. 1988. Maintenance energy requirements and
energy assimilation efficiency of the Australian Harrier. Ardea
76: 181– 186.
van Eerden, M.R. & Voslamber, B. 1995. Mass fishing by Cor-
morants Phalacrocorax carbo sinensis at lake IJsselmeer,
The Netherlands: a recent and successful adaptation to a
turbid environment. Ardea 83: 199– 212.
Veen, J. 1977. Functional and Causal Aspects of Nest Distribu-
tion in Colonies of the Sandwich Tern (Sterna S . sandvicen- sis Lath . ). Leiden: Brill.
van der Veer, H.W. 1998. Fish on tidal flats. In Wolff, W.J. (ed.)
Waders in Guinea-Bissau, October 1992–May 1993 . The end
of the East-Atlantic Flyway : 57–59. Zeist: WIWO-report 39.
Wright, P.J. 1996. Is there a conflict between sandeel fisheries
and seabirds? A case study at Shetland. In Greenstreet,
S.P.R. & Tasker, M. (eds) Aquatic Predators and Their Prey :
154–165. Oxford: Blackwell Scientific Publications.
Received 10 December 1999;revision accepted 17 September 2001