Embed Size (px)
Citation preview

Water Quality variables 1999-200827 stations, monthly samples, 0-50m
Ecology’s New Modular WQC Index
1. Temperature2. Similarity in water masses (density)3. Energy required for vertical mixing4. Euphotic depth5. Water clarity6. Nitrate conc.7. Ammonia conc.8. Phosphate conc.9. Nitrate enrichment10. Ammonia enrichment11. Phosphate enrichment12. N:P13. Si:N14. Oxygen15. Fecal coliform bacteria16. Chlorophyll a
Greater Puget Sound Region
Christopher Krembs, J. Bos, S. Albertson, M. Jones, M. Keyzers, S. Hoffer, B. Sackmann, C. Maloy
Climatic and oceanographic drivers in the Northwest
Time
-1.5
-1
-0.5
0
0.5
1
1.5
-30
-20
-10
0
10
20
30
1999 2000 2001 2002 2003 2004 2005 2006 2007 2008
An
nu
al P
DO
An
nu
al P
FEL
Ind
ex
An
om
alie
s
PFEL changes significantly with time

Variability of nitrogen and temperature between 1999-2008(example of 2 out of 16 variables)
Nitrate concentration 0-50 m
Time
Thermal Energy Content 0-50 m
Time
Stations from North
to South
Stations from North
to South
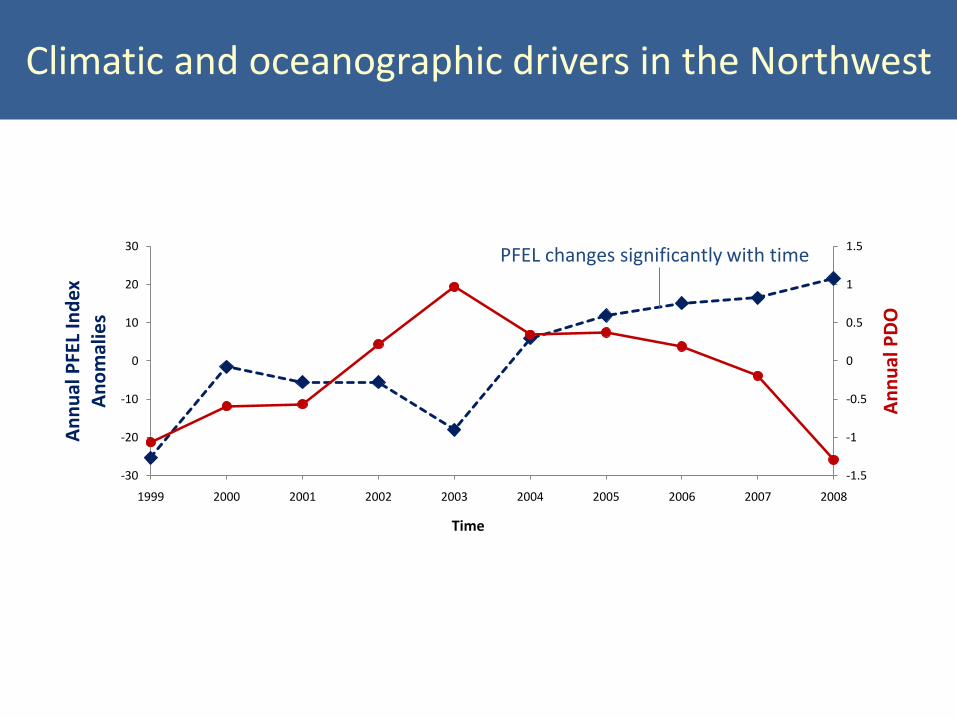
Variables consistently correlating with TIME, PDO, PFEL (Spearman rank correl. p>0.05; more than 50% of stations)
PDO Percent of stations in PS (n=16)
Thermal Energy 100
PFEL (Anomalies)
Percent of stations (n=16)
- -
Time Percent of stations in Puget Sound (n=16)
Silicate : Dissolved Inorganic Nitrogen 100
Nitrate 100
Transparency 94
Phosphate 94
Nitrogen : Phosphate 69
Energy for vert. mixing 63
Phosphate Enrichment 56

Motivations for a modular marine WQ index
1. Place observed trends into a larger climatic and oceanographic context (PDO, PFEL).
2. Strengthen index as communication tool: a) vetted mathematical formulation b) transparent underlying scientific concepts c) a comprehensive statistical framework
3. Maintain a numerical separation of water quality status and rate of change (combination visually)

Significant change in water quality in Puget Sound (1999-2008)
Water Quality Status Significant Change

The statistical based Canadian National WQ Index (CCME)
Advantage:
1. CCME formulation has undergone review, publication and detailed sensitivity analysis
2. It has been implemented in Canada and West Coast (e.g. San Francisco Bay)
3. The CCME has a progressive mathematical formulation suitable for statistical extensions
3D Objective exceedance space:
1. Amplitude (how much)2. Frequency (how often)3. Scope (how many)
Sco
pe

The CCME index is a product of 3 exceedances
-10
-5
0
5
10
Frequency=3
Amplitude=4.3
Scope=2:3
-10
-5
0
5
10
-10
-5
0
5
10
-10
-5
0
5
10
Reporting interval
Avg. exceedance= 4.3
Reporting interval
-10
-5
0
5
10
Reporting interval
Indicator 1
Indicator 2
Indicator 3
Objective
Objective

Selection of marine water quality objectives
A. We use our 10-year data record from each individual station and formulated a station-specific statistical objective.
B. This allows us to measure the change in water quality relative to individual station histories.

Four modules give insight into the underlying drivers of eutrophication
Impact onPhytoplankton
Enrichment(Tracer salt)
AmbientNutrients
Four progressive steps to eutrophication
Oxygen Availability
Natural Ventilation
Do natural conditions affect the situation?
Mixing energyDensity structureThermal energyOxygen content
Enrichment NO3
Enrichment PO4
Enrichment NH4
Water clarity
NitratePhosphateRatio NO3: DINFecal C.
Ratio DIN:PO4
Chl a conc.Ratio SI(OH)4:DINEuphotic depth
Are there too much?
Does it change the system?
Is there stress (hypoxia)?
Is it our problem?
4 variables aggregated into 4 modules using CCME formulation
1 2 3 4
1.2.3.4.
Mo
du
le:
Co
nce
pts
:

Significant correlation of the Ventilation module with the PDO, (Spearman Rank Corr. Coeff., p-value <0.05)
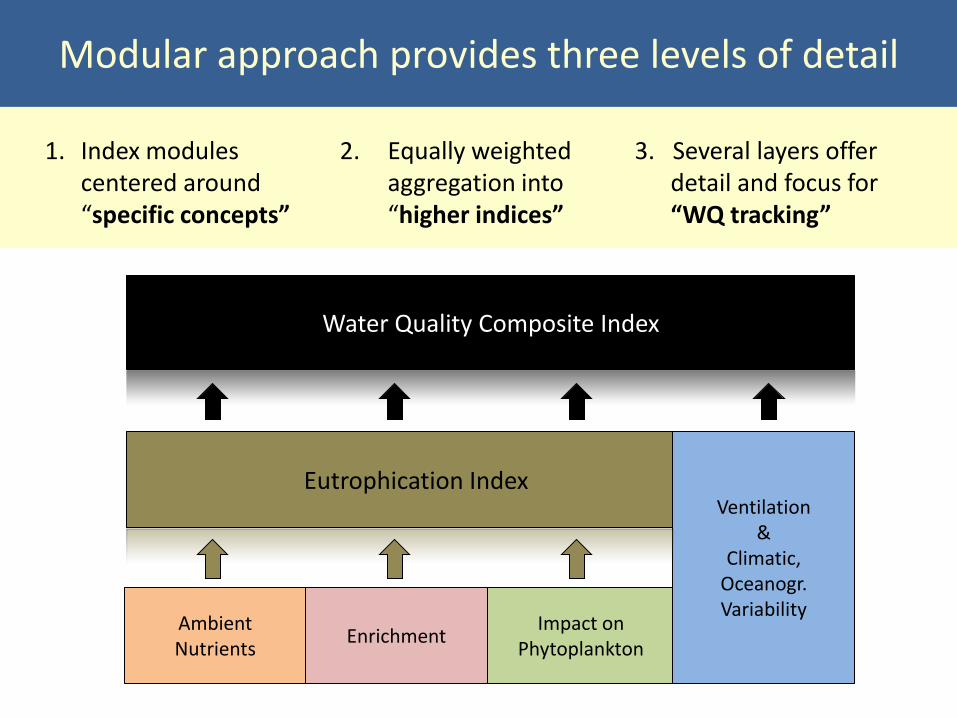
Modular Approach to the WQCI (0-50m)Modular approach provides three levels of detail
Water Quality Composite Index
Impact onPhytoplankton
Ventilation&
Climatic, Oceanogr. Variability
EnrichmentAmbientNutrients
Eutrophication Index
1. Index modules centered around “specific concepts”
2. Equally weighted aggregation into “higher indices”
3. Several layers offer detail and focus for “WQ tracking”

3. Evaluation of climatic and oceanographic influences “provide context”
Modular Approach to the WQCI (0-50m)Three levels of statistical evaluation guide the index
1. Evaluation of temporal trends“provide certainty”
2. Canadian mathematical index formulation provides “statistical approach”
Evaluation of
Temporal Trends
Evaluation of Climatic
& Oceanogr. influences
Water Quality Composite Index
Impact onPhytoplankton
Ventilation&
Climatic, Oceanogr. VariabilityEnrichment
AmbientNutrients
Eutrophication Index
Canadian index formulation accounts for Frequency, Amplitude and Scope

Evaluation of
Temporal Trends
Evaluation of Climatic
& Oceanogr. influences
Water Quality Composite Index
Impact onPhytoplankton
Ventilation&
Climatic, Oceanogr. VariabilityEnrichment
AmbientNutrients
Eutrophication Index
Canadian index formulation accounts for Frequency, Amplitude and Scope
Modular Approach to the WQCI (0-50m)Highest Reporting Level:
Avg. WQ Status 1999-2008
Change in Water Quality
Three pieces of information are graphically combined
Significant Drivers & Trends
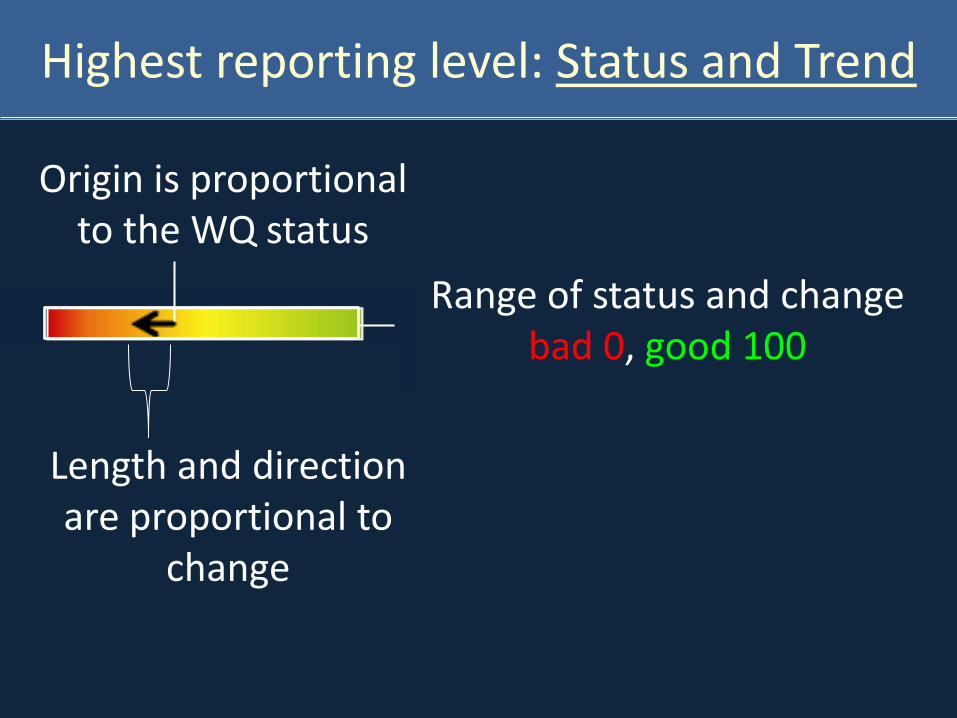
Highest reporting level: Status and Trend
Origin is proportional to the WQ status
Length and direction are proportional to
change
Range of status and change bad 0, good 100

Highest reporting level: Statistical Significance
Eutrophication Index
WQ Composite Index
EnrichmentAmbient
Nutrients
Impact on
Phytoplankton
Ventilation
&
Climatic and
Oceanic
Indices
Arrows ( ) indicate significance and direction of trend (- not significant)

Examples: Degrading regions:

Level 1: Graphical realization A
mb
ien
t N
utr
ien
ts
Enri
chm
en
t
Ph
yto
pla
nkt
on
Imp
act
Level 1

Level 2: Graphical realizationA
mb
ien
t N
utr
ien
ts
Enri
chm
en
t
Ph
yto
pla
nkt
on
Imp
act
Level 1
Level 2

Level 3: Graphical realizationA
mb
ien
t N
utr
ien
ts
Enri
chm
en
t
Ph
yto
pla
nkt
on
Imp
act
Level 1
Level 2
Level 3

Summary
1. Modular approach of index communicates the patterns and trends of the underlying data, and offers several layers of focus.
2. The statistical framework of the index provides certainties in communicating trends in WQ.
3. Nutrient conditions significantly degraded along the urban corridor of Puget Sound.