Embed Size (px)
Citation preview
S1
EcoMnOx, a Biosourced Catalyst for Selective Aerobic
Oxidative Cleavage of Activated 1,2-Diols
Vincent Escande,* Chun Ho Lam, Claude Grison, and Paul T. Anastas*
Supporting Information
Total pages: 12; total figures: 14; total tables: 2
General methods ................................................................................................................................................... S2
XPS analysis ......................................................................................................................................................... S3
Figure S1. XPS survey spectrum of EcoMnOx. ............................................................................................... S3
Figure S2. XPS spectrum of Mn3s. .................................................................................................................. S4
ICP-AES analyses ................................................................................................................................................. S5
Table S1. ICP-AES analysis of EcoMnOx catalysts prepared from different lots of Grevillea exul subsp.
rubiginosa. ........................................................................................................................................................ S5
Characterization of EcoMnOx after reaction ........................................................................................................ S6
Table S2. ICP-AES analysis of EcoMnOx (EcoMnOx batch #3) before and after oxidative cleavage of meso-
hydrobenzoin. ................................................................................................................................................... S6
Figure S3. SEM images of EcoMnOx (EcoMnOx batch #3): a), b) before oxidative cleavage of meso-
hydrobenzoin and c), d) after oxidative cleavage of meso-hydrobenzoin. ........................................................ S6
Figure S4. EDX spectra of EcoMnOx (EcoMnOx batch #3): a) before oxidative cleavage of meso-
hydrobenzoin and b) after oxidative cleavage of meso-hydrobenzoin. ............................................................. S7
GC chromatograms ............................................................................................................................................... S8
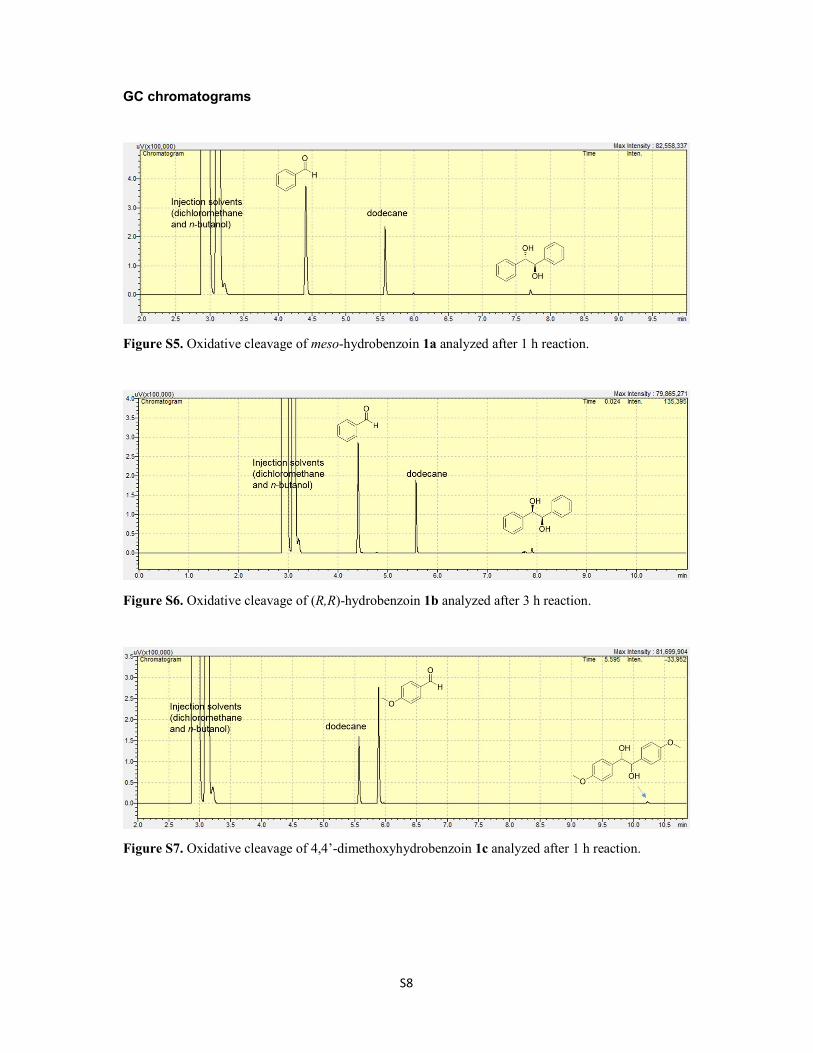
Figure S5. Oxidative cleavage of meso-hydrobenzoin 1a analyzed after 1 h reaction. .................................... S8
Figure S6. Oxidative cleavage of (R,R)-hydrobenzoin 1b analyzed after 3 h reaction. .................................... S8
Figure S7. Oxidative cleavage of 4,4’-dimethoxyhydrobenzoin 1c analyzed after 1 h reaction. ..................... S8
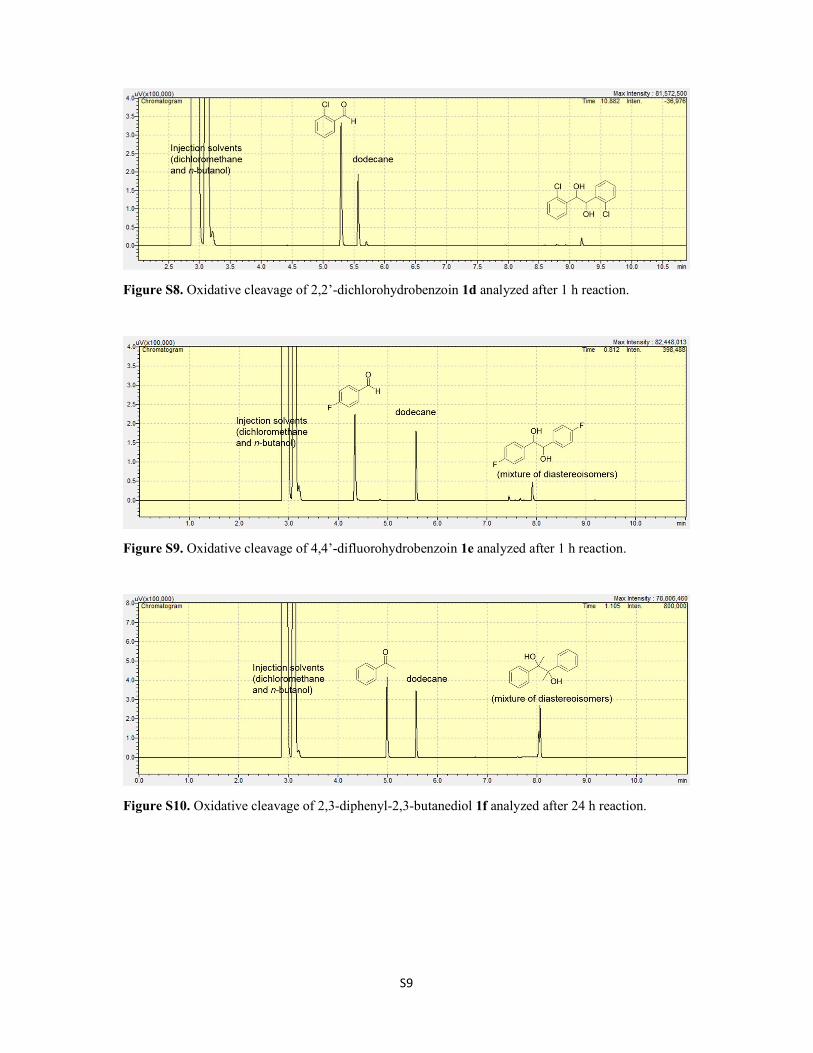
Figure S8. Oxidative cleavage of 2,2’-dichlorohydrobenzoin 1d analyzed after 1 h reaction. ......................... S9
Figure S9. Oxidative cleavage of 4,4’-difluorohydrobenzoin 1e analyzed after 1 h reaction. .......................... S9
Figure S10. Oxidative cleavage of 2,3-diphenyl-2,3-butanediol 1f analyzed after 24 h reaction. .................... S9
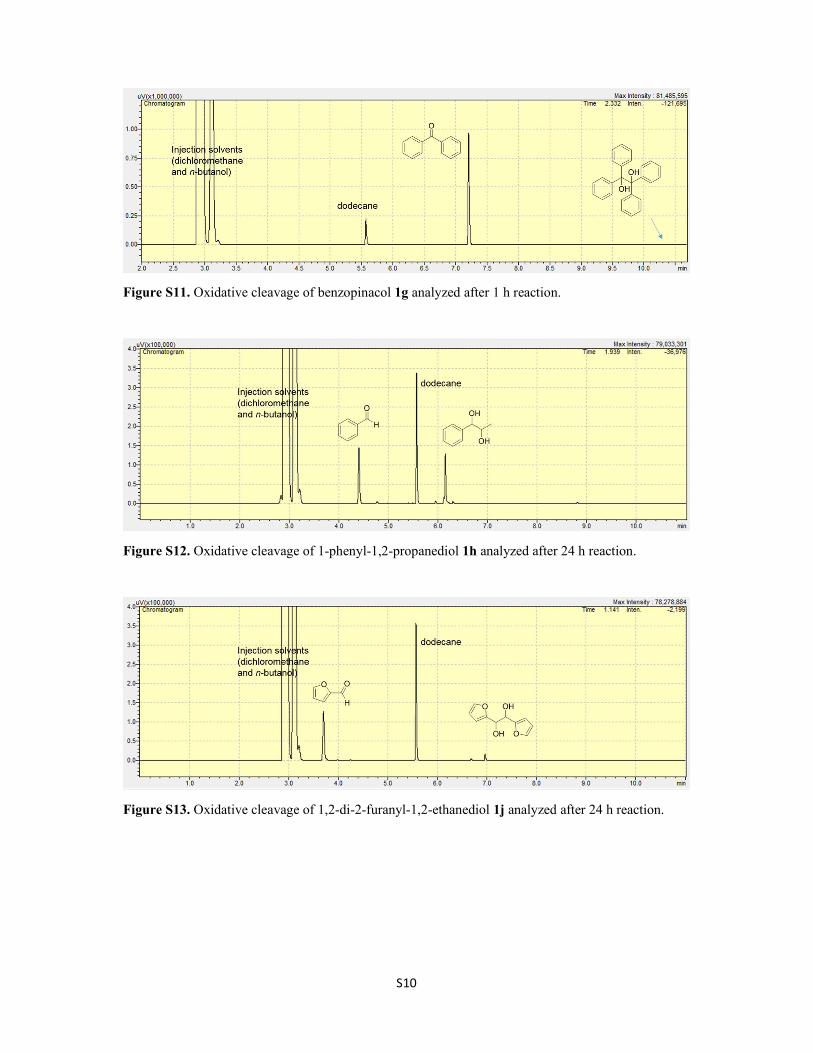
Figure S11. Oxidative cleavage of benzopinacol 1g analyzed after 1 h reaction. .......................................... S10
Figure S12. Oxidative cleavage of 1-phenyl-1,2-propanediol 1h analyzed after 24 h reaction. ..................... S10
Figure S13. Oxidative cleavage of 1,2-di-2-furanyl-1,2-ethanediol 1j analyzed after 24 h reaction. ............. S10
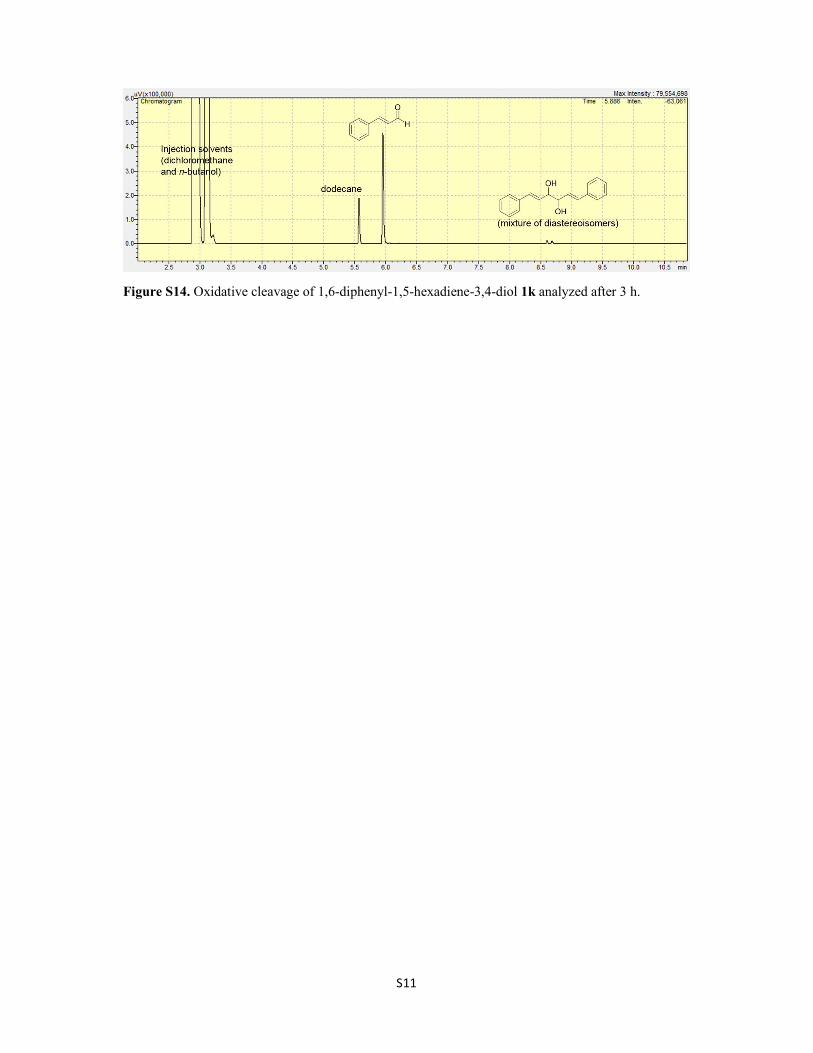
Figure S14. Oxidative cleavage of 1,6-diphenyl-1,5-hexadiene-3,4-diol 1k analyzed after 3 h. .................... S11
E-factor calculations ........................................................................................................................................... S12
Procedure for EcoMnOx-catalyzed meso-hydrobenzoin oxidative cleavage .................................................. S12
Calculations .................................................................................................................................................... S12
References ........................................................................................................................................................... S12
S2
General methods
All common reagents and solvents were obtained from Sigma-Aldrich and Fisher Scientific, and were
used without any further purification. Non-commercially available 1,2-diols were prepared by
reduction of corresponding commercial diketones according to a known procedure.1 Products were
characterized by 1H/13C NMR spectroscopy and by GC, by comparison of their retention times with
those of pure standards, and analytical data were in accordance with those previously published. NMR
characterization was performed with an Agilent DD2 400 MHz NMR spectrometer. GC were recorded
on a Shimadzu GC-2010 Plus, equipped with an Agilent J&W GC column, DB-5, 60 m x 0.25 mm x
0.25 µm, using He as carrier gas, with a flame ionization detector (FID). All analyses were performed
including dodecane as internal standard. FTIR spectra were recorded on a FTIR/Raman Thermo
Nicolet 6700 spectrometer, in ATR mode. ICP-AES measurements were performed using the Perkin
Elmer Optima 3000. Samples of 10 mg were digested and dissolved in 2% HNO3 acid, and were
quantified against external standards. SEM analyses were performed using the Hitachi SU-70 field
emission microscope. Samples were pre-dried in vacuum overnight, and were examined with a 10kV
bean power under ultra-high vacuum without surface treatment. Energy-dispersive X-ray spectroscopy
analysis (EDX) was performed using a Zeiss EVO HD15 microscope coupled with an Oxford X-
MaxN EDX detector. XRPD measurements were performed on a Rigaku SmartLab X-ray
Diffractometer equipped with a Cu line-focus sealed tube and a NaI SC70 scintillation detector.
Measurements were made with a 40 kV, 44 mA beam, with an incident slit of 2/3 deg and a length
limiting slit of 5.00 mm, in the range 2θ from 10° to 90° locked couple scan type, a step size of 0.05o
and a scan speed of 10.33 deg/min. XPS analysis was performed using a ThermoScientific ESCALAB
250 instrument. Spectra were collected using a monochromatic Al X-ray source. A low energy
electron flood and top-side contact were used for charge neutralization. Survey spectra were collected
using a pass energy of 150 eV. Multiplex composition scans were acquired with 20 eV pass energy.
All dynamic light scattering (DLS) samples were suspended in methanol (1 mg/3 mL) and were
sonicated for 5 minutes prior analysis. DLS was performed at an angle of 90 degrees (ALV-5000,
ALV-GmbH) using an incident laser of wavelength 532 nm (coherent). 30 runs were recorded per
sample, with a duration of 30 seconds per run. All DLS measurements were carried out at room
temperature.
S3
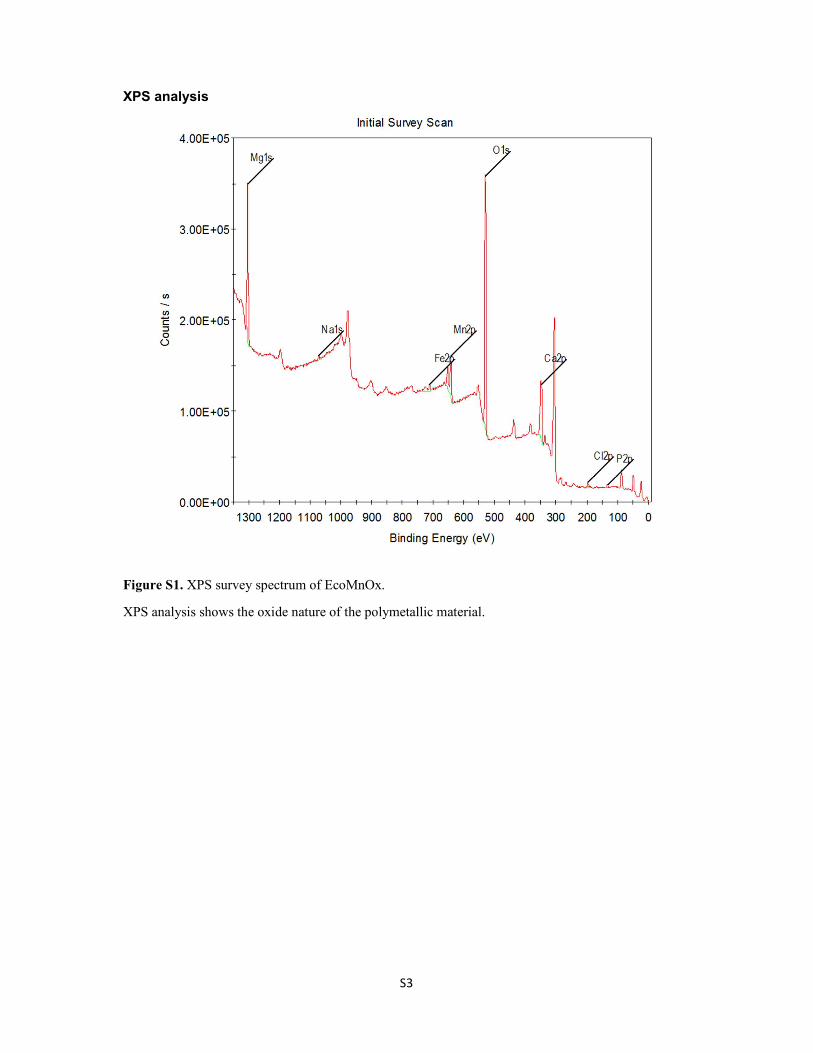
XPS analysis
Figure S1. XPS survey spectrum of EcoMnOx.
XPS analysis shows the oxide nature of the polymetallic material.
S4
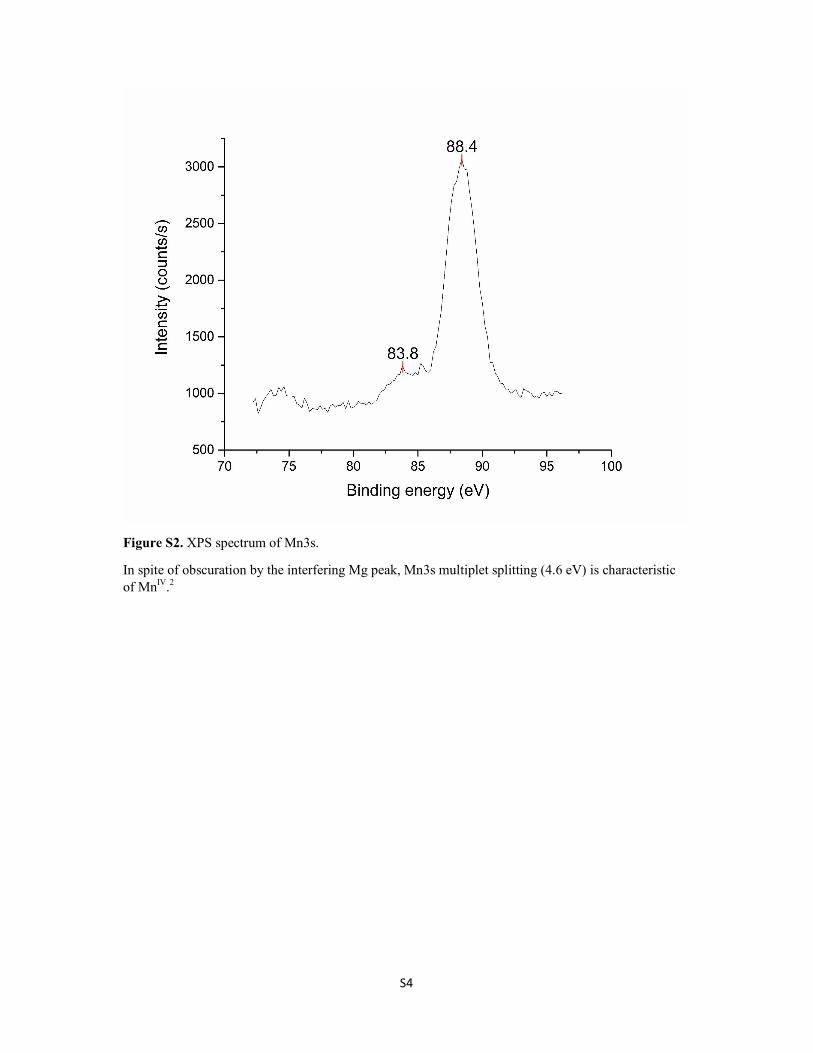
Figure S2. XPS spectrum of Mn3s.
In spite of obscuration by the interfering Mg peak, Mn3s multiplet splitting (4.6 eV) is characteristic
of MnIV
.2
S5
ICP-AES analyses
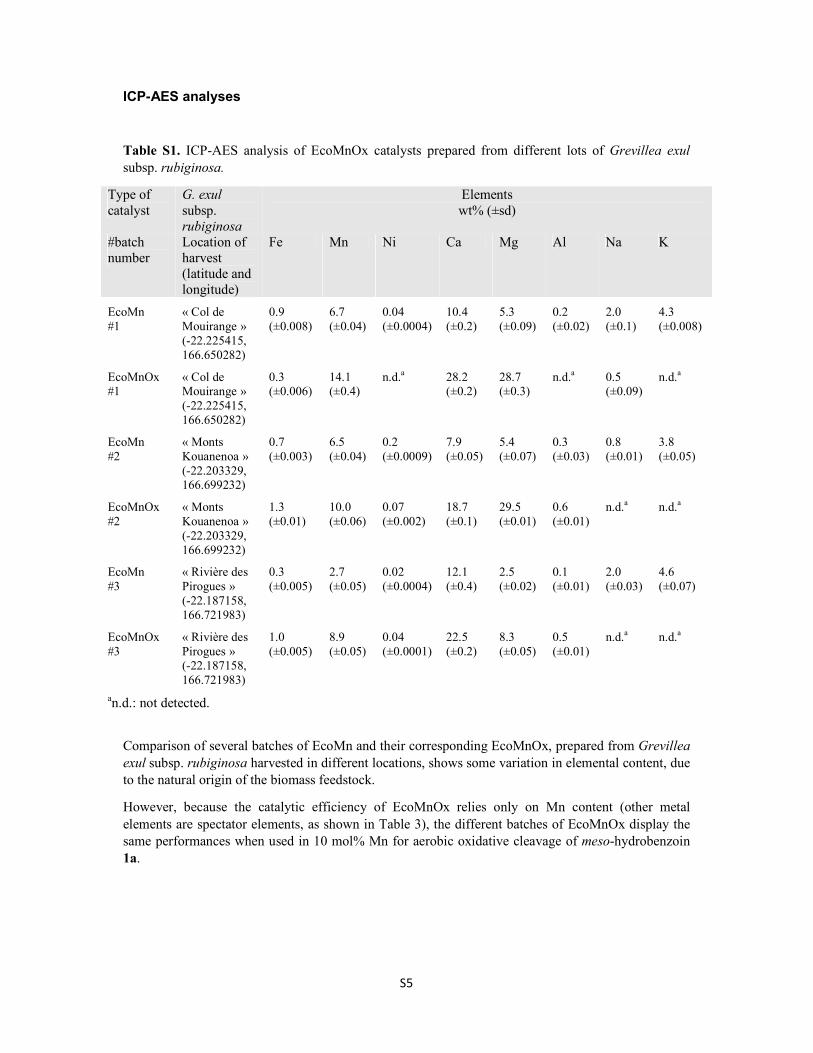
Table S1. ICP-AES analysis of EcoMnOx catalysts prepared from different lots of Grevillea exul
subsp. rubiginosa.
Type of
catalyst
G. exul
subsp.
rubiginosa
Elements
wt% (±sd)
#batch
number
Location of
harvest
(latitude and
longitude)
Fe Mn Ni Ca Mg Al Na K
EcoMn
#1
« Col de
Mouirange »
(-22.225415,
166.650282)
0.9
(±0.008)
6.7
(±0.04)
0.04
(±0.0004)
10.4
(±0.2)
5.3
(±0.09)
0.2
(±0.02)
2.0
(±0.1)
4.3
(±0.008)
EcoMnOx
#1
« Col de
Mouirange »
(-22.225415,
166.650282)
0.3
(±0.006)
14.1
(±0.4)
n.d.a
28.2
(±0.2)
28.7
(±0.3)
n.d.a
0.5
(±0.09)
n.d.a
EcoMn
#2
« Monts
Kouanenoa »
(-22.203329,
166.699232)
0.7
(±0.003)
6.5
(±0.04)
0.2
(±0.0009)
7.9
(±0.05)
5.4
(±0.07)
0.3
(±0.03)
0.8
(±0.01)
3.8
(±0.05)
EcoMnOx
#2
« Monts
Kouanenoa »
(-22.203329,
166.699232)
1.3
(±0.01)
10.0
(±0.06)
0.07
(±0.002)
18.7
(±0.1)
29.5
(±0.01)
0.6
(±0.01)
n.d.a n.d.
a
EcoMn
#3
« Rivière des
Pirogues »
(-22.187158,
166.721983)
0.3
(±0.005)
2.7
(±0.05)
0.02
(±0.0004)
12.1
(±0.4)
2.5
(±0.02)
0.1
(±0.01)
2.0
(±0.03)
4.6
(±0.07)
EcoMnOx
#3
« Rivière des
Pirogues »
(-22.187158,
166.721983)
1.0
(±0.005)
8.9
(±0.05)
0.04
(±0.0001)
22.5
(±0.2)
8.3
(±0.05)
0.5
(±0.01)
n.d.a n.d.
a
an.d.: not detected.
Comparison of several batches of EcoMn and their corresponding EcoMnOx, prepared from Grevillea
exul subsp. rubiginosa harvested in different locations, shows some variation in elemental content, due
to the natural origin of the biomass feedstock.
However, because the catalytic efficiency of EcoMnOx relies only on Mn content (other metal
elements are spectator elements, as shown in Table 3), the different batches of EcoMnOx display the
same performances when used in 10 mol% Mn for aerobic oxidative cleavage of meso-hydrobenzoin
1a.
S6
Characterization of EcoMnOx after reaction
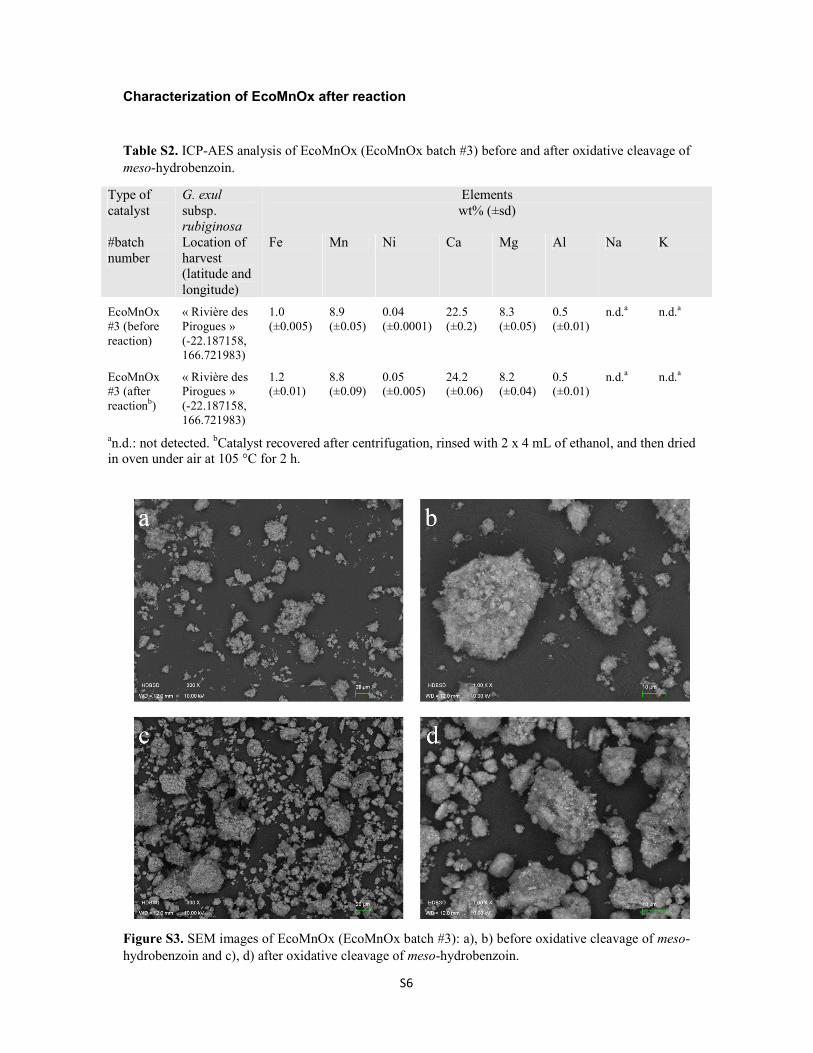
Table S2. ICP-AES analysis of EcoMnOx (EcoMnOx batch #3) before and after oxidative cleavage of
meso-hydrobenzoin.
Type of
catalyst
G. exul
subsp. rubiginosa
Elements
wt% (±sd)
#batch
number
Location of
harvest (latitude and
longitude)
Fe Mn Ni Ca Mg Al Na K
EcoMnOx
#3 (before
reaction)
« Rivière des
Pirogues »
(-22.187158,
166.721983)
1.0
(±0.005)
8.9
(±0.05)
0.04
(±0.0001)
22.5
(±0.2)
8.3
(±0.05)
0.5
(±0.01)
n.d.a n.d.a
EcoMnOx
#3 (after
reactionb)
« Rivière des
Pirogues »
(-22.187158,
166.721983)
1.2
(±0.01)
8.8
(±0.09)
0.05
(±0.005)
24.2
(±0.06)
8.2
(±0.04)
0.5
(±0.01)
n.d.a n.d.
a
an.d.: not detected.
bCatalyst recovered after centrifugation, rinsed with 2 x 4 mL of ethanol, and then dried
in oven under air at 105 °C for 2 h.
Figure S3. SEM images of EcoMnOx (EcoMnOx batch #3): a), b) before oxidative cleavage of meso-
hydrobenzoin and c), d) after oxidative cleavage of meso-hydrobenzoin.
S7
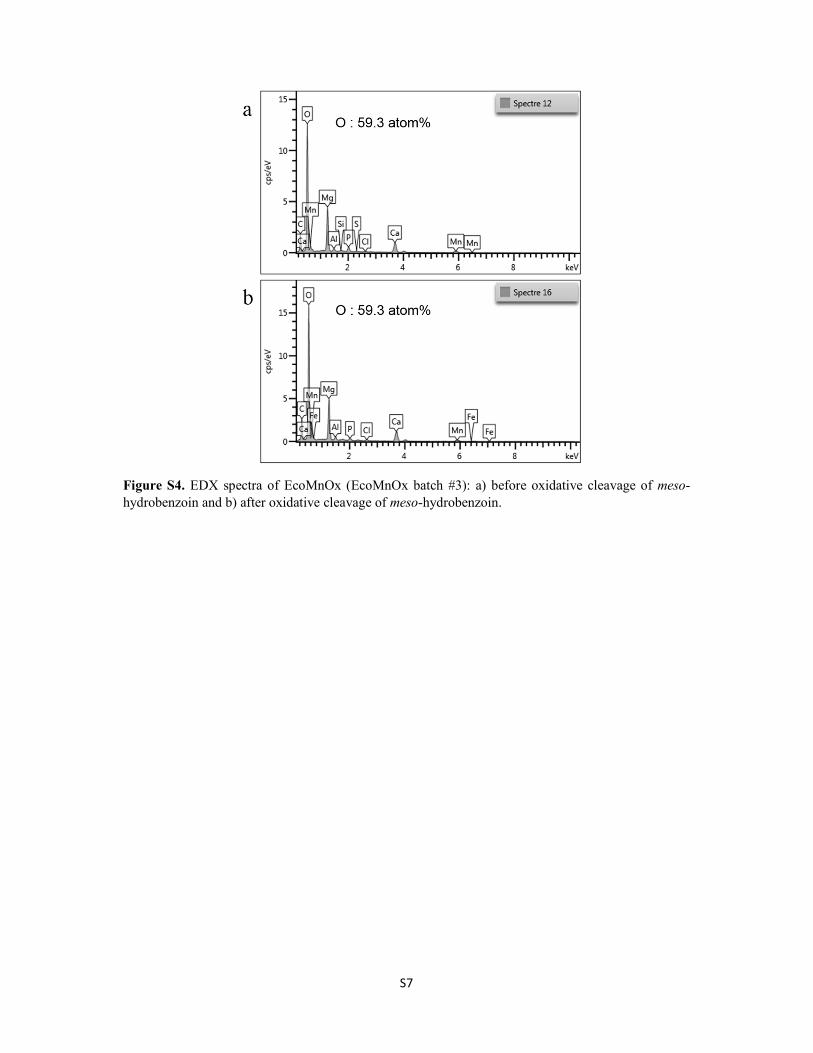
Figure S4. EDX spectra of EcoMnOx (EcoMnOx batch #3): a) before oxidative cleavage of meso-
hydrobenzoin and b) after oxidative cleavage of meso-hydrobenzoin.
S8
GC chromatograms
Figure S5. Oxidative cleavage of meso-hydrobenzoin 1a analyzed after 1 h reaction.
Figure S6. Oxidative cleavage of (R,R)-hydrobenzoin 1b analyzed after 3 h reaction.
Figure S7. Oxidative cleavage of 4,4’-dimethoxyhydrobenzoin 1c analyzed after 1 h reaction.
S9
Figure S8. Oxidative cleavage of 2,2’-dichlorohydrobenzoin 1d analyzed after 1 h reaction.
Figure S9. Oxidative cleavage of 4,4’-difluorohydrobenzoin 1e analyzed after 1 h reaction.
Figure S10. Oxidative cleavage of 2,3-diphenyl-2,3-butanediol 1f analyzed after 24 h reaction.
S10
Figure S11. Oxidative cleavage of benzopinacol 1g analyzed after 1 h reaction.
Figure S12. Oxidative cleavage of 1-phenyl-1,2-propanediol 1h analyzed after 24 h reaction.
Figure S13. Oxidative cleavage of 1,2-di-2-furanyl-1,2-ethanediol 1j analyzed after 24 h reaction.
S11
Figure S14. Oxidative cleavage of 1,6-diphenyl-1,5-hexadiene-3,4-diol 1k analyzed after 3 h.
S12
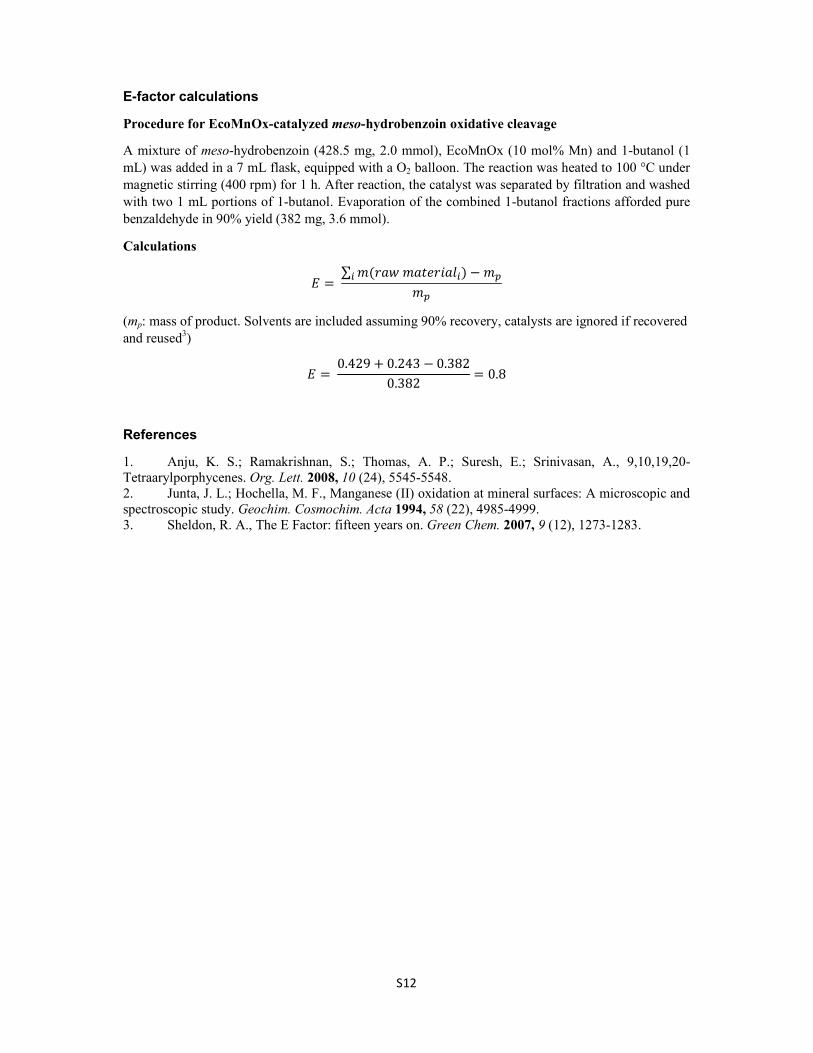
E-factor calculations
Procedure for EcoMnOx-catalyzed meso-hydrobenzoin oxidative cleavage
A mixture of meso-hydrobenzoin (428.5 mg, 2.0 mmol), EcoMnOx (10 mol% Mn) and 1-butanol (1
mL) was added in a 7 mL flask, equipped with a O2 balloon. The reaction was heated to 100 °C under
magnetic stirring (400 rpm) for 1 h. After reaction, the catalyst was separated by filtration and washed
with two 1 mL portions of 1-butanol. Evaporation of the combined 1-butanol fractions afforded pure
benzaldehyde in 90% yield (382 mg, 3.6 mmol).
Calculations
� =∑ �(�������� �) − ���
��
(mp: mass of product. Solvents are included assuming 90% recovery, catalysts are ignored if recovered
and reused3)
� =0.429 + 0.243 − 0.382
0.382= 0.8
References
1. Anju, K. S.; Ramakrishnan, S.; Thomas, A. P.; Suresh, E.; Srinivasan, A., 9,10,19,20-
Tetraarylporphycenes. Org. Lett. 2008, 10 (24), 5545-5548.
2. Junta, J. L.; Hochella, M. F., Manganese (II) oxidation at mineral surfaces: A microscopic and
spectroscopic study. Geochim. Cosmochim. Acta 1994, 58 (22), 4985-4999.
3. Sheldon, R. A., The E Factor: fifteen years on. Green Chem. 2007, 9 (12), 1273-1283.