Embed Size (px)
Citation preview
ECON 101 INTERMEDIATE MACROECONOMIC THEORY
Glynis Gawn
Spring 2015
Lecture: TTh 7.30-8.45am
Sections: W 11.30-2.20pm COB 263
Office Hours: TTh 9.00-11.00am, W9.30-11.00am or by appointment SSM 250B
What Is Macroeconomics? In this lecture, we begin by considering:
What macroeconomics is and some questions that macroeconomists study.
How macroeconomics uses models, and why.
The importance of time-scale – the short-run versus the long-run.
The difference between macro- and microeconomics:
Macroeconomics
studies collections of people and firms, and how their interactions through markets determine the overall economic activity in a country or region.
“the big picture” Microeconomics
focuses on the study of individual people, firms, or markets.
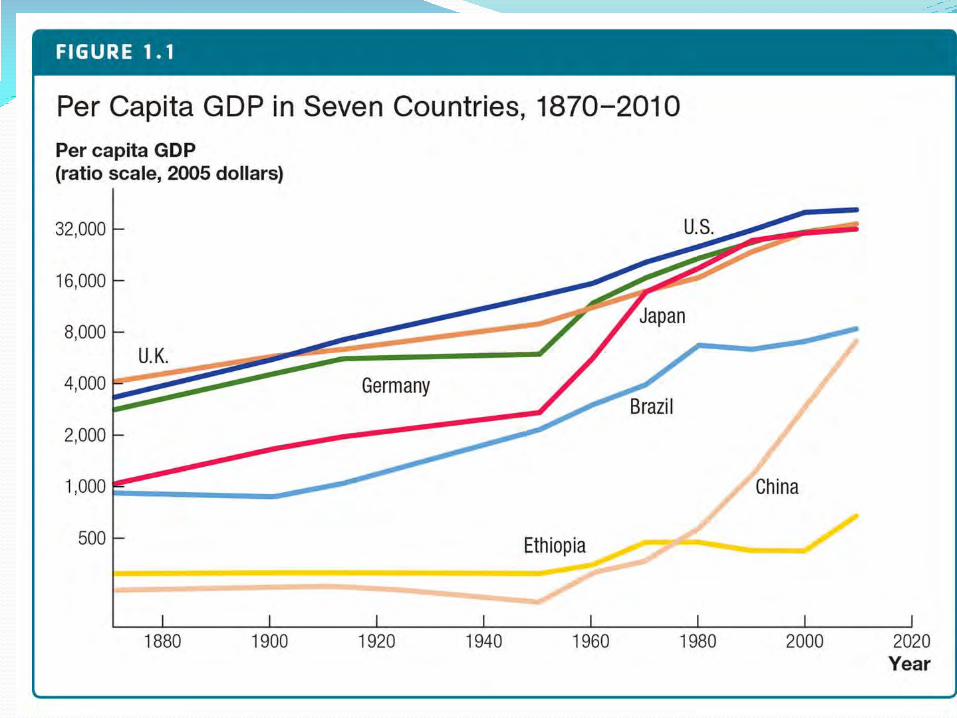
Important macroeconomic questions to consider: Why is today’s average American
more than 10 times richer than 100 years ago?
50 times richer than the average Ethiopian?
Do we know and understand the causes of the recent global financial crisis and Great Recession?
the European debt crisis and sluggish economic recovery of recent years?
-10
-5
0
5
10
15
20
198
0
198
1
198
2
198
3
198
4
198
5
198
6
198
7
198
8
198
9
199
0
199
1
199
2
199
3
199
4
199
5
199
6
199
7
199
8
199
9
200
0
200
1
200
2
200
3
200
4
200
5
200
6
200
7
200
8
200
9
2010
2011
An
nu
al
Gro
wth
Ra
te
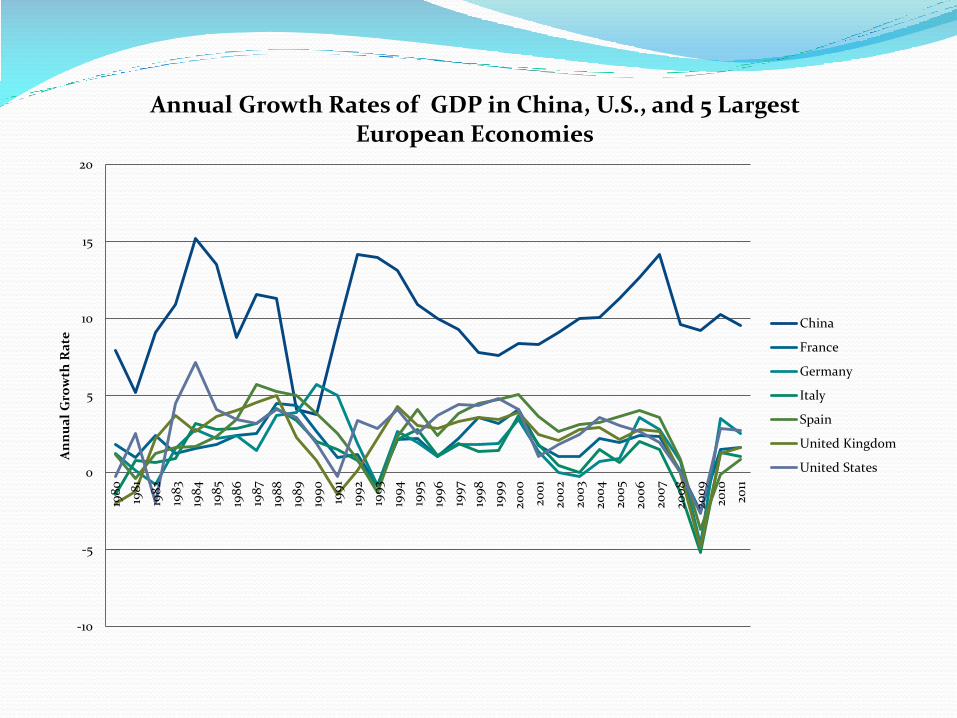
Annual Growth Rates of GDP in China, U.S., and 5 Largest European Economies
China
France
Germany
Italy
Spain
United Kingdom
United States
-4
-2
0
2
4
6
819
80
198
1
198
2
198
3
198
4
198
5
198
6
198
7
198
8
198
9
199
0
199
1
199
2
199
3
199
4
199
5
199
6
199
7
199
8
199
9
200
0
200
1
200
2
200
3
200
4
200
5
200
6
200
7
200
8
200
9
2010
2011
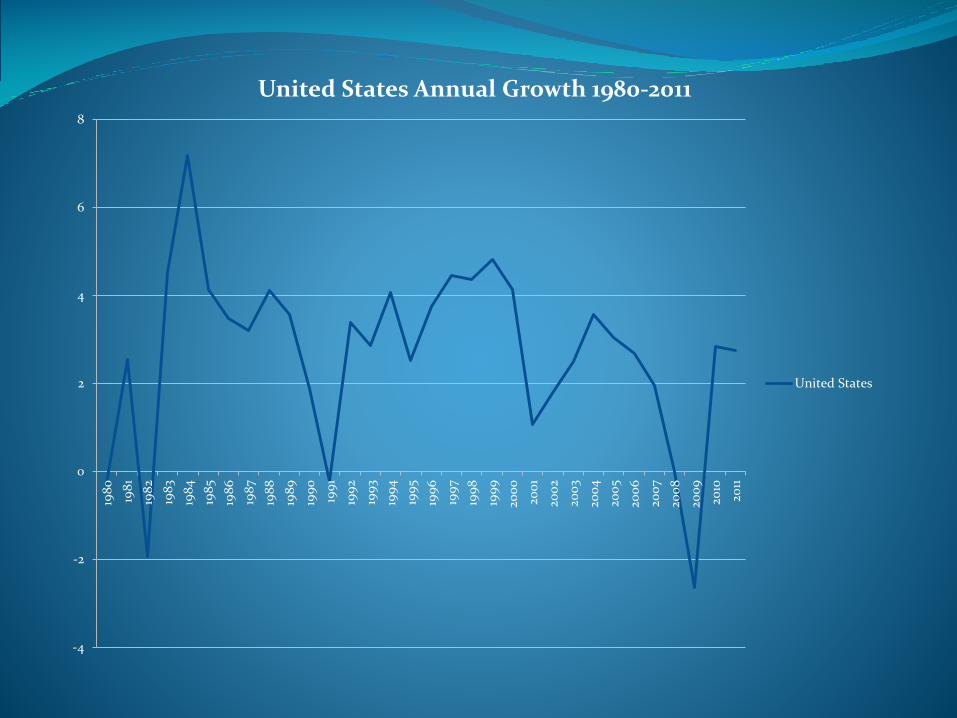
United States Annual Growth 1980-2011
United States
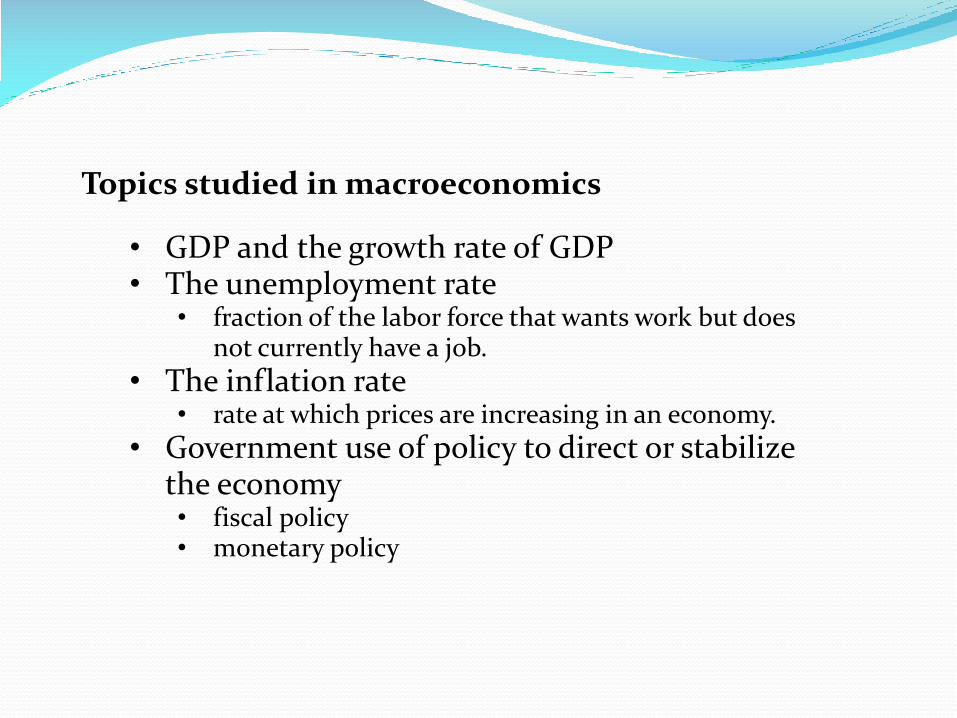
Topics studied in macroeconomics
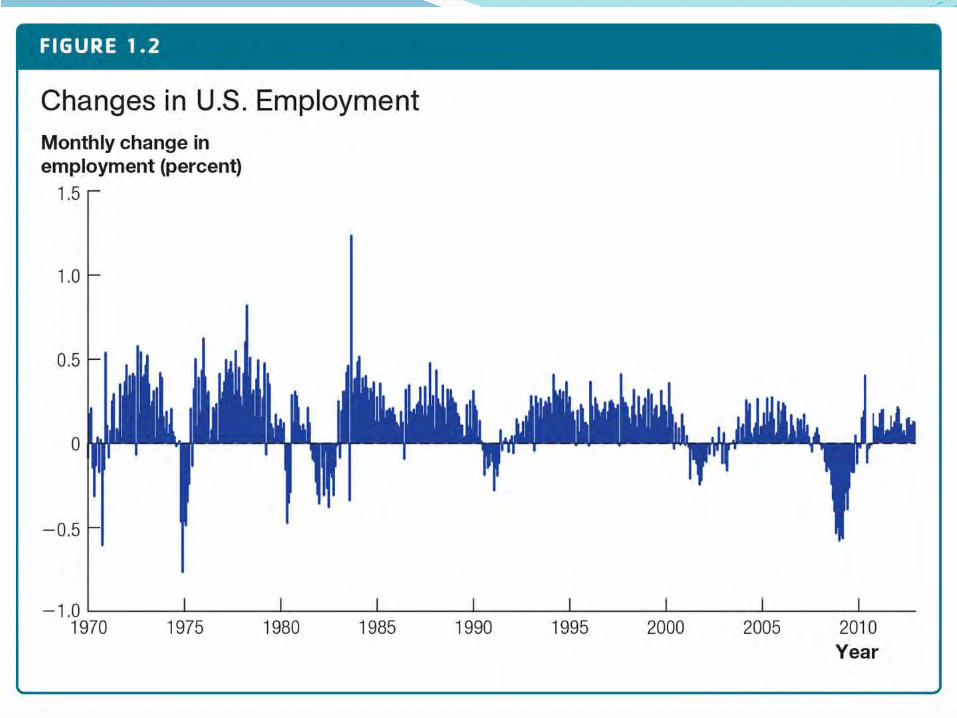
• GDP and the growth rate of GDP• The unemployment rate
• fraction of the labor force that wants work but does not currently have a job.
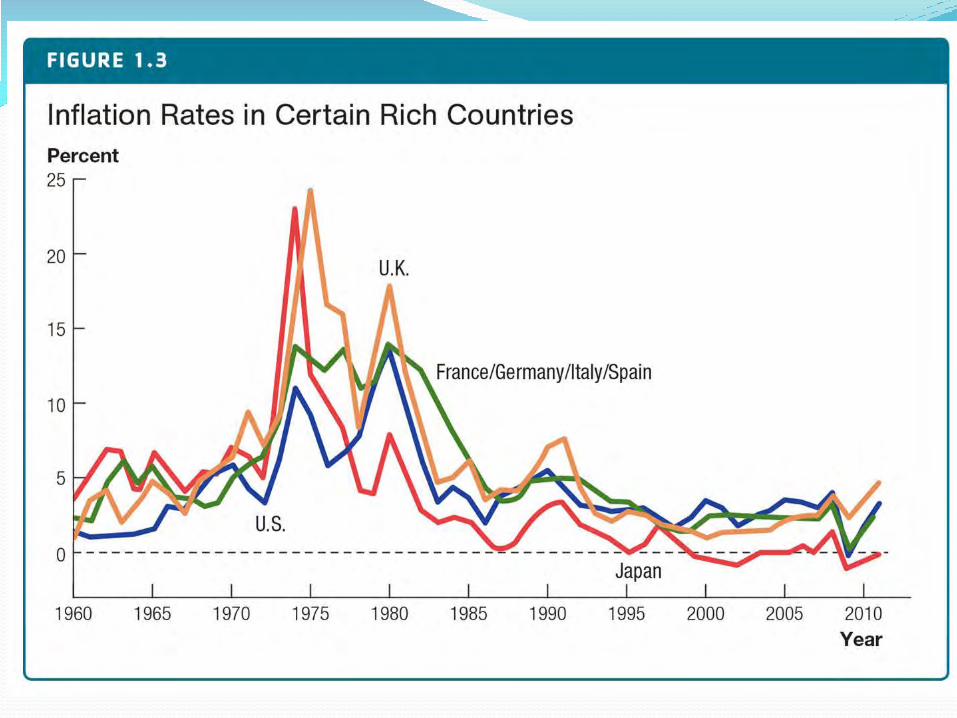
• The inflation rate• rate at which prices are increasing in an economy.
• Government use of policy to direct or stabilize the economy• fiscal policy• monetary policy
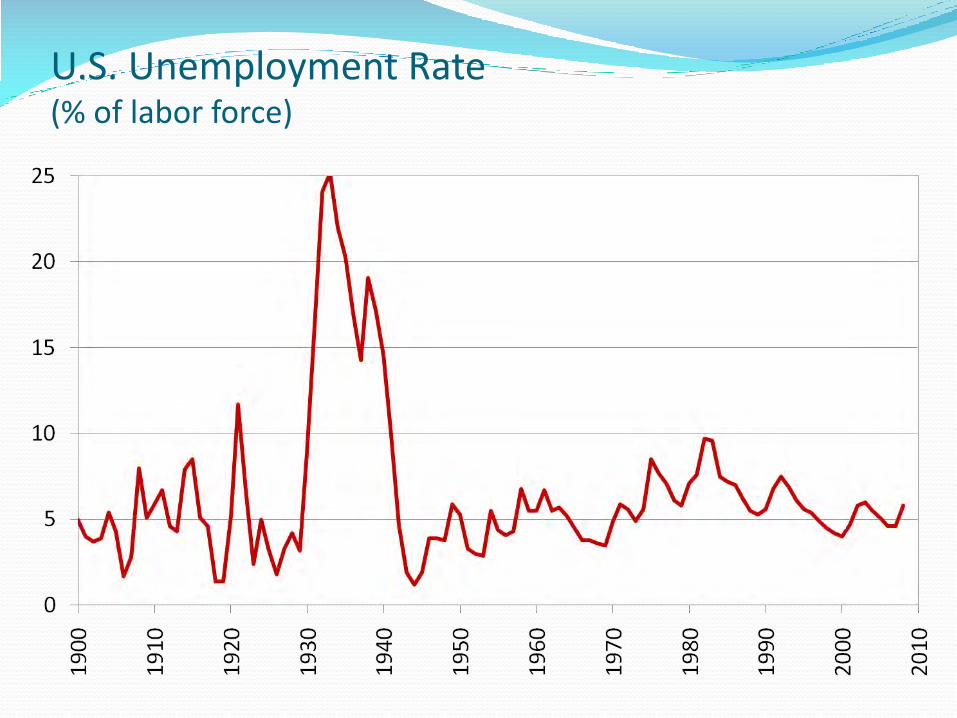
U.S. Unemployment Rate(% of labor force)
UNEMPLOYMENTEconomists care about unemployment for two reasons:
Because of its direct effects on the welfare of the unemployed.
Because it provides a signal that the economy may not be using some of its resources efficiently
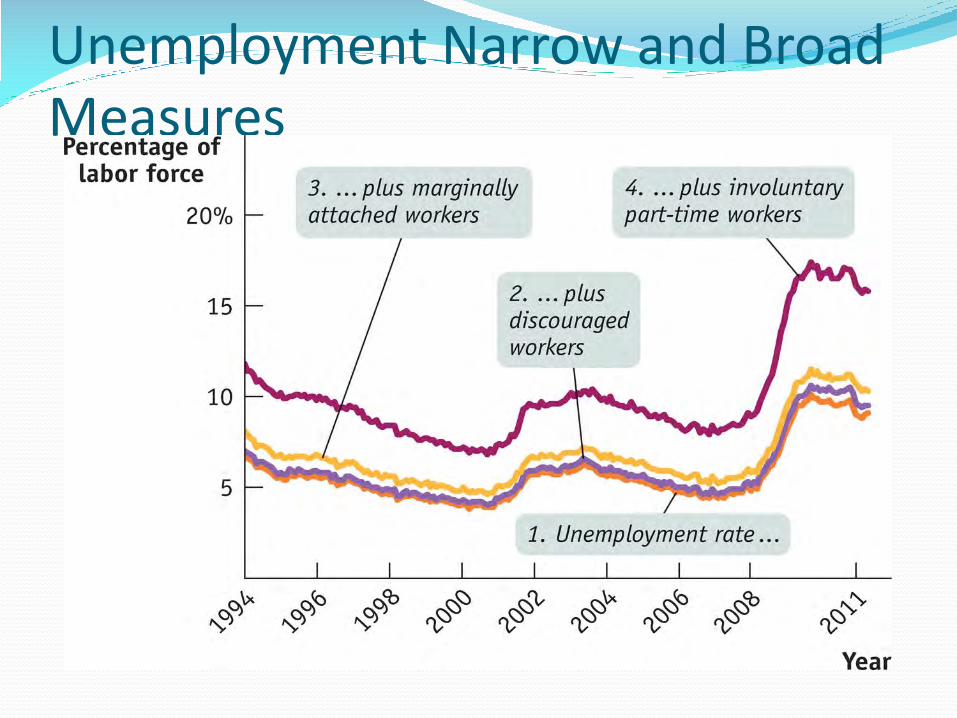
Unemployment Narrow and Broad Measures
Topics studied in macroeconomics (continued)
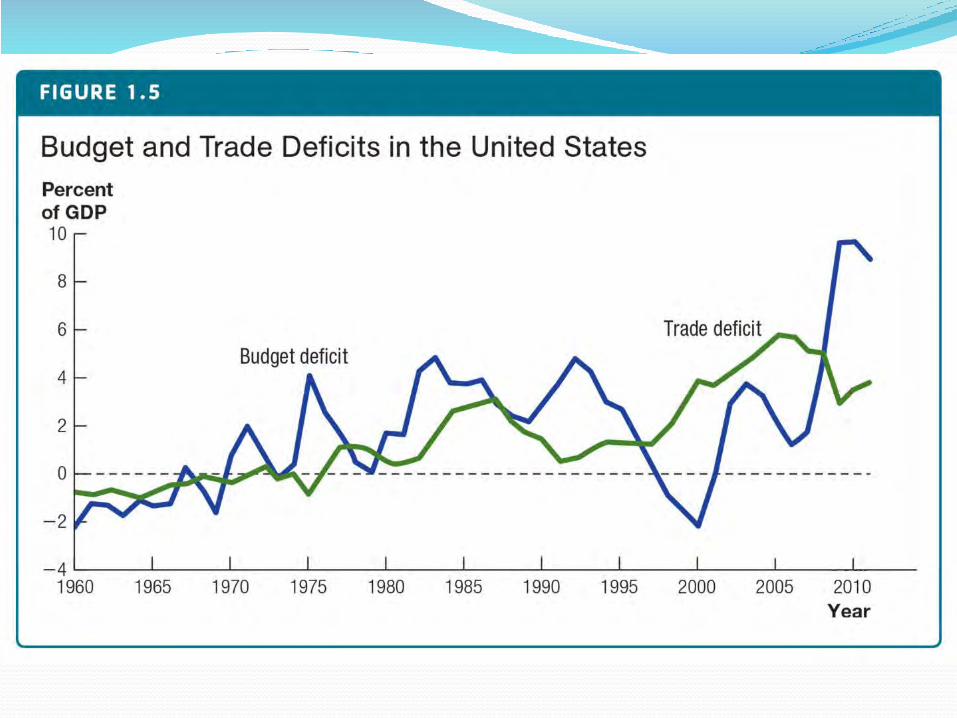
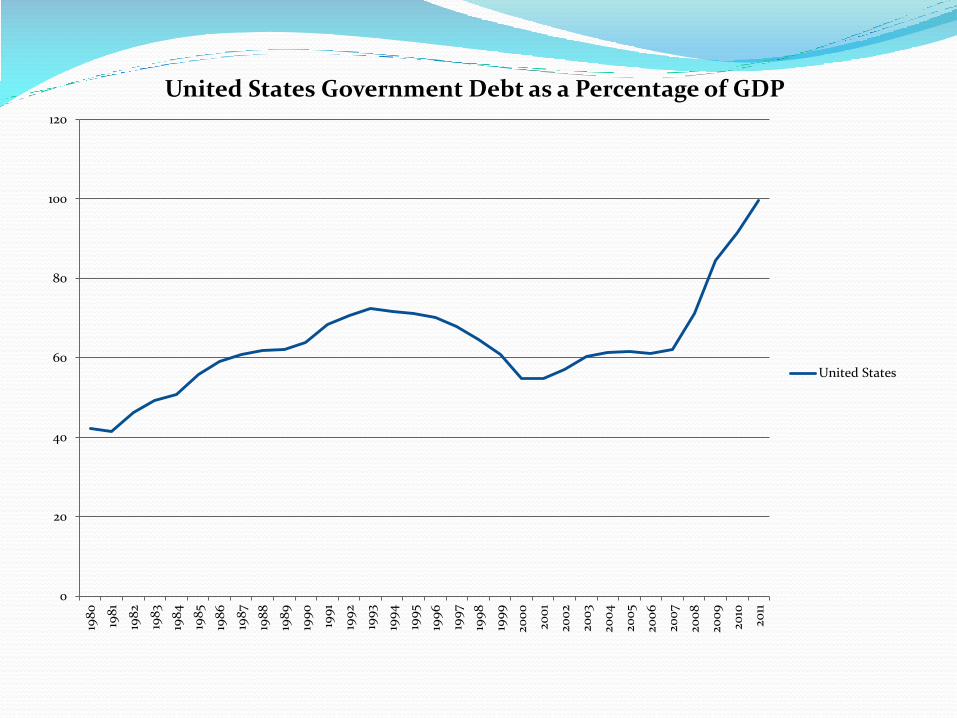
• Budget deficit and Government Debt• government borrows money to finance
spending.• occurs if (Government spending) > (Tax
revenues)
• Trade deficits• occur when one economy borrows from
another. This happens on an international level.
0
20
40
60
80
100
120
198
0
198
1
198
2
198
3
198
4
198
5
198
6
198
7
198
8
198
9
199
0
199
1
199
2
199
3
199
4
199
5
199
6
199
7
199
8
199
9
200
0
200
1
200
2
200
3
200
4
200
5
200
6
200
7
200
8
200
9
2010
2011
United States Government Debt as a Percentage of GDP
United States
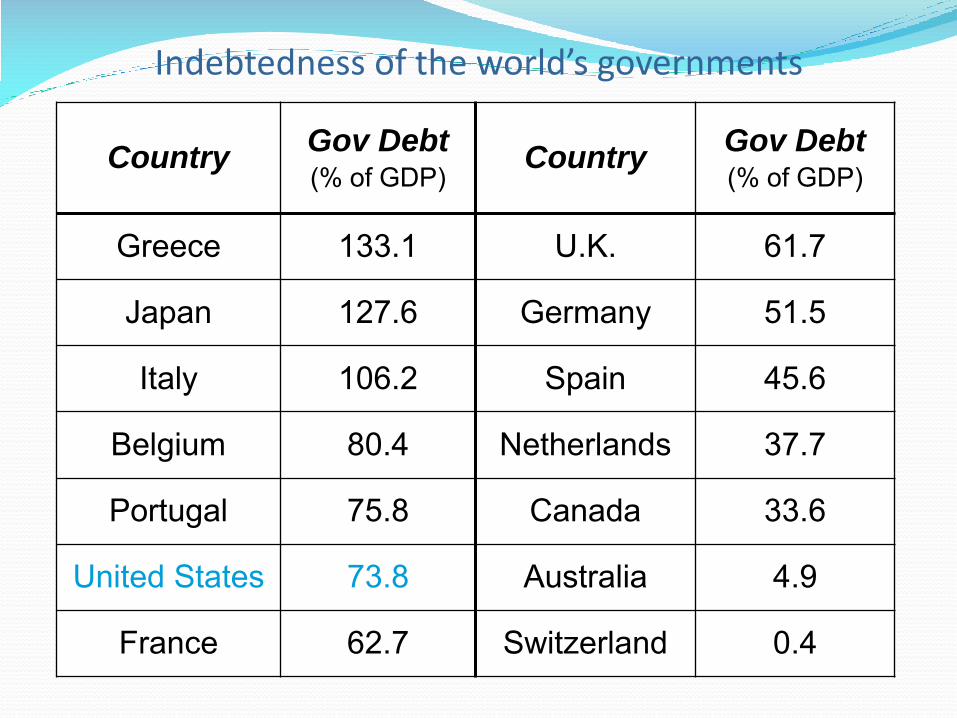
Indebtedness of the world’s governments
CountryGov Debt (% of GDP)
CountryGov Debt (% of GDP)
Greece 133.1 U.K. 61.7
Japan 127.6 Germany 51.5
Italy 106.2 Spain 45.6
Belgium 80.4 Netherlands 37.7
Portugal 75.8 Canada 33.6
United States 73.8 Australia 4.9
France 62.7 Switzerland 0.4
How Macroeconomics Studies Key Questions
Macroeconomists have a general approach to study questions of interest: Document the facts
Develop a model
Compare predictions of the model with original facts
Use the model to make other predictions that will eventually be tested
Models
Models simplify the complicated real world into its most relevant elements.
A model is useful if it has good predictive power.
Economic models often involve systems of multiple equations.
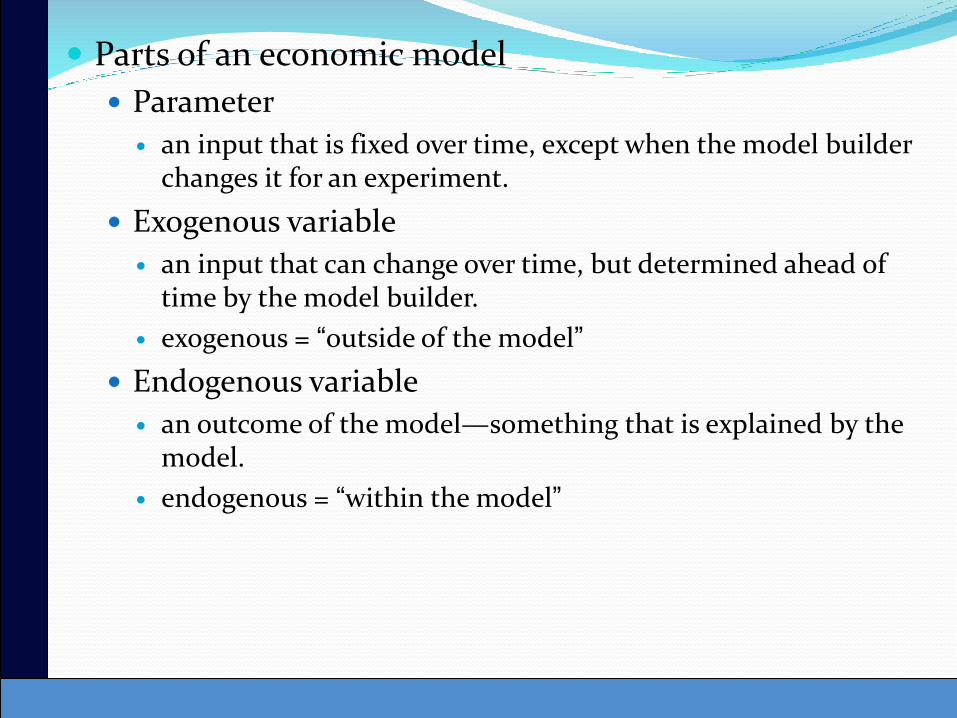
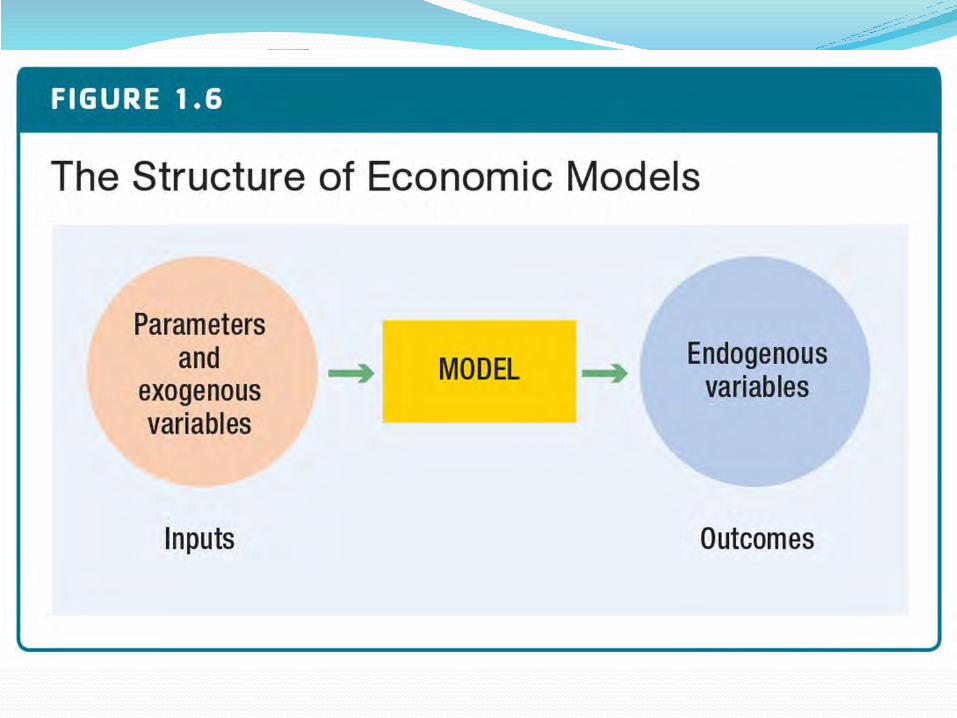
Parts of an economic model
Parameter
an input that is fixed over time, except when the model builder changes it for an experiment.
Exogenous variable
an input that can change over time, but determined ahead of time by the model builder.
exogenous = “outside of the model” Endogenous variable
an outcome of the model—something that is explained by the model.
endogenous = “within the model”
Suppose we have a working model. How can we use it?
Change parameters and exogenous variables to see how they affect endogenous variables.
Predict costs and benefits of new government policies.
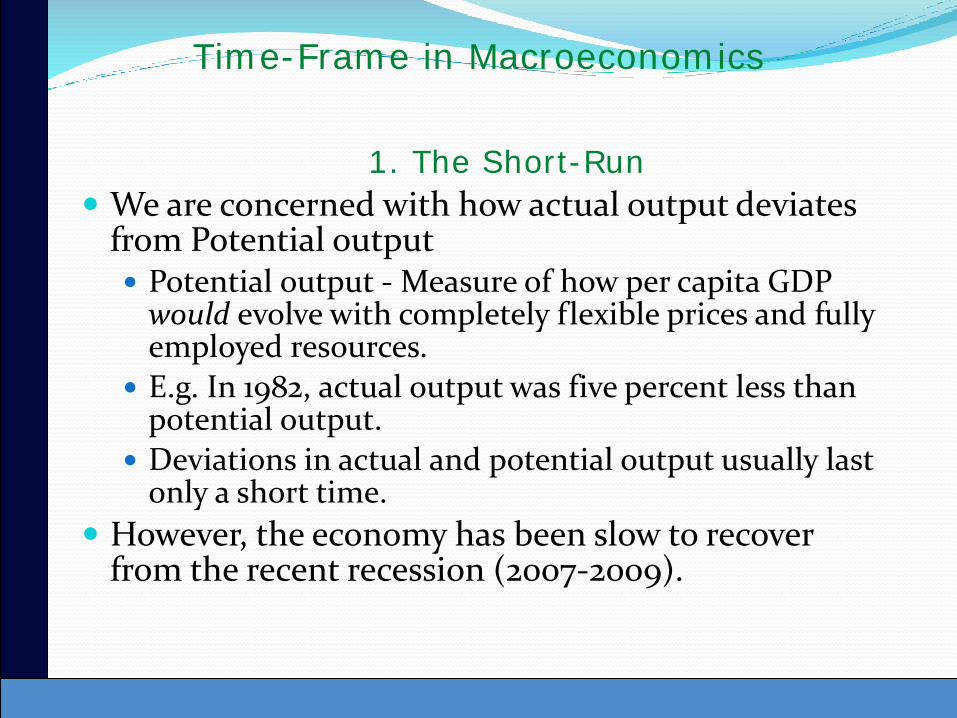
Time-Frame in Macroeconomics
1. The Short-Run
We are concerned with how actual output deviates from Potential output Potential output - Measure of how per capita GDP
would evolve with completely flexible prices and fully employed resources.
E.g. In 1982, actual output was five percent less than potential output.
Deviations in actual and potential output usually last only a short time.
However, the economy has been slow to recover from the recent recession (2007-2009).
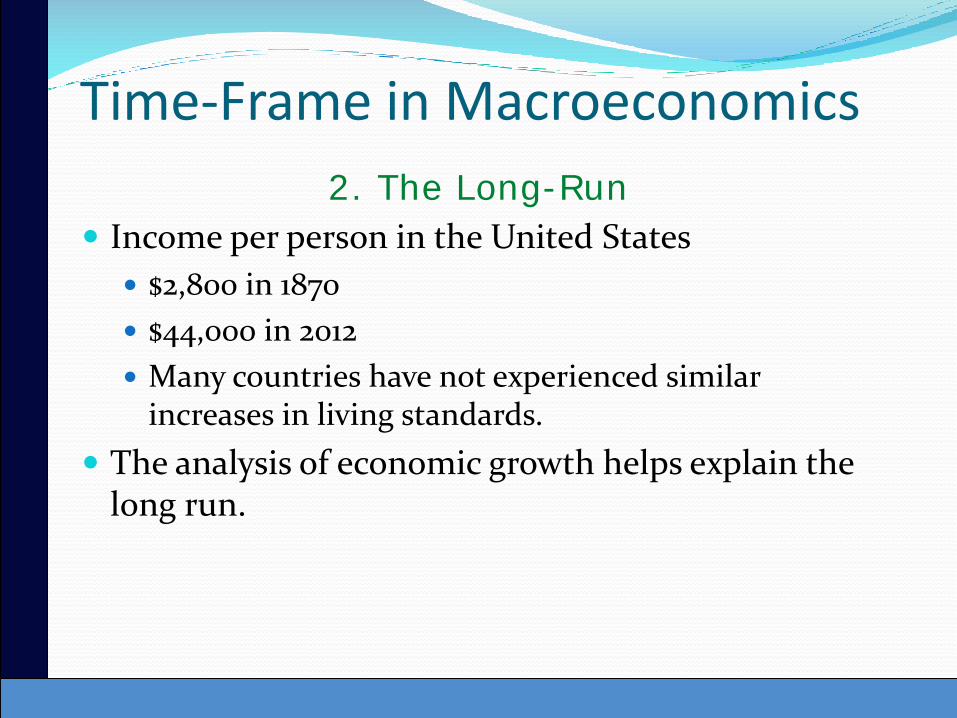
Time-Frame in Macroeconomics
2. The Long-Run
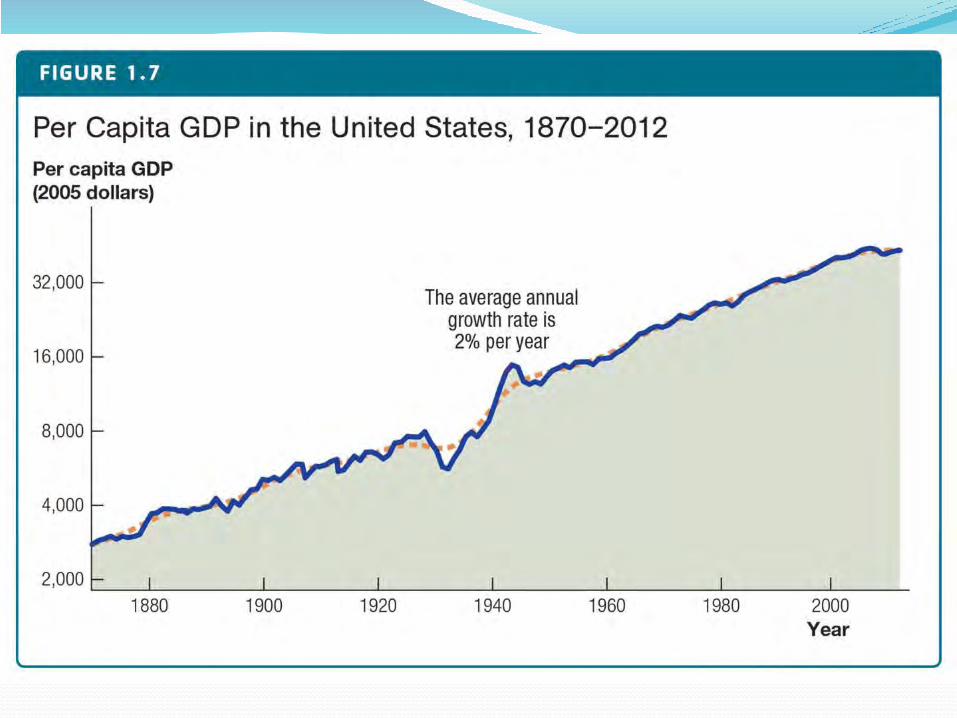
Income per person in the United States
$2,800 in 1870
$44,000 in 2012
Many countries have not experienced similar increases in living standards.
The analysis of economic growth helps explain the long run.
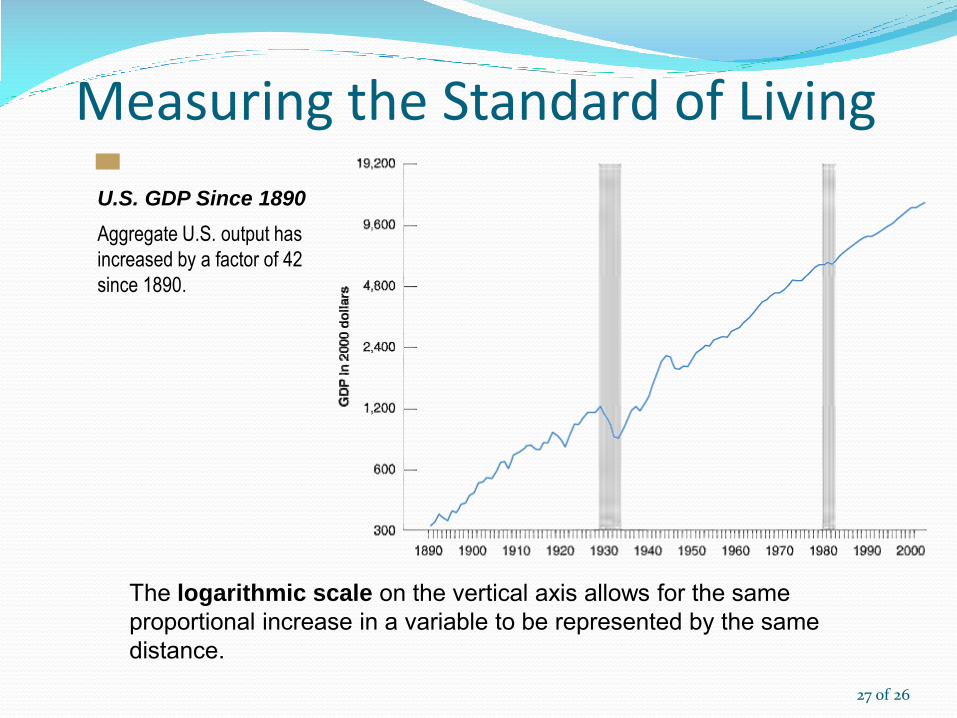
Measuring the Standard of Living
27 of 26
The logarithmic scale on the vertical axis allows for the same proportional increase in a variable to be represented by the same distance.
Aggregate U.S. output has
increased by a factor of 42
since 1890.
U.S. GDP Since 1890
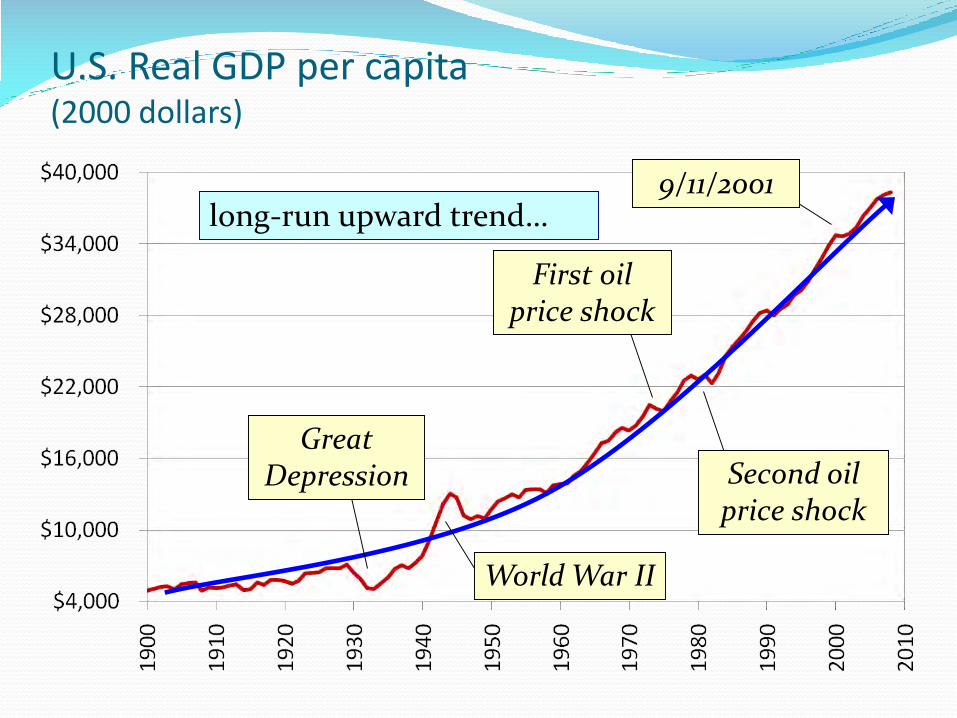
U.S. Real GDP per capita (2000 dollars)
long-run upward trend…
Great Depression
World War II
First oil price shock
Second oil price shock
9/11/2001
30 of 26
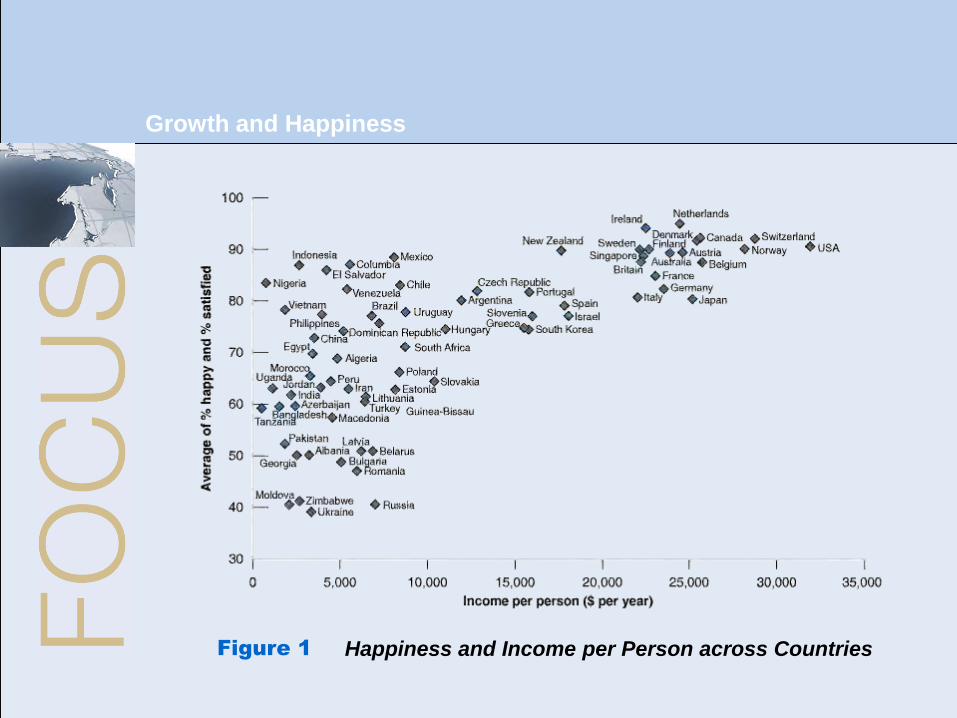
Growth and Happiness
Happiness and Income per Person across CountriesFigure 1
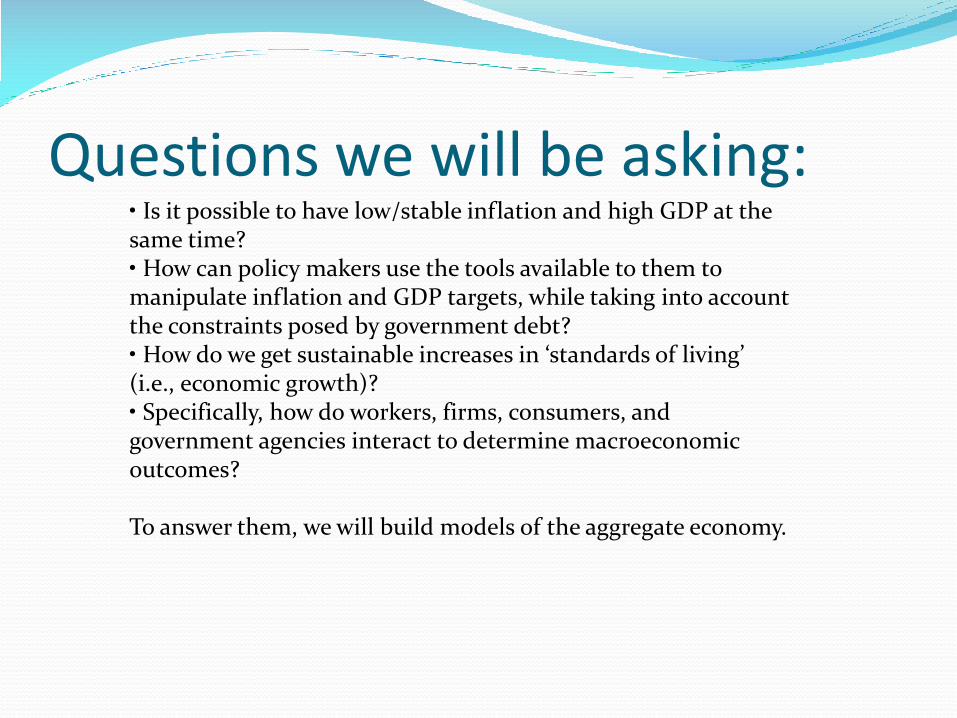
Questions we will be asking:• Is it possible to have low/stable inflation and high GDP at the same time?• How can policy makers use the tools available to them to manipulate inflation and GDP targets, while taking into account the constraints posed by government debt?• How do we get sustainable increases in ‘standards of living’ (i.e., economic growth)?• Specifically, how do workers, firms, consumers, and government agencies interact to determine macroeconomic outcomes?
To answer them, we will build models of the aggregate economy.
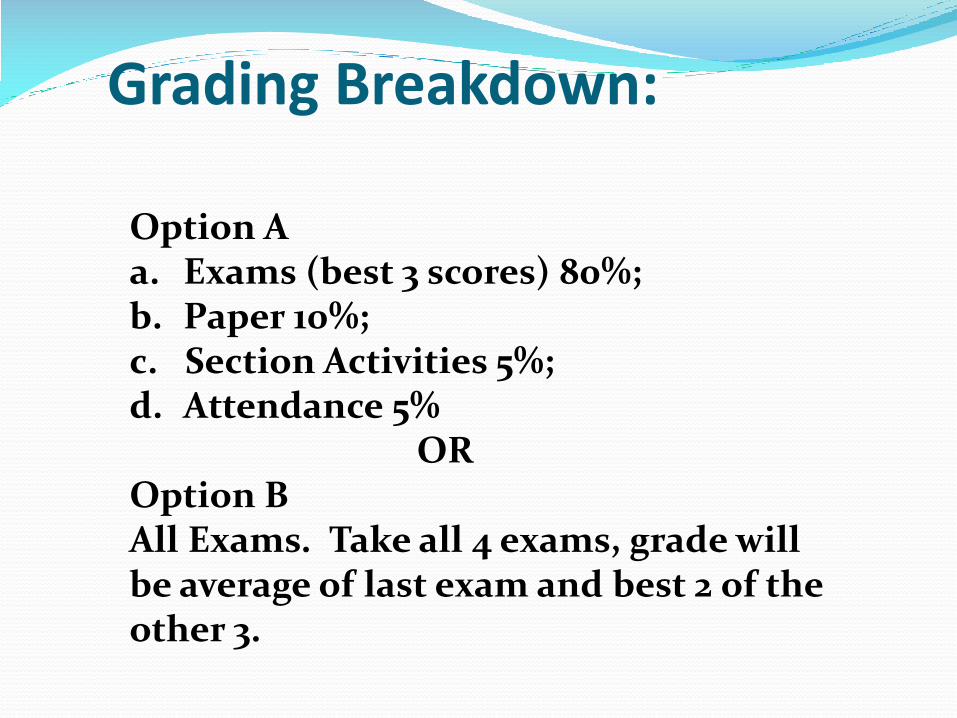
Grading Breakdown:
Option Aa. Exams (best 3 scores) 80%; b. Paper 10%; c. Section Activities 5%; d. Attendance 5%
OROption BAll Exams. Take all 4 exams, grade will be average of last exam and best 2 of the other 3.

Required Book
Tim Harford: The Undercover Economist Strikes Back.
Examples of Useful Blogs to follow:Mainly Macro by Simon Wren-Lewis http://mainlymacro.blogspot.com/Conscience of a Liberal by Paul Krugman http://krugman.blogs.nytimes.com/Economics One by John Taylorhttp://economicsone.com/
Economist’s View by Mark Thoma (has links to very extensive list of economics blogs)http://economistsview.typepad.com/economistsview/
Now we wil l begin to think in more detail about:
…the meaning and measurement of the most important macroeconomic statistics:
gross domestic product (GDP)
Price Changes as measured by the GDP Deflator and the consumer price index (CPI)
the unemployment rate
36
Gross Domestic Product (GDP) GDP is a measure of all currently produced final goods
and services evaluated at market prices.
Currently produced – in a given period, e.g. a year
Final goods and services – not goods that are used up in the production of other goods.
Evaluated at market prices – we need a way to add the quantities of different goods together – use market prices as indicator of what society values them at.
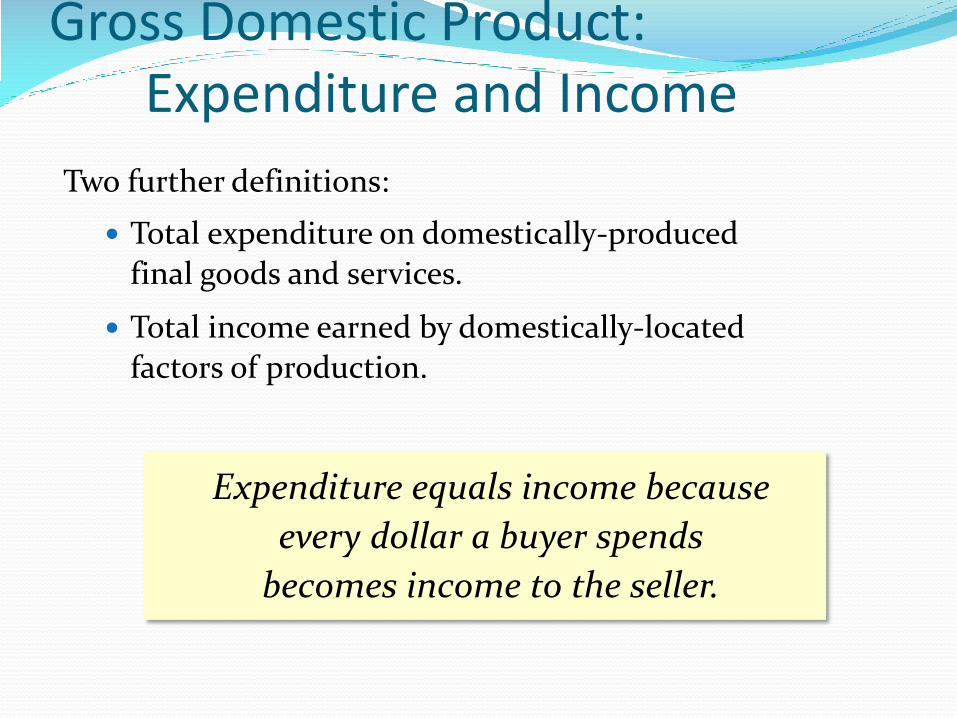
Gross Domestic Product: Expenditure and Income
Two further definitions:
Total expenditure on domestically-produced
final goods and services.
Total income earned by domestically-located
factors of production.
Expenditure equals income because
every dollar a buyer spends
becomes income to the seller.
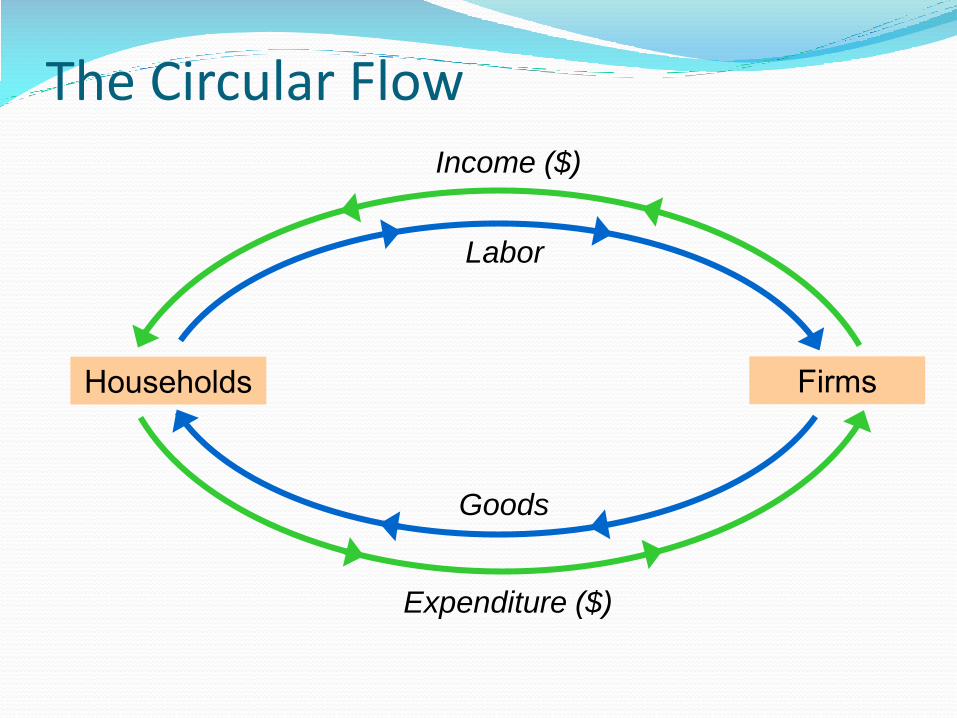
The Circular Flow
Households Firms
Goods
Labor
Expenditure ($)
Income ($)
Yet another way to think about GDP: Value added
Value added: The value of output minus the value of the intermediate goods used to produce that output
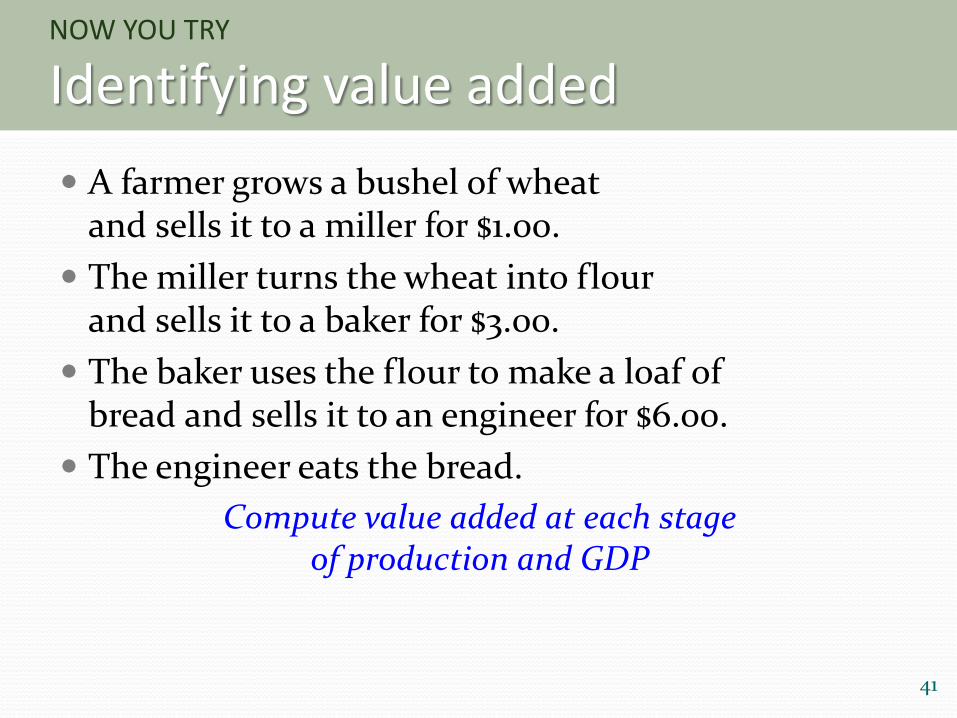
NOW YOU TRY
Identifying value added
A farmer grows a bushel of wheat and sells it to a miller for $1.00.
The miller turns the wheat into flour and sells it to a baker for $3.00.
The baker uses the flour to make a loaf of bread and sells it to an engineer for $6.00.
The engineer eats the bread.
Compute value added at each stage of production and GDP
41
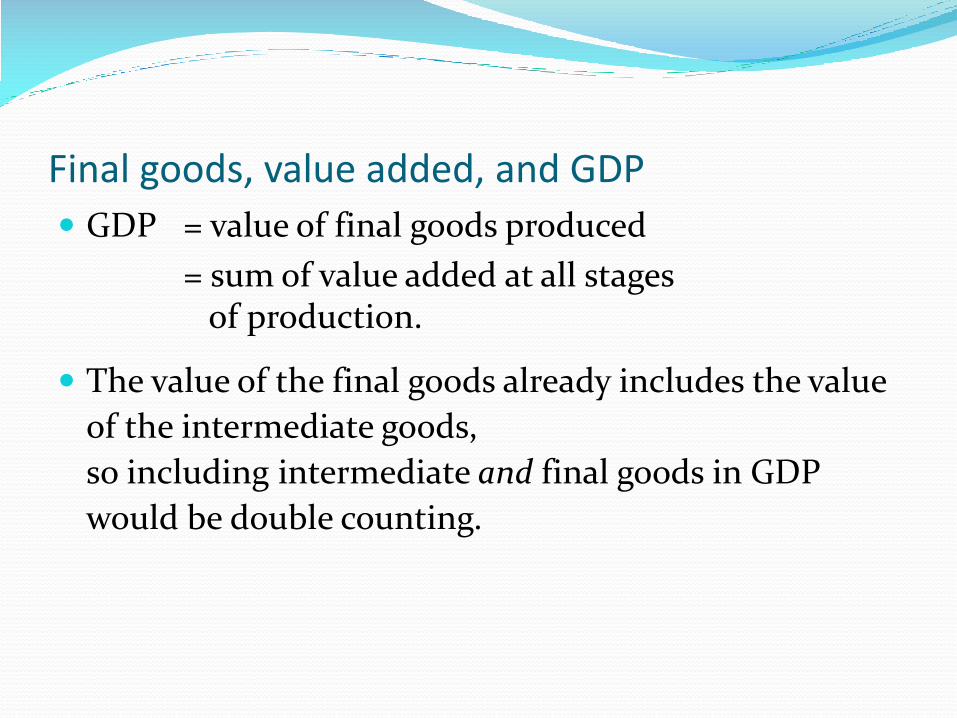
Final goods, value added, and GDP
GDP = value of final goods produced
= sum of value added at all stages of production.
The value of the final goods already includes the value
of the intermediate goods,
so including intermediate and final goods in GDP
would be double counting.
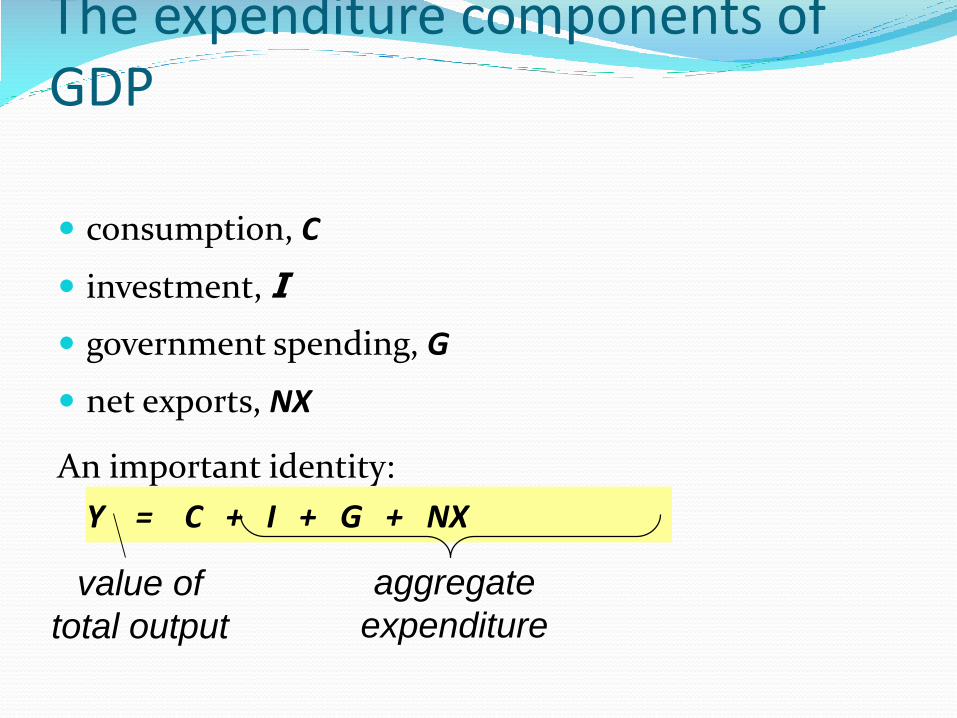
The expenditure components of GDP
consumption, C
investment, I
government spending, G
net exports, NX
An important identity:
Y = C + I + G + NX
aggregate
expenditure
value of
total output
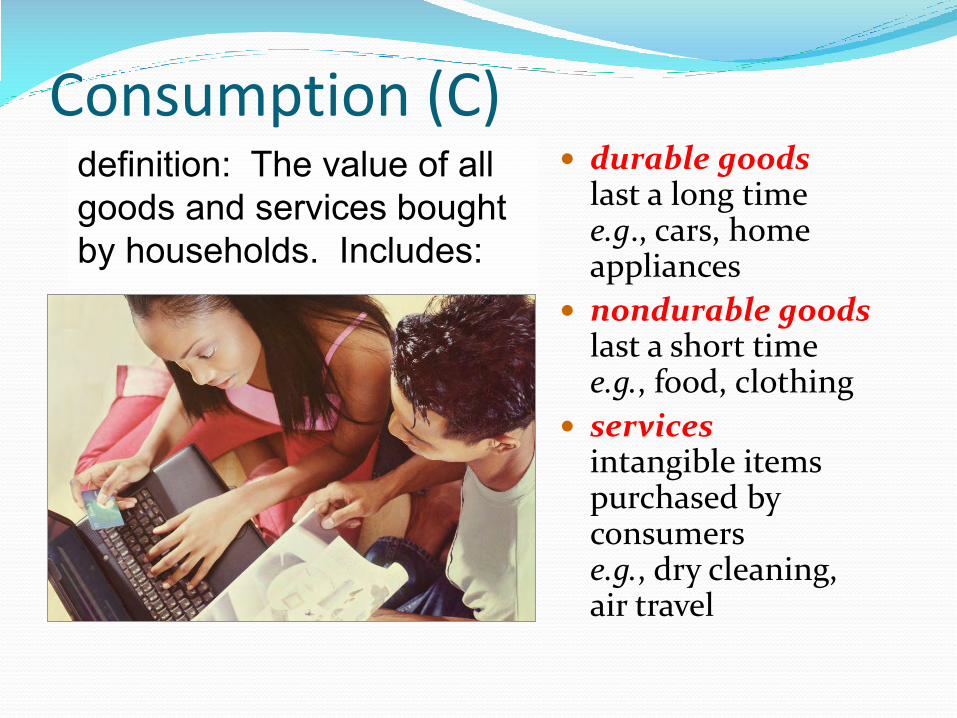
Consumption (C) durable goods
last a long time e.g., cars, home appliances
nondurable goodslast a short time e.g., food, clothing
servicesintangible items purchased by consumers e.g., dry cleaning, air travel
definition: The value of all goods and services bought by households. Includes:
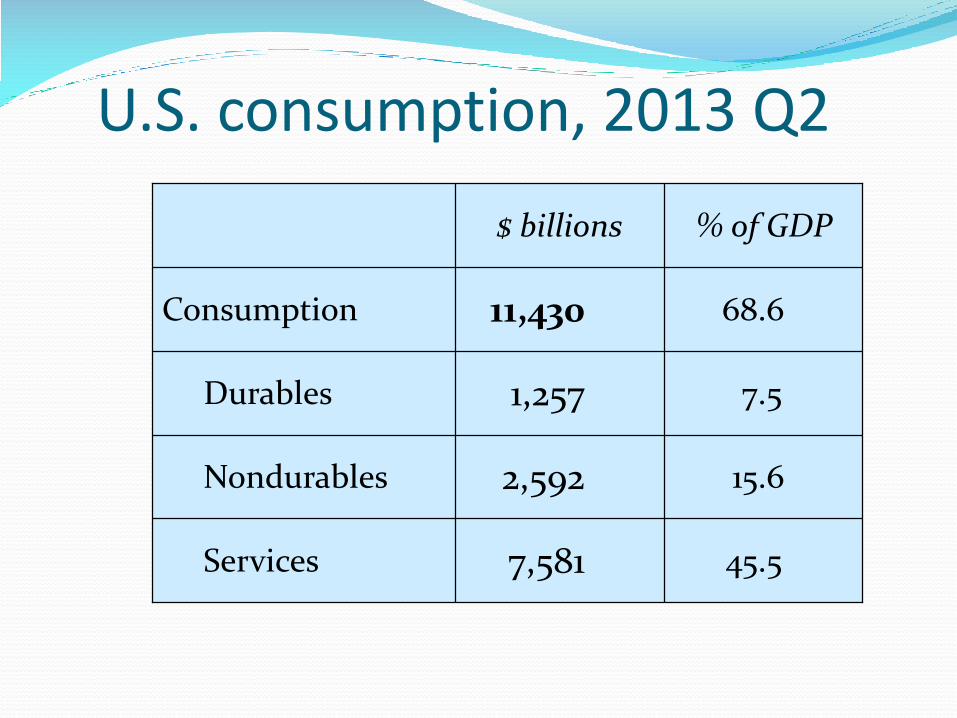
U.S. consumption, 2013 Q2
45.5
15.6
7.5
68.6
7,581
2,592
1,257
11,430
Services
Nondurables
Durables
Consumption
% of GDP$ billions
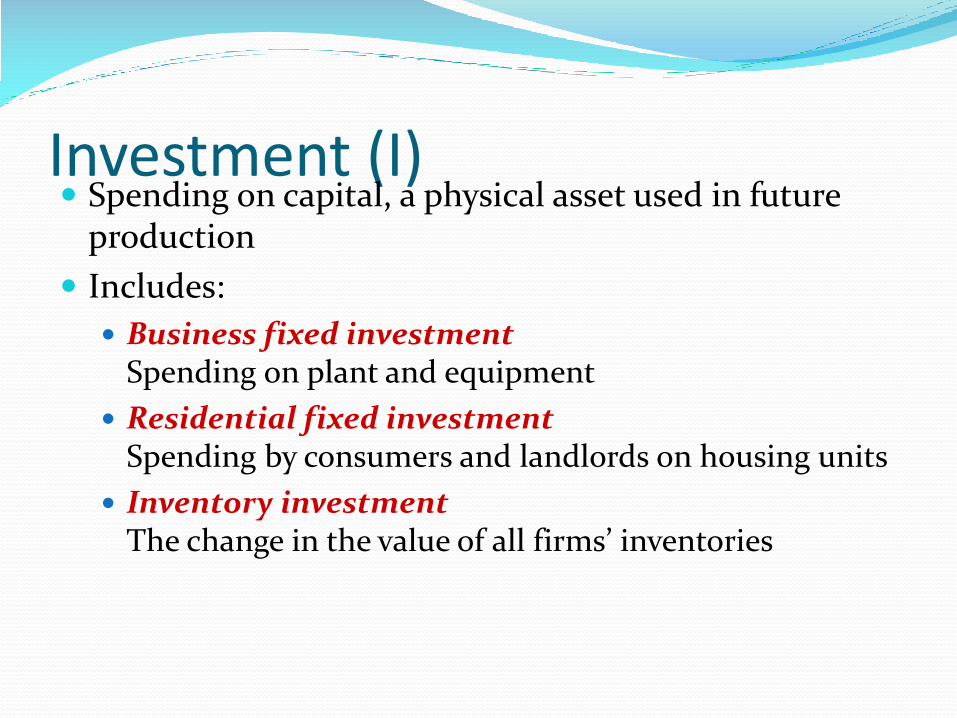
Investment (I) Spending on capital, a physical asset used in future
production
Includes:
Business fixed investmentSpending on plant and equipment
Residential fixed investmentSpending by consumers and landlords on housing units
Inventory investmentThe change in the value of all firms’ inventories
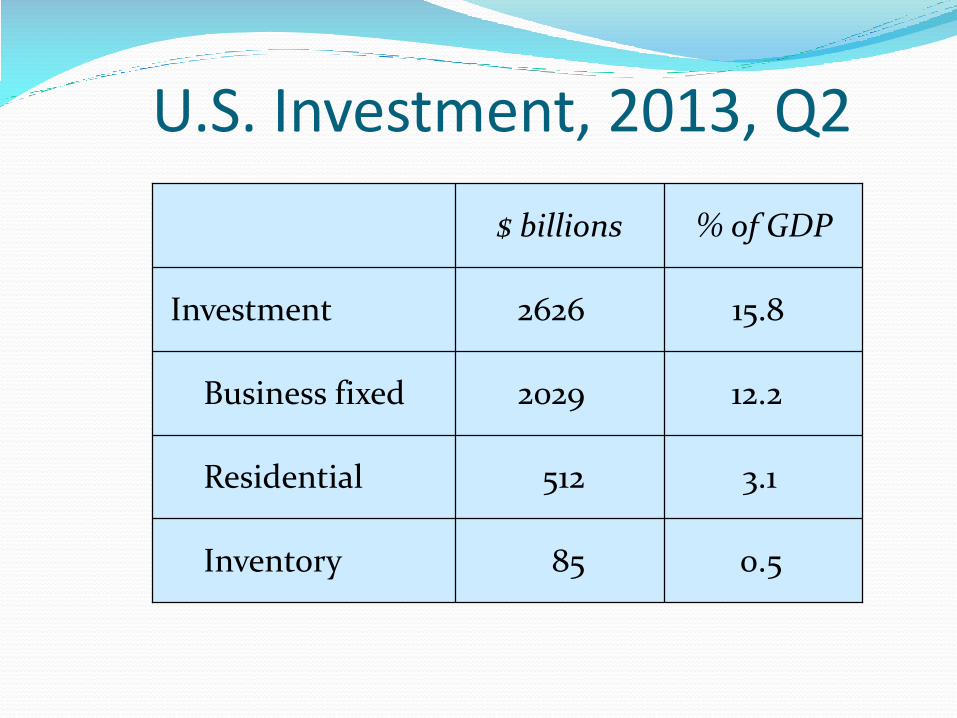
U.S. Investment, 2013, Q2
0.5
3.1
12.2
15.8
85
512
2029
2626
Inventory
Residential
Business fixed
Investment
% of GDP$ billions
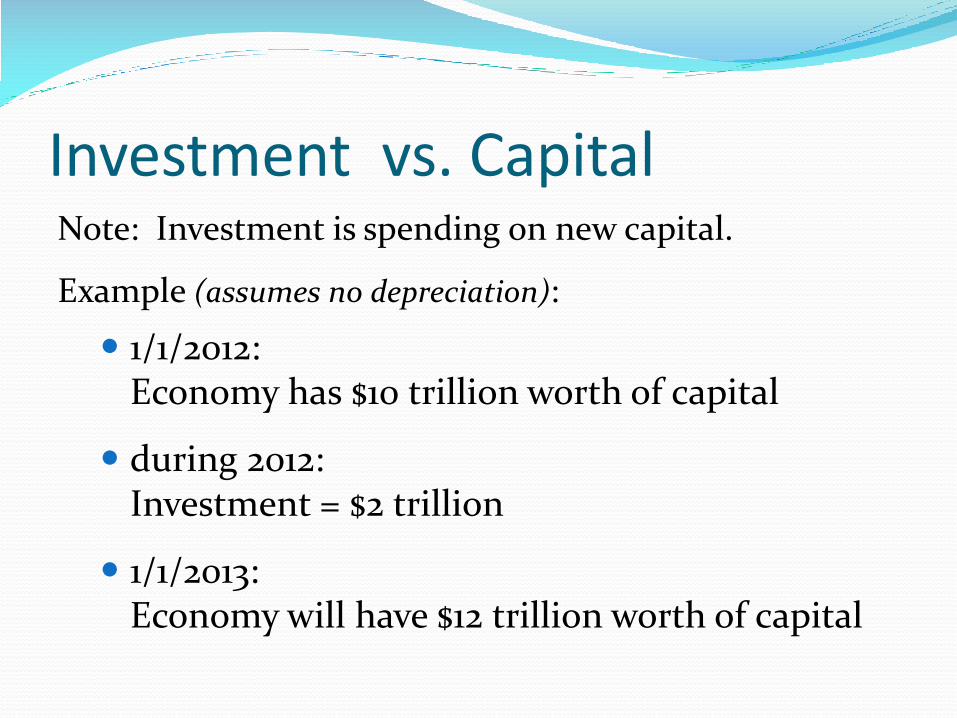
Investment vs. CapitalNote: Investment is spending on new capital.
Example (assumes no depreciation):
1/1/2012: Economy has $10 trillion worth of capital
during 2012:Investment = $2 trillion
1/1/2013: Economy will have $12 trillion worth of capital
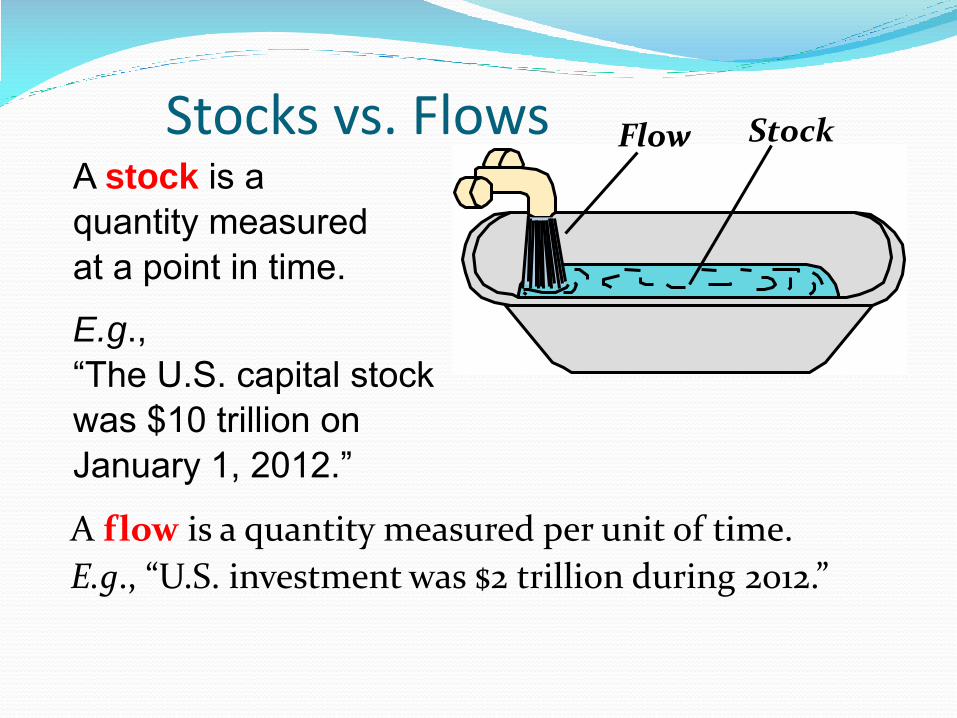
Stocks vs. Flows
A flow is a quantity measured per unit of time.
E.g., “U.S. investment was $2 trillion during 2012.”
Flow Stock
A stock is a quantity measured at a point in time.
E.g., “The U.S. capital stock was $10 trillion on January 1, 2012.”
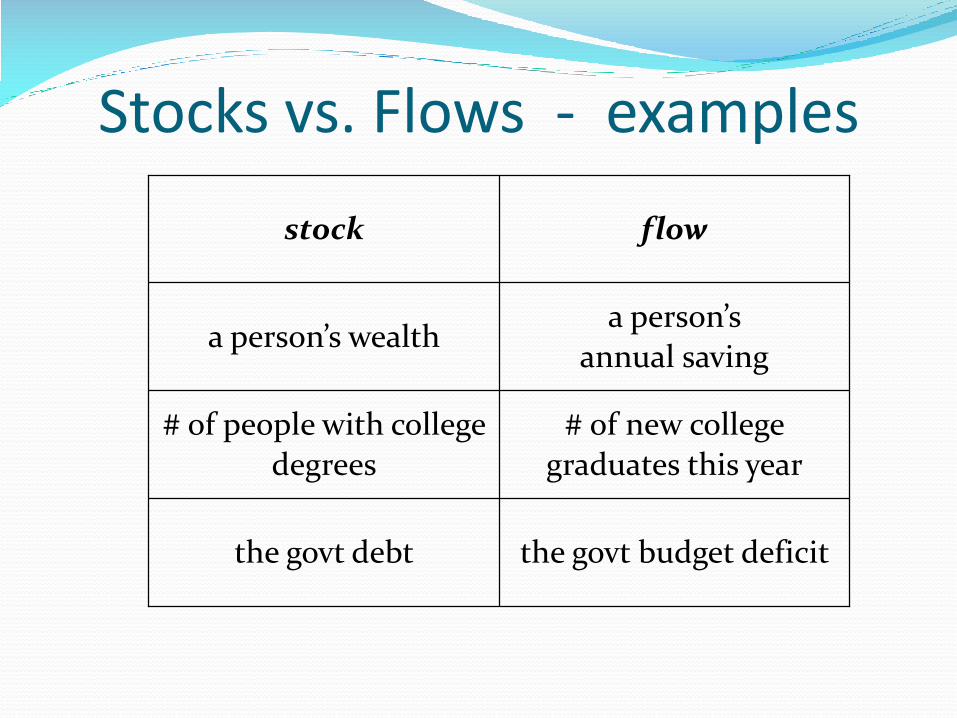
Stocks vs. Flows - examples
the govt budget deficitthe govt debt
# of new college
graduates this year
# of people with college
degrees
a person’s
annual savinga person’s wealth
flowstock
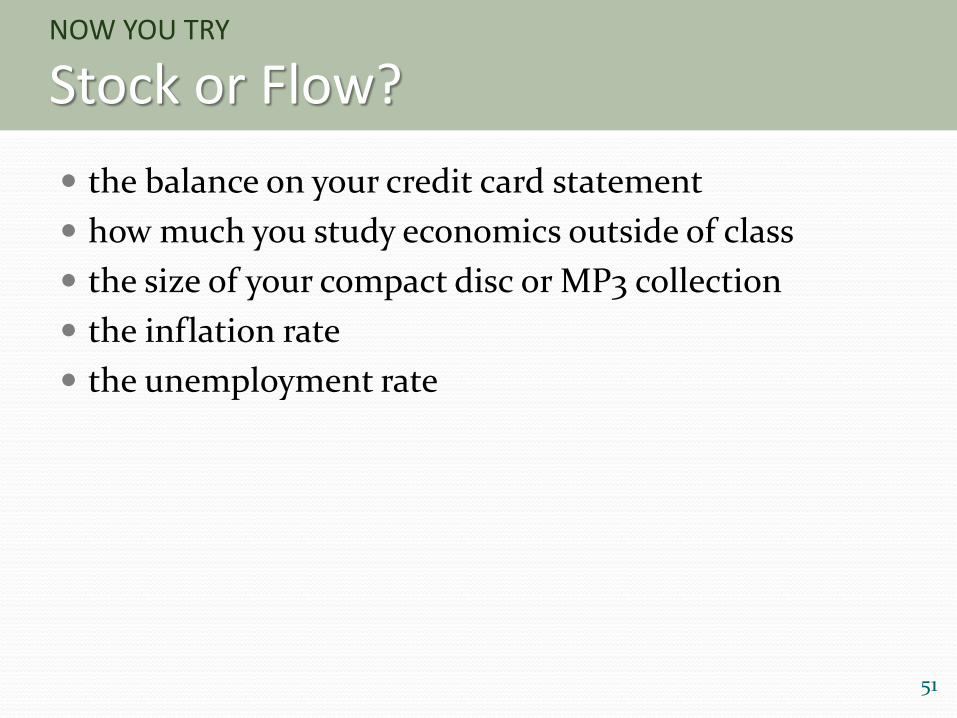
NOW YOU TRY
Stock or Flow?
the balance on your credit card statement
how much you study economics outside of class
the size of your compact disc or MP3 collection
the inflation rate
the unemployment rate
51
Government spending (G) G includes all government spending on goods and
services.
G excludes transfer payments (e.g., unemployment insurance payments), because they do not represent spending on goods and services.
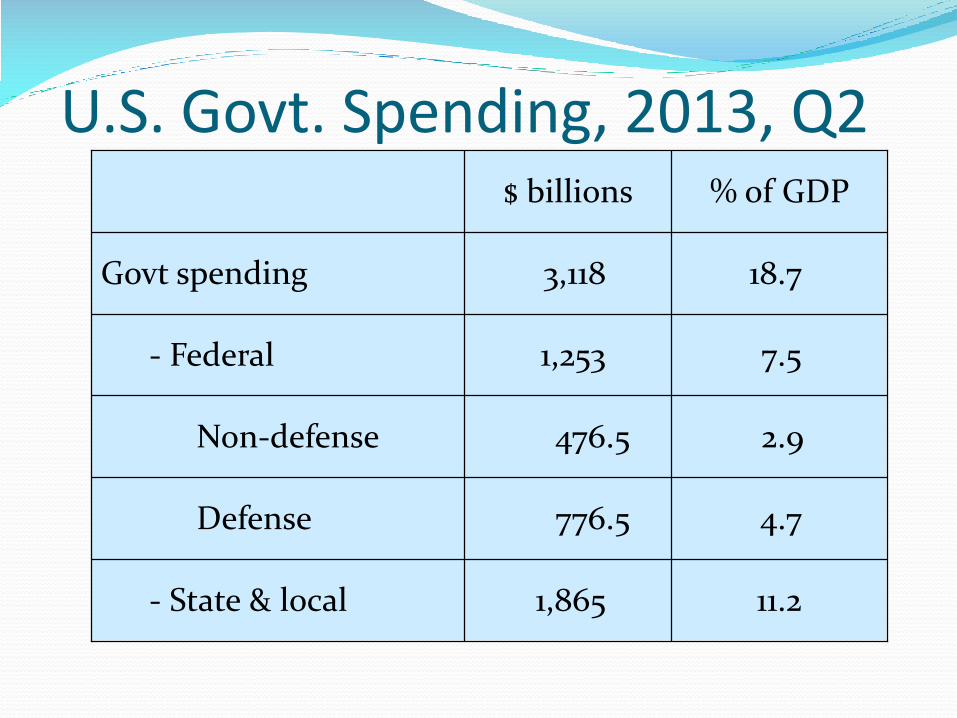
U.S. Govt. Spending, 2013, Q2
- Federal
18.73,118Govt spending
- State & local
Defense
7.5
11.2
4.7
2.9
1,253
1,865
776.5
476.5Non-defense
% of GDP$ billions
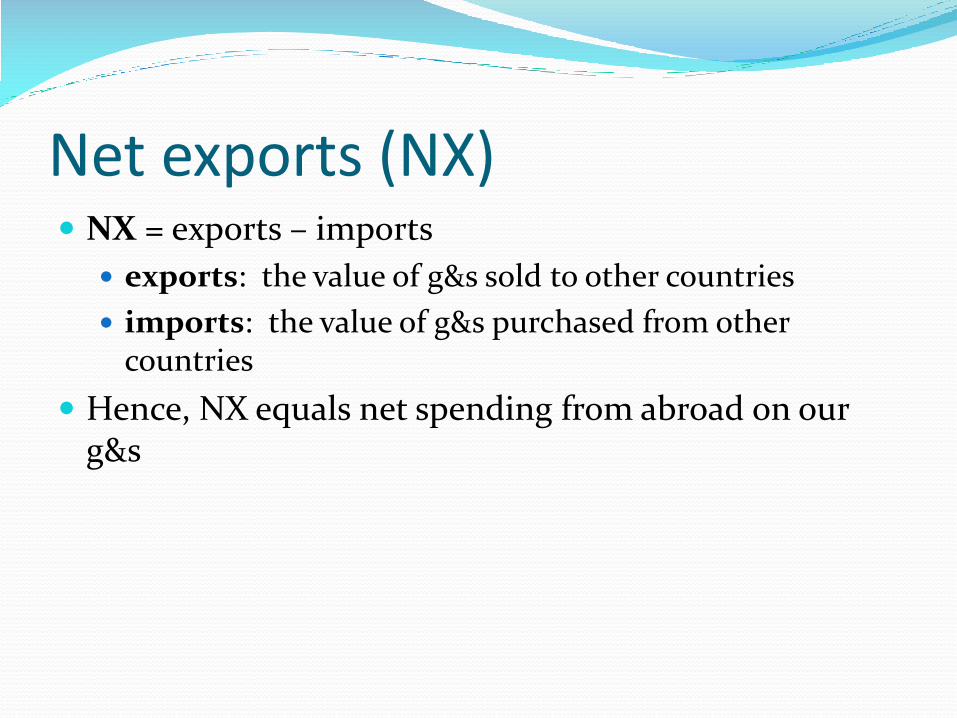
Net exports (NX) NX = exports – imports
exports: the value of g&s sold to other countries
imports: the value of g&s purchased from other countries
Hence, NX equals net spending from abroad on our g&s
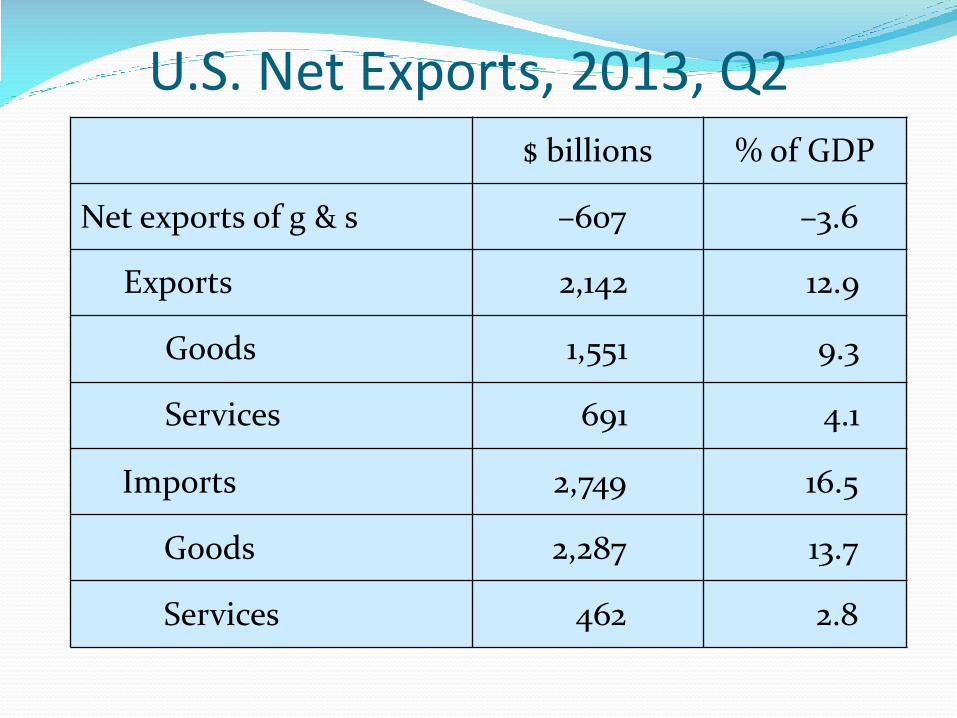
U.S. Net Exports, 2013, Q2$ billions % of GDP
Net exports of g & s –607 –3.6
Exports 2,142 12.9
Goods 1,551 9.3
Services 691 4.1
Imports 2,749 16.5
Goods 2,287 13.7
Services 462 2.8
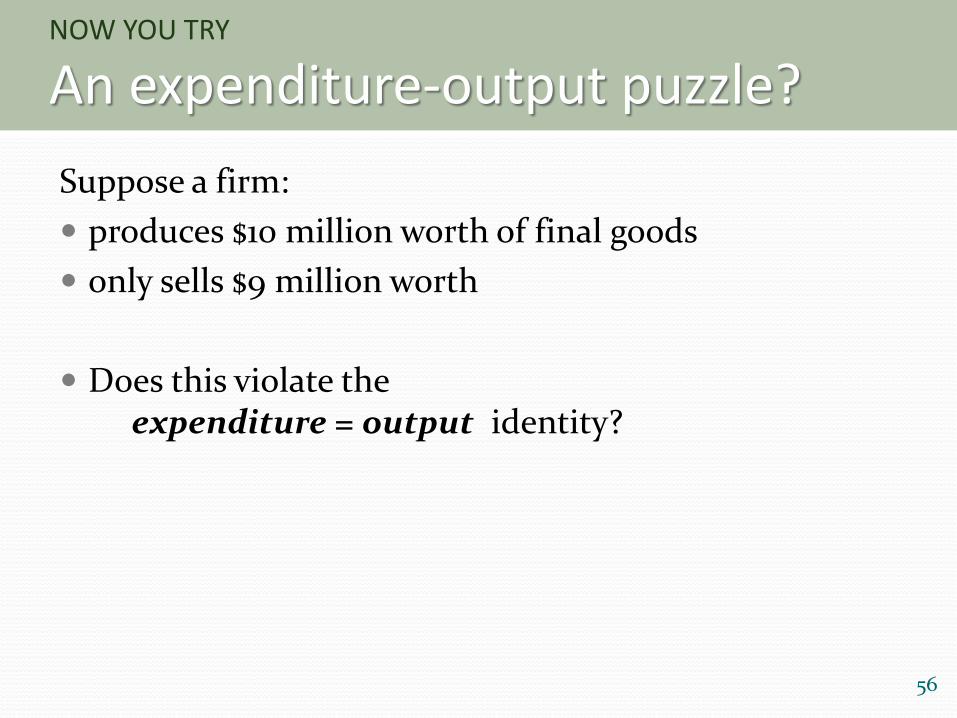
NOW YOU TRY
An expenditure-output puzzle?
Suppose a firm:
produces $10 million worth of final goods
only sells $9 million worth
Does this violate the expenditure = output identity?
56
Why output = expenditure Unsold output goes into inventory,
and is counted as “inventory investment”…
whether or not the inventory buildup was intentional.
In effect, we are assuming that firms purchase their unsold output.
GDP: An important and versatile conceptWe have now seen that GDP measures:
total income
total output
total expenditure
the sum of value added at all stages in the production of final goods
Some things not included in GDP Production for home use
Underground economy – illegal activities and legal activities not reported to avoid paying taxes
Value of leisure
Negative effects of production, such as pollution
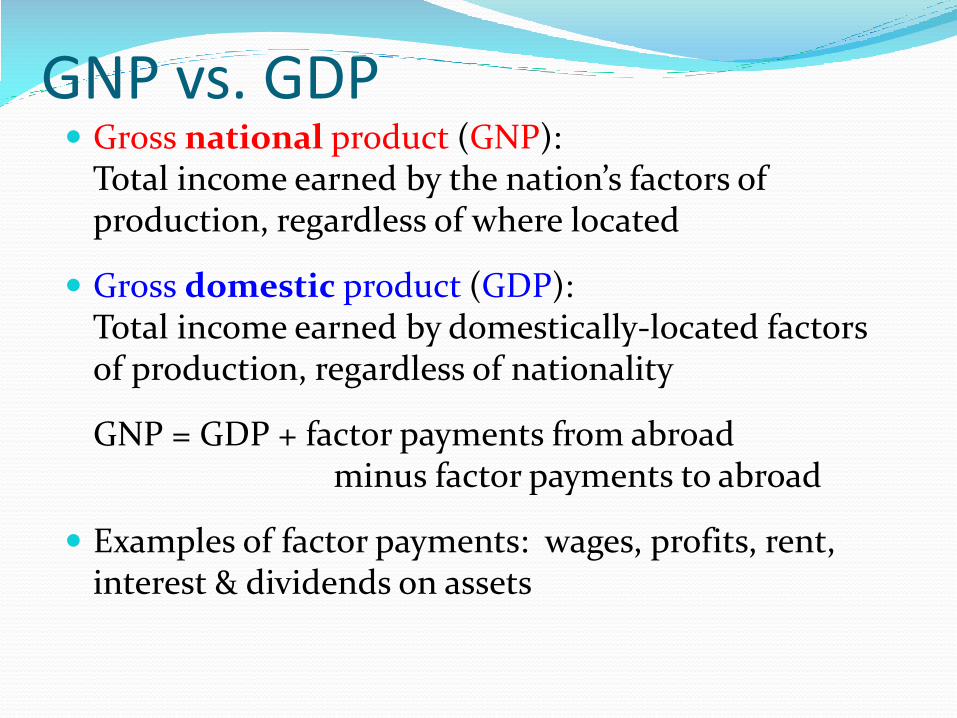
GNP vs. GDP Gross national product (GNP):
Total income earned by the nation’s factors of production, regardless of where located
Gross domestic product (GDP):Total income earned by domestically-located factors of production, regardless of nationality
GNP = GDP + factor payments from abroad minus factor payments to abroad
Examples of factor payments: wages, profits, rent, interest & dividends on assets
NOW YOU TRY
Discussion Question
In your country,
which would you
want to be bigger,
GDP or GNP?
Why?
61
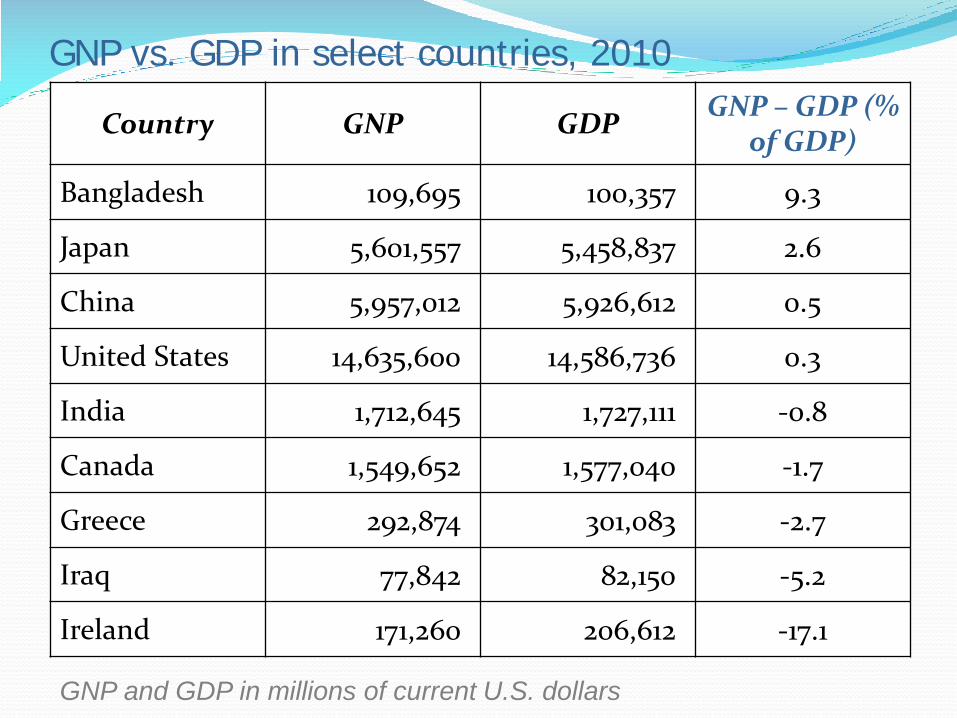
GNP vs. GDP in select countries, 2010
Country GNP GDPGNP – GDP (%
of GDP)
Bangladesh 109,695 100,357 9.3
Japan 5,601,557 5,458,837 2.6
China 5,957,012 5,926,612 0.5
United States 14,635,600 14,586,736 0.3
India 1,712,645 1,727,111 -0.8
Canada 1,549,652 1,577,040 -1.7
Greece 292,874 301,083 -2.7
Iraq 77,842 82,150 -5.2
Ireland 171,260 206,612 -17.1
GNP and GDP in millions of current U.S. dollars
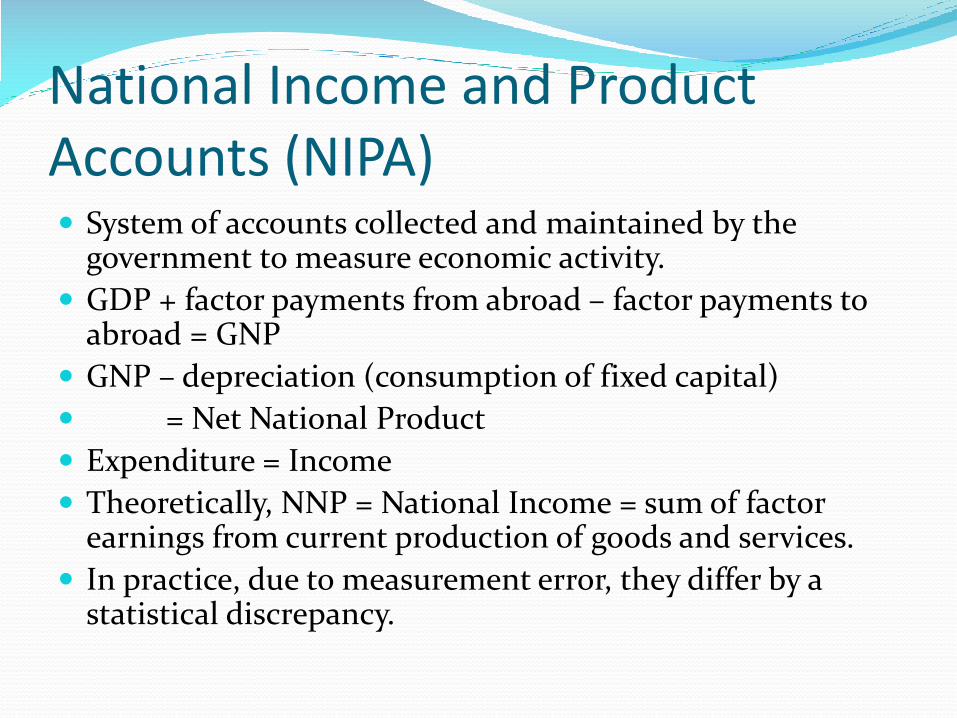
National Income and Product Accounts (NIPA) System of accounts collected and maintained by the
government to measure economic activity.
GDP + factor payments from abroad – factor payments to abroad = GNP
GNP – depreciation (consumption of fixed capital)
= Net National Product
Expenditure = Income
Theoretically, NNP = National Income = sum of factor earnings from current production of goods and services.
In practice, due to measurement error, they differ by a statistical discrepancy.
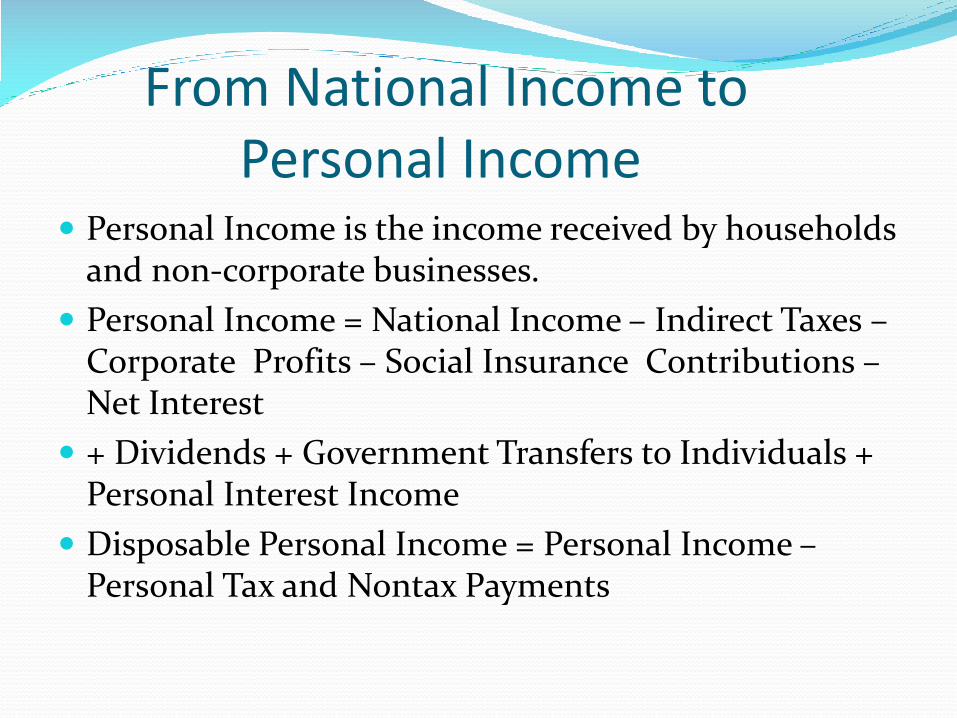
From National Income to Personal Income
Personal Income is the income received by households and non-corporate businesses.
Personal Income = National Income – Indirect Taxes –Corporate Profits – Social Insurance Contributions –Net Interest
+ Dividends + Government Transfers to Individuals + Personal Interest Income
Disposable Personal Income = Personal Income –Personal Tax and Nontax Payments
Real vs. nominal GDP GDP is the value of all final goods and services
produced.
Nominal GDP measures these values using current prices.
Real GDP measures these values using the prices of a base year.
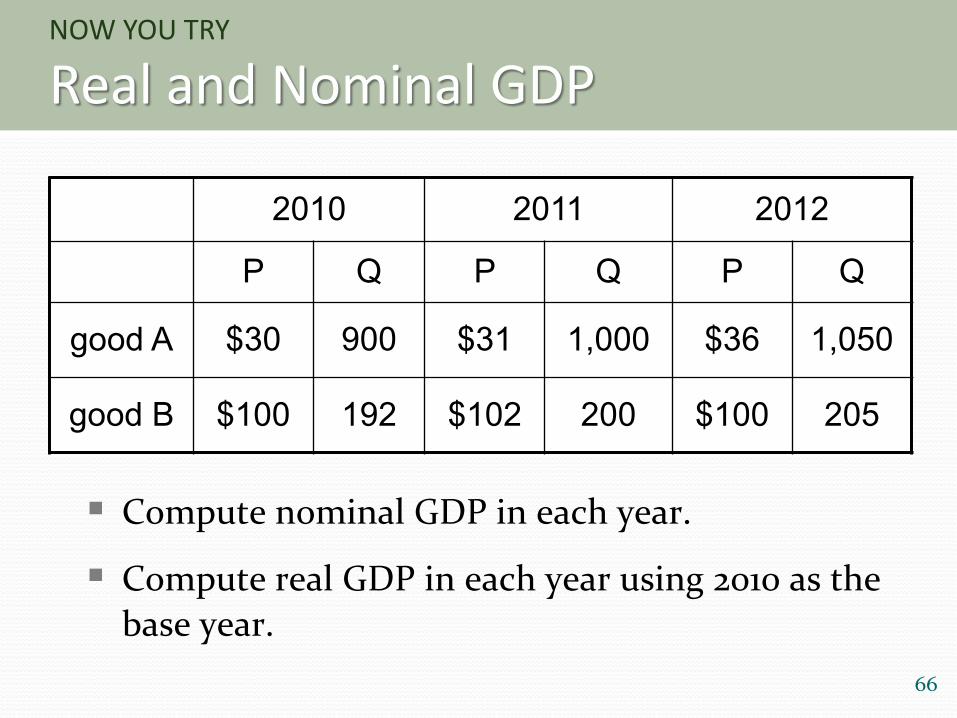
NOW YOU TRY
Real and Nominal GDP
66
Compute nominal GDP in each year.
Compute real GDP in each year using 2010 as the
base year.
2010 2011 2012
P Q P Q P Q
good A $30 900 $31 1,000 $36 1,050
good B $100 192 $102 200 $100 205
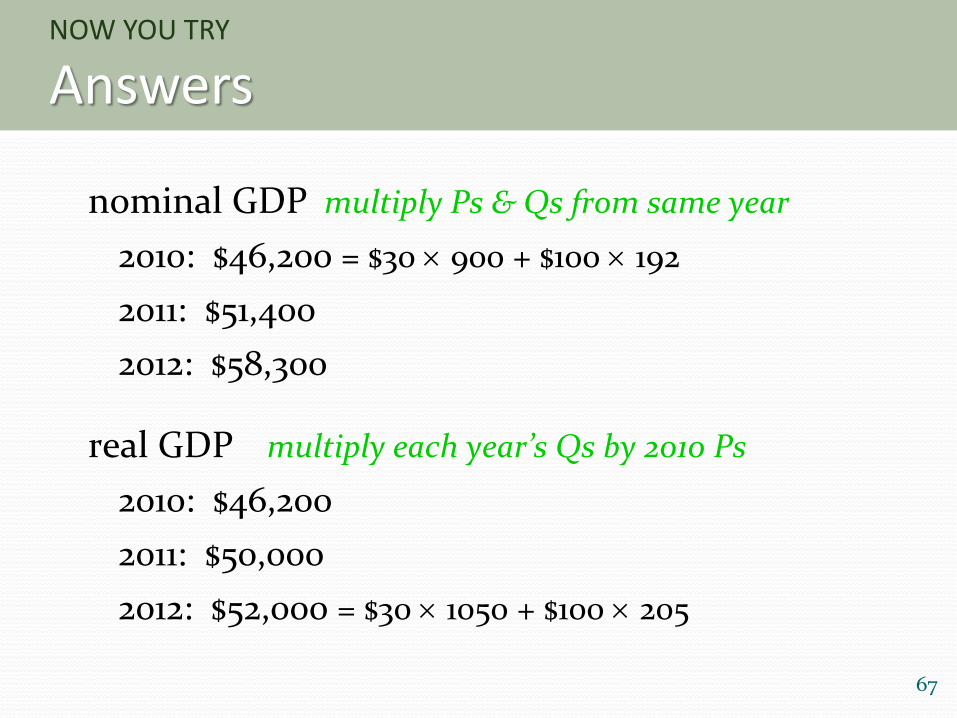
NOW YOU TRY
Answers
67
nominal GDP multiply Ps & Qs from same year
2010: $46,200 = $30 900 + $100 192
2011: $51,400
2012: $58,300
real GDP multiply each year’s Qs by 2010 Ps
2010: $46,200
2011: $50,000
2012: $52,000 = $30 1050 + $100 205
Real GDP controls for inflation Changes in nominal GDP can be due to:
changes in prices
changes in quantities of output produced
Changes in real GDP can only be due to changes in quantities, because real GDP is constructed using constant base-year prices.
$0
$2,000
$4,000
$6,000
$8,000
$10,000
$12,000
$14,000
$16,000
1960 1965 1970 1975 1980 1985 1990 1995 2000 2005 2010
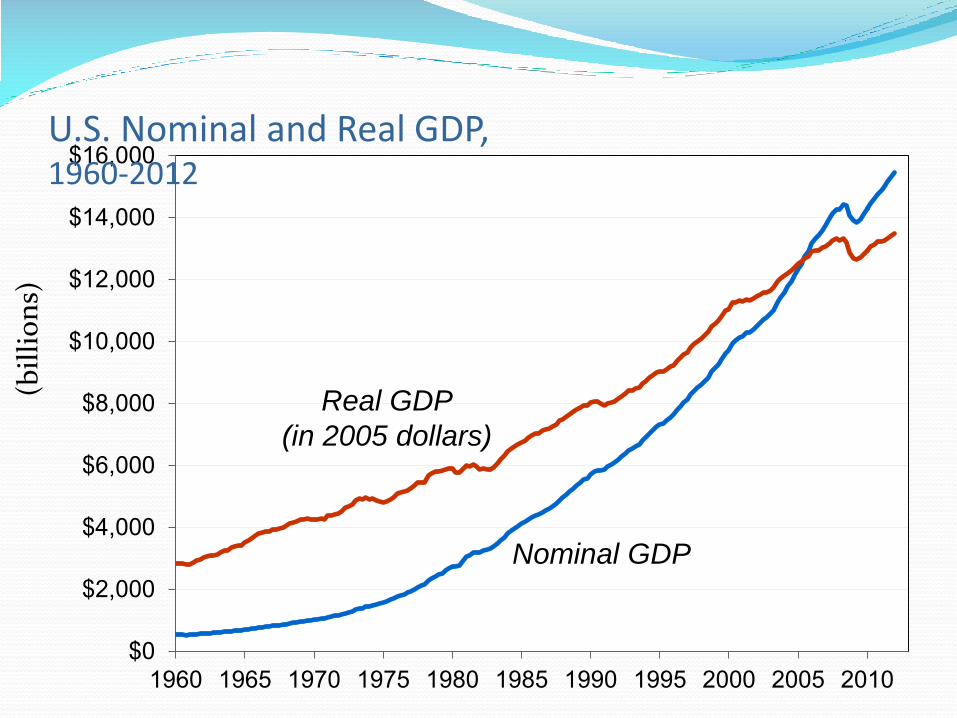
U.S. Nominal and Real GDP,1960-2012
(bil
lio
ns)
Nominal GDP
Real GDP
(in 2005 dollars)
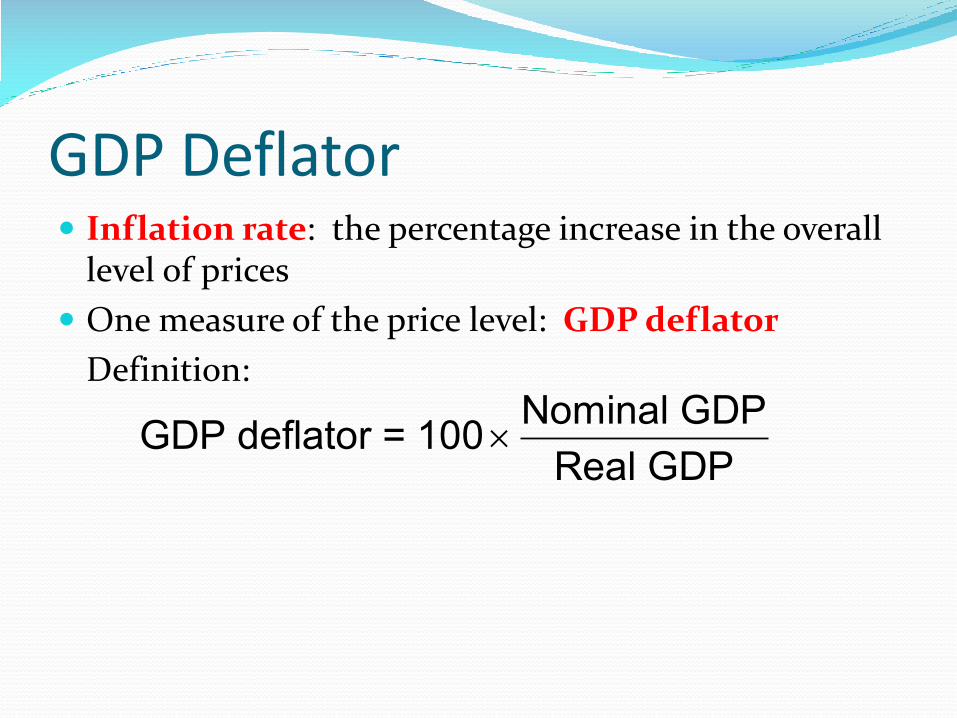
GDP Deflator Inflation rate: the percentage increase in the overall
level of prices
One measure of the price level: GDP deflator
Definition:
Nominal GDPGDP deflator = 100
Real GDP
NOW YOU TRY
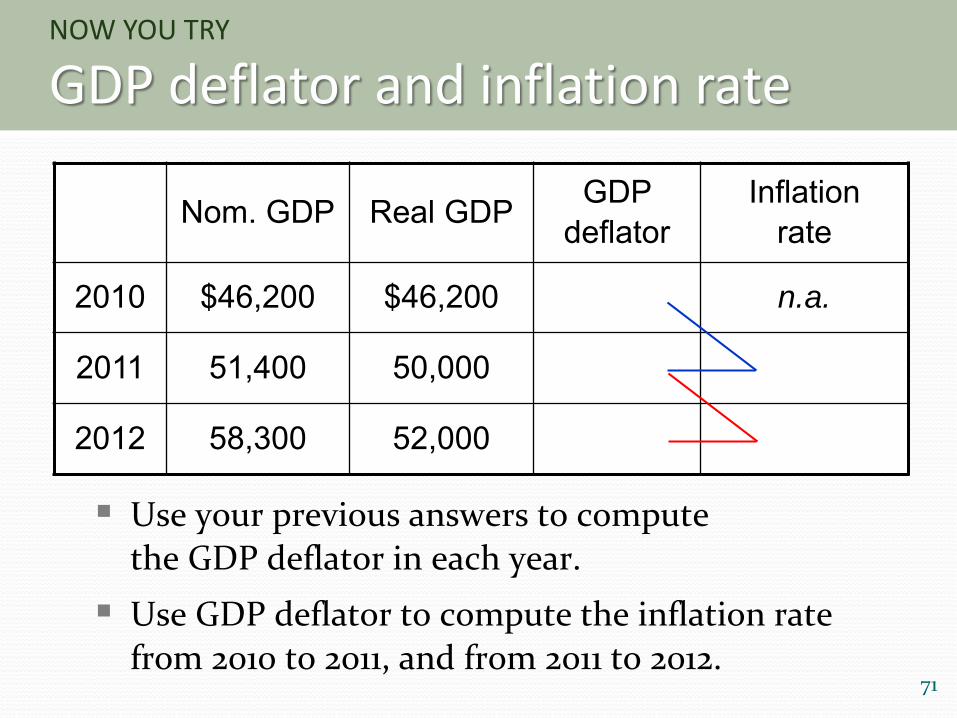
GDP deflator and inflation rate
71
Use your previous answers to compute
the GDP deflator in each year.
Use GDP deflator to compute the inflation rate
from 2010 to 2011, and from 2011 to 2012.
Nom. GDP Real GDP GDP deflator
Inflationrate
2010 $46,200 $46,200 n.a.
2011 51,400 50,000
2012 58,300 52,000
NOW YOU TRY
Answers
72
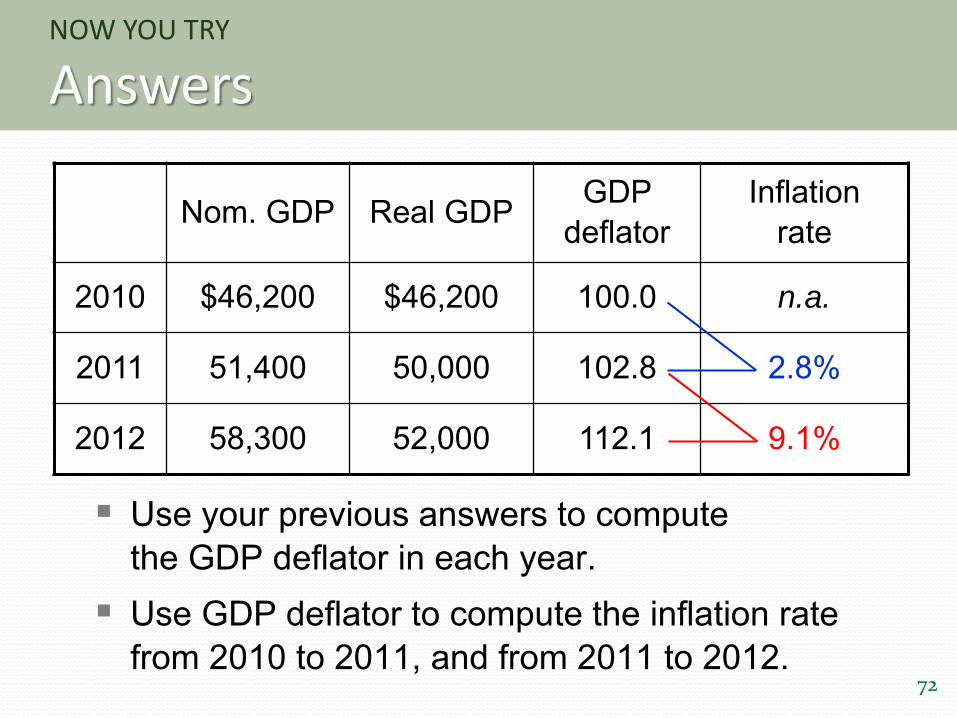
Use your previous answers to compute the GDP deflator in each year.
Use GDP deflator to compute the inflation rate from 2010 to 2011, and from 2011 to 2012.
Nom. GDP Real GDP GDP deflator
Inflationrate
2010 $46,200 $46,200 100.0 n.a.
2011 51,400 50,000 102.8 2.8%
2012 58,300 52,000 112.1 9.1%
0
20
40
60
80
100
120
198
0
198
1
198
2
198
3
198
4
198
5
198
6
198
7
198
8
198
9
199
0
199
1
199
2
199
3
199
4
199
5
199
6
199
7
199
8
199
9
200
0
200
1
200
2
200
3
200
4
200
5
200
6
200
7
200
8
200
9
2010
2011
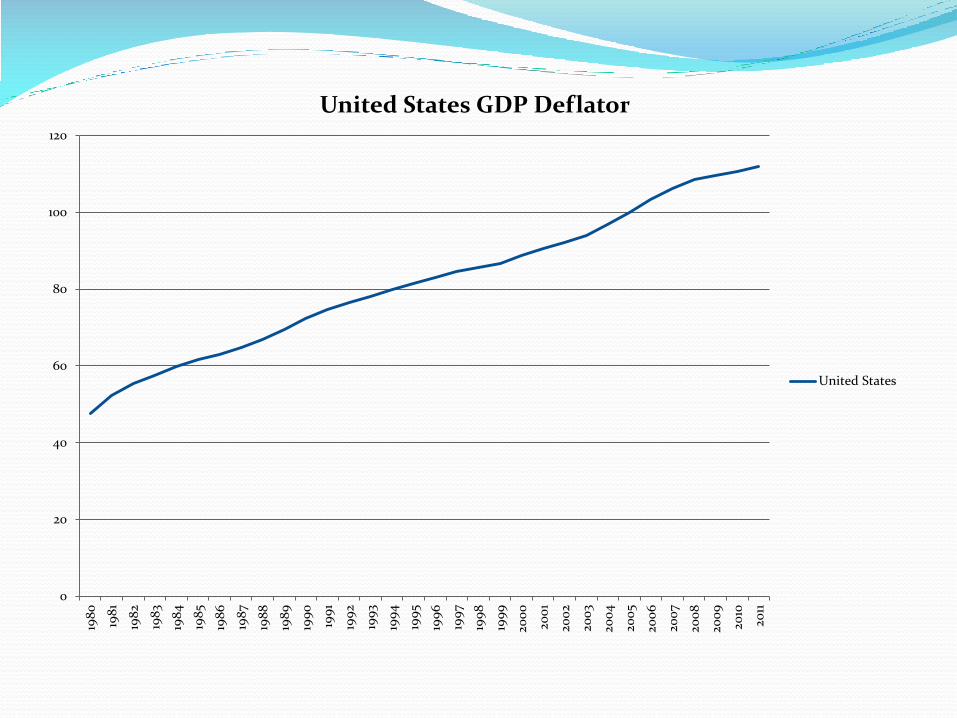
United States GDP Deflator
United States
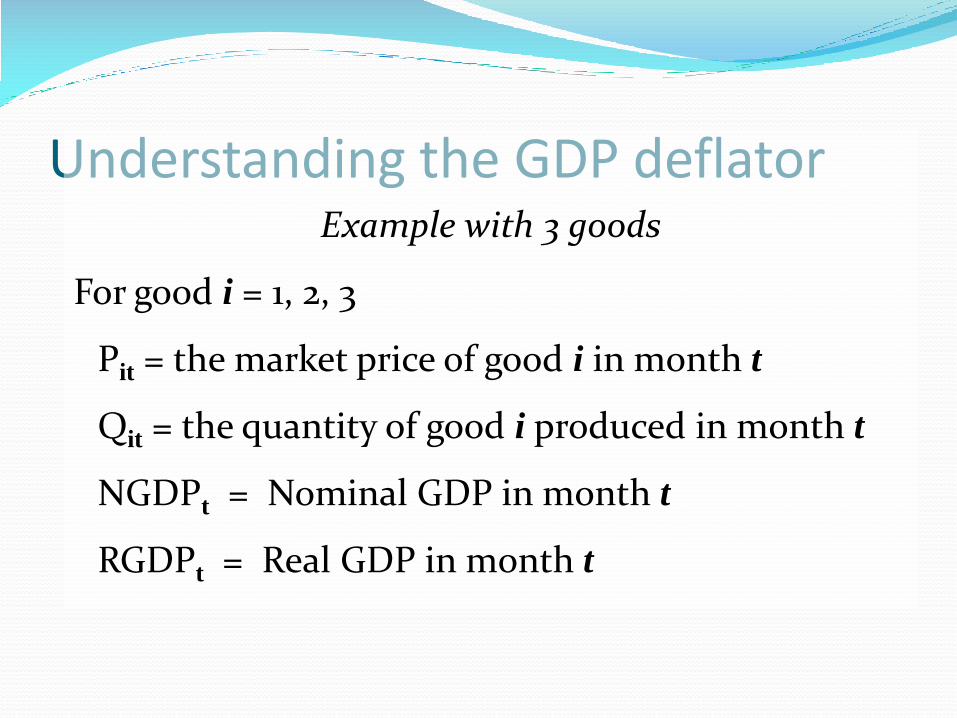
Understanding the GDP deflatorExample with 3 goods
For good i = 1, 2, 3
Pit = the market price of good i in month t
Qit = the quantity of good i produced in month t
NGDPt = Nominal GDP in month t
RGDPt = Real GDP in month t
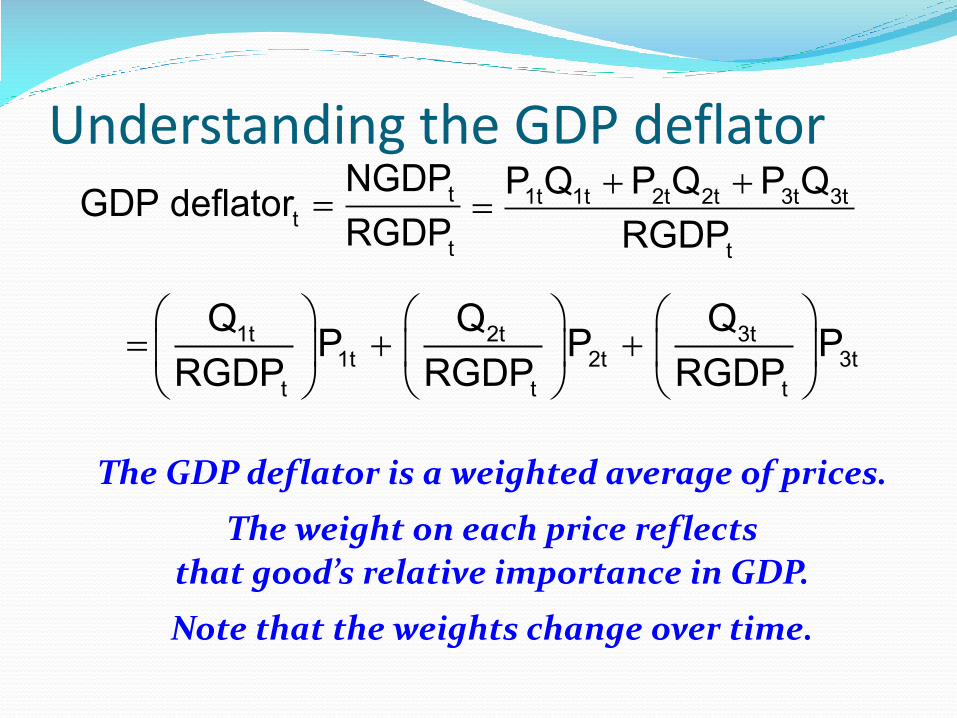
Understanding the GDP deflator t
tt
NGDPGDP deflatorRGDP
1t 1t 2t 2t 3t 3t
t
P Q P Q P QRGDP
1t 2t 3t1t 2t 3t
t t t
Q Q QP P PRGDP RGDP RGDP
The GDP deflator is a weighted average of prices.
The weight on each price reflects
that good’s relative importance in GDP.
Note that the weights change over time.
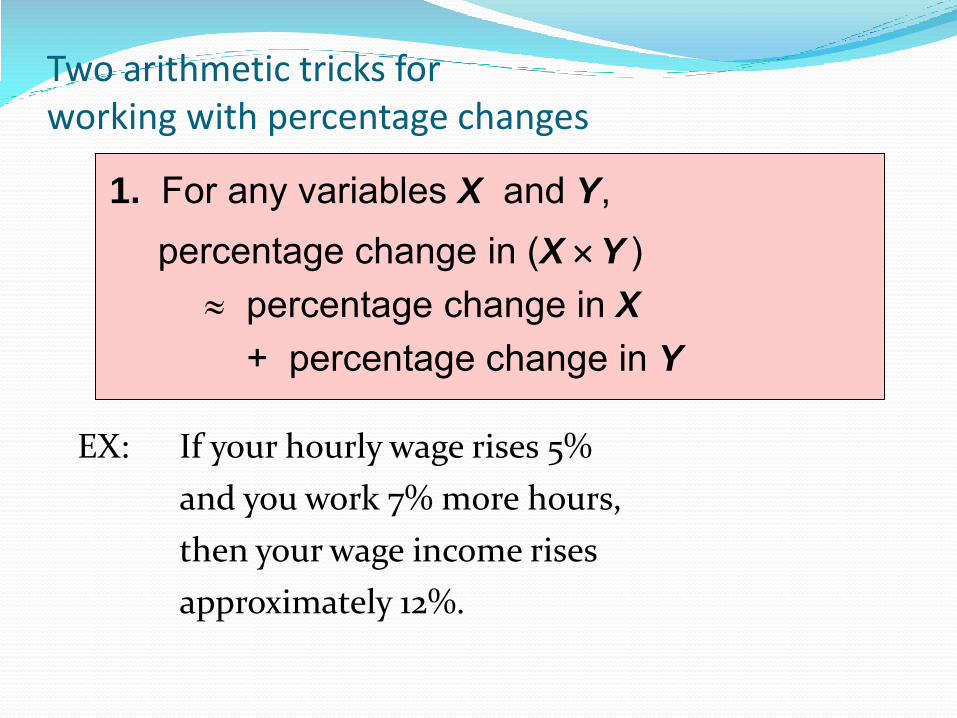
Two arithmetic tricks for working with percentage changes
EX: If your hourly wage rises 5%
and you work 7% more hours,
then your wage income rises
approximately 12%.
1. For any variables X and Y, percentage change in (X Y )
percentage change in X+ percentage change in Y
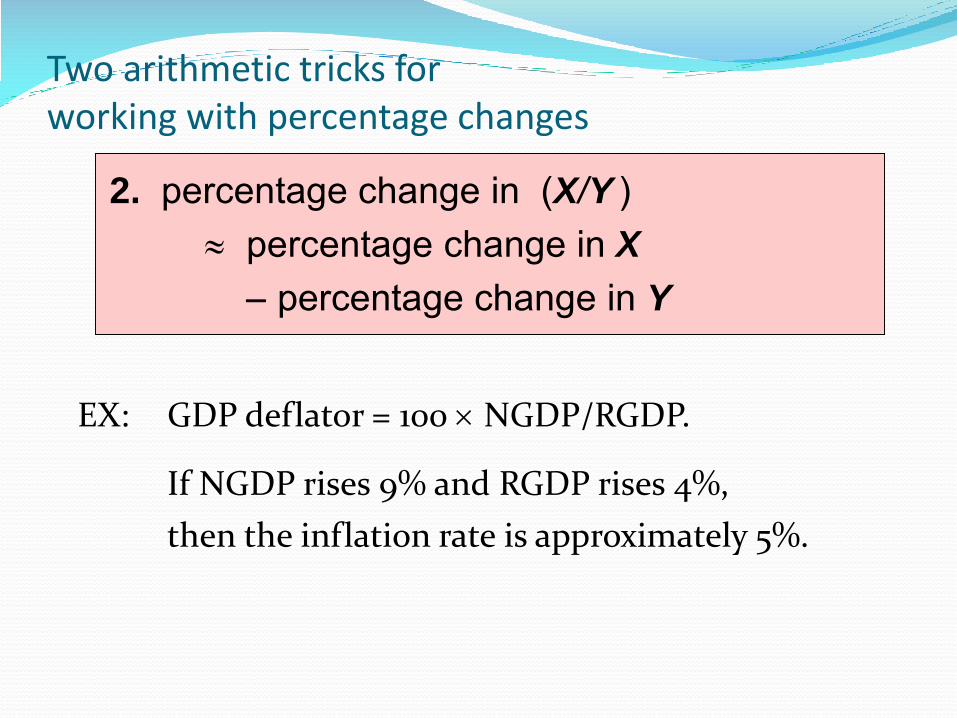
Two arithmetic tricks for working with percentage changes
EX: GDP deflator = 100 NGDP/RGDP.
If NGDP rises 9% and RGDP rises 4%,
then the inflation rate is approximately 5%.
2. percentage change in (X/Y ) percentage change in X
percentage change in Y
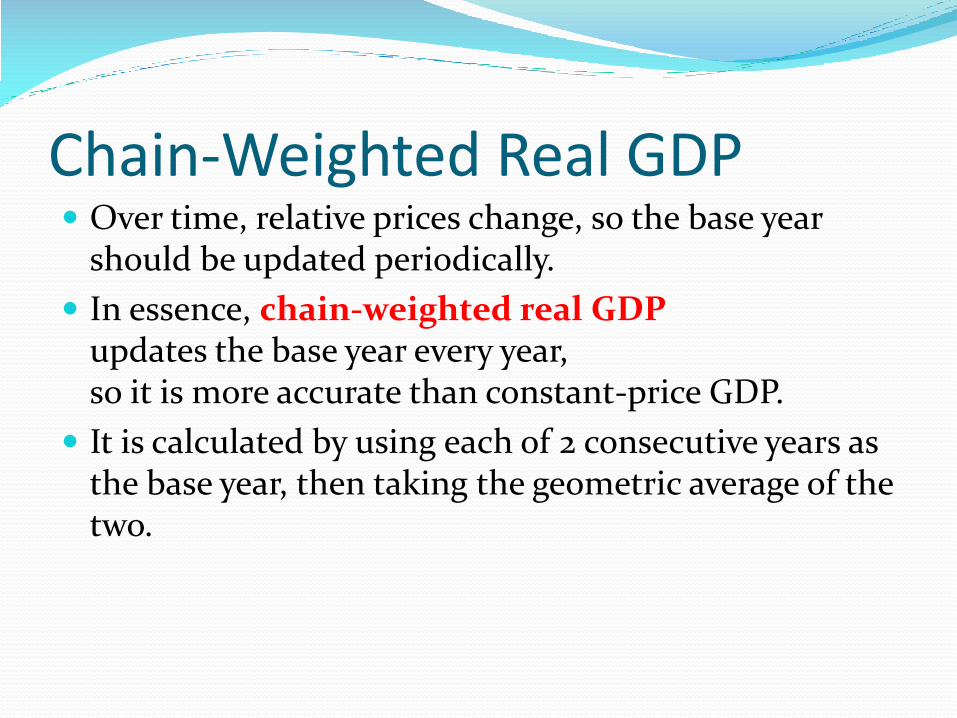
Chain-Weighted Real GDP Over time, relative prices change, so the base year
should be updated periodically.
In essence, chain-weighted real GDPupdates the base year every year, so it is more accurate than constant-price GDP.
It is calculated by using each of 2 consecutive years as the base year, then taking the geometric average of the two.
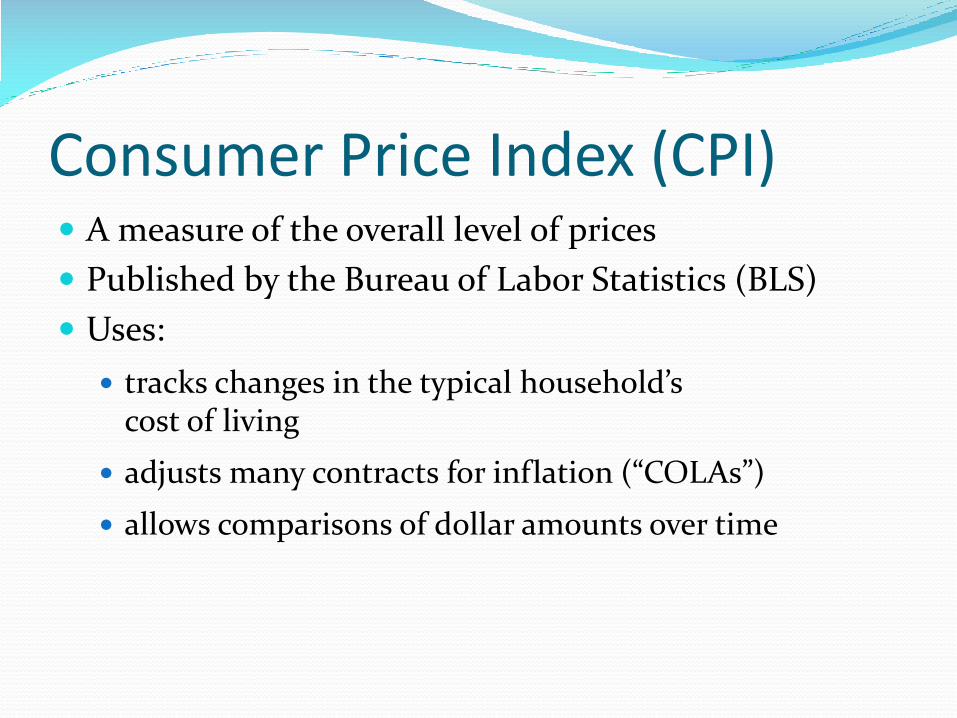
Consumer Price Index (CPI) A measure of the overall level of prices
Published by the Bureau of Labor Statistics (BLS)
Uses:
tracks changes in the typical household’s cost of living
adjusts many contracts for inflation (“COLAs”)
allows comparisons of dollar amounts over time
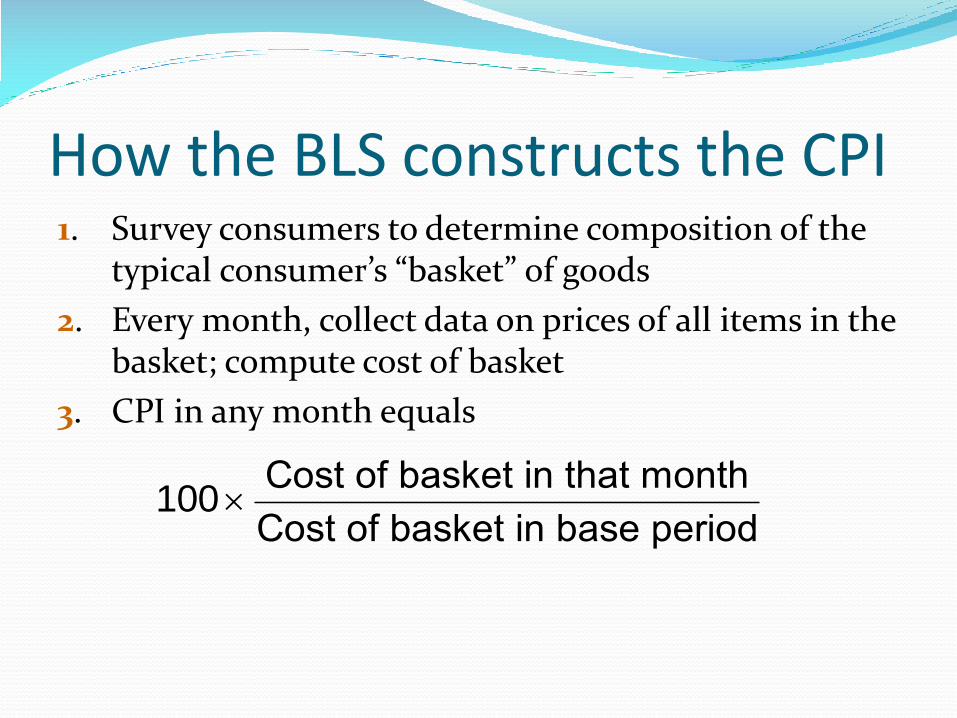
How the BLS constructs the CPI1. Survey consumers to determine composition of the
typical consumer’s “basket” of goods
2. Every month, collect data on prices of all items in the basket; compute cost of basket
3. CPI in any month equals
Cost of basket in that monthCost of basket in base period
100
NOW YOU TRY
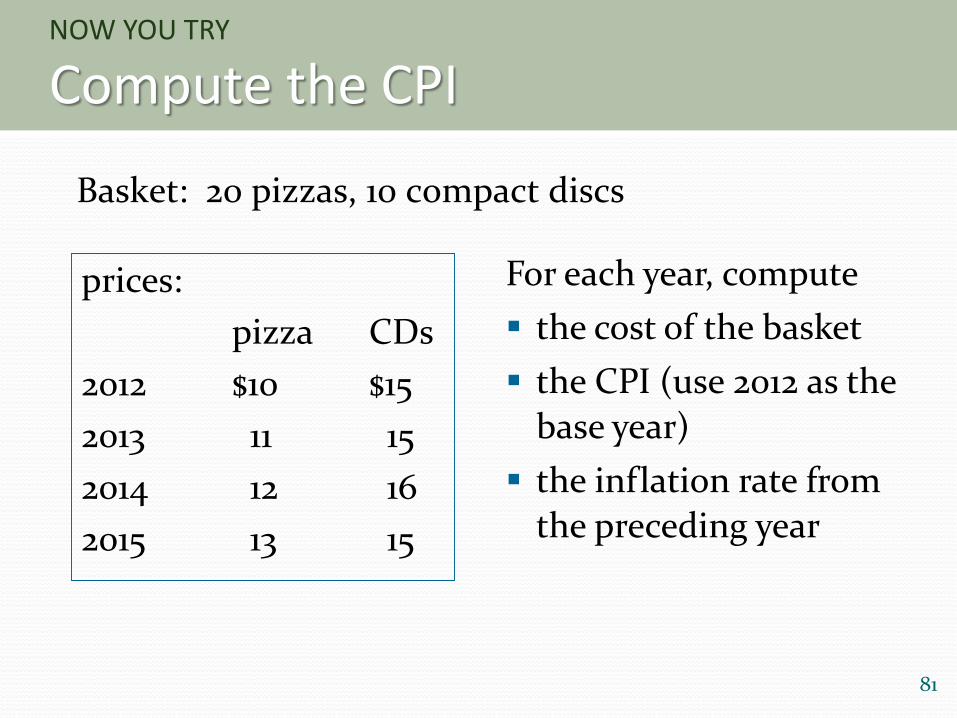
Compute the CPI
81
Basket: 20 pizzas, 10 compact discs
prices:
pizza CDs
2012 $10 $15
2013 11 15
2014 12 16
2015 13 15
For each year, compute
the cost of the basket
the CPI (use 2012 as the
base year)
the inflation rate from
the preceding year
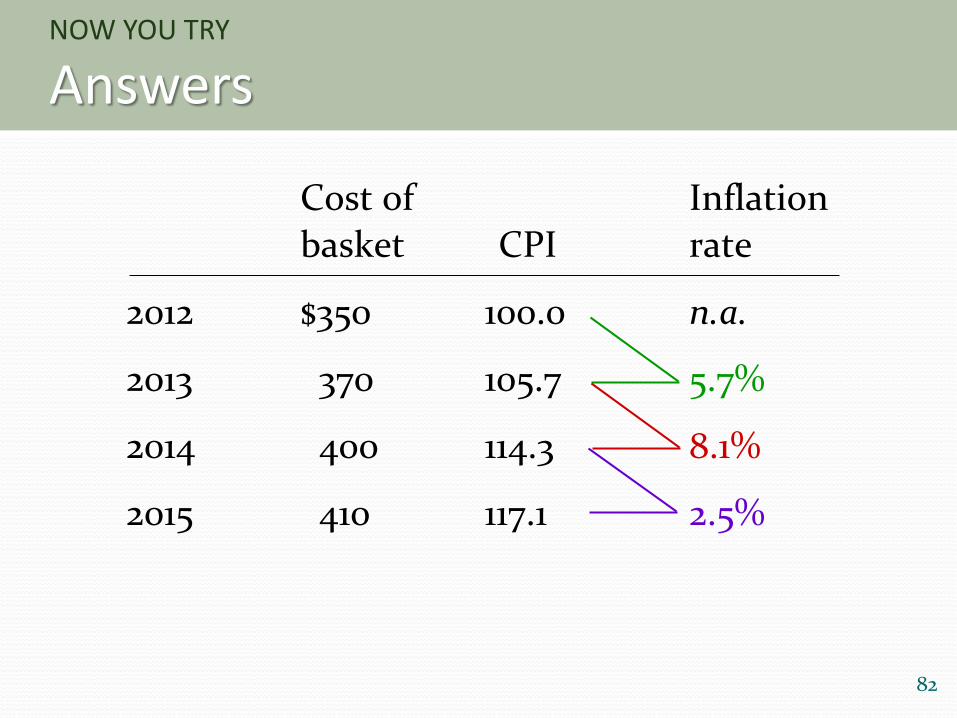
NOW YOU TRY
Answers
82
Cost of Inflation
basket CPI rate
2012 $350 100.0 n.a.
2013 370 105.7 5.7%
2014 400 114.3 8.1%
2015 410 117.1 2.5%
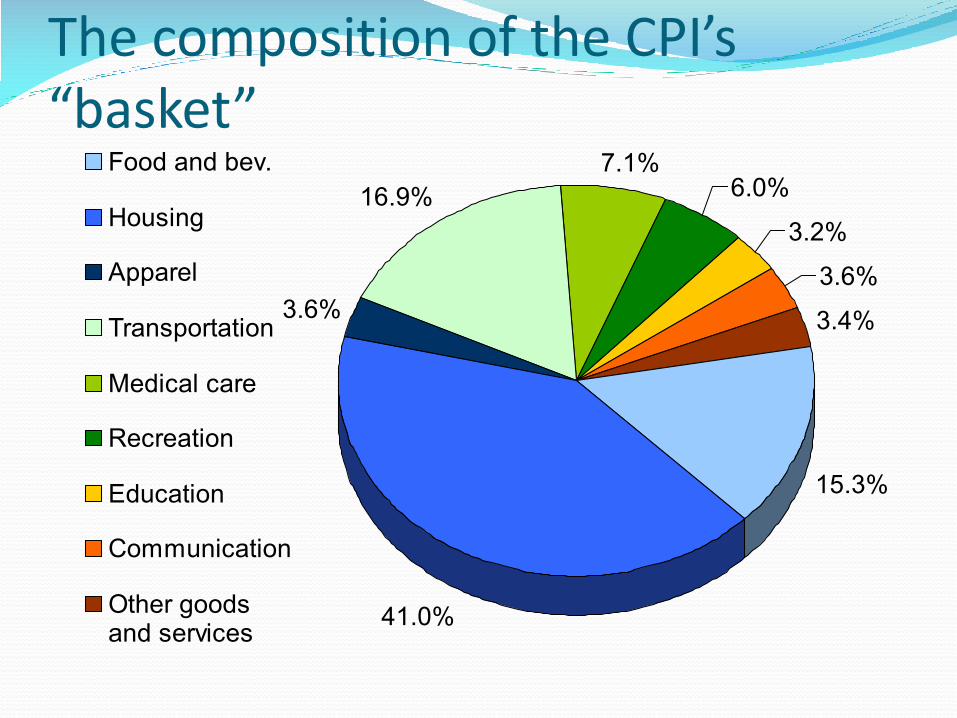
The composition of the CPI’s “basket”
15.3%
41.0%
3.6%
16.9%7.1%
6.0%
3.2%
3.6%
3.4%
Food and bev.
Housing
Apparel
Transportation
Medical care
Recreation
Education
Communication
Other goodsand services
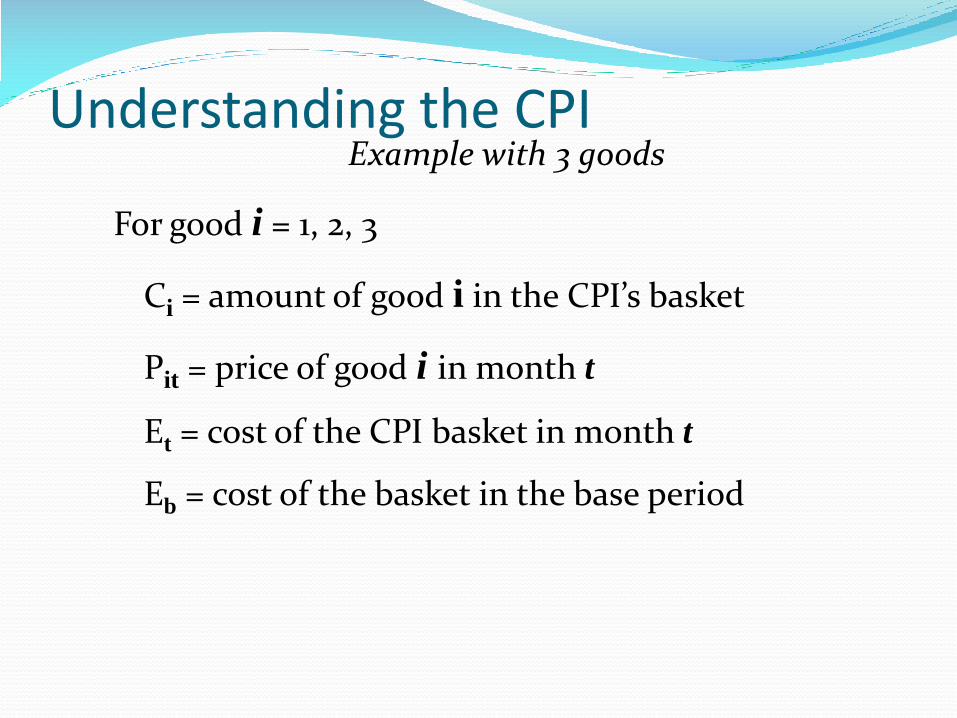
Understanding the CPIExample with 3 goods
For good i = 1, 2, 3
Ci = amount of good i in the CPI’s basket
Pit = price of good i in month t
Et = cost of the CPI basket in month t
Eb = cost of the basket in the base period
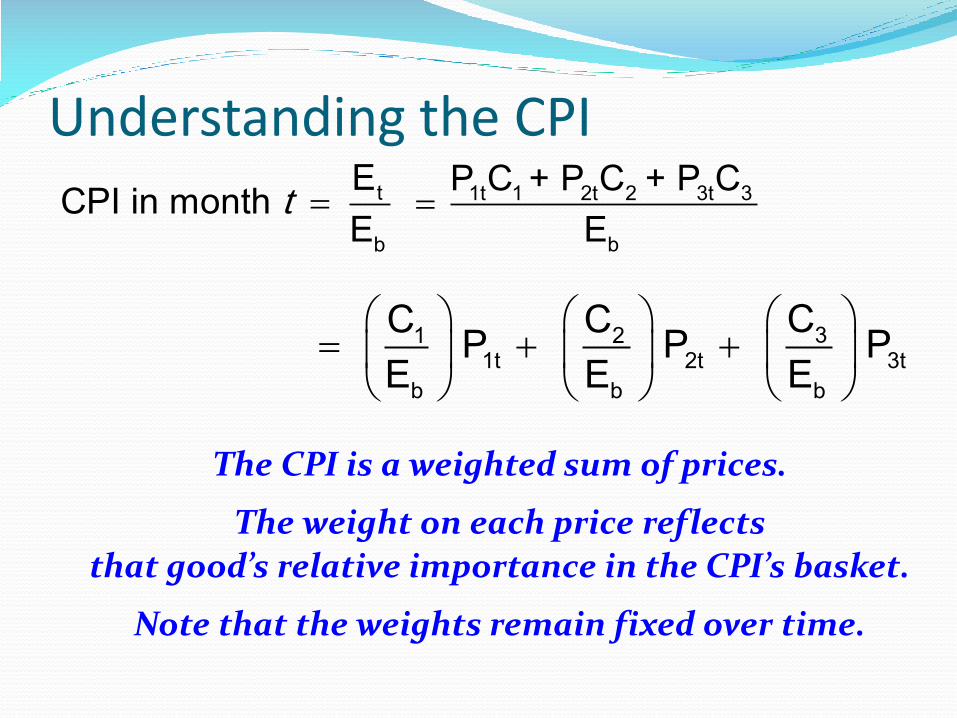
Understanding the CPIt
b
ECPI in month E
t 1t 1 2t 2 3t 3
b
P C + P C + P CE
31 21t 2t 3t
b b b
CC CP P PE E E
The CPI is a weighted sum of prices.
The weight on each price reflects
that good’s relative importance in the CPI’s basket.
Note that the weights remain fixed over time.
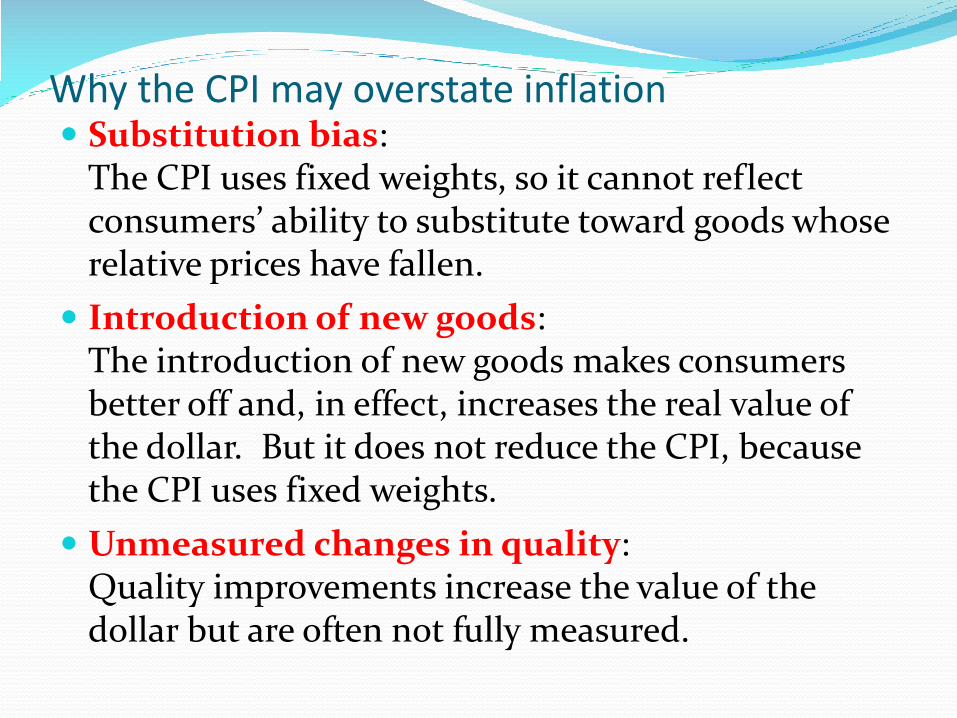
Why the CPI may overstate inflation Substitution bias:
The CPI uses fixed weights, so it cannot reflect consumers’ ability to substitute toward goods whose relative prices have fallen.
Introduction of new goods: The introduction of new goods makes consumers better off and, in effect, increases the real value of the dollar. But it does not reduce the CPI, because the CPI uses fixed weights.
Unmeasured changes in quality: Quality improvements increase the value of the dollar but are often not fully measured.
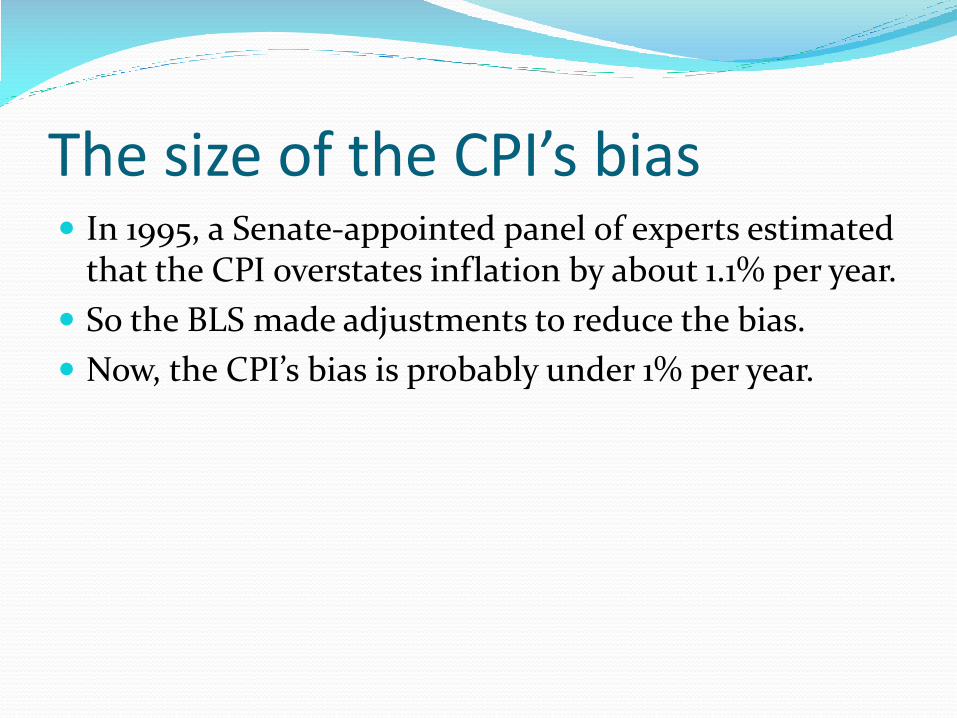
The size of the CPI’s bias In 1995, a Senate-appointed panel of experts estimated
that the CPI overstates inflation by about 1.1% per year.
So the BLS made adjustments to reduce the bias.
Now, the CPI’s bias is probably under 1% per year.
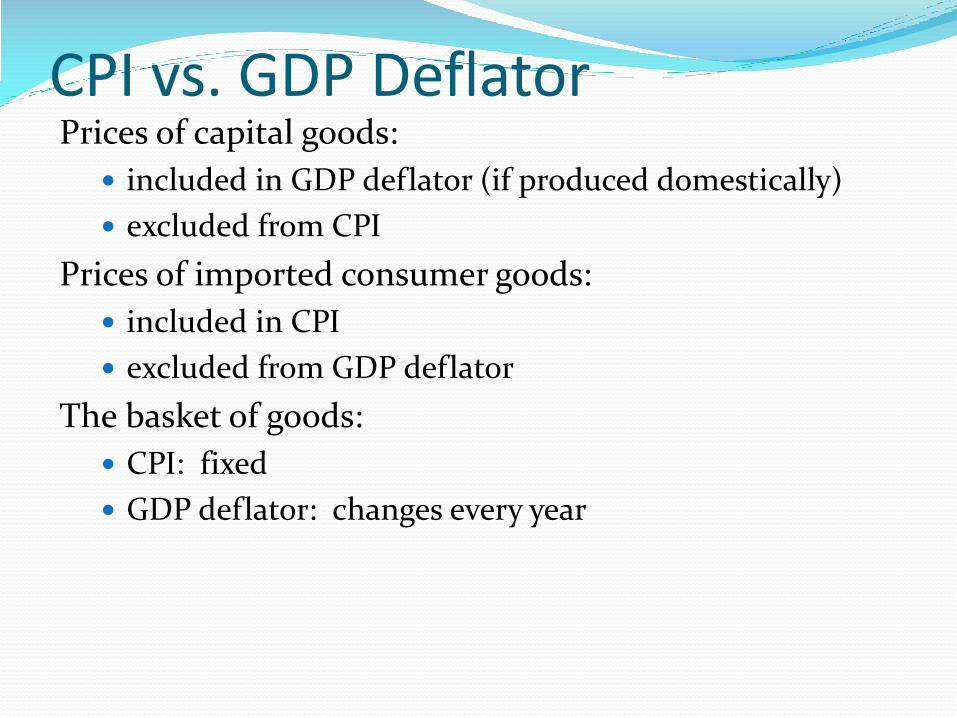
CPI vs. GDP DeflatorPrices of capital goods:
included in GDP deflator (if produced domestically)
excluded from CPI
Prices of imported consumer goods:
included in CPI
excluded from GDP deflator
The basket of goods:
CPI: fixed
GDP deflator: changes every year
-2
0
2
4
6
8
10
12
14
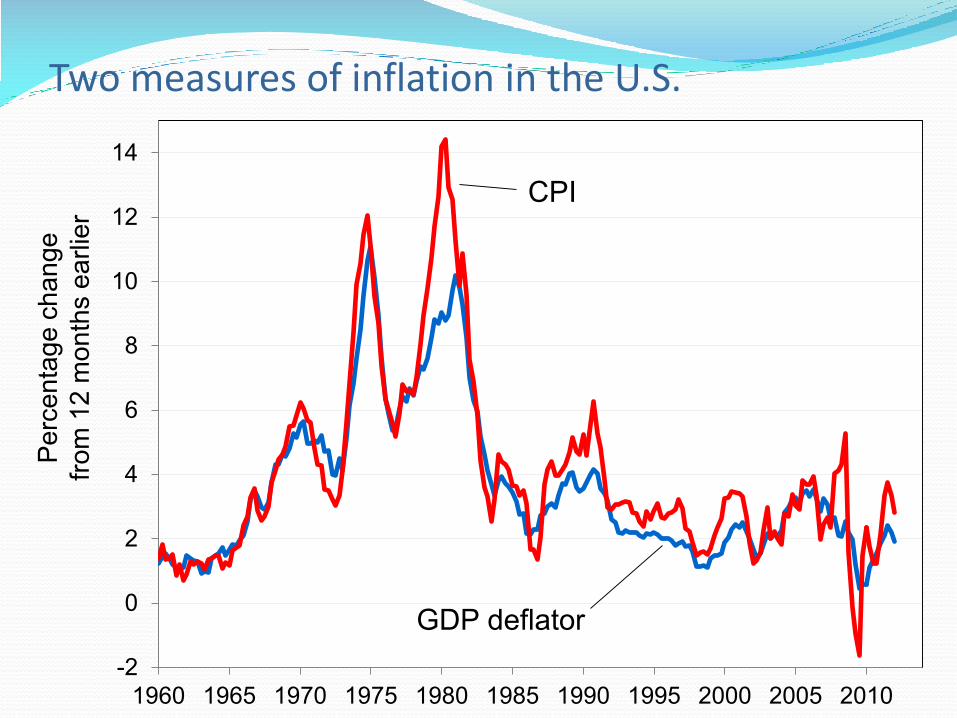
1960 1965 1970 1975 1980 1985 1990 1995 2000 2005 2010
Two measures of inflation in the U.S.Pe
rcen
tage
cha
nge
from
12
mon
ths
earli
er
CPI
GDP deflator
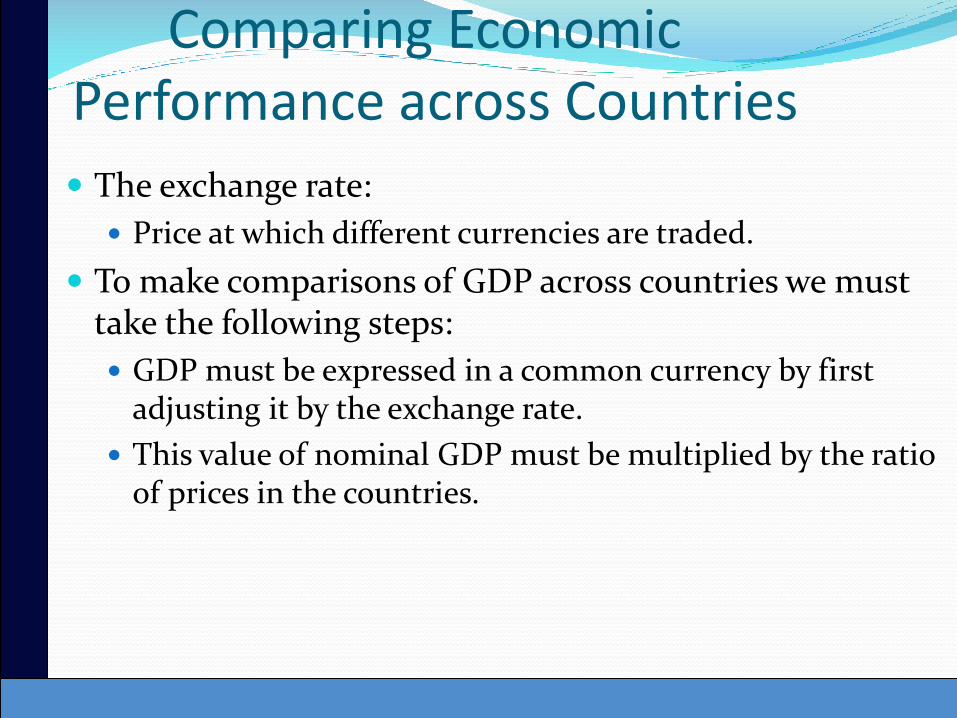
Comparing Economic Performance across Countries
The exchange rate:
Price at which different currencies are traded.
To make comparisons of GDP across countries we must take the following steps:
GDP must be expressed in a common currency by first adjusting it by the exchange rate.
This value of nominal GDP must be multiplied by the ratio of prices in the countries.
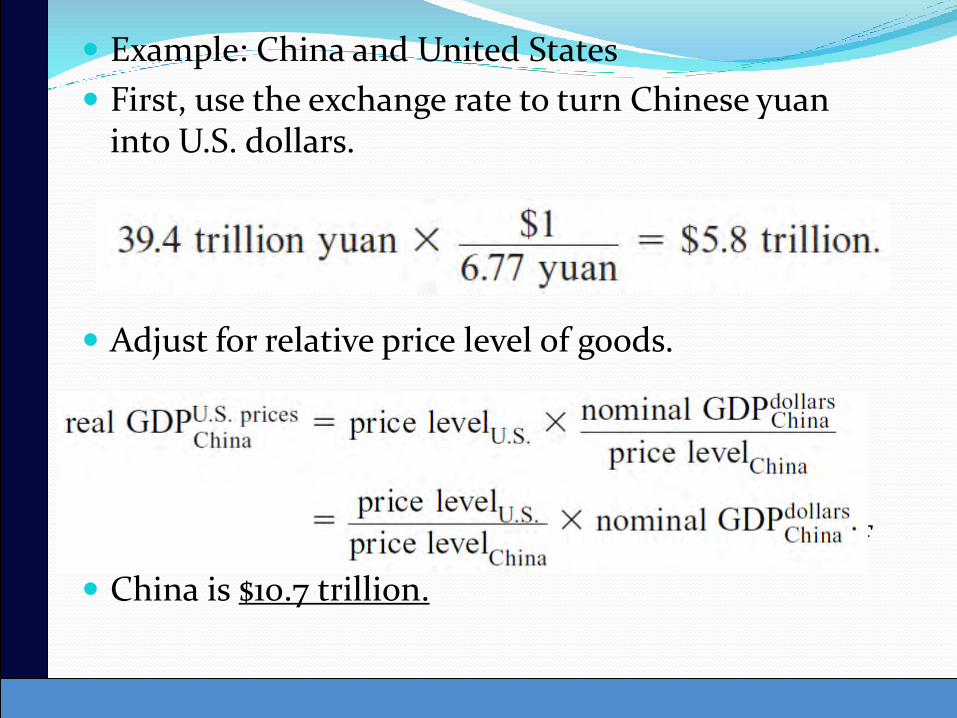
Example: China and United States
First, use the exchange rate to turn Chinese yuan into U.S. dollars.
Adjust for relative price level of goods.
Price level ratio is about (1/0.54), so the real GDP of
China is $10.7 trillion.
Comparison of countries:
In general, rich countries tend to have higher price levels than poor countries.
This is mainly because poor countries have lower wages.
Categories of the population employed
working at a paid job
unemployed not employed but looking for a job
labor force the amount of labor available for producing goods and services; all employed plus unemployed persons
not in the labor forcenot employed, not looking for work
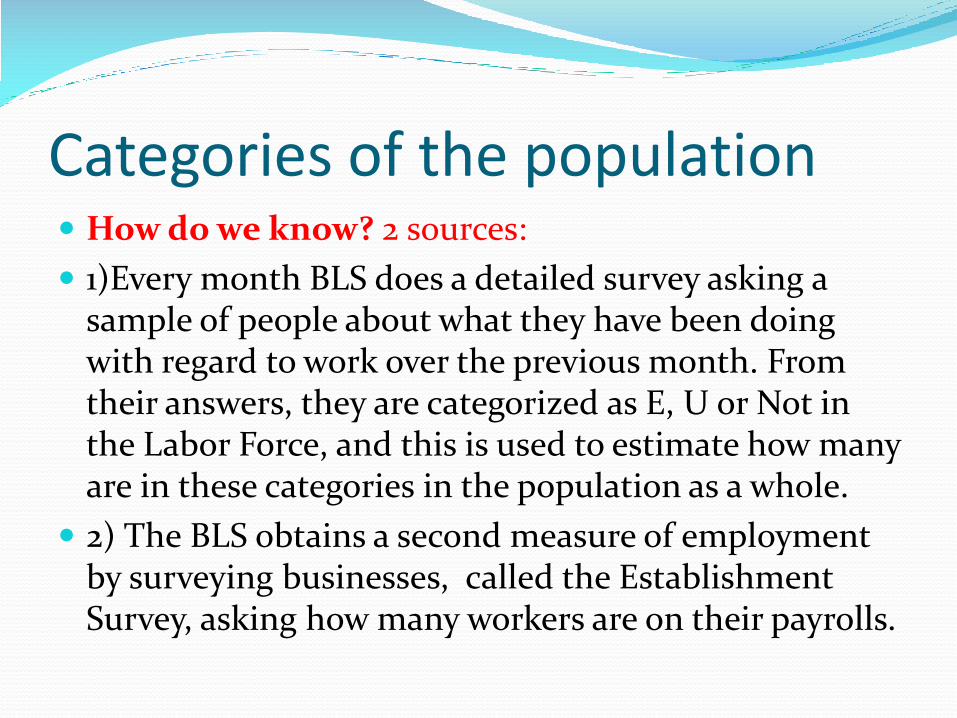
Categories of the population How do we know? 2 sources:
1)Every month BLS does a detailed survey asking a sample of people about what they have been doing with regard to work over the previous month. From their answers, they are categorized as E, U or Not in the Labor Force, and this is used to estimate how many are in these categories in the population as a whole.
2) The BLS obtains a second measure of employment by surveying businesses, called the Establishment Survey, asking how many workers are on their payrolls.
Categories of the population Neither measure is perfect, and they occasionally
diverge due to:
treatment of self-employed persons
new firms not counted in establishment survey
technical issues involving population inferences from sample data
Two important labor force concepts unemployment rate
percentage of the labor force that is unemployed
labor force participation rate the fraction of the adult population that “participates” in the labor force, i.e. is working or looking for work
NOW YOU TRY
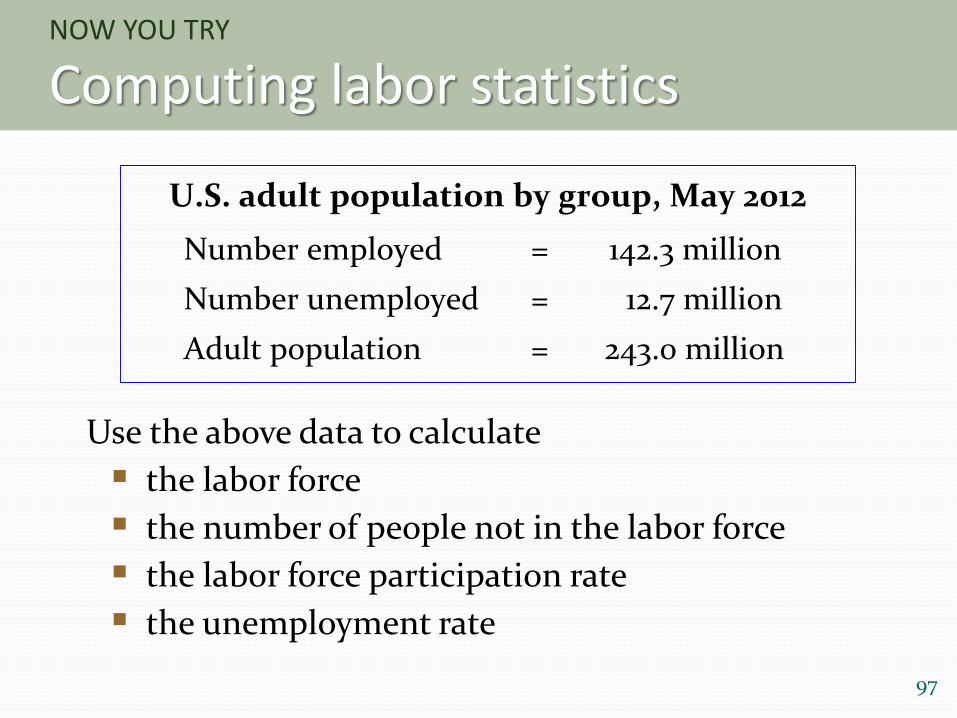
Computing labor statistics
97
U.S. adult population by group, May 2012
Number employed = 142.3 million
Number unemployed = 12.7 million
Adult population = 243.0 million
Use the above data to calculate
the labor force
the number of people not in the labor force
the labor force participation rate
the unemployment rate
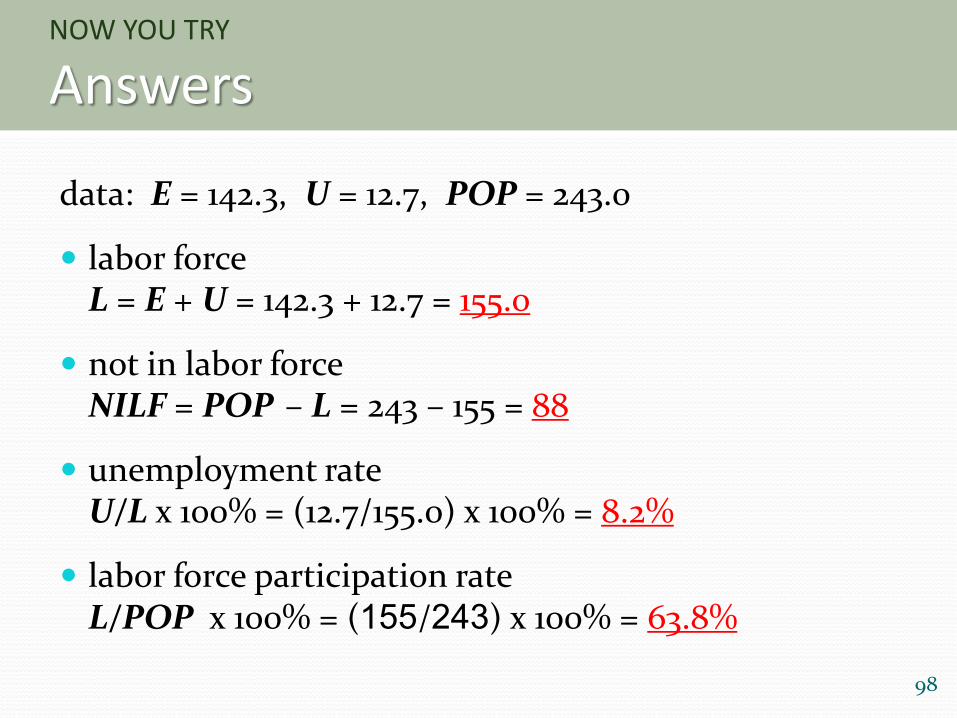
NOW YOU TRY
Answers
data: E = 142.3, U = 12.7, POP = 243.0
labor forceL = E + U = 142.3 + 12.7 = 155.0
not in labor forceNILF = POP – L = 243 – 155 = 88
unemployment rateU/L x 100% = (12.7/155.0) x 100% = 8.2%
labor force participation rateL/POP x 100% = (155/243) x 100% = 63.8%
98
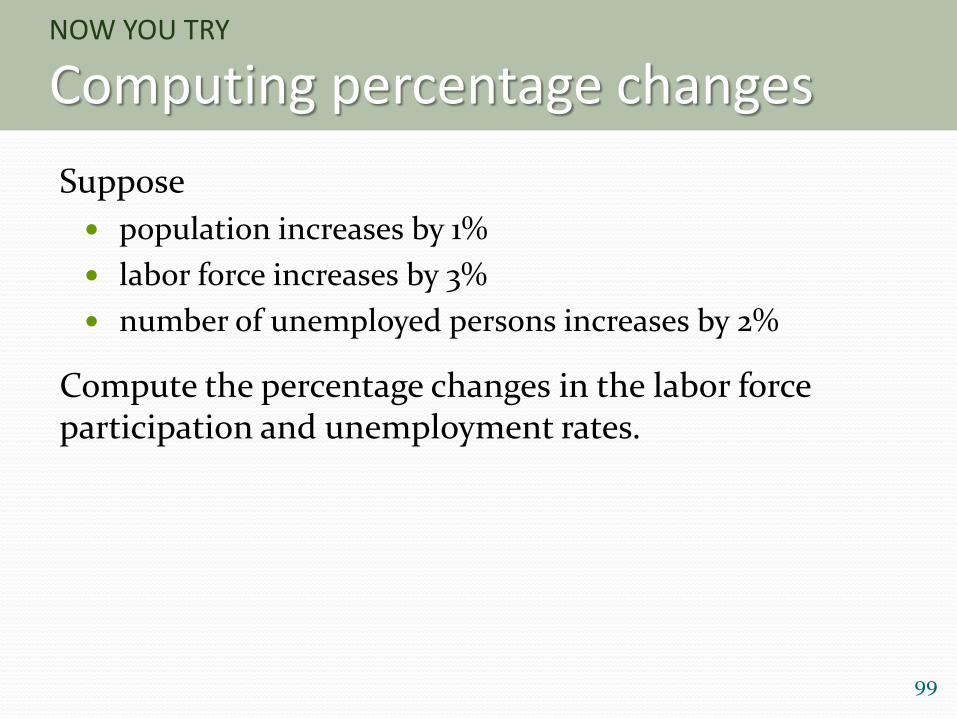
NOW YOU TRY
Computing percentage changes
Suppose
population increases by 1%
labor force increases by 3%
number of unemployed persons increases by 2%
Compute the percentage changes in the labor force participation and unemployment rates.
99
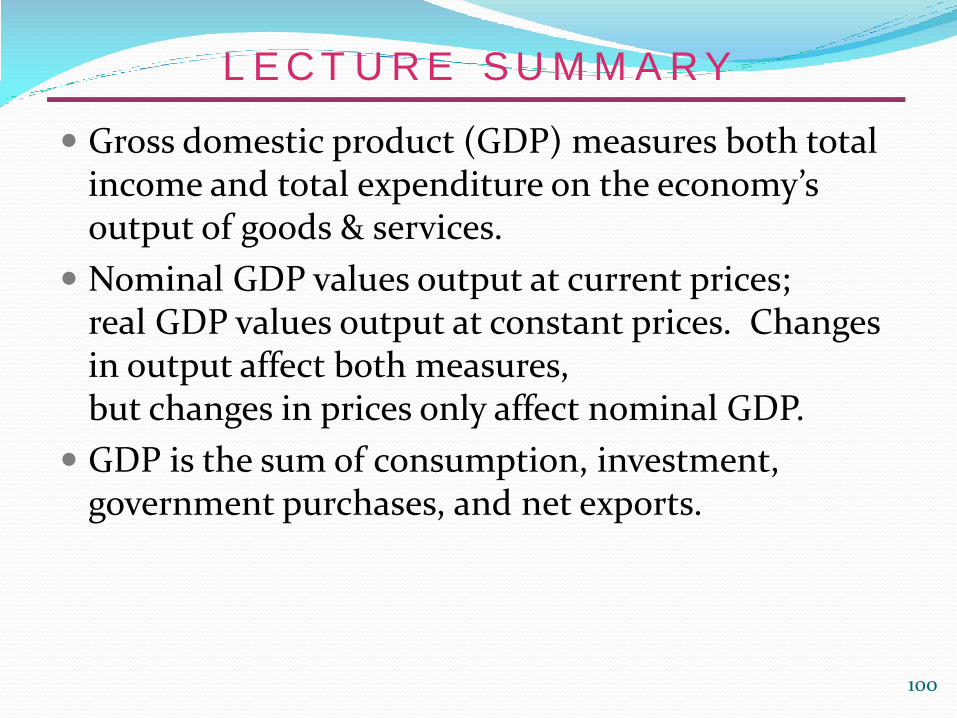
L E C T U R E S U M M A R Y
Gross domestic product (GDP) measures both total income and total expenditure on the economy’s output of goods & services.
Nominal GDP values output at current prices; real GDP values output at constant prices. Changes in output affect both measures, but changes in prices only affect nominal GDP.
GDP is the sum of consumption, investment, government purchases, and net exports.
100
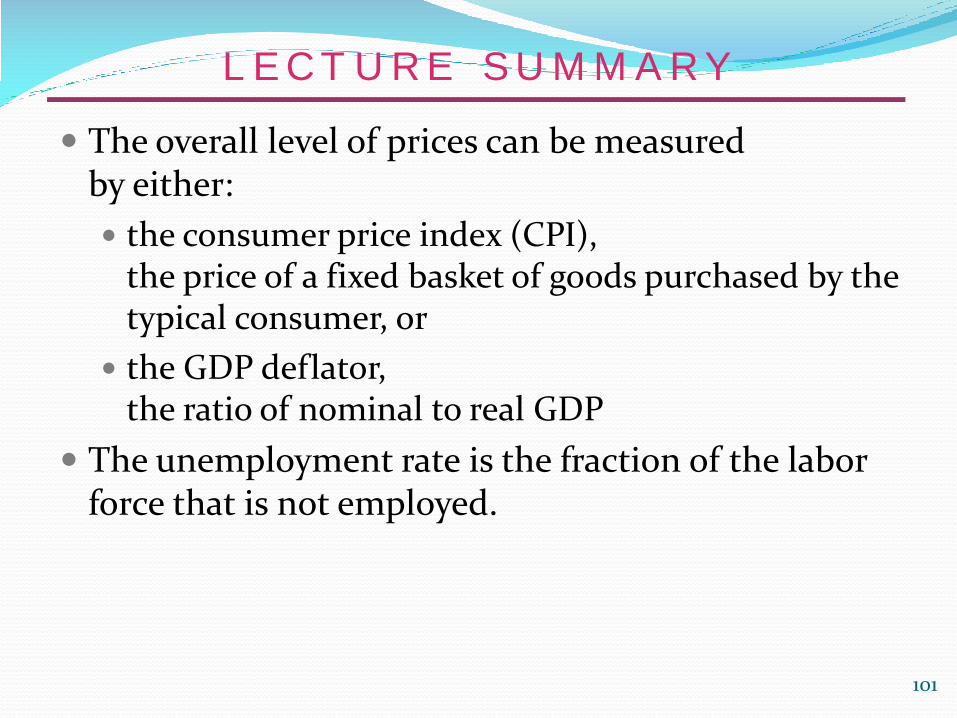
L E C T U R E S U M M A R Y
The overall level of prices can be measured by either:
the consumer price index (CPI), the price of a fixed basket of goods purchased by the typical consumer, or
the GDP deflator, the ratio of nominal to real GDP
The unemployment rate is the fraction of the labor force that is not employed.
101