Embed Size (px)
Citation preview
EcoNBC feasibility study Transforming New Borg El Arab into an EcoCity New Borg El Arab was inaugurated in 1988 and is seen as the natural extension of Alexandria, as well as one of the most important industrial areas in Egypt. Transforming New Borg El Arab City into an EcoCity was one of the main drivers for EcoNBC project (EcoCity Capacity Building in New Borg El Arab City). Carrying out a Feasibility Study to explore more in detail the viability of the idea was one of the first steps to be taken towards that transformation. In this case, it is the result of the joint effort of a team of Finnish and Egyptian experts through a series of structured workshops that took place both in Finland and Egypt, and a number of focused discussions that involved also key stakeholders. An insight into the different economic sectors has been taken and a vision of how the main issues of concern selected, namely Energy, Water and Water, should be approached from each of those sectors has been defined, of course with a special emphasis on the sustainability of the Ecosystem. This has allowed the expert team responsible for this Feasibility Study to propose practical solutions in the form of scenarios. In the case of some sectors where reliable data was available for the calculations, these scenarios have been developed down to their associated impacts. In consequence, by providing a more grounded understanding of the present situation and the opportunities for the future, this Feasibility Study can be useful for decision makers and planners, but also for investors, funding organizations and donors.
ISBN 978-951-38-8301-0 (URL: http://www.vttresearch.com/impact/publications) ISSN-L 2242-1211 ISSN 2242-122X (Online)
VT
T T
EC
HN
OL
OG
Y 2
20
Ec
oN
BC
fea
sibility stu
dy
•VISIONS•S
CIE
NC
E•T
ECHNOLOGY•R
ES
EA
RC
HHIGHLIGHTS
220
EcoNBC feasibility study Transforming New Borg El Arab into an EcoCity

VTT TECHNOLOGY 220
EcoNBC feasibility study Transforming New Borg El Arab into an EcoCity
Carmen Antuña Rozado, Åsa Hedman, Pekka Tuominen, Francesco Reda
VTT Technical Research Centre of Finland Ltd.
Yehia ElMaghary, Ahmed ElShazly, Mona GamalEldin, Ali Kamel, Abdelazim Negm, Ahmed Tawfik, Heba Saeed
Ahmed AbdelMonteleb, Mohamed Ayeldeen, Waled Dawoud, Bahaa Elboshy, Ghada Elshafei
E-JUST Egypt-Japan University of Science and Technology
Mohamed Shahin
Alexandria University
Ahmed Yousry
Cairo University

ISBN 978-951-38-8301-0 (URL: http://www.vttresearch.com/impact/publications)
VTT Technology 220
ISSN-L 2242-1211 ISSN 2242-122X (Online)
Copyright © VTT 2015
JULKAISIJA – UTGIVARE – PUBLISHER
Teknologian tutkimuskeskus VTT Oy PL 1000 (Tekniikantie 4 A, Espoo) 02044 VTT Puh. 020 722 111, faksi 020 722 7001
Teknologiska forskningscentralen VTT Ab PB 1000 (Teknikvägen 4 A, Esbo) FI-02044 VTT Tfn +358 20 722 111, telefax +358 20 722 7001
VTT Technical Research Centre of Finland Ltd P.O. Box 1000 (Tekniikantie 4 A, Espoo) FI-02044 VTT, Finland Tel. +358 20 722 111, fax +358 20 722 7001

3
Contents
1 Executive summary ........................................................................................................... 52 Introduction ...................................................................................................................... 6
3 Background ....................................................................................................................... 73.1 Who is EcoNBC FS meant for? ................................................................................. 73.2 Summary of the current situation .............................................................................. 9
3.2.1 City planning ................................................................................................ 93.2.2 Energy ........................................................................................................ 113.2.3 Water .......................................................................................................... 133.2.4 Waste .......................................................................................................... 13Domestic and industrial waste water ...................................................................... 13Solid waste management ........................................................................................ 143.2.5 Transport .................................................................................................... 14Existing road network ............................................................................................ 14Existing public transport system ............................................................................. 14Existing pedestrian and bicycle transport................................................................ 14Railway line and stations in NBC ........................................................................... 15Borg el Arab International Airport ......................................................................... 15
3.3 Stakeholders involved ............................................................................................. 15
4 Scope .............................................................................................................................. 164.1 Sectors considered .................................................................................................. 16
4.1.1 Residential .................................................................................................. 164.1.2 Commercial/Public facilities ....................................................................... 174.1.3 Industrial ..................................................................................................... 184.1.4 Services/Utilities ......................................................................................... 194.1.5 Transport .................................................................................................... 22
5 Vision ............................................................................................................................. 255.1 General overview .................................................................................................... 26
5.1.1 Energy ........................................................................................................ 265.1.2 Water .......................................................................................................... 265.1.3 Waste .......................................................................................................... 265.1.4 Other independent issues ............................................................................. 27
5.2 Vision and targets per sector ................................................................................... 275.2.1 Residential .................................................................................................. 275.2.2 Commercial/Public facilities ....................................................................... 285.2.3 Industrial ..................................................................................................... 295.2.4 Services/Utilities ......................................................................................... 305.2.5 Transport .................................................................................................... 30
6 Scenarios ........................................................................................................................ 31
6.1 General scenarios .................................................................................................... 31

4
6.1.1 BAU scenario ............................................................................................. 326.1.2 LIS scenario ................................................................................................ 326.1.3 HIS scenario ............................................................................................... 33
6.2 Scenarios per sector ................................................................................................ 346.2.1 Residential sector ........................................................................................ 346.2.2 Transport sector .......................................................................................... 39
7 Impacts ........................................................................................................................... 43
7.1 Residential sector .................................................................................................... 437.1.1 Energy and CO2 emissions .......................................................................... 437.1.2 Cost effectiveness analysis .......................................................................... 457.1.3 Social impact analysis ................................................................................. 47
7.2 Transport sector ...................................................................................................... 487.2.1 Evaluation process for projecting the transportation energy consumption and
emissions under different policies ............................................................... 487.2.2 Transport Forecast Models .......................................................................... 497.2.3 Energy/Emission Rates in NBC................................................................... 507.2.4 The Computer System “TraEco” ................................................................. 537.2.5 Evaluation of Scenarios ............................................................................... 547.2.6 Cost analysis ............................................................................................... 57
8 Engagement of stakeholders ............................................................................................ 638.1 Challenges and opportunities of eco-cities from investors point of view .................. 63
8.1.1 Challenges .................................................................................................. 648.1.2 Opportunities .............................................................................................. 66
9 Pioneering examples ....................................................................................................... 689.1 Textile industry case study ...................................................................................... 68
9.1.1 Introduction ................................................................................................ 689.1.2 Material and Methods ................................................................................. 689.1.3 Results and discussion................................................................................. 68
9.2 Paper industry case study ........................................................................................ 719.2.1 Introduction ................................................................................................ 719.2.2 Material and methods .................................................................................. 719.2.3 Results and discussion................................................................................. 72
9.3 International examples ............................................................................................ 739.3.1 Freiburg, Germany ...................................................................................... 749.3.2 Vancouver, Canada ..................................................................................... 759.3.3 Viikki, Finland ............................................................................................ 77
10 Benefits and barriers ....................................................................................................... 7811 References ...................................................................................................................... 80
Annex 1 and 2Abstract

5
1 Executive summary
New Borg El Arab was inaugurated in 1988 and is seen as the natural extension ofAlexandria, as well as one of the most important industrial areas in Egypt. TransformingNew Borg El Arab City into an EcoCity was one of the main drivers for EcoNBC project(EcoCity Capacity Building in New Borg El Arab City). Carrying out Feasibility Study toexplore more in detail the viability of the idea was one of the first steps to be takentowards that transformation. In this case, it is the result of the joint effort of team ofFinnish and Egyptian experts through series of structured workshops that took placeboth in Finland and Egypt, and number of focused discussions that involved also keystakeholders.
An insight into the different economic sectors has been taken and vision of how themain issues of concern selected, namely Energy, Water and Water, should beapproached from each of those sectors has been defined, of course with specialemphasis on the sustainability of the Ecosystem. This has allowed the expert teamresponsible for this Feasibility Study to propose practical solutions in the form ofscenarios. In the case of some sectors where reliable data was available for thecalculations, these scenarios have been developed down to their associated impacts.
In consequence, by providing more grounded understanding of the present situationand the opportunities for the future, this Feasibility Study can be useful for decisionmakers and planners, but also for investors, funding organizations and donors.
6
2 Introduction
This Feasibility Study (FS) is one of the outcomes of EcoNBC, EcoCity Capacity Buildingin New Borg El Arab City (NBC), project funded by the Institutional CooperationInstrument (ICI) under the Ministry for Foreign Affairs of Finland. It was carried out byteam of experts from VTT Technical Research Centre of Finland Ltd and Egypt-JapanUniversity of Science and Technology (E-JUST), and its main objective is to evaluate in asmuch detail as possible the idea of turning New Borg El Arab (NBC) into an EcoCity.
It is generally accepted that FS should help to identify: a) if the idea is viable or not; b)useful facts and figures to aid decision-making; and c) alternative approaches andsolutions for putting the idea into practice. The first discussions among the expertsinvolved were aimed at defining the framework for the development of FS intended asshown in Figures and 2, as well as to establish the Table of Content (see pages and 4)and the most suitable methodology for developing the agreed content. In addition to theprevious, time horizon of 20 years was established for EcoNBC FS.
Figure 1. Main components agreed for EcoNBC FS. (Carmen Antuña, VTT)
It was decided that the Table of Content of the EcoNBC FS should include the Scope ofthe study, the Vision of NBC as an EcoCity, the possible sustainability Scenarios and theImpacts of the proposed Scenarios. The measurements and calculations associated tothe Impacts become particularly important to assess and validate the viability of theScenarios defined.
To complete the FS and to illustrate what can be achieved in practice, it seemednecessary to show some pioneering examples from NBC and also from abroad. Theexamples selected from NBC correspond to some of the main industries: textile andpaper. Their inclusion in this FS aims at highlighting the already existing local initiativestowards more sustainable industry, which might hopefully inspire other industries tofollow the example.

7
Figure 2. FS development process. (Carmen Antuña, VTT)
The background to this FS is also provided together with reflection on the benefits andbarriers of undertaking FS to transfer NBC into an EcoCity.
One of the biggest challenges encountered has been the unavailability of necessary dataor the lack of reliability of the data available. Therefore number of decisions have beenmade in order to overcome this situation, which will be explained more in detail in thecorresponding chapters.
From the beginning and for the sake of consistency, it was also seen as necessary to alignthe content and methodology of the FS with the EcoCity Roadmap for Egypt(http://www.vtt.fi/inf/pdf/technology/2015/T215.pdf) another of EcoNBC project’smain outcomes, aiming at developing an EcoCity Vision for Egypt. Therefore, both taskshave been carried out in parallel.
3 Background
3.1 Who is EcoNBC FS meant for?
NBC was inaugurated in November 1988 and is currently one of the major residentialand industrial zones in Alexandria. NBC is seen as the natural extension of AlexandriaCity. It was constructed, as many other new cities, for absorbing the current and futurepopulation, providing more work opportunities for youth and decreasing desertification.It is regarded as the most important industrial zone in Egypt, covering an area of morethan 2000 hectares and comprising about 1700 industrial facilities and institutions thatprovide the investors and owners of all small and medium projects with needed facilitiesand services.

8
With NBC being the home city of E-JUST, E-JUST got the idea and the ambitious goal oftransferring NBC into the first EcoCity in Egypt for several reasons:
it is new city with expanding potentials and the expansion plans of NBC arecurrently under consideration,
it is an industrial city with vast land capacity that exists around the industrialarea, its infrastructure is fairly new and could be readily upgraded if needed,
it has Centre of Action, viz., the newly established E-JUST, in addition to theexisting City of Scientific and Technical Research (CSTR), E-JUST has land whichcould be used for production of Green Energy as Wind, Solar and bio fuel (e.g.,plantation and production of jojoba or palm oil),
the EcoCity of NBC will offer endless Research Topics in most of the fields of E-JUST and numerous joint research topics with Research Institutes as VTT andfinally
other cities in Egypt can take examples from NBC.
The first step to be taken in order to transfer city into an EcoCity is to undertakeFeasibility Study (FS). The FS undertaken for NBC consists mainly of an insight into thedifferent economic sectors as residential, commercial, industrial, services and transport,and vision of how the main issues of concern as Energy, Water and Waste Managementshould be approached modified and/or improved putting great emphasis on thesustainability of our Ecosystem. In other words, it would describe few practicalalternatives on how to decrease the pollution at NBC as far as practically possible,through minimizing the consumption of natural resources and depending mainly onrenewable resources. Hand in hand with this approach, an effective and comprehensiveprogram for raising the awareness of the inhabitants of NBC, particularly the newgenerations should be given. Training courses for school teachers and NGO’s memberswould be arranged, in addition to Workshops, informative meetings and prizes to schoolchildren.
Accordingly, the suggested solutions presented in the FS will in the first place beimportant to decision makers and planners, who are concerned with improving the eco-social and environmental conditions, particularly those of NBC, which is the target ofthis study and generally of other Egyptian cities. The FS and the alternatives it containswill be also of particular interest to researchers, engineers and scientists who couldinvestigate them thoroughly and pursue the ideas they contain. In addition, the FS willbe of considerable importance for the society of NBC as whole, and even for theEgyptian society, since it is intended to be an example that other cities in the countrycould follow.
On the other hand, the FS is essentially meant for Investors, Funding Organizations andDonors, who will be in position to go through these alternatives and select from them

9
the solutions, which in their opinion are most relevant and applicable, taking intoaccount the eco-social and environmental aspects
3.2 Summary of the current situation
3.2.1 City planning
New Borg El Arab City has major development plans underway and the city is expectedto grow substantially in the future, multiplying the current population many times over.The current Strategic Master Plan for New Borg El Arab City was approved in 2013 bythe New Urban Communities Authority (NUCA) and the General Organization forPhysical Planning (GOPP) and is presented in Figure 3. It shows the existing andproposed land uses for the city until the year 2032. The current population isapproximately 100 000 inhabitants, which is expected to grow to 750 000 inhabitants by2032.
Figure 3. Approved Strategic Master Plan of New Borg El-Arab City for 2032. (Mahmoud Yousryand Associates in cooperation with AECOM, 2013)
Generally, the city is subdivided into distinct separated main areas, namely: theresidential area (including city, district and neighbourhood service facilities andamenities), the industrial areas east and south of it, and four regional facilities areas, twoof which are located north and east of the residential areas, as well as two regional areasseparating the residential sectors.

10
The residential area of the city is composed of three sectors separated from each otherby regional facilities areas. Each sector has its own service facilities area includingcommercial, administrative, health, educational, religious, cultural and recreationalamenities. The centre of each of these sectors is accessible by railroad and mass transitstations. Residential areas are hierarchically subdivided into residential sectors and 13residential districts as follows:
First Residential Sector: including the first three districts of the city, which arethe most completed, with functioning service facilities at city, district andneighbourhood levels. This sector is separated from the Second and ThirdDistricts by regional services area which include social and sports clubs, and theuniversities and research institutions area.Residential Sectors Two and Three: including Districts from to 10. The mainroads and basic infrastructure has been implemented in these sectors.Residential and services projects are progressing in these districts, in particular,districts 3, 7, and 10. These sectors are separated from Sector Four by anotherregional services area which include allocations for future uses as the medicalcity, recreational and amusement parks, and an agricultural production area forthe city.Residential Sector 4: includes Districts 11, 12 and 13. These are new districts thathave been added to the original master plan of the city to accommodate thefuture expected population which will be generated in response of the newproposed industrial and regional service facilities.
Residential areas are about 830 feddans (a unit of area used in Egypt equivalent to 0.42hectares) and will accommodate 750,000 inhabitants by 2032. In general, northerndistricts of the city are designated for high-end and upper middle housing categories,while middle and low-income housing are located in the southern districts and adjacentto industrial areas. To date, only about 40% of the land allocated for residential use hasbeen developed or designated for development.
Existing industrial areas of the city are located in zones east and south of theresidential districts, and are about 2,100 feddans in area. Currently there are about 700industrial establishments, employing about 45,000 workers. The industrial zonescomprise wide range of industries. To date, about 40% of the land in the existingindustrial zones has not been designated yet.
The strategic master plan has yet proposed number of future industrial areas in theeastern expansion area of the city. These include textile industry complex, an agro-industrial area, technological industries zone, small-scale industries area, in additionto logistic and inventory services such as dry port, warehouses, customs area,vocational center, and wholesale market. In addition, smart village and freespecialized industrial/commercial zone have also been proposed in the eastern

11
expansion area, as it is at the crossroads of the Borg Al Arab international airport east ofthe city and the international road south of it.
The northern area of the new master plan (between the residential sectors and the city’snorthern boundary) is totally designated for future regional service facilities. Proposeduses are hotels area, hypermarket, regional parks, exhibitions grounds, and high-endresidential gated communities.
3.2.2 Energy
What follows is an energy overview for the whole Egypt, which to large extent is alsoapplicable to NBC. In Section 6.1.1 Energy and CO2 emissions, where the impacts of thescenarios proposed for the Residential sector are analysed, more detailed descriptionof the energy demand and the citizens’ behaviour is provided.
Oil and gas
According to the Oil and Gas Journal's 2012 estimate (Oil and Gas Journal, 2012), Egypt'sproven oil reserves are 4.4 billion barrels, an increase from 2010 reserve estimates of3.7 billion barrels. After Egypt's production peak of over 900,000 bbl/d in the 1990s,output began to increasingly decline as oil fields matured. However, ongoing successfulexploration has led to new production from smaller fields and enhanced oil recoverytechniques in existing fields have eased the decline at aging fields. In addition, output ofNatural Gas Liquids (NGLs) and lease condensate have increased as result ofexpanding natural gas production and have offset some of the other declines in liquidsproduction (EIA, 2013). One of Egypt's challenges is to satisfy increasing domesticdemand for oil in the midst of falling domestic production.
Production of gas nearly tripled between 1998 and 2010. In 2010, Egypt producedroughly 63 billion cubic meters (bcm), exported 18 bcm and consumed 45 bcm (Razavi,2012). The electricity sector is the dominant gas consumer, accounting for 57% of thetotal gas demand. The industrial sector consumes about 11% of total gas consumptionwhile fertilizer and cement industries are also large consumers, accounting for 10% and8% respectively. The petroleum sector uses substantial amount of gas for its own useand re-injection, accounting for 5% of total gas consumption.
Gas is delivered to the residential sector through low-pressure pipeline distributionsystems and in Liquefied Petroleum Gas (LPG) cylinders supplied by retailers.Combined, they account for 2% of the total gas demand, but expected to grow at fastpace (about 15% p.a.). Finally, the use of Compressed Natural Gas (CNG) in vehiclesaccounts for about 2% of total gas consumption; all taxis in Cairo area must now run onCNG.

12
Hydro energy
Most of the available hydropower energy resources in Egypt are mainly located on theRiver Nile. They were largely exploited with the construction of the Aswan Reservoir,the High Dam and the Esna Barrage Hydropower Station, with installed capacity of 592MW, 2100 MW and 91 MW respectively and representing total installed capacities of2783 MW. There are 109 MW hydropower projects at Nagah Hamady and AssiutBarrages under construction on the main river. Small capacities of another 60 MW intotal are also available at main canals and branches of the river. These capacities whichsum up to grand total of 2952 MW represent most of the available potential.
Wind energy
Among other renewable energy resources, wind energy offers significant opportunities.Egypt is endowed with an abundance of wind energy resources especially in the SuezGulf area which is considered one of the best sites in the world due to high and stablewind speeds. The West of Suez Gulf Zone offers the most promising sites to constructlarge wind farms due to high wind speeds which range between 8–10 m/s on averageand also due to the availability of large uninhabited desert area. There are also otherpromising sites having wind speed of 7–8 m/s in the east and west of Nile River near thecities of Beni Sweif and Menia Governorates and El-Kharga Oasis in New ValleyGovernorate. Egypt’s progress in implementing wind power projects is ratherimpressive in the sense that the installed capacity is the largest in Africa and in theMiddle East.
Solar energy
Egypt is one of the sun-belt countries enjoying one of the largest potentials of solarenergy. The Solar Atlas issued in 1991 shows that the average direct normal solarradiation is 2000–3200 kWh/m²/year. The sunshine duration ranges between 9–11per day from North to South with very few cloudy days (UNEP, 2008).
Biomass energy
The potential for biomass energy can be classified as agricultural residue, animal by-products, municipal solid waste and sewage sludge. Organic matter is typically the mainconstituent, accounting for up to 60% of solid waste in Egypt, which is above the typicalvalues in most countries and indicates its great value as bio-fuel source. The amountsof Municipal Solid Waste (MSW) produced in Egypt are estimated to be more than 20million tons/year, with the poorer cities generating the least. Power generation fromgasification of sewage sludge in waste water treatment plants is already being used (forexample, the El-Gabal El-Asfer 23 MW plant), with potential generation of 1,000 MWfrom agricultural waste.

13
As an example of energy profile from NBC, an average residential building can bestoreys high, and typical apartment can be around 114 m2 The building haslightweight envelope consisting of double-brick wall with an air gap but withoutthermal insulation, non-ventilated roof and poor indoor air quality. The energy systemconsists of storage hot water tank and heat pump. Considering also the technologiesdescribed more in detail in Section 6.1.2, the annual final district energy demand of theheating and cooling systems for the residential sector in NBC would be around 620 GWh.The final district energy balance, which includes the appliances’ energy consumption,would be around 846 GWh, whereas the CO2 emissions produced would amount to 394
tons.
3.2.3 Water
The city has water treatment plant with capacity of 166 000 m3/day. The treatmentis composed of pre-chlorination step followed by coagulation process using alumending in sand filtration unit. The intake of the water treatment plant is mainly fromthe Mariout canal. If the intake is not enough, extra intake from Nubariya canal isfrequently used. The quality of the potable water of the city does not comply with WorldHealth Organization (WHO) and Egyptian standards (ministerial decree, 2006) forhuman use. The population of the city normally uses onsite membrane filtration forfurther purification of the water. This is mainly because the intake of the watertreatment plant is polluted from different sources such as industrial, domestic andagricultural wastewater. Therefore, pollution control and prevention of the intake ofwater is required to improve the efficiency of water treatment plant.
3.2.4 Waste
Domestic and industrial waste water
sewage system of 562 km length has been established together with sewagetreatment plant (oxidization plant only) with of 36,000 m3 capacity. The industrialwastewater is facing some problems because of lubricants and factory wastes dumpedin sewage and the availability of the final treatment unit. Some industries in New Borg ElArab partially treat or recycle generated industrial wastewater in compliance withEgyptian standards (Ministerial Decree no 44 for year 1994). Others, however, continueto heavily pollute water resources.
Unfortunately, there is no data for either industrial solid waste or for wastewater.However, the mixture of domestic sewage and industrial wastewater is currently treatedat waste stabilization pond with capacity of 40,000 m3/d and the plant effluents areused for irrigation of the forest. The treatment plant consists of ponds. Each pondcomprises facultative ponds, arranged in parallel series.

14
Solid waste management
The organic fraction of MSW is mainly used for composting. MSW can be liability ifrequiring disposal but also represents considerable resource that can be beneficiallyrecovered, for instance by the recycling of materials such as aluminum cans, metals,glass, fibres, etc., or through recovery operations such as conversion to energy andcomposting. The total annual municipal solid waste generation in New Borg El Arab cityhas increased more than 36% since 2000, to the current level of 20–25 tons per day(Nahdat Misr company). Organic material is typically the main constituent, up to 60% oftotal municipal solid waste in the city. Clearly, new waste management practices areneeded.
3.2.5 Transport
Existing road network
NBC is today mostly an industrial city with most workers commuting from Alexandria.The city is connected with Alexandria through number of main roads namely theAlexandria-Cairo Desert Road (Al Kafory Road) and the New Borg El Arab City-MatrouhRoad. In addition, NBC is connected with the national railway system through theAlexandria-Borg El Arab railway which can be employed in the future as anurban/suburban public mass transport system. Finally, NBC is connected with theInternational Airport through single 2-lane road.
Existing public transport system
NBC faces considerable lack of public transport services. Shortfalls in public transporthave created market opportunities for the informal sector collective taxis and the tuk-tuks, small moped taxis, which have the advantage of changing their schedules anddeviate from licensed routes in response to passenger demand and congestion, eventhough this might be illegal. On the other hand, collective taxis and tuk-tuks createnumber of transport problems that affect not only public transport but also adverselyaffect the entire transport system.
Existing pedestrian and bicycle transport
In general, the more transportation options that are available, the better the access.Non-motorized modes are important transport choices, for trips made entirely bywalking or cycling and to support public transport. In urban areas, walking and cyclingare often the fastest and most efficient ways to make short trips. NBC facesconsiderable lack of pedestrian and bicycle infrastructure. The infrastructure does notprioritize space for bicycles and pedestrians. Specifically, the lack of indicated crossingsincreases the risk of accidents and leaves pedestrians feeling unsafe, thereby reducingthese basic sustainable means of transport significantly.

15
Railway line and stations in NBC
The Alexandria–Borg El Arab line operates on the same track as the Alexandria–MersaMatrouh line. The actual travel time between the Alexandria core area and NBC isaround 1.5 hours. The vehicles operated on the line are inadequate to fulfil reasonablequality services, as they are outdated, poorly maintained, and have diesel engines withpoor acceleration, deceleration and speed and poor seat quality. Two stations exist inNBC, namely 25 January station and Borg El Arab station. The two stations have recentlybeen renewed, and are in good condition. However, the feeder systems (public busesand private operated mini-buses) to the railway stations to serve the passengerscommuting to their actual destinations within the NBC are lacking.
Borg el Arab International Airport
The Borg El Arab International Airport is located about 40 km southwest of AlexandriaCentre and 14 km east of NBC. The airport consists of new terminal building,administration and service buildings as well as cargo facilities. Currently the airport hasone runway with length of 3,400 and width of 45 m. The airport is planned tobecome the main airport of Alexandria, and aims to serve passengers and cargo forAlexandria and the surrounding governorates. The airport will also help to improve thetourist development for the western region, especially Borg El Arab and the north coast.
3.3 Stakeholders involved
The stakeholders involved in this FS belong to the following categories:
1. New Borg Al Arab City AuthorityPresidentVice-presidentHead of Development Dep.Head of Electricity Dep.Head of Housing ServicesHead of Infrastructure Dep.Head of Roads Dep.Head of Design Dep.Head of Environment Dep.
2. New Borg Al Arab Investors AssociationFaragalla/President/CEOFarco/CEOUnitel/CEOMancro/CEOSummer Moon/CEOAlex for Seeds/CEO
3. Governmental BodiesDep. of Transportation/Head
16
Alex Water Co./CEOAlexandria Environmental Affairs AgencyOrg. of Investment/Head
4. NGOs/CDAsSahwa NGOLocal CDAReligious Association
5. ResidentsNames omitted due to confidentiality reasons
4 Scope
Early on during the development of this Feasibility Study, the experts involved decidedto consider the following sectors for which the Vision of NBC as an EcoCity and thepossible sustainability Scenarios would be proposed along with the associated impacts:
ResidentialCommercial/Public facilitiesIndustrialServices/UtilitiesTransport
4.1 Sectors considered
4.1.1 Residential
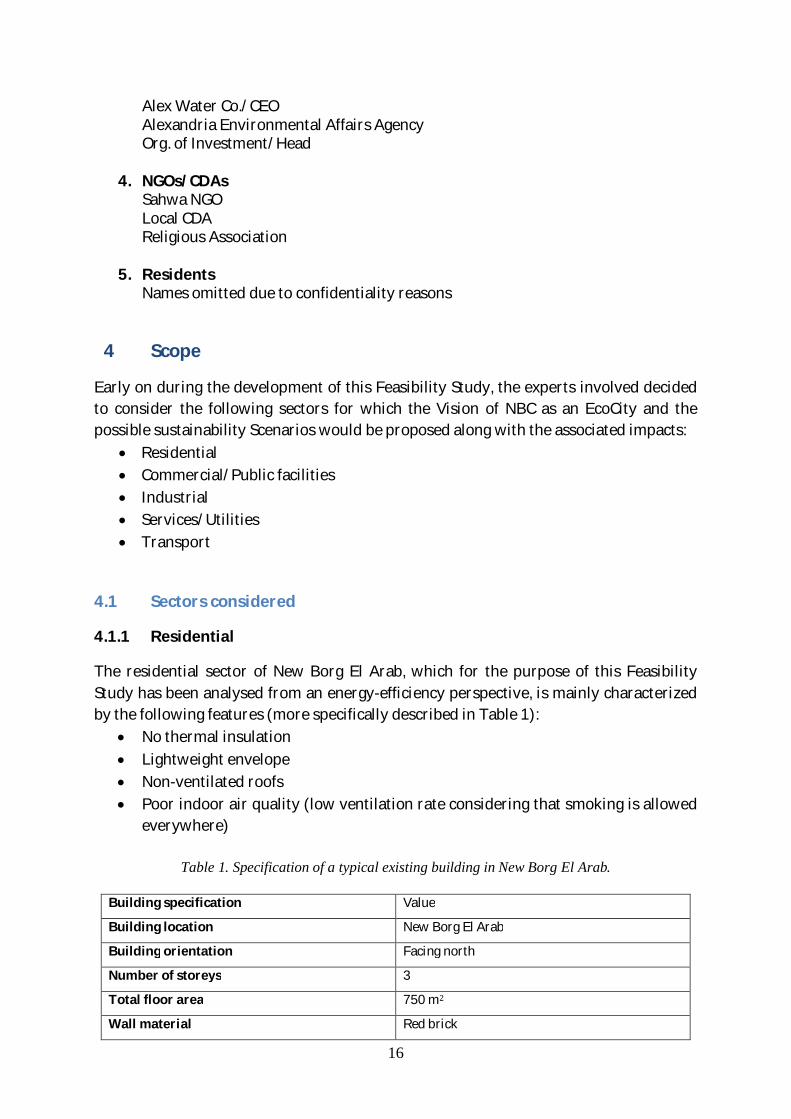
The residential sector of New Borg El Arab, which for the purpose of this FeasibilityStudy has been analysed from an energy-efficiency perspective, is mainly characterizedby the following features (more specifically described in Table 1):
No thermal insulationLightweight envelopeNon-ventilated roofsPoor indoor air quality (low ventilation rate considering that smoking is allowedeverywhere)
Table 1. Specification of a typical existing building in New Borg El Arab.
Building specification Value
Building location New Borg El Arab
Building orientation Facing north
Number of storeys 3
Total floor area 750 m
Wall material Red brick
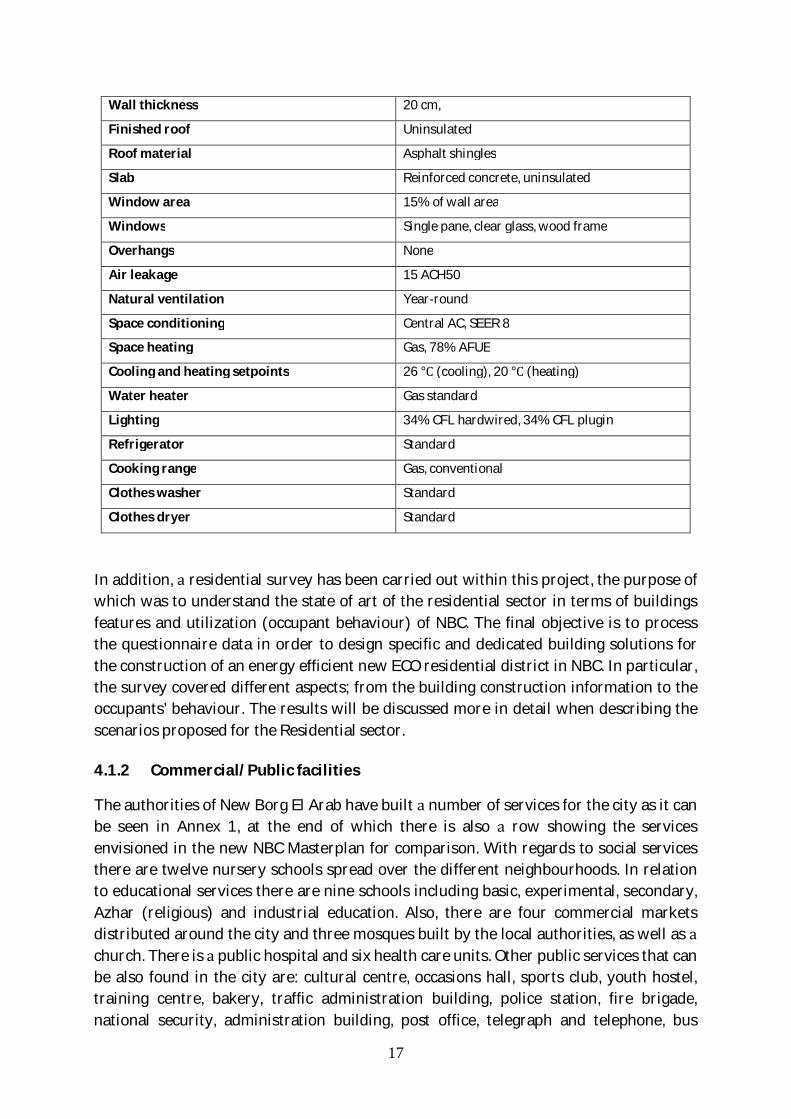
17
Wall thickness 20 cm,
Finished roof Uninsulated
Roof material Asphalt shingles
Slab Reinforced concrete, uninsulated
Window area 15% of wall area
Windows Single pane, clear glass, wood frame
Overhangs None
Air leakage 15 ACH50
Natural ventilation Year-round
Space conditioning Central AC, SEER 8
Space heating Gas, 78% AFUE
Cooling and heating setpoints 26 ° (cooling), 20 ° (heating)
Water heater Gas standard
Lighting 34% CFL hardwired, 34% CFL plugin
Refrigerator Standard
Cooking range Gas, conventional
Clothes washer Standard
Clothes dryer Standard
In addition, residential survey has been carried out within this project, the purpose ofwhich was to understand the state of art of the residential sector in terms of buildingsfeatures and utilization (occupant behaviour) of NBC. The final objective is to processthe questionnaire data in order to design specific and dedicated building solutions forthe construction of an energy efficient new ECO residential district in NBC. In particular,the survey covered different aspects; from the building construction information to theoccupants’ behaviour. The results will be discussed more in detail when describing thescenarios proposed for the Residential sector.
4.1.2 Commercial/Public facilities
The authorities of New Borg El Arab have built number of services for the city as it canbe seen in Annex 1, at the end of which there is also row showing the servicesenvisioned in the new NBC Masterplan for comparison. With regards to social servicesthere are twelve nursery schools spread over the different neighbourhoods. In relationto educational services there are nine schools including basic, experimental, secondary,Azhar (religious) and industrial education. Also, there are four commercial marketsdistributed around the city and three mosques built by the local authorities, as well aschurch. There is public hospital and six health care units. Other public services that canbe also found in the city are: cultural centre, occasions hall, sports club, youth hostel,training centre, bakery, traffic administration building, police station, fire brigade,national security, administration building, post office, telegraph and telephone, bus

18
station, endowments building, parking building, agriculture administration and court ofjustice.
4.1.3 Industrial
New Borg El Arab is major industrial city over 6.3 thousand acres. In the industrialzones industrial activities include: engineering, electrical, food, timber, plastics, paper,spinning, weaving, building materials, metallic, mechanical, chemical, pharmaceuticaland various other industries. NUCA provides plots of industrial, warehouses, andworkshops. Main industry sectors are food, chemicals, engineering and textiles. Majorfactories are listed in Table 2.
Table 2. Major factories in each sector.
Industry sector Factories
Chemicals New MarinaRubex for Plastic AcrylicManufacturingThe International Group for ModernCoatingsEgypt Bentonite Derivatives Co.
Pyramid Glass CompanyEvyab EgyptIICPAbco GroupOthers
Food FaragallaSakr for foodOssian FoodFine Foods
Alexandria For SeedsBorg Alarab for food Ind.Others
Engineering Man Crew for metal constructionsAnborgSarhan SteelValley Of The Kings For Metal
UnitelTuporcoOthers
Textiles Borg El Arab for spinning (Eshra Tex)FilmarElvy weavingElvan
Mediterranean TextileRubyredOthers
In total there are 522 producing factories (an investment capital of 4.113 billion pounds,with an annual production of 5.292 billion pounds), which provided 37761 jobs paying113.7 million pounds annually. 28% of these are large factories (investments more than15 million Egyptian pounds), 46% is considered medium factories (investmentsbetween and 15 million Egyptian pound) and 26% is considered small factories(investments less than million Egyptian pound).
Moreover, there are 170 factories under construction (an investment capital of 482.255million pounds and an annual production value of 514.053 million pounds), which willprovide 7446 jobs paying 22.338 million pounds annually.
Many of Borg El Arab Major Industries are International for instance Fargallah for foodproducts, Fine Foods for food products, Abco group for Detergents, The International
19
Group for Modern Coatings and Rubex for Plastic Acrylic Manufacturing. Otherindustries in Borg El Arab are aim mainly to the local market, such as Filmar, Elvyweaving, Unitel, Sakr for food, Ossian Food, Pyramid Glass Company, Evyab Egypt andBorg El Arab for spinning.
4.1.4 Services/Utilities
4.1.4.1 Water
Potable water in new Borg El Arab city is mainly contaminated and is below Egyptianand World Health Organization (WHO) standards. The water treatment plant of the cityis not properly maintained and is thus inefficient in removing salts, algae and otherpathogenic microorganisms. promising and unique solution for improvement of waterquality of the city must be found out. In order to identify healthy or unhealthy potablewater, research is needed on the following:
What are the qualities of potable water in the city?What are the signs of contaminated body of water?
For this purpose, the first step is to develop checklist of signs for healthy orcontaminated water based on WHO’s and Egyptian standards. The second step would beto make field trip to NBC’s water treatment plant to collect the data (capacity,treatment units, skills of operators, maintenance). Moreover, additional informationshould be gathered about the following:
Is the intake of water contaminated?What pollutants are involved?Was the pollution primarily caused by industries, or by domestic activities?What is the history of the pollution at the site? When did it becomecontaminated?Has the effect of the contamination been studied before? Investigate the sourcesof the pollution
The third step is to collect samples of the intake and effluents from differentcompartments of NBC’s water treatment plant to investigate its drawbacks. Thefollowing parameters should be analyzed: turbidity, salinity, pH, conductivity, hardness,algae and faecal coliform. The last step would be to design sustainable solution for theimprovement of NBC’s water treatment plant. Unfortunately, this simple plan has notbeen possible to realize during the development of EcoNBC project due to theimpossibility to access the necessary data.
4.1.4.2 Solid waste management
Problem Identification in New Borg El Arab City: Municipal Solid Waste (MSW)amounted to 20 ton/d. Problems associated with organic fraction of Municipal SolidWaste are:
Source of odor emissionVermin attraction

20
Toxic gas emissionLeachate generation
The sources of solid waste are shown in Figure whereas examples of the presentcondition are provided in Figure 5.
Figure 4. Sources of solid waste in New Borg al Arab city. (Dr. Ahmed Tawfik and Mohamed El-Samadony, E-JUST)
Figure 5. Examples of the present condition. (Dr. Ahmed Tawfik and Mohamed El-Samadony, E-JUST)

21
Figure 6. Sustainable solution: biowaste to energy via anaerobic digestion. (Dr. Ahmed Tawfik andMohamed El-Samadony, E-JUST)
Biogas production from biowaste using anaerobic digestion, presented in Figures and7, is technically sound, financially viable, environmental friendly and easy to operate andmaintain by local community for long term sustainability.
Figure 7. Degradation of organic material through Anaerobic Digestion (AD). (Yebo, Li et al., 2011)

22
An on site biogas unit that can be taken as an example of applicable technology, and thespecifications of which are described in Figure 8, is capable of producing biogas from theorganic fraction of municipal waste of 120 inhabitants.
Figure 8. On site biogas unit from organic fraction of municipal waste for 120 capita. (Dr. AhmedTawfik and Mohamed El-Samadony, E-JUST)
4.1.5 Transport
NBC is connected with Alexandria through number of main roads namely Alexandria-Cairo Desert Road (Al Kafory Road) and New Burg Al Arab City-Matrouh Road. Inaddition NBC is connected with the national railway system through Alexandria-Borg ElArab railway which can be employed in the future as urban/suburban public mass
Inhabitants:Assume: 10 floors/ building
families/ floorcapita/ family
Solid waste rate: 0.5 kg-solids/ c.Therefore, Amount of solids 0.5 (kg-solids/ c. d)10 (floors/ building) (families/ floor)(capita/ family) 60 kg-solids/
Volume of digester:Assume: -solid waste 200 lbs/ yard3 120kg/m3
Residential Waste (uncompacted)Therefore, Q-solid waste 60 (kg-solids/ d) 120(kg/m3 0.5 m3/dAssume, 20Therefore, V-digester 0.5 (m3/d) 20 (d) 10 m3
Assume, 2.5V-digester /4) d2
Therefore, 2.2
Amount of biogas:Assume: COD 40 g/LTherefore, Organic load 0.5 (m3/d) (40,000) g/m3 20,000 g/d 20 kg-COD/dBiogas quantity 0.3 (m3-biogas/kg-COD) 20 (kg-COD/d) m3-biogas/d
Amount of saved energy:typical family of six uses 1.5 m3-biogas/ d.
Biogas consumption of building 10 (floors/ building) (families/ floor) 1.5 (m3-biogas/ d) 30 m3-biogas/dTherefore, of saved energy (m3-biogas/d) 30 (m3-biogas/d) 100 20%
Cost:Varied 10000 15000 L.E depends on material (concrete, steel, plastic, etc.).

23
transport system. Finally, NBC is connected with the International Airport throughsingle 2-lanes road way. The transportation systems connect NBC with Alexandria areshown in Figure 9.
Figure 9. External road and rail network and site location of NBC. (Dr. Mohamed Shahin, CGCE)
It is worth mentioning that NBC road network does not have names for some road links.Based on the road inventory survey, the following items can be highlighted:
There is no road hierarchy based on road capacities, importance or functions.This in turn would lead to traffic congestion, increasing traffic accident rates, andreducing the efficiency of the road network as whole.Incompatibility of certain intersections with safety provision and trafficoperations.Lack of road signs and markings particularly at approaches to intersections.Lack of organized and proper pedestrian facilities, especially at street crossings.Lack and insufficient parking and drop-off provisions, particularly near the mainbuildings. This would lead to illegal parking in the surrounding streets andusually cause traffic accidents.Insufficient, poor and unorganized of NBC public transport facilities and/or masstransit.
Figure 10. Present transport arrangements in NBC from left to right: passenger train stopping atstation, unofficial tuk-tuk stopping area, terminus of microbus routes. (Dr. Mohamed Shahin, CGCE)
NBC faces considerable lack of public transport services. Shortfalls in public transporthave created market opportunities for the informal sector collective taxis and tuk-tuk,which have an advantage of changing their schedules and deviate from licensed routesin response to passenger demand and congestion, even though it might be illegal. Anunofficial tuk-tuk stop is shown in Figure 10. On the other hand, collective taxis and tuk-

24
tuk create number of transport problems that affect not only public transport but alsodiversely affect the entire transport system as:
They are operated at unorganized manner without comprehensive view orplan;Their network covers all road networks, and in many precincts duplicates, andcompetes with bus services;They often interrupt traffic by stopping suddenly or slowing at curbs tocollect/drop passengers low capacity comparing to bigger busses; andThey are in poor technical condition contributing significantly to air pollutionand high-energy consumption.
NBC faces considerable lack of pedestrian and bicycle infrastructure. Theinfrastructure is not prioritizing space for bicycles and pedestrians. Specifically missingindicated crossings increase the risk for accidents and feeling unsafe, thereby reducingthese basic sustainable means of transport significantly.
The Alexandria Borg El Arab line operates on the same track of Alexandria MersaMatrouh line. The actual travel time between Alexandria core area and NBC needsaround 1.5 hour. The operated vehicles on line is inadequate to fulfill reasonable qualityservices as they are outdated, poorly maintained, diesel engines with pooracceleration/deceleration/speed, and poor seats quality.
Two stations are exists on NRC namely 25 January station and Burg Al Arab station. Thetwo stations are newly renewed and they are in good condition. The feeder systems(public buses and private operated mini-buses) to the railway stations are missing toserve the passengers commuting to their actual destinations within the NBC.
The Borg El Arab International Airport is located about 40 km southwest of AlexandriaCentre and 14 km east of NBC. The airport consists of new terminal building,administration and service buildings as well as cargo facilities. Currently the airport hasone runway with length of 3,400 meters and wide of 45 meters.
Table presents some indicators about the existing transportation system in NBC. Ascan be seen from the table, the total length of the existing road network in NBC is about316 Km which constitute about km per 1000 inhabitancies. No fixed public transportroutes are dedicated. Microbuses/tuk-tuk represents the highest share of the dailypassenger trips with about 71% while private motorized modes represent about 28%.The share of daily passenger trips by foot represents only 1%. Overall average triplength is 12.7 km and average trip time is 14.6 min and the average speed is 52km/hour. Average journey time to work by private motorized modes is about 13minutes and by microbuses/tuk-tuk is about 23 minutes (extra by about 76%). Theannual veh-km is about 27 million while the annual veh-hour is about 5.4 million.Finally, the annual CO2 emission is roughly estimated at 31.9 kilo ton and the totalenergy consumption by transport sector is 426 Tj.

25
Table 3. Transportation Indicators for the Base Year 2013 in NBC.
5 Vision
The vision for turning NBC into an EcoCity was developed by team of Finnish andEgyptian experts through number of workshops held in Finland and Egypt. From thebeginning, it was clear that the vision should remain ambitious but still possible toachieve given the necessary political will and social commitment.
The team of experts decided to define the vision around three main issues of concern foreach of the sectors considered in the scope of the FS (Residential, Commercial/PublicFacilities, Industrial, Services/Utilities, Transport). The issues of concern chosen areEnergy, Water and Waste, plus an additional category named Other independent issues(materials, social, etc.). In order to provide also summarized view of the vision acrosssectors, General “sector” was defined.
Quantitative and qualitative targets were set for each of the sectors in relation to theissues of concern chosen.
Several workshops with stakeholders were also organized to collect their feedback onthe vision (and scenarios) proposed. The content was then refined accordingly. moredetailed view of the content developed can be found from Annex 2.
Indicator
Population 80000
Total length 316.71 Km
Length of road per thousand inhabitant 4 km per 1000 inhabitant
Length of reserved public transport routes per thousand inhabitants 0
Kilometers of dedicated cycle lane per thousand of inhabitants 0
Public transport kilometers per inhabitant 0
Percentage of daily passenger trips on foot and by bicycle 1%
percentage of daily passenger trips by private motorized modes 28%
Percentage of daily passenger trips by microbuses and Tok-Tok 71%
Percentage of population that lives within a given distance (300 m) from transit stops/stations (public transport) 0
Average passenger car occupancy rate 1.3
No of passenger cars per thousand inhabitant N/A
Share of journeys to work by car N/A
Average time of journey to work by private motorized modes 13.20 min
Average time of journey to work by public transport/other modes 23.10 min
Average pedestrian distances to hospitals, services, schools, business areas N/A
Annual passenger transport fatalities per million inhabitant N/A
Annual CO2 emissions 31.90 Kilo ton
Energy consumption 426.50 Tj
Energy consumption per road based public transport passenger kilometer (at vehicle) 0
Energy consumption per rail based public transport passenger kilometer (at vehicle) 0
Average Trip Length 12.7 Km
Average Trip Time 14.6 min
Average Speed 52.0 Km/hr
Average annual Veh.Km 278908697 veh.km
Average annual Veh.hr 5363629 veh.hr
Base Year 2013

26
Table 4. Sectors and issues of concern considered for the Vision.
Sectors considered for the Feasibility Study
Issues ofconcern
General Residential Commercial/Public facilities
Industrial Services/Utilities Transport
Energy
Water
Waste
Otherindependentissues
5.1 General overview
5.1.1 Energy
The vision foresees number of measures to be applied by all sectors like energyefficiency, smart use of energy, use of renewable energy sources (particularly solarenergy), possibility to sell extra energy to the grid, waste to energy, efficient lightingsolutions, use of biofuels, use of local materials.
Other measures, even though included in the general overview, are more sector-specific,like monitor and trace hazardous chemicals, cleaner production (green industry),electric cars, electrification of railway connection between NBC and Alexandria,pedestrian and bicycle lanes, improved bus system, car-pooling, Intelligent TrafficSystems (ITS), reduced use of private cars in city centres (parking fees), etc.
Finally, there are some measures related to public awareness, as well as the necessarylegal framework and information to be provided.
5.1.2 Water
In relation to water, the vision includes measures like water conservation, improvedwater quality, use of non-conventional water resources, fresh water management,recycling and reuse of treated waste water, provision of fresh drinking water andsanitation, rain harvesting and increased public awareness.
5.1.3 Waste
Here the vision proposes measures like in situ sorting of waste, waste minimization,recycling, low cost technologies for waste water treatment, biogas and biofuel

27
production from waste, solid waste treatment, pollution prevention, reduction ofemissions (see also energy) and increase public awareness. And finally, in this case, theprevious are completed with an additional measure directly related with consumptionpatterns: market for used goods (flea market, online sales…).
5.1.4 Other independent issues
This additional category includes measures in relation to those issues that don’t fallwithin any of the other but are still perceived as very important like protection ofaquatic ecosystems, conservation and sustainable use of land, sustainable green cover,biodiversity, green areas, good governance, use of eco-friendly chemicals, minimizationof use of raw materials, health and safety, etc.
5.2 Vision and targets per sector
5.2.1 Residential
EnergyThe vision contemplates the possibility to sell extra energy to the grid, and to developlocal building energy code (including lighting), solar water heating and solar airconditioning, waste to energy technologies, efficient lighting solutions, and in general,energy efficiency and smart energy use. In addition, use of local materials should bepromoted and the awareness of the public should be increased.
WaterThe vision includes water conservation and water quality, use of non-conventionalwater sources (e.g. solar desalination), fresh water management, recycling and reuse oftreated waste water, provision of fresh drinking water and sanitation, rain harvestingand increased public awareness.
WasteThe vision includes in situ sorting of waste, waste minimization and increased publicawareness.
Targets:100% net renewable energy in all new buildings.Reduce by 50% in 10 years the total energy consumption compared to business as usual.
Targets:30% less water consumption (including water recycling) compared to business as usual.100% pure drinking water for everyone.50% water treated using renewable energy sources in 10 years.100% sanitation for everyone.Respect carrying capacities in terms of water availability.

28
Other independent issuesHere the vision describes aspects that don’t relate precisely to the previous issues ofconcern like for example protecting aquatic ecosystems, conservation and sustainableuse of land, sustainable green cover, biodiversity, green areas or good governance.
5.2.2 Commercial/Public facilities
EnergyThe vision includes solar water heating and solar air conditioning, waste to energy, useof efficient lighting solutions, energy efficiency and smart energy use, monitor and tracehazardous chemicals, and green policy for all.
In addition, use of local materials should be promoted and the awareness of the publicshould be increased.
WaterThe vision contemplates water conservation (including agricultural activities) and waterquality, use of non-conventional water sources (e.g. solar desalination), fresh watermanagement, recycling and reuse of treated waste water, provision of fresh drinkingwater and sanitation, rain harvesting and increased public awareness.
WasteThe vision includes recycling, low cost technologies for waste water treatment, biogasproduction from waste and increased public awareness.
Targets:Enforcement of the existing law to close businesses at given time.Improved energy efficiency (efficient lighting, refrigeration).
Targets:100% use of non-conventional water for irrigation and non-conventional irrigation techniques.
Targets:Intensifying water pollution prevention to reduce health hazards and damage to ecosystems.Reducing salinity, combating desertification, reducing cropland expansion, preventing soil pollutionand degradation.Reducing plant uprooting and removal of natural vegetation.In general, improving the legislation.Introducing the adequate legislation to allow and regulate the use of renewable energy.
Targets:Near 100% of the waste (including both solid waste and waste water) is treated, recycled and/orreused.100% of hazardous waste is properly treated.

29
5.2.3 Industrial
EnergyThe vision includes cleaner production (green industry), monitoring (in-plant control),maintaining the energy cycle, renewable energy and energy efficiency (ISO 50000, etc.),efficient lighting solutions, monitor and trace hazardous chemicals, possibility to sellextra energy to the grid, smart energy use. In addition, enforcement of environmentallaws and regulations should be achieved and public awareness increased.
WaterThe vision promotes non-conventional water resources (e.g. solar desalination),recycling and reuse of treated waste water, rain harvesting and increased publicawareness.
WasteThe vision promotes waste minimization, solid waste treatment, recycling, recovery(including waste to energy), pollution prevention and increased public awareness.
Other independent issuesThe vision promotes the use of eco-friendly chemicals, minimization of raw materialsand Occupational Safety Health (OSH).
Targets:Near 100% of the waste is treated, recycled and/or reused.100% of hazardous waste is properly treated.
Targets:100% of industries water audited on regular basis.100% recycling of waste water where applicable.Enforcement of the law regulating discharge into water streams.
Targets:Near 100% of the waste (including both solid waste and waste water) is treated, recycled and/orreused.100% of hazardous waste is properly treated.
Targets:100% of industries energy audited on regular basis.100% of industries having green policy, self-monitoring and continuous improvement processes.Shared responsibility in trade (hazardous chemicals).Upgrading of outdated equipment through enforcement and incentives.Use of renewable energy.

30
5.2.4 Services/Utilities
EnergyThe vision includes minimization of electricity consumption, in public spaces, dailyservices within walking distance (around 500 m), efficient lighting solutions, providingconsultancy on energy efficient solutions, providing energy audit service (e.g. through E-JUST Energy Office), smart energy use, energy information and tips available (e.g. fromE-JUST Energy Office), ESCO companies, and increase public awareness.
WaterThe vision includes rain harvesting, providing clean water and increased publicawareness.
WasteThe vision includes markets for used goods (flea market, online sale…), well-functioningwaste management services available and increased public awareness.
5.2.5 Transport
EnergyThe vision includes use of biofuels, electric cars, fuel cells, electrification of railwayconnection between Borg El Arab City and Alexandria, pedestrian and bicycle lanes,improving the bus system, busycles, supporting car-pooling, energy efficiency,increasing the use of public transport, increasing cycling and walking, Intelligent TrafficSystems (ITS), introducing information systems for travellers, car-free zones, traffic
Targets:100% garbage collection.At least one functioning market place for used goods (either physical or online).Near 100% of the waste is treated, recycled and/or reused.100% of hazardous waste is properly treated.
Targets:30% reduction of water consumption in the Service sector.All septic tanks should be modified to prevent ground water pollution, and service to empty the tanksshould be available.
Targets:60% reduction of energy consumption in Government offices compared to business as usual.E-JUST Energy Office up and running in the near future.
Targets:OHS rules should be followed by all employees at all times. Develop processes to support this.

31
calming measures, bus and HOV priority, reduce use of private cars in city centre(parking fees).
In addition, traffic laws and regulations should be enforced and public awareness shouldbe raised.
WaterThe vision includes rain harvesting for the road system and increased public awareness.
WasteThe vision promotes biofuel from waste, hydrogen production, reduction of emissions(see energy), recycling (tyres, other parts), recovery and again increased publicawareness.
6 Scenarios
To evaluate the future situation for NBC in the year 2035 and its technical,environmental impacts, the "scenario technique" was adopted. scenario can be definedas logical and plausible (but not necessarily probable) set of events that may lead tothe future situation. The aim is to consider range of possible “futures” and to providevarious development strategies.
6.1 General scenarios
The general scenarios agreed and developed jointly through number of focusedworkshops are:
Business As Usual scenario (BAU)Low Investment Sustainability scenario (LIS)High Investment Sustainability scenario (HIS)
Targets:Modal Split: public transport share 50%.Modal Split: pedestrian/cycling share 10%.Decrease private car share 40%.15% use of electric cars by 2035 for the best scenario.100% cars should be regularly checked and maintained.
Targets:Enforcement of law regulating disposal of old cars.100% tyres recycled.Near 100% of the waste is treated, recycled and/or reused.100% of hazardous waste is properly treated.

32
These scenarios were first defined in general way, applicable to all sectors, and thendeveloped more in detail for each of the sectors included in the scope of this FS. Annexcontains the detailed description of the scenarios.
6.1.1 BAU scenario
The scenario implies that things will continue in the future as they are now, theevolution pattern will be the same. Therefore this point of view, BAU is basically thedescription of the current situation, including population and economic growth and alsothe content of the Strategic Plan and the results for the performance indicators proposedby the EcoNBC team. The performance indicators proposed for basic diagnosis of thecurrent situation are:
Energy consumption[kWh/year]energy sourceWater consumption[m3/year]Material consumption[kg/year]Emissions[kg CO2 equivalent/year]Wastewater[m3/year]Solid waste[tonnes/year]hazardous/non hazardous
Even though the performance indicators selected should be feasible since they are quitebasic, gathering the necessary data has proved to be considerable challenge,particularly in the case of the Industrial sector. Since the same data are needed also forthe calculations of the different scenarios considered (see Chapter Impacts), EcoNBCteam has made number of decisions to overcome the unavailability of data or theunreliability of the existing data. These decisions and assumptions will be explainedahead.
However, EcoNBC team would like to draw the attention of all involved stakeholderstowards the importance of making the data available in order to support sustainabledevelopment in Egypt.
6.1.2 LIS scenario
The Low Investment Sustainability scenario should contain primary energy efficiencymeasures along with the introduction of renewable energy sources and improved userbehavior regarding energy efficiency. Minimization of lighting energy consumption, as

33
well as the consistent use of passive solutions in Residential and Commercial sectors(see Annex 3), and the general implementation of energy audits for the Industry sector,should also be included in the LIS scenario.
In relation to Water, the LIS scenario includes water conservation measures as well asmonitoring energy and water quality inside the buildings. In relation to Waste, thisscenario considers separating waste at neighbourhood and district levels.
There are number of measures specifically related to the Transportation sector like theimprovement of public transport and traffic control systems, the enforcement of trafficlaws, or separate lanes for different means of transportation. Other measures are relatedto the Industry sector like the development of low cost technologies, the optimization ofmaterial and energy flows in industrial processes or improving the skills of theemployees.
In addition to this, the LIS scenario also includes other general measures like sustainableplanning and design, the creation of databases for different sectors or awareness raisingprogrammes (energy, water, waste, lifestyle…).
6.1.3 HIS scenario
In relation to Energy, the High Investment Sustainability scenario includes the use ofadvanced renewable energy technologies and solutions (see Annex 2).
For Water, the HIS scenario considers upgrading the water distribution network, freshwater management and rain harvesting, as well as increasing the production and use ofnon-conventional water resources (e.g. desalination).
In relation to Waste, this scenario includes hazardous waste dumping sites, classificationof the different industries for better common waste management, solid and liquid wastemanagement for the Industry sector, use of non-conventional techniques for improvingthe added value from materials waste, 100% recycling efficiency especially for water(Zero Liquid Discharge technology).
Additionally, the HIS scenario also includes other social and economic measures withimpacts on the main issues of concern selected, like improving sanitation and health,building more schools and hospitals, developing industrial ecoparks, mass transport andIntelligent Traffic Systems, electric vehicles, creation of local SMEs around sustainabletechnologies, products and systems, etc.

34
6.2 Scenarios per sector
Based on the data and the tools/software available, several scenarios have been defined morein detail for the Residential and Transport sectors as it will be described next. These scenarioswere then used as basis for energy and CO2 emissions, and cost calculations respectively.
6.2.1 Residential sector
The buildings considered here relate to two investment scenarios: Low InvestmentSustainability scenario (LIS) and High Investment Sustainability scenario (HIS). In thefirst case, the design includes exclusively low cost solutions, while in the second casetechnologies commonly associated with Net-zero houses are included. Both cases havebeen compared to reference case, called Business As Usual (BAU), which refers to theminimum requirements of the Egyptian energy code, as presented in theaforementioned studies. In particular, active and passive ventilation systems, differentexternal envelope solutions, PV and solar thermal systems have been considered.Furthermore, different solar PV field sizes have been considered, but only for the highinvestment scenario. (Reda et al., 2015)
The research has been carried out in three phases: investigation of the main behaviourpatterns of occupants in relation to energy consumption, assessment of relevanttechnologies and, finally, energy analysis. The latter aspect has been carried out usingTRNSYS software. The investigation phase was conducted as survey. The goal of thesurvey was to understand the occupant behaviour concerning the use of windows,shading systems and domestic hot water in typical New Borg El Arab residential areas.Stakeholders, local authorities and energy market key players were involved in thetechnology assessment phase in order to list cost-effective systems and buildingenvelope solutions for each scenario: BAU, LIS and HIS.
The aim of this phase was to create list of technologies that suit New Borg El Arab inthe local context for both high and low investment scenarios. two-day meeting wasorganized by VTT and E-JUST with the local stakeholders, authorities and energy marketkey players in order to select, among other issues related to EcoNBC project, the mosteffective residential energy saving solutions. Particular attention was given to thecapability of the construction workers, to the availability of technical passive and activesolutions in the Egyptian market and to the recent local research findings, described inthe introduction. Thus, the Low Investment scenario (LIS) includes only simple andaffordable solutions, while the High Investment scenario (HIS) includes technologiescommonly applied in Net zero energy buildings. In both scenarios, solar technologieswere preferred, among others, because of the high level of solar irradiance in Egypt, asstated in the introduction. The Business As usual Scenario (BAU), on the other hand,refers to the minimum requirements of the Egyptian energy code. The chosentechnologies for each case are listed in Table 5.
Moreover, for the three considered cases: BAU, LIS and HIS, an air to water heat pumpwas included for supplying cooling and heating energy.

35
Table 5. List of technologies selected by local stakeholders, authorities, energy market key players,VTT and E-JUST expert.
Business as usual (BAU) Low investment scenario(LIS)
High investment scenario(HIS)
Syst
emte
chno
logi
es
Incandescent 20% andfluorescent lamp 80% Fluorescent light bulbs LEDs
Free cooling system relying onopening windows when rooms
are occupied (naturalventilation only)
Free cooling system using vents(natural ventilation only)
Mixed free cooling ventilationsystem (through ventsmechanical ventilation)
Unglazed solar thermalcollectors Glazed solar thermal collectors
PV
Enve
lope
solu
tions
External reflective paint External reflective paint
Double wall of half red-brickwith cm air gap in between
Insulation (5 cm on the groundfloor and the Roof, cm on the
external walls)
Insulation (6 cm on the groundfloor and the Roof, cm on the
external walls)Shading system Shading system
Double glass window Double glass window Double glass low-e (low thermalemissivity) window
Energy system: BAUThe system used in this scenario is the simplest considered. It consists of storage hotwater tank and heat pump. Since there are not solar technologies involved, thecomponents C1, P2, solar collectors, PV, batteries and inverter are not part of the BAUsystem. The considered air to water heat pump refers to the model ERLQ004-008CV3 ofthe series Daikin Altherma air to water heat pump. TRNSYS type 941 has been used tomodel the HP; furthermore, the catalogue data for both heating and cooling has beencreated according to the abovementioned product technical data sheet. The maintechnical features of the heat pump are shown in Table 6.
Table 6. Main technical features of the heat pump model Daikin Altherma air to water heat pumpERLQ004-008CV3.
Heat pump technical data, model ERLQ004-008CV3, Daikin®[43]Max. water flow temperature for heating 55 °CAir temperature operating limits (cooling mode) -10 °C 45 °CAir temperature operating limit (heating mode) -20 °CWater temperature operating limits (cooling mode) °C – 18 °CWater temperature operating limits (heating mode) 25 °C – 60 °CCooling capacity COP at A35/W7 6.82–2.9 kWCooling capacity COP at A45/W18 6.38–2.25 kW -
Heat output COP at A7/W35 5.12–4.57 kW -Heat output COP at A2/W55 4.54–2.58 kW -Blower power 53

36
Figure 11. TRNSYS schematic view of the HIS system. (Dr. Francesco Reda, VTT)
The heat pump supplies heating energy to the building via the storage tank, whilecooling energy is supplied directly. The right part of the Figure 11 shows the supplyloop, components V4, V5 and P3. V5 is responsible to divert part of the load flow rateto V4 in order to reach the inlet temperature required by the fan coils. The fan coils inlettemperatures are 45° and 16° respectively for heating and cooling supply. Moreover,C2 allows the heat pump to drive heating or cooling energy through V1 to the hot tank,until the temperature of the tank reaches 55°C, and to V3, in case cooling energy isrequired in the building. Only in summer both heating, for DHW, and cooling energiesare required. Therefore, C2 gives priority to the cooling energy, forcing the heat pump toproduce cooling energy first and then, when the building does not require coolingenergy, C2 lets the heat pump charge the hot tank. Therefore, the hot storage tanksupplies both DHW and heating loads. TRNSYS type 60 has been used to model thestorage tank. All the requested parameters have been set in accordance with the datasheet of the manufacturer. Table shows also the main design parameters of the tank.
Energy system: LISLIS system adds to the BaU system the unglazed solar thermal collectors. This meansthat the components C1, P2 and solar thermal collectors are included in the model. Table
shows unglazed solar thermal panel features and number. The tilt angle of the solarthermal collectors has been fixed to 40°, which is 10° more than the latitude, in order tomaximize their efficiency in winter. Type has been used in TRNSYS to model the solarthermal collectors. Moreover, the power of the solar circulation pumps (P2) is assumedto be 50W. C1 checks the temperature difference between the solar thermal field and thehot water tank and if the temperature difference exceeds 4°C when P2 is not running, itforces P2 to run, driving solar energy into the hot water tank. Instead, when P2 isrunning, C1 lets the solar circulation pump runs only if the aforementioned temperaturedifference exceeds 2°C.

37
Energy system: HISThe authors have assessed the energy performance of the three PV system sizes used inthe HIS to estimate the benefits of PV driven cooling system. Coupling heat pump toPV system allows producing heating and cooling without consuming energy if the outputpower of the PV system is enough to supply the heat pump. Moreover, only one machine,the heat pump, is needed to supply both the heating and cooling systems. Recentresearch has shown the promising performance of this system configuration in theMediterranean regions, stating that currently PV solar cooling solutions actually allowbetter results than the solar thermally driven ones. Therefore three HIS cases: HISa,and have been considered; they differ only by the size of the PV system. In particular,HISc has more PV and batteries than HISb and HISa cases. Therefore, all HIS cases add tothe LIS system PV system, an inverter and batteries. In addition, instead of theunglazed solar thermal collectors, solar flat plate glazed collectors have been used. Thesame TRNSYS type has been used to model them. Table shows flat plate collectorsdesign features and their configuration for each HIS case.
Table 7. Main design parameters of solar unglazed and flat plate thermal collectors and storagehot water tank.
Thermal panel model: Unglazed and Flat plate collectorNet surface (one panel) 2.3 m² (1.2X1.9 m)Nominal flow rate (one panel) 120 l/h
LIS Solar thermal unglazed collectorEfficiency stc
0.9(Interceptefficiency)
a1 20 W/m²K(Efficiencyslope)
a2 W/m²K2
(Efficiency curvature)
HIS Solar thermal flat plate collectorEfficiency stc
0.78(Interceptefficiency)
a1 3.2 W/m²K(Efficiencyslope)
a2 0.115 W/m²K2
(Efficiency curvature)
Number of panels (connected in series) LIS Unglazed - 5; HISa,b and c Glazed: 3;Hot and cold storage tank model ECO COMBI VC Cordivari
Capacity 500 lDHW Corrugated stainless heat exchanger316L Capacity 26.6
Solar fixed heat exchanger Capacity 11.5 lSolar fixed heat exchanger pressure drop 3000 PaInsulation thickness 10 cmInsulation conductivity 0.135 W/mK
Table shows the main design parameters for PV, batteries and inverter systems andalso their configuration for each HIS cases. The whole PV system consists of PV modules,
set of batteries and maximum power point tracking (MPPT) inverter. Types 194, 48and 47 have been used to model, respectively, PV, inverter and batteries in TRNSYS. Allthe parameters requested by the aforementioned types have been set according to themanufactures specifications. Therefore, the PV modules charge the battery through theMPPT and the batteries supply electricity to the loads through the inverter.
The tilt angle of the PV modules of the HISa and has been set 20° in order to optimizethem for summer use. Instead with regard to the HISc case, since the available roof

38
surface for each apartment is not enough to place all the PV modules, modules havebeen placed on the south façade of the apartment.
Table 8. Main design parameters of PV, batteries and inverter systems.
Sharp PV module ND-R245A5 [47] GWL-power, battery model SP-LFP200AHA [48]
Module short-circuitcurrent at reference
conditions8.68 Cell Energy Capacity 200 Ah
Module open-circuitvoltage at reference
conditions37.6 Cells in parallel 3–2
Referencetemperature 298.15 Cells in series 8–18
Reference insolation 1000 W/m² Charging efficiency 0.9 -Module voltage at
max power point andreference conditions
30.9 Max. current for cellcharging 400
Module current atmax power point andreference conditions
8.1 Max. current for celldischarge -400
Temperaturecoefficient of Isc at
(ref, cond)0.138 Max. charge voltage for
cell 2.8
Temperaturecoefficient of Voc (ref,
cond,)-0.329 Number of Batteries
HISa 18 connected inseries; HISb 36 (2
lines of 18 batt. each);HISc 36 (3 lines of 18
batt. each);Module temperature
at NOCT 320.65 Inverter model ET6415N [49]
Ambient temperatureat NOCT 293.15 Regulator efficiency 0.78
Insolation at NOCT 800 W/m² Inverter efficiency (DC toAC) 0.96
Module area 1.65 m² High limit on fractionalstate of charge (FSOC) 0.95
tau-alpha product fornormal incidence 0.95 Low limit on FSOC 0.2
Tilt angleHISa and b20°; HISc20°–90°;
Degrees charge to discharge limiton FSOC 0.3
Numer of modules
HISastrings of
modules each;HISb
strings ofmodules each;
HISc 13strings of
modules each
HISa 10 (Roofmounted);
HISb 18 (Roofmounted); HISc26 (18 mountedon the roof and
on the southfaçade);
Power output limit HISa, and c 3200(48V)
Inverter efficiency (AC toDC) 0.8

39
6.2.2 Transport sector
The following three scenarios are developed in the framework of this study for thefuture development of the transport system in NBC (Shahin Hedman, 2014):
Business As Usual scenarioThe Reference scenario (see Figure 12) is based on continuation of the existing travelbehaviour of the year 2014 in the future, according to the following assumptions:
Forecasted population based on the proposed master plan and increase rate ofpopulation.Little change in the modal split to the benefit of the bus mode.Change in the road infrastructures based on the master plan.
Figure 12. General description of the Business as usual scenario. (Dr. Mohamed Shahin, CGCE)
Low Investment Sustainability scenarioThis scenario includes some of the measures for saving, shifting, and smoothing traffic(see Figure 13). The main features of this scenario can be summarized as follows:
Mixed Land Use ApproachIntroduce Bus Rapid Transit Network on the main roads of NBCUse the exiting Mini Buses/Tuk-tuk fleet as minor organized public transportfeedersCreation of Pedestrian and Cycling FacilitiesEnforcement of traffic lawsDevelop Effective Ride Sharing and Car Pooling SystemIntroduce Parking Management system in city centersIntroduce Calming Measures in city centersRaising Public AwarenessUse of Biofuel/natural gas powered public transport

40
Maintenance of vehicles to the manufacturer's specifications and applying forVehicle Scrapping Program
Figure 13. General description of the Low Investment scenario. (Dr. Mohamed Shahin, CGCE)
Figures 14a and 14b present the proposed public bus transport routes and theircatchment areas for Low Investment Sustainability Scenario. Figure 15 shows anexample for the proposed road cross sections which contains PT and walking/bikereserved widths.
Figure 14a. Proposed Public Transport Routes for the Low Investment Sustainability Scenario. (Dr.Mohamed Shahin, CGCE)

41
Figure 14b. Catchment Areas for the proposed Public Transport Routes in the Low InvestmentSustainability Scenario. (Dr. Mohamed Shahin, CGCE)
Figure 15. Proposed Typical Cross Sections for the Main Roads in NBC. (Dr. Mohamed Shahin,CGCE)
High Investment Sustainability scenarioThis scenario includes the measures of Low Investment Sustainability Scenario plus thefollowing measures (see Figure 16):
Introduce of New Regional Railway connecting with Alexandria CityIntroduce of Tram and Light Rail Transit Network on the main roads of NBCOptimize use of available Infrastructure through Implement Intelligent TrafficSystemUse of Electric vehicles and Fuel cell carsUse of Biofuels for carsIntroduce of freight transport centers

42
Figure 16. General description of the High investment sustainability scenario. (Dr. MohamedShahin, CGCE)
Figures 17 and 18 present the proposed public bus transport routes and their catchmentareas for Low Investment Sustainability Scenario. Figure 19 shows an example for theproposed road cross sections which contains PT and walking/bike reserved widths.
Figure 17. Proposed Public Transport Routes for the Low Investment Sustainability Scenario. (Dr.Mohamed Shahin, CGCE)
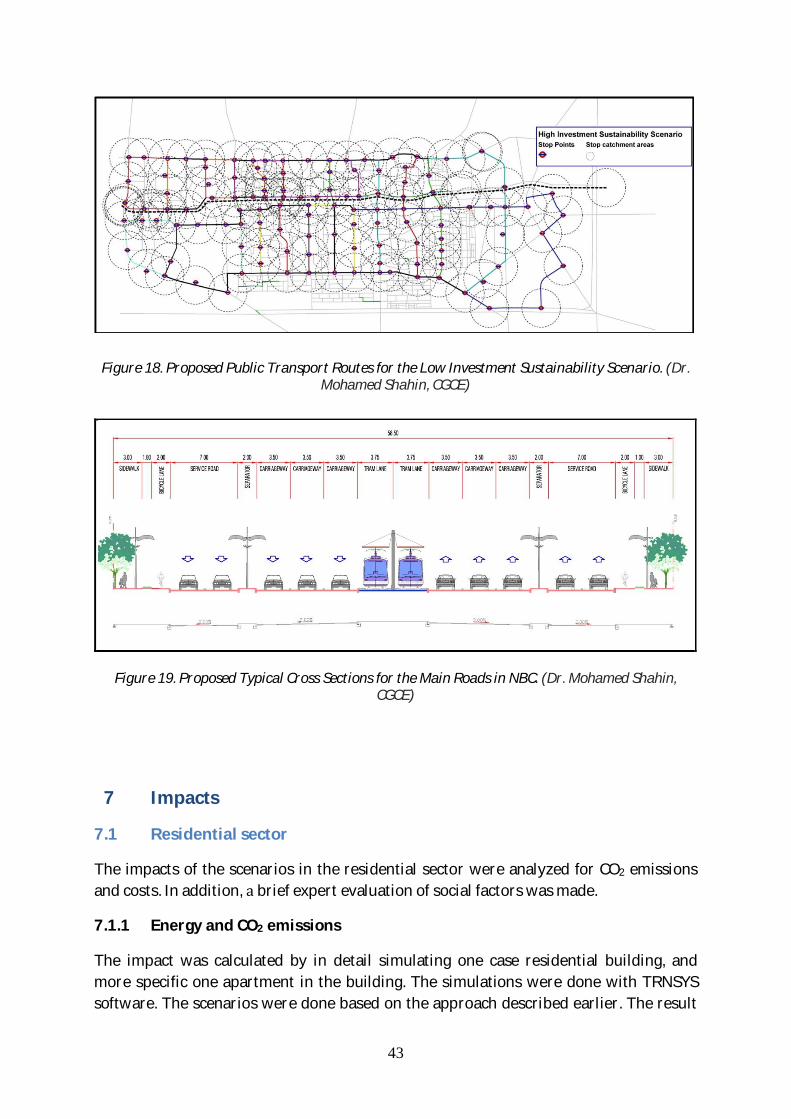
43
Figure 18. Proposed Public Transport Routes for the Low Investment Sustainability Scenario. (Dr.Mohamed Shahin, CGCE)
Figure 19. Proposed Typical Cross Sections for the Main Roads in NBC. (Dr. Mohamed Shahin,CGCE)
7 Impacts
7.1 Residential sector
The impacts of the scenarios in the residential sector were analyzed for CO2 emissionsand costs. In addition, brief expert evaluation of social factors was made.
7.1.1 Energy and CO2 emissions
The impact was calculated by in detail simulating one case residential building, andmore specific one apartment in the building. The simulations were done with TRNSYSsoftware. The scenarios were done based on the approach described earlier. The result

44
from one building was multiplied with the total amount of apartments, 178 125apartment units according to the master plan.
It was assumed that all buildings had the same shape as the case building, beingstoreys high. It must be noted that this would probably in reality not be the case. It shallalso be noted that if building would be higher than storeys, the rooftop area will notanymore be enough for the amount of PV panels per apartment assumed in the earliercalculations.
Table shows the energy performance of the district and the CO2 emissions calculatedon the energy balance. It is to be noted that even if these results indicate an overallsurplus energy production in the scenario HISc, this applies for the residential sectoronly. Actually it would mean that the residential buildings would be able to sell surpluselectricity to for example public buildings like schools or health centres or commercialbuildings like offices. The overall CO2 emissions in these results shall be interpreted asthe residential buildings surplus energy would replace average electricity and thereforeimpact the other sectors’ emissions. Since this analysis only takes the residential sectorinto account, these emissions are shown as negative for this sector.
Table 9. Annual final energy demand of the heating and cooling systems for the residential sector inNew Borg El Arab City, PV produced, consumed and exported energies and final energy balance,which includes the appliances energy consumption of each scenario.Note: CO2 emissions are calculated based on the final district energy balance and assuming theaverage Egyptian emission factor for electricity for all energy use.
BaU LIS HISa HISb HISc
Final district energy demand [GWh] 619,6 315,5 219,8 219,8 219,8Districts’ produced PV energy [GWh] 335,5 603,9 763,1Districts’ consumed PV energy [GWh] 114,7 189,7 205,7Districts’ exported PV energy [GWh] 116,6 236,2 343,5Final districts energy balance [GWh] 846,2 542,1 215,1 20,4 -103,0CO2 emission [1000t] 394,3 252,6 100,2 9,5 -48,0
The fundamental aim of very energy efficient building is to reduce the building energyneeds. LIS shows good results for very energy efficient building. Indeed the annualcooling and heating building needs, around 32 kWh/m² and 29 kWh/m² (16 kWh/m²space heating and 13 kWh/m² DHW), are respectively 46% and 26% less than theannual energy demands of the BaU case building. However, step further towards netzero energy building was taken in the HIS case. There, the annual building heating andcooling demands are respectively 24.71 kWh/m² (11.71 kWh/m² space heating and 13kWh/m² DHW) and 23.26 kWh/m², respectively 16% and 28% less than the energydemands of the LIS case building.
45
The energy system has central role in very energy efficient building. Indeed, energy isneeded to produce DHW and to cover both space cooling and heating demands. The HIScase was further divided into three: HISa, and c; they have different PV systemsconfigurations. The final energy consumption of LIS, around 15 kWh/m², signifies thatvery energy efficient building can be achieved using simple and affordable envelope andenergy system solutions. Indeed, it is half of the final energy consumption of the BaU.Particularly interesting are the results of HISa: the final energy consumption, aroundkWh/m², is about 65% less than that of LIS.
Finally, remarkable results were achieved in both HISb and c, using PV system size thatis within the range of the power capacities conventionally utilized in the residentialsector of the Mediterranean countries. In fact, both HISb and buildings can beconsidered net zero energy buildings, since the on-site renewable system (PV) suppliesalmost the whole energy heating and cooling system demand. Their final energyconsumptions are, respectively, 1.48 kWh/m² and 0.69 kWh/m². These figures do notinclude the home appliances’ consumption. Instead, they have been considered withinthe final energy balance of each scenario, which considers also the dumped energy fromthe PV system as being exported to the national grid. Both HISb and HISc results supportthe potential success of very low energy building concept in Egypt. Indeed, the HISbhas final energy balance that exceeds slightly zero, around kWh/m², while the HISchas negative final energy balance, around -5 kWh/m², meaning that the buildingproduces surplus of energy over the year.
It is evident that the impact is very big if these scenarios would be applied in the wholecity. Savings up to 605,7 GWh could be achieved and 282,2 tons of CO2 emissionscould be avoided. This amounts to the total CO2 emissions of 117 853 Egyptians. Thiscan be considered high impact since the city is planned to host 750 000 inhabitants.These savings from only the residential sector would enable 15% of the population tolive totally “carbon free”, theoretically calculated. The figure becomes bigger whensustainability actions for other sectors as transport, service and industry sectors aretaken into account.
In conclusion, very low energy and net zero energy buildings have been designed in linewith the local context, using envelope solutions to lower their energy needs andrenewable systems to achieve near zero or negative final energy balance. Ideally thisstudy along with others should attract the interest of local and central administrationsfor planning and building new eco-friendly residential districts that include very energyefficient buildings.
7.1.2 Cost effectiveness analysis
cost effectiveness analysis (CEA) was conducted using the VTT-CEA tool on themodelled apartment building. The selected type of CEA method is Dynamic GenerationCost (DGC), which gives as result the price of energy saved in terms of USD/kWh. Table

46
10 gives price information for BAU and LIS. Only technical systems that are differentbetween the two cases are listed, otherwise the buildings are the same. More detailsabout the method used are available in Tuominen et al. (2015).
Table 10. List of technologies in the two scenarios including price and replacement intervalestimates used in the calculation. Numbers are given per apartment.
Scenario System name Investment cost(USD)
Interval for replacingthe system (years) Reference
BAU
Double red brick wall with an airgap 4914 Egyptian Ministry
of Housing (2014)Incandescent (6) andfluorescent lights (24) 87 (incandescent), 10
(fluorescent)Alliance to saveenergy (2011)
Advanced fan coils (13) for aircirculation 2080 20 Alibaba (2014a)
Regular hot water storage tank 1500 20 Alibaba (2014b)Total 8581
LIS
Insulated building envelope 6037 Egyptian Ministryof Housing (2014)
External reflective paint 488 10 Egyptian Ministryof Housing (2014)
Shading system for windows 420 20 Egyptian Ministryof Housing (2014)
Fluorescent lights (30) 105 10 Alliance to saveenergy (2011)
Free flow vents and advancedfan coils (8) 1780 20 Alibaba (2014a)
Efficient hot water storage tank 1900 20 Alibaba (2014c)Unglazed solar thermal collectorsystem 1250 20 Egyptsolar (2014)
Total 11980
From the point of view of the CEA calculation, the BAU scenario serves as the referencecase, DGC being calculated for LIS. Table 10 gives the cost estimates used in the CEAcalculation as well as the intervals for system replacements per apartment. Additionallyit is assumed that in LIS on average one work day annually is used by an unskilledworker cleaning the rooftop systems and one workday by skilled professionals, such asan electrician, on system check-ups, totalling 40 USD/a using typical local costs. Thecalculation is made with 10 discount rate for year of investments and 50 years ofoperating, maintenance and replacement costs.
The result was that the measures under consideration in low investment scenario hadcost of 0.21 USD/kWh for energy saved. Electricity price in Egypt is heavily subsidised
and even after recent price hikes is expected to settle at 0.07 USD/kWh (Kalin, 2014). Itwould therefore appear that the combination of energy efficiency measures studied inLIS is not at present economically sensible from pure investment calculationperspective. However, further cuts in subsidies are expected. In EU countries theaverage electricity price was 0.25 USD/kWh in 2013 (Eurostat, 2014), which wouldsuffice to make the investment profitable. Moreover, the positive effects of reduced

47
pollution, climatic effects and consumption of non-renewable resources may justify thesomewhat higher cost.
7.1.3 Social impact analysis
The Social impacts of the options in the scenarios could be summarized in the following:
Health and wellbeing impactsThis mainly relates to the public health improvements observed as result of improvedheating and cooling of buildings and air quality from more efficient transport and powergeneration and less demand for both.
Poverty alleviation: Energy affordability and accessAs energy demand and bills are reduced for the poor, these households have the abilityto acquire more and better energy services, as well as free up income to spend onsatisfying other critical needs. In addition, as utilities improve their supply-sideefficiency, they can provide more electricity to more households, thereby supportingincreased-access initiatives, which is often an important stated objective of supply-sideenergy efficiency activities in developing countries.
Increased available incomeAcross all income levels, when energy efficiency in the household improves, reducedenergy bills provide increased disposable income for households, individuals, andenterprises. The effect of increased spending and investment can in turn result inpositive macroeconomic effects.
Increased asset valuesThere is evidence that investors are willing to pay rental and sales premium forproperty with better energy performance. Some values of this premium have beenestimated for commercial property.
Figure 20. Effects of energy efficiency improvements. (Ryan Campell, 2012)

48
Generally speaking, energy efficiency improvements have multiple social, economic andenvironmental effects summarized in Figure 20.
7.2 Transport sector
7.2.1 Evaluation process for projecting the transportation energy consumptionand emissions under different policies
Figure 21 illustrates the multi-stepped process proposed to evaluate different policytechniques. Based on the transport activities, the expected vehicle stock and the newtechnology trends, the energy consumption and emissions (in the target year) can becalculated.
Figure 21. Multi-stepped Process for the Evaluation of Policies Techniques. (Dr. Mohamed Shahin,CGCE)
TransportationSituation
TransportForecastModels
TransportActivity
Vehicle StockSurvival Rates
Base YearVehicle Stock
Target YearVehicle Stock
NewTechnology
Trends
EnergyConsumption &Emission Rates
Total EnergyConsumption and
Emission
ReferenceScenario
Combination ofActions
Total EnergyConsumption and
Emission
FormulateAbatementScenarios
Evaluation &Reporting
BUSINESS ASUSUAL
LOWINVESTMENT
SUSTAINABILITYSCENARIO
HIGHSUSTAINABILIT
Y SCENARIO

49
7.2.2 Transport Forecast Models
Stated Preference (SP) questionnaire refer to the individual's preference is designedand used to estimate the demand for the proposed new transport services proposed inthe above two options for NBG as indicated in Figure 22. The survey contained SPexercises (choice games) submitted to the sample of respondents. The choice scenariosare constructed by combining attribute levels with each other.
Figure 22. An Example of High Sustainability Scenario from SP Questionnaire for NBG.
The survey was for all sets of urban communities and zones (about 30 respondents). Thequestionnaire contained SP experiment regarding the choice among three differenttransport alternatives: Private Car, Microbuses/tuk-tuk and Bus Rapid Transit (BRT) forthe Low Investment Sustainability Scenario and Private Car, Microbuses/tuk-tuk andLight Rail System (LRT) for the HIS scenario. After collecting survey sheets, the choice ofsuch question was recorded. The logit model calibration was estimated to analyse theexpected choice behaviour, as explained in the next paragraphs. SP outputs are modalsplit for each scenario as shown in Figure 23. The freight transport share is adoptedusing the approved plans and scenarios for the Egyptian Rail Freight System developedby the Egyptian Ministry of Transport.
Finally, for the different scenarios, the future O-D matrices are determined, then“VISUM” program is applied to predict the travel conditions on the different links of theproposed scenarios road networks as well as the effectiveness of the suggested publictransport systems.
MCV1
2 Car
Travel time
Travel Cost
Waiting Time
Walking Time
Interchanges
Which is your BEST option? A B C
Which is your WORSE option? A B C
Microbus&Tuk Tuk LRT
40 Min 20 Min 10 Min
LE 6 LE 4 LE 3
30 Min 5 Min
20 Min 20 Min 10 Min
No Interchange 1 Interchange 1 Interchange
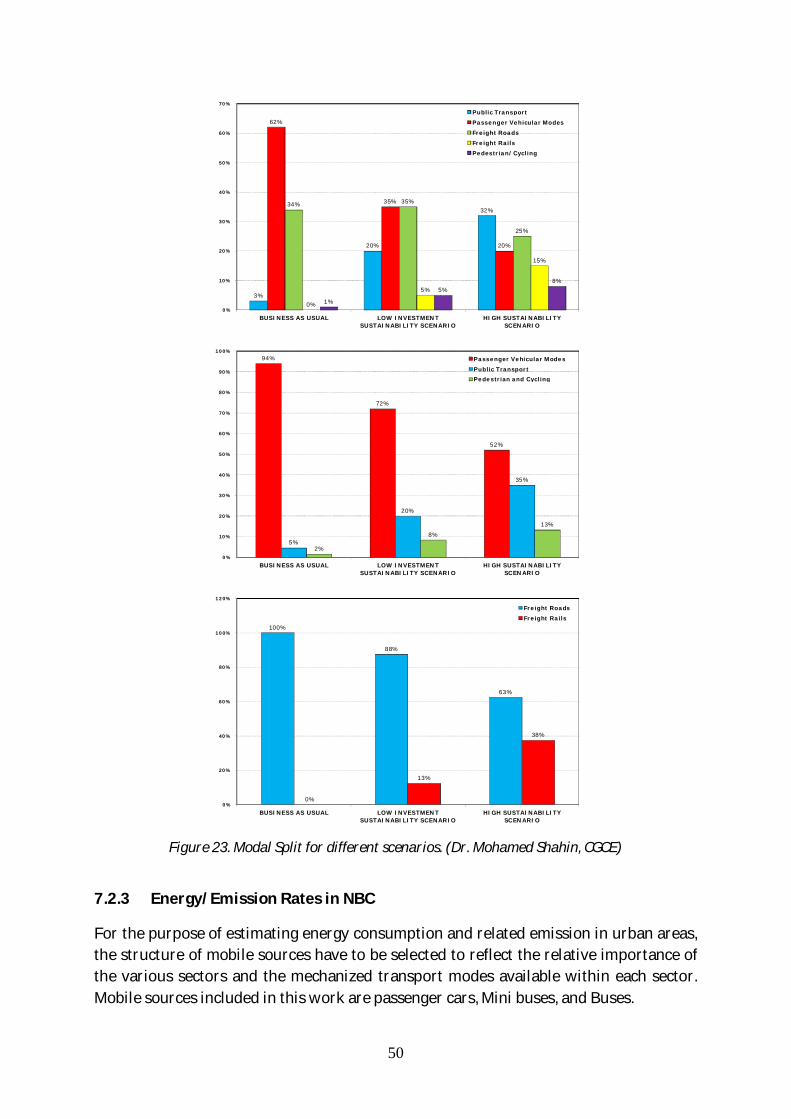
50
Figure 23. Modal Split for different scenarios. (Dr. Mohamed Shahin, CGCE)
7.2.3 Energy/Emission Rates in NBC
For the purpose of estimating energy consumption and related emission in urban areas,the structure of mobile sources have to be selected to reflect the relative importance ofthe various sectors and the mechanized transport modes available within each sector.Mobile sources included in this work are passenger cars, Mini buses, and Buses.
3%
20%
32%
62%
35%
20%
34% 35%
25%
0%
5%
15%
1%
5%8%
0%
10%
20%
30%
40%
50%
60%
70%
BUSINESS AS USUAL LOW INVESTMENTSUSTAINABILITY SCENARIO
HIGH SUSTAINABILITYSCENARIO
Public TransportPassenger Vehicular ModesFreight RoadsFreight RailsPedestrian/Cycling
94%
72%
52%
5%
20%
35%
2%
8%
13%
0%
10%
20%
30%
40%
50%
60%
70%
80%
90%
100%
BUSINESS AS USUAL LOW INVESTMENTSUSTAINABILITY SCENARIO
HIGH SUSTAINABILITYSCENARIO
Passenger Vehicular ModesPublic TransportPedestrian and Cycling
100%
88%
63%
0%
13%
38%
0%
20%
40%
60%
80%
100%
120%
BUSINESS AS USUAL LOW INVESTMENTSUSTAINABILITY SCENARIO
HIGH SUSTAINABILITYSCENARIO
Freight RoadsFreight Rails

51
Since there are many different model years passenger car on the road, this mode arefurther classified by age of the vehicle. They are split into vehicle ages classes (e.g. >10years old, 5–10 years old, and years old). The determination of the energyconsumption rates for different modes in NBC is based on data collected from realmeasurements. Table 11 presents the fuel consumption rates (FCR) for the private caraccording to the distribution of age classes as well as the calculated composite fuelconsumption rate (each class’s fuel consumption rate is multiplied times its relativeprevalence in the fleet). This composite fuel consumption rate represents the full fleet ofthe private cars. Table 12 shows the fuel consumption rates for different road transportmodes in NBC. These rates are found to be suitable at the average speeds listed in thetable.
Table 11. Fuel Consumption Rates (FCR) of Private Cars in NBC for year 2013 (Gasoline).
Mode Class FCR(l/100km)
Prevalence (%) Composite FCR(l/100km)
Up to Years 8.7 19Private Car – 10 Years 10.3 27 11.292
10 Years and More 12.7 54
Table 12. Fuel Consumption Rates for different Transport Modes in NBC.
Mode Average Speed(km/h)
FCR by Fuel Type (l/100km)Gasoline Gas Oil
Private Car 40-50 11.292 -Microbus 30-40 - 20.5
Public Bus 20-30 - 48.9
In order to develop the previous fuel consumption rates at different average speeds, theSwiss/German emissions model “Handbuch der Emissionsfaktoren des Straßenverkehrs2010” has been studied within the framework of this study. It provides fuel consumptionfactors for all vehicle types at different urban driving patterns (i.e. different averagespeeds in urban areas). When these factors are displayed as function of the averagespeed, the energy consumption factors tend for the most part to fall on reasonablysmooth curve. It is therefore possible to generalize the Swiss/German energyconsumption factors as continuous functions depending on the average vehicle speed.
The characteristic shapes of these curves have been studied and thought that they areconstant somewhat for each vehicle type (i.e. passenger cars, Mini buses, and Buses).Thus, the differences in the fuel consumption due to the changes in the average speedsare found to be constant for every vehicle type. Figure 24 presents the calculateddifferences in the fuel consumption due to the changes in the average speeds accordingto the Swiss/German emissions model.

52
a) Passenger Car
b) Mini Buses
c) Buses
Figure 24. Extra Fuel Used due to Average Speed Distribution. (Dr. Mohamed Shahin, CGCE)

53
These differences are used with Alexandria fuel consumption rates, listed in Tables 11and 12, in order to develop fuel consumption rates at different average speeds for NBGroad transport sector. Then and based on data collected about the quality of differenttypes of fuel used in Egypt, conversion factors and the emission rates for CO2 are usedaccording to fuel type.
7.2.4 The Computer System “TraEco”
One of the objects of this work is to provide link between transportation and energyfields. For this purpose, the computer system “TraEco” is developed to estimate roadtransport energy consumption and emission in urban areas. “TraEco” is written in visualbasic for applications language. The main advantage of this system is that it is simple torun and can be applied to any urban area with different transport systems, fuel typesand emissions as long as the input data can be provided. In addition, this program givesthe possibility to examine different fuel type distribution (i.e. fuel switching) as well asdifferent traffic conditions.
This system consists of four main modules. The first module (Initial Data Entry) is dataeditor to introduce the links number, transport modes (number and names), fuel types(number and names), and emission types (number and names). The data is storedautomatically on the computer disk from which it can be displayed on the screen,printed or modified.
The second module (Data Organization Management) is to introduce sheets dataaccording to initial input data.
The third module (Main Data Entry) is also data editor for entering the output of thefour-step travel demand models (links activity and speed) as well as the specific energyconsumption and emission rates. The data is stored automatically on the computer diskfrom which it can be displayed on the screen, printed or modified.
The fourth module (Energy and Emission Calculation) is divided into two stages. Thefirst stage is energy consumption and emission calculation for each link according to itsaverage speed. The second stage is total energy consumption and emission calculationfor the whole network for each transport mode. The fundamental structure of “TraEco”system is illustrated in Figure 25.

54
Figure 25. The Fundamental Structure of TraEco System. (Dr. Mohamed Shahin, CGCE)
7.2.5 Evaluation of Scenarios
Table 13 presents some indicators relating to the performance of NBC’s transportationsystem under different scenarios as well as the existing condition.

55
Table 13. Transportation Indicators for Different Scenarios in NBC.
As can be seen from the table, the total length of the road network of NBC will reachabout 428 km which constitute about 0.8 km per 1000 inhabitants for differentscenarios compared to 316 km and km per 1000 inhabitants in the base year 2013.Compared to the base year and Business as Usual scenario which have no dedicatedfixed PT routes, the low and high investment scenarios have dedicated PT routes equalto 98 km and 208 km respectively. This contributes to about 0.165 km and 035 kmlength of reserved PT routes per thousand inhabitants for the low and high investmentscenarios respectively.
In the BAU scenario, private motorized vehicles (private cars and Microbuses/tuk-tuk)represent the highest share of the daily passenger trips with about 94% while the sharesof daily passenger trips by PT and foot/bikes represent are only about 5% and 1%respectively. In the low and high investment scenarios, the shares of daily passengertrips by PT are 20% and 35% while the shares of daily passenger trips by foot/bikes are8% and 13% for each scenario respectively.
Overall average trip length is 14.6 km and average trip time is 23.1 min and the averagespeed is 38 km/hour for BAU scenario while for low and high investment scenarios theaverage speeds are 48 km/hr and 46 km/hr with noticeable reduction in the averagetrip length and time by about 53% and 63% respectively if compared to the BAUscenario.
Under the different scenarios, great improvement of the average volume over capacity(v/c) ratio has been achieved. Under low and high investment scenarios (which includethe introduction of new public systems), the average v/c ratios are 50% and 32%respectively compared with 81% under the BAU Scenario. Using the output data fromthe assignment (i.e. activities and average speeds) as an input data in the TraEcocomputer system, explained above, the total energy consumption is calculated in theyear 2035 under different scenarios. The total energy consumption needed for thepassenger transport in Alexandria under BAU scenario will achieve 2.876 PJ in the year2035; i.e. with an increase rate of about 670 of the consumption in the year 2013(0.426 Pj).
Indicator UnitBase Year
2013
BAUScenario
2035
LowScenario
2035
HighScenario
2035Population Inhabitans 80000 600000 600000 600000Total Road Length km 316.7 482.71 482.71 482.71Length of road per thousand km/th. inh. 3.96 0.805 0.805 0.805percentage of daily passenger trips by private motorized modes % 96% 94% 72% 52%Percentage of daily passenger trips by Public Transport % 3% 5% 20% 35%Percentage of daily passenger trips on foot and by bicycle % 1% 1% 8% 13%Length of reserved public transport routes km 0.00 0.00 98.72 208.53Length of reserved public transport routes per thousand inhabitants km/th. inh. 0.00 0.000 0.165 0.348Percentage of population that lives within a given distance (400 m) from transit stops/stations (public transport) % 0% 0% 53% 78%Average Speed km/h 52 38 48 46Average Trip Length km 12.7 14.6 6.8 6.8Average Trip Time min 14.6 23.1 8.5 8.9V over C % 48% 81% 50% 32%Energy Consumption Tj/year 426.5 2876 1811.9 1207.9CO2 Emissions Kilo Ton/year 31.9 209.1 125.0 79.7

56
Under LIS and HIS scenarios, significant reductions of the energy consumption areexpected with about 37% for low investment scenario and 58 for high investmentscenario less in energy consumption compared to BAU scenario as shown in Figure 26.
Finally the annual CO2 emission is calculated using the "TraEco Program" for differentscenarios in year 2035. In BAU scenario, the amount of Co2-emissions will achieve about209 kilo-ton; i.e. with increase rates of about 650 of those emitted in the year 2013(see Figure 26).
Similar to the energy consumption under the different scenarios, significant reductionsof the CO2-emissions are expected with about 40 in low investment scenario and 62in high investment scenario less than those emitted in the BAU scenario.
Figure 26. Energy consumption and CO2 emission differences (in %) under different scenarios fromthe situation of the Base Year 2013 and the BAU scenario 2035. (Dr. Mohamed Shahin, CGCE)
The reasons for such reductions in the energy consumption and CO2 emissions can besummarized as follows:
The intensive modal shift from road transport to public transport.The improvement of the traffic conditions on the road network.The fuel switching from fossil fuels to electricity.

57
7.2.6 Cost analysis
The estimated capital cost for different transit systems include funding agency of acquiringright-of way, constructing these systems corridors and stations, procuring vehicles, andinstalling supporting systems such as fare collection, security, and passengerinformation systems. They include costs of design, engineering, and projectmanagement and exclude the out-year costs of reconstruction or replacement offacilities.
The Transit Cooperative Research Programme (TCRP) presents range of capital costsfor different systems, depending on facility type, station type, vehicle type, farecollection system, and other information and safety systems.
Transit length and stations for NBCTable 14 illustrates the length and the number of stops for BRT and LRT systems withindifferent scenarios developed in the framework of the ECO project for NBC.
Table 14. Properties of Transit Systems in LIS and HIS scenarios.
LIS scenario
BRT Length (Km) Number of Stops
BRT Line 23.475 25BRT Line 20.402 18BRT Line 26.148 28BRT Line 28.696 27
Total 98.721 98
HIS scenario
BRT Length (Km) Number of Stops
PT (LRT) 27.368 23PT (LRT) 38.213 27PT (BRT) 18.352 22PT (BRT) 13.174 14PT (LRT) 23.056 20PT (LRT) 13.225 17PT (LRT) 18.121 18PT (BRT) 14.335 14PT (BRT) 11.718 16
PT 10 (BRT) 10.456 12PT 11 (LRT) 20.493
Total BRT 68.034 78Total LRT 140.477 110

58
Capital costs for different Transit Systems worldwideThis section shows the estimated capital costs for different transit systems worldwide.(Source: Comparative examination of New Start light rail transit, light railway, and busrapid transit services opened from 2000. Lyndon Henry, Principal/Consultant, MobilityPlanning Associates Austin, Texas, 12 November 2012)
LRT Substantial Installation
Lowest HighestLocation St. Louis – Metrolink St. Clair
Extension (2001)Seattle – Link LRT South segment(2009)
Length 28.1 km 25.2 kmCost $339.2 million $2.57 billionCost perKm
$17.6 million/km $113.2 million/km
LRT Minimal Installation
Lowest HighestLocation Portland – Portland Streetcar
(2001)Phoenix - Metro (2008)
Length 3.9 km 31.6 kmCost $56.9 million $1,400.0 millionCost perKm
$21.5 million/km $50.8 million/km

59
BRT Substantial Installation
Lowest HighestLocation Pittsburgh – West Busway (2000) Boston – Silver Line Phase II/Piers
Transitway/Waterfront tunnel(2003)
Length 9.0 km 1.6 kmCost $419.2 million $790.3 millionCost perKm
$70.1 million/km $490.0 million/km
BRT Minimal Installation
Lowest HighestLocation Eugene, Oregon – Emerald Express
(2007)Cleveland – Health Line/EuclidAvenue (2008)
Length 4.0 km 7.1 kmCost $24.6 million $197.2 millionCost perKm
$7.2 million/km $31.9 million/km
From the previous review it can be concluded that the suitable BRT and LRT system isthe minimal installation type which be applicable in NBC. The recommended cost forBRT system is $7.2 million/km (54 LE million/km) and LRT System is 21.5 million/km(161.25 LE million/km).

60
Capital costs for NBC transport scenariosTable 15 and Table 16 illustrate the capital cost for BRT and LRT systems withindifferent scenarios developed in the framework of the ECO project for NBC based on theconsultants experience in Egypt and the recommended cost based on the worldwideprices. There are no costs attached to biofuels and electric vehicles since the FS teamdoesn’t have experts that can translate worldwide prices of such technologies to theEgyptian context.
Table 15. Low Investment Sustainability scenario cost.
Measures Description Consultant’sExperience
Worldwide Prices
Cost Unit TotalCost
(MillionLE)
Cost Unit TotalCost
(MillionLE)
BRT RapidTransit Networkon the mainroads of NBC
BRT systems, with average routelength 99 Km covering NBC over 98station.
3.2MillionLE Per
Km
316.8 54MillionLE Per
Km
5346
Pedestrian andCycling Facilities
Pedestrian facilities include paths,sidewalks, crosswalks, walkways,stairs, ramps, and buildingentranceways. Cycling facilities, allroads should be considered cyclingfacilities (except where cycling isspecifically prohibited). The cyclingnetwork should be network ofstreets (a grid of 0.5 kilometers or lessin urban areas) that ensure safebicycle access to all populardestinations. Pedestrian and CyclingFacilities will cover NBC over lengthequal 200 Km.
25,000LE Per
Km
5.0 25,000LE Per
Km*
5.0
CalmingMeasures in citycenters
Traffic calming measures areengineering tools used with the goal ofreducing vehicle speed and improvingthe safety of motorists, pedestrians,and bicyclists.Four types of measures arerecommended:Vertical deflections, horizontal shifts,and roadway narrowings are intendedto reduce speed and enhance thestreet environment for non-motorists.Closures (diagonal diverters, halfclosures, full closures, and medianbarriers) are intended to reduce cut-through traffic by obstructing trafficmovements in one or more directions.
0.5 0.5*
ParkingManagementsystem in citycenters
Introduce Parking Managementsystem for access controls andcustomer management (such as forretail, residents and employees) aswell as Park Ride concepts for
1.5 1.5*

61
Measures Description Consultant’sExperience
Worldwide Prices
Cost Unit TotalCost
(MillionLE)
Cost Unit TotalCost
(MillionLE)
commuters turn the city into aninviting space.
Biofuel/naturalgas poweredpublic transportMaintenance ofvehicles to themanufacturer'sspecificationsand applying forVehicleScrappingProgramme
Scenario Cost (Million LE) 323.8 5353.0
Based on the consultant’s experience.
Table 16. High Investment Sustainability scenario cost.
Measures Description ConsultantsExperience
Worldwide Prices
Cost Unit TotalCost
(MillionLE)
CostUnit
TotalCost
(MillionLE)
Bus RapidTransit Networkon the mainroads of NBC
BRT systems, with average routelength 55 Km covering NBC over 55station.
3.2MillionLE Per
Km
176 54MillionLE Per
Km
2970
Light RailTransit Networkon the mainroads of NBC
Light Rail Transit, with average routelength 102 Km covering NBC over 83station.
7.5MillionLE Per
Km
765 161.25MillionLE Per
Km
16447.5
New RegionalRailwayconnecting withAlexandria City
New Regional Railway with averageroute length 60 Km.
11.0MillionLE Per
Km
660 11.0MillionLE Per
Km*
660*
ImplementIntelligentTraffic System
The intelligent traffic system isimplemented using road side units(RSU) with friction monitoring,vehicles with environmental sensorsand database for data transferthrough different platforms.
Implementfreighttransportcenters
Implement three Freight transportcenters include classification yardsand truck terminals where passengersand cargo are exchanged betweenvehicles or between transport modes.
50.0MillionLE PerCenter
150 50.0MillionLE PerCenter*
150*

62
Measures Description ConsultantsExperience
Worldwide Prices
Cost Unit TotalCost
(MillionLE)
CostUnit
TotalCost
(MillionLE)
Pedestrian andCyclingFacilities
Pedestrian facilities include paths,sidewalks, crosswalks, walkways,stairs, ramps, and buildingentranceways. Cycling facilities, allroads should be considered cyclingfacilities (except where cycling isspecifically prohibited). The cyclingnetwork should be network ofstreets (a grid of 0.5 kilometers or lessin urban areas) that ensure safebicycle access to all populardestinations. Pedestrian and CyclingFacilities will cover NBC over lengthequal 200 Km.
25,000LE Per
Km
5 25,000LE Per
Km*
5*
CalmingMeasures in citycenters
Traffic calming measures areengineering tools used with the goal ofreducing vehicle speed and improvingthe safety of motorists, pedestrians,and bicyclists. Four types of measuresare recommended:Vertical deflections, horizontal shifts,and roadway narrowings are intendedto reduce speed and enhance thestreet environment for non-motorists.Closures (diagonal diverters, halfclosures, full closures, and medianbarriers) are intended to reduce cut-through traffic by obstructing trafficmovements in one or more directions.
0.5 0.5*
ParkingManagementsystem in citycenters
Introduce Parking Managementsystem for access controls andcustomer management (such as forretail, residents and employees) aswell as Park Ride concepts forcommuters turn the city into aninviting space.
1.5 1.5*
Biofuel/naturalgas poweredpublic transportMaintenance ofvehicles to themanufacturer'sspecificationsand applying forVehicleScrappingProgramme
Scenario Cost (Million LE) 1758.0 20234.5
Based on the consultant’s experience.

63
8 Engagement of stakeholders
To engage stakeholders outside of the project consortium, workshops were arranged.The aim was to present the scenarios developed within the consortium and get freshview on those and feedback on them.
Stakeholders representing the following institutions were taking part in the workshops:
Environmental departmentAlex Businessmen AssociationHolding Company of PetrochemicalTechnology of Plastic Industry CenterSmall Business Modernization CenterAlexandria Cement CompanyConsultancy CenterCRTAChemical DepartmentMinistry of HousingA.N.R.P.CSocial Fund of DevelopmentASCIGSRCRTA CityCairo UniversityEgyptian Building CouncilNBC Investors Association
8.1 Challenges and opportunities of eco-cities from investors point of view
Egypt is typical example of developing country which is highly vulnerable to climatechange and which faces numerous threats to its economic, social and environmentalsustainability. This causes enormous fundamental pressures on Egypt’s competitiveness.These pressures can also be described as growing threats to national security. They arefueled by growing population and growing demand coupled with the constraints offinite resource base and could develop into genuine crisis situations if not quickly anddecisively addressed. These pressures include:
Energy SecurityUnsustainable use of energy resources is one of the major reasons for environmentaldegradation and climate change. The consequence is energy scarcity and rising energyprices which increase poverty, strain national budgets and jeopardize Egypt’scompetitiveness for the future.

64
Water SecurityGlobal-warming results in sea-level rise due to the melting of glaciers and arctic ice.Consequently, the world’s fresh water resources decline while salt water intrudes intounderground reservoirs. Egypt is particularly susceptible due to its low-altitude NileDelta.
Food SecurityLimited water and agricultural land coupled with population growth and other factorsare creating mounting pressure on Egypt's ability to provide food for its people in thefuture.
Climate ChangeDeclining precipitation levels, changing weather patterns, and rising seas in the NileDelta are slowly but steadily making difficult situation worse, especially in the area offood and water.
The Need for JobsEgypt's young population is hungry for work, and Egypt needs to generate over onemillion new jobs every year for its growing workforce.Companies are very much affected by the scarcity of available resources and they cannotsurvive in the future if they cannot predict and adapt to major trends like climatechange.
8.1.1 Challenges
Lack of fundingAmid the political turmoil, economic growth remains weak in Egypt with high fiscaldeficit and gross public debt (domestic and external) rising to nearly 100% of GDP at theend of June 2013. Low growth rates posed the danger of fuelling social frustration asthey could not deliver the numbers of jobs and opportunities needed. Unemploymentreached over 13% in June 2013. Critically, more than three-quarters of the unemployedare between 15 and 29 years of age (World Bank, 2014). Under these difficult economiccircumstances, lack of funding of national projects is becoming major problem forEgypt.
Lost capital investment (into non-green assets)One of main capital investment sector in Egypt during the last few years was the realestates. Thousands of buildings were constructed in the course of the last three yearswithout official licence. Unfortunately, the main purpose behind establishing thesebuildings was fast financial profit, and they hardly comply with any environmental rules.These are best examples of loss of capital investment into non-green assets. TheNational (June 2014) has written about Alexandria: “They can tell stories of once-multicultural city that was considered jewel of the Mediterranean until it graduallydegraded into the overpopulated, anarchic cement sprawl of budget holiday flats, slums,cement high-rises, exposed sewers, regular power cuts and since the 2011 Revolution
27,000 new buildings, the majority of them illegal”.

65
Figure 27. Green Transformation Strategy (OPS 2011) with modification.
The non-existing strategy for Green TransformationThe existence of strategy for green transformation is of prime importance. The mainpillar of which should be Environmental Sustainability through Greener BusinessPractices. This again will be based on the creation of Green Organizational Culture andtargeted reduction of the Environmental Footprints, which includes Reducingconsumption and managing demand in order to reduce the Public Sector (PS) impact onthe environment as seen in Figure 27. In other words, the green transformation has tobe incorporated in all the country’s development plans
Lack of collaboration between private and public sectorSince the nationalization of the industries corporations in Nasser’s time, the publicindustrial sector has been deteriorating. At the end it turns to be burden on the Stateeconomy in view of its heavy losses. Unfortunately, the privatisation policy followed inMubarak’s time was full of corruption causing more losses to the public sectors and tothe State. Currently the private sector has become fairly weak in Egypt, particularly asthe Armed Forces are taking now responsibility of several civilian projects.Collaboration between the private sector and the public sector which lead tostrengthening the private sector and increasing the efficiency of the operation of thepublic sector will have positive impact on the economy of Egypt particularly as theprivate sector is now widely acknowledged as key partner in development, includingthrough establishing new enterprises, creating jobs, providing goods and services,generating income and profits, and contributing to public revenues, which are critical toincreasing countries’ self-reliance and sustainable growth.
EnvironmentalSustainability through
Greener BusinessPractices
Environmental objectivesintegrated into all aspects ofthe lifecycle including
Targeted Reductions tothe PS Environmental
FootprintReducing consumption andmanaging demand in orderto reduce the PS impact onthe environment
Creation of a GreenOrganizational Culture
Engaging employees ingreening the PS in order toembed environmentalresponsibility in the culture andday-to-day work of the PS
PublicService (PS)
An EnvironmentallyResponsible

66
None existing of effective incentives, penalties and forms of private-public-partnership (PPP) regarding the implementation of eco-cities
The implantation of EcoCities is an example where the partnership between the privateand public sectors is very much needed. In addition to the environmental sustainabilityconcerns, the financial viability of the project, cultural considerations, community needs,capacity for future maintenance of the city, and the availability of suitable regulatoryand administrative framework for the administration of the city, are importantconsiderations. National and international incentives should be thought for successfulPPP in EcoCities, as it might be difficult to adopt one model for such partnership.
Lack of support towards the private sector in their adaptation measuresOne of the biggest challenges for the private sector in the near future in Egypt will besurviving with the policy of eliminating the energy subsidies in the next five years. Someindustrial establishments have already bankrupted, and brick industry has threatened toclose its doors. Several support measures should be carefully considered including taxalleviation, incentives to use renewable energy, etc. This together with identifyingcommon policy by the Government in facing the current problems and providing support toprivate sector in their adaptation measures are current milestones for the private sector.
Local administration performanceThis is characterized in Egypt by complicated and lengthy procedures, conflictingfunctions, widespread manifestations of corruption and low efficiency of localadministration employees. It important in any future country policy to address theseproblems and decrease the bureaucracy, of which Egypt is famous, and eliminate timeand energy waste by Governmental employees as well as the natives of Egypt.
Lack of integrated development approachAn integrated approach to development and policymaking will assist policymakers toavoid solving one problem while creating another. It will also contribute to society’smultiple objectives including social, economic and environmental ones. This approachplaces sustainability considerations and policy assessment within the overallpolicymaking cycle, thereby making sustainability an integral part rather than an ”add-on”— to any such process. This approach suggests using sustainable development asmajor filter for prioritizing competing issues and for formulating and deciding on policychoices while emphasizing culture of learning, monitoring and evaluation alongsideinvolving stakeholders and managing their dynamics at every stage (UNEP, 2008).
8.1.2 Opportunities
Egypt is one of the Sun Belt countries that enjoy one of the largest potentials of solar energy,the sunshine duration ranges between 9–11 per day from North to South with very fewcloudy days. Starting to build Solar Power Stations will be one of the sustainable, fast andeconomic solutions to cope with blackouts, which happen mainly in summer, contribute tosolve the problem of unemployment. In addition, Solar PV Power plants could be built inunites each one, e.g., 100 MW and could be commissioned in few weeks/months.

67
The increase in the percentage of youth in the population is positive indicator ofhuman resource, raising the challenge of providing the suitable environment for theireducation, training and employment. The big share of young people gives an opportunityto wide awareness-raising about environmental matters through schools and highereducation programs. This enables big part of the population to be highly aware ofenvironmental issues within rather short time frame.
Solid waste management has the potential to contribute to reduced landfill demand,reductions in green-house gases, produce renewable energy, lower terrestrial andaquatic pollution levels, improve public health, and reduced energy use in the transportand disposal of wastes. Recycling and reuse of wastes has the potential to create jobsand reduce dependence on material import for production. Waste managementchallenges in cities are amplified by high rates of urbanization.

68
9 Pioneering examples
9.1 Textile industry case study
This case example presents the treatment of reactive dyes wastewater in down flowhanging sponge (DHS) system at pilot scale.
9.1.1 Introduction
Reactive dyes, in particular, are used by the majority of the industries in NBC forcoloring different materials. Apart from inducing color to the receiving stream of water,many synthetic dyes are potentially toxic as well as carcinogenic (You et al., 2010).Synthetic dyes present in wastewater would destroy the natural quality of waterenvironment and also cause detrimental long-term health and environmental effects(Forgacs et al., 2004). Therefore, the removal of color from dyestuff manufacturingindustry wastewaters represents major environmental concern. Moreover, reuse of theeffluents represents an economic and ecological challenge for the entire sector. The aim ofthis study is to assess the efficiency of down-flow hanging sponge system at pilot scalefor decolorization of reactive dyes wastewater supplemented with mg/l cationicpolymer at different hydraulic retention times (HRTs) and organic loading rates (OLRs).Moreover, the effect of salinity on the removal of COD, BOD5 and color was investigated.The mechanism removal of color along DHS system height was also performed.
9.1.2 Material and Methods
Reactive dyes wastewater was collected from textile factory situated in Borg El Arabcity, Egypt. The composition of reactive dyes wastewater varied widely due to thevariety of recipes, techniques, machinery, raw materials, and fabrics used in theproduction processes of the factory. The wastewater was fed to Down-flow hangingsponge (DHS) system (Figure 28) and operated at different flow rates, HRTs and OLRs.The DHS system was equipped with effective volume of the sponge (3.6 l).
9.1.3 Results and discussion
This study was carried out to investigate, the color removal from reactive dyeswastewater supplemented with mg/l cationic polymer (Organo Pol.) in down flowhanging sponge (DHS) system. The reactor was operated at different hydraulic retentiontimes (HRTs) of 1.7, 2.3, 3.5, and 6.0 h., corresponding to organic loading rates (OLRs)of 12.44, 7.7, 5.6, 2.8 and 2.35 COD/l. d. At HRT of and OLR not exceeding 2.8COD/l. d., the reactor achieved removal efficiencies of 66.5 ±7.07% for COD t, 31.5 ±10for CODs; 96±1.5% for COD and 90.12 ±3.13% for color (Figure 31, Figure 32, etc.).TSS and turbidity removal efficiencies amounted to 87 ±5.8 and 94.5 ±3% respectively.The results revealed that, the removal efficiencies of the DHS system in terms of CODfractions was significantly dropped at higher and lower OLRs of 12.44 and 2.35 COD/l.
respectively. Nevertheless, the reactor achieved color, TSS and turbidity removal

69
efficiencies of 76.2±7.6, 83 ±6.5 and 92.2±3.2% respectively at HRT of 6.0 and OLR of2.35 COD/l. d. At the latter conditions adsorption process was the main removalmechanism and biodegradation process was minor due to high salinity of 17.9±0.36g/l in the influent wastewater. Besides high efficiency of dye removal, the DHS systemoffers many advantages for potential application such as minimal amount of sludgeproduction (0.36 TS/d) and also economically feasible since it does not require highcosts for aeration, and equipment. Moreover, the results indicated that decolorization ofreactive dyes wastewater in DHS system was feasible with the supplementation ofmg/l cationic polymer at OLR not exceeding 2.8 COD/l. d., and HRT of h.

70
Figure 28. DHS system treating reactive dyeswastewater. (Dr. Ahmed Tawfik, E-JUST)
Figure 29. Time course of COD total removalefficiencies at different HRT. (Dr. AhmedTawfik, E-JUST)
Figure 30. Time course of BOD5 totalefficiencies at different HRT. (Dr. AhmedTawfik, E-JUST)
Figure 31. Time course of color removalefficiencies at different HRT. (Dr. AhmedTawfik, E-JUST)
Figure 32. Effect of salinity concentration onthe color removal. (Dr. Ahmed Tawfik, E-JUST)
Figure 33. ATT; DO and color removal along theheight of DHS system. (Dr. Ahmed Tawfik, E-JUST)
Figure 34. The clean sponge prior starting theexperiments. (Dr. Ahmed Tawfik, E-JUST)
Figure 35. The densely attached biomass in thepolyurethane foam pores. (Dr. Ahmed Tawfik,E-JUST)

71
9.2 Paper industry case study
This case example presents hydrogen production from paperboard mill wastewater.
9.2.1 Introduction
Production of biofuels from wastewater has emerged as realistic possibility to reducefossil fuel use (Dqg et al., 2011). Paperboard mill is one of the most polluting industriesin Egypt since it requires large amount of water for its operation, and dischargesconsiderable quantities of wastewater (Leaño Babel, 2012). This can causeconsiderable environmental problems if discharged without effective treatment bypolluting land, water, and destroying aquatic life (Ahmad et al., 2011). It has beenidentified that the paperboard mill effluent is considered potential source to generaterenewable bio-energies through anaerobic digestion. That's because the PBE containsplentiful cellulosic concentrations which makes anaerobic digestion favorable wastetreatment technique (Chen et al., 2008), at the same time, it is could be feasibly utilizedfor H2 production for further using as an energy source (Chairattanamanokorn et al.,2012). Earlier studies indicate that paperboard mill wastewater will not only providethe energy source but also solve the wastewater treatment problems (Lay et al., 2013).Therefore, novel method for converting paperboard wastewater into environmentallyfriendly fuels aside with industrial wastewater treatment strategy is greatly desired.
9.2.2 Material and methods
Paperboard wastewater (PBW) was collected from Aldar Albydaa factory (NBC, Egypt).Printing paper and plastics wastes is used for manufacturing of paperboard. The factoryconsumes 60 ton/d., raw material and generates 700 m3/d., wastewater. The end of pipeeffluent was sampled and transferred to the environmental lab for experiments. CODparticulate and COD soluble represented 67.31% and 32.69% of the total COD,respectively. The VSS/TSS ratio of the wastewater is 0.44. Likely, the C/N ratio wasfound to be 38.97 which is considered optimal condition for H2 production. Theconcentration of total carbohydrates was 51.90 mg/L. The batch tests were performedto optimize the Tween 80 and Polyethylene glycol 6000 concentrations for higherhydrogen generation utilizing the paperboard mill effluent. Different mixtures betweenthe substrate and these surfactants inoculated with heat-treated sludge have beenconducted in serum bottles with working volume of 400 mL. Anaerobic conditions werecreated in the bottles by nitrogen gas sparging. The bottles were maintained atconstant temperature of 65 °C to simulate the real situation where the end of pipeeffluent temperature exceeds 60 °C and pH of 7.0. Control samples were prepared inparallel without no addition of surfactants. The duration of the experiments was daysfor all mixtures. The bottles were capped tightly with rubber stoppers and aluminumcrimp seals. Two types of surfactants were used in this investigation 1. Tween 80 in mL(PolyoxyethyleneSorbitan L332090 Mono-Oleate, water 3.0%, Density 1.08, RTECS#7WG2932500, EINECS 215-665-4 TSCA, ROTH Bestellen Siezum, Germany) and 2.Polyethylene glycol 6000 in mg/L (MW 5600-7000, H(OCH2CH2)nOH, RTECS#ZD2465300, EINECS 200-849-9 TSCA, Kentucky 40361, Paris).

72
9.2.3 Results and discussion
Three sets of batch experiments were conducted to investigate the effect of addition ofsurfactants on the hydrogen production from paperboard mill wastewater (Table 17).The best response was recorded for hydrogen production with Polyethylene Glycol 6000addition where the hydrogen yield amounted (61.85 mL/gCOD) and the maximumhydrogen production was 130.9 mL which was 1.85 fold of that produced from thecontrol samples. Moreover, about 68.29% of total COD has been removed using PEGcompared to 46.30% using Tween 80 achieving 140.58% and 63.11% higher than thatremoved without any surfactants, respectively (Figure 36 and Figure 37). The mainsoluble products were acetic acid, butyric acid, lactic acid, and propionic acid for allmixtures. The paperboard mill wastewater could be tapped as one of the potentialsources of renewable organic matter source to produce hydrogen.
Table 17. The kinetic parameters of hydrogen production from various mixtures. (Dr. AhmedTawfik and Ahmed Farghaly, E-JUST)
No. Case Samplelabel (mL H2
Rm (mlH2/h) (h) R2
Control57.86 6.59 12.00 0.97
S+AS 70.80 7.00 10.00 0.99
Tween 80
80.16 7.50 12.00 0.9898.75 8.73 11.00 0.99
104.30 9.07 8.00 0.99
121.25 12.07 10.00 0.9910 94.75 9.50 11.00 0.96
PolyethyleneGlycol6000
PEG 117.60 8.57 8.00 0.97PEG 130.93 11.87 6.00 0.98
10 PEG 88.40 7.33 6.00 0.9911 PEG 87.40 8.87 6.00 0.9812 10 PEG 87.10 9.27 10.00 0.99

73
Figure 36. Effect of Tween 80 addition on the cumulative hydrogen (mL) from paper boardwastewater. (Dr. Ahmed Tawfik and Ahmed Farghaly, E-JUST)
Figure 37. Effect of polyethylene glycol (PEG) addition on the cumulative hydrogen (mL) frompaper board wastewater. (Dr. Ahmed Tawfik and Ahmed Farghaly, E-JUST)
9.3 International examples
There are many good examples of EcoCity developments in different parts of the world.Europe has been fore runner in this aspect, there are some cities in Europe that havealready for decades had eco-efficiency as main objective in their urban planningprocesses. One of these is Freiburg in Germany which will be presented below.Vancouver, Canada is one of North America’s best examples of ecological urban planningand is also presented below. The Finnish case Viikki in Helsinki is described alsopresenting district where ecology has been the core in planning for decades.
0,0
20,0
40,0
60,0
80,0
100,0
120,0
140,0
0,0 3,0 6,0 9,0 12,0 15,0 20,0 27,0 32,0 46,0
Cum
ulat
ive
H2
(mL)
1 T 3 T 5 T 7 T 10 T
0,020,040,060,080,0
100,0120,0140,0
0,0 3,0 6,0 9,0 12,0 15,0 20,0 27,0 32,0 46,0
Cum
ulat
ive
H2
(mL
)
Contact time (h)
1 PEG 3 PEG 5 PEG 7 PEG 10 PEG
Contact time (h)

74
9.3.1 Freiburg, Germany
Freiburg was founded in 1120. It has approximately 230 000 inhabitants. The city isuniversity city with no major industry facilities. In Freiburg sustainable developmenthas been leading theme in the city planning since the 80’s. The planning team consistsof people from different areas: energy, traffic, waste water, park-division. Thesedifferent experts work together throughout the whole planning process. The overallobjective of district is always decided first: energy-efficiency/car-free/densely built,etc. Involving inhabitants in the planning process is valued very highly. One concreteway to do this has been to let inhabitants plan common spaces themselves (Daseking,2009).
Over decade ago principle decision was made not to allow big markets outside thecentre. This decision was done to ensure services in the city centre and to reduce thedependency of cars (Daseking, 2009). Many studies show that big service centresoutside city canters damages the city centre in terms of services. Freiburg wasforerunner in making such strategic decision. It has later been followed also in otherparts of Europe.
On the outskirts of Freiburg in the mountains, there is wind farm, which is visible allover the city. There is district heating plant which has metering system whichvisualizes the energy produced and the emissions created. Also comparing informationto “basic plants” is shown.
Vauban is one residential area which has many ecological aspects. When starting theplanning, the general objective was to create car free district. There is parking garagein the outskirt of the district with solar panels on the roof. Within the district you canmove easily with the tram. Important to note is that the tramline was built before thehouses, this to ensure that when the residents move in, they already have functioningpublic transportation available. The tramlines have “noise prevention” solution carriedout in very easy way, by having grass under the lines which absorbs the noise. Overallnoise level is very low in Vauban due to the absence of cars (Daseking, 2009). 85/1000inhabitants in Vauban owns car.
The houses in the Vauban area are all very energy efficient. This achieved by goodinsulation, good windows and doors, heat recovery units in ventilation systems andarchitectonic solutions keeping solar heat out in the summer. It is common to see solarpanels and solar heaters on the roofs of the buildings.

75
Figure 38. Tramline with grass lowering the noise level. (Åsa Hedman, VTT)
Figure 39. Residential houses in Vauban with solar shading solution integrated in thearchitectonics of the houses. (Åsa Hedman, VTT)
The building lots were sold one-by-one, not bloc-by-block to construction companieslike is often done (Daseking, 2009). This together with the principle of giving rather freehands with the visual architectonic designs of houses has led to nice end result withhouses looking different from each other and creating “lively” impression. Through thedistrict there is small river and green area where people can feel the closeness ofnature while at the same time being very close to the city centre and having most dailyservices available within their own district.
9.3.2 Vancouver, Canada
Vancouver is 600 000 inhabitants city in Western Canada. The city’s target is tobecome the greenest city in the world by 2020. To achieve this ambitious target the citystaff are working with Council, residents, businesses, other organizations, and all levelsof government to implement the Greenest City 2020 Action Plan. The Action Plan is

76
divided into ten goal areas, each with specific 2020 target. Together, these addressthree overarching areas of focus: Carbon, Waste and Ecosystems.
In the 1990’s Vancouver’s City Council embarked on comprehensive planning initiativecalled CityPlan. Through CityPlan, Vancouver residents and City Council agreed on thesedirections for the city’s future:
Strengthen neighbourhood centresImprove safety and ensure appropriate community servicesReduce reliance on the carImproving environmental sustainabilityIncrease the variety and affordability of housingDefine neighbourhood characterDiversify parks and public placesInvolve people in decisions affecting their neighbourhood
As part of this process, it was recognized that CityPlan could only be truly effective if itwas ‘scaled’ to the neighbourhood level. Vancouver is focusing on green building designand construction. Council's environmental regulations for new buildings are some of thegreenest of any city in North America. Guidelines, standards, and polices have beendeveloped in Vancouver that contribute to further improvements in energy efficiency,including: passive design guidelines, electric vehicle recharging requirements andguidelines for water wise landscapes.
Regarding electric vehicle recharging requirements, the city council have updatedbuilding bylaws to include mandatory charging infrastructure for multi-family homes.To accommodate electrical vehicles in new apartment buildings, condos, townhouses,and other buildings with minimum of three homes, Council has made the followingrevisions to the City's building bylaw:
Parking stalls 20% of the parking stalls in every building must includereceptacle for charging cars.Electrical room The electrical room must include enough space to install anyequipment necessary to provide charging for all residents in the future.
While supporting EVs in new buildings is important, the City is also supporting earlyadopters who live and work in existing buildings that have no access to electric outlets.Guidelines for installing EV charging infrastructure are being developed. Guidelines shalloffer information on costs and charging technology options, so that building managers,strata councils, and fleet managers can understand the implications of providing EVcharging. The City will also facilitate the development permitting process for retrofittingbuildings to include charging infrastructure.
Regarding water wise landscapes, the city has developed guidelines to help developersand designers create high efficiency homes, offices, and public facilities.

77
EcoCity green re-zoning policies, passed by the Council in 2008 as the EcoDensityCharter and Initial Actions, established re-zoning policy to achieve highersustainability standards as an essential part of large site developments. All re-zoningsthat involve acres or more of land must include plans or studies in six areas:
1. District energy screening and feasibility2. Sustainable site design3. Green mobility and clean vehicles4. Rainwater management5. Solid waste diversion6. Sustainable housing affordability and housing mix
Source: Vancouver.ca
9.3.3 Viikki, Finland
Viikki is situated in the eastern part of Helsinki, Finland. In Viikki ecological aspects havebeen the core of planning ever since the early 90’s. The development has been consistentin terms of setting ecological values in focus, beginning from strategic planning todetailed project planning, implementation and follow up.
The Eco-Viikki district was built between 2000 and 2004. Around 2000 people live inEco-Viikki. criteria setting to support ecological construction was developed for theconstruction of the district. wide range of aspects were taken into account including:emissions, use of natural resources, healthy constructions and the diversity of nature,efficient use of energy, water and material were essential parts of the criteria. Theecological criteria had to be met in order to receive the right to build.
One target that was set by the City of Helsinki, was to reduce the net heatingconsumption with 60–65% compared to the “business as usual” level at the time. Threedifferent solar energy demonstration projects were realized in the area. One is districtsolar heating system that provides solar heating for 370 dwellings. Solar electricity isdemonstrated in one high rise building were the target was to produce 20% of thehousehold electricity with PV panels installed on the balconies. The district also hasfocus on locally produced food. Many garden lots can be found were food is grown,which is special challenge in the cold Finnish climate.
One part of the requirements was to allow measurements of the performance of theresidential buildings, schools and day-care centres in terms of heating, electricity andwater usage. Measurements have shown that these targets were not fully reached,mainly due to lots of new technologies being used in non-optimized way. The targetsfor electricity and water usage were mainly reached.

78
Source:http://www.hel.fi/hel2/taske/julkaisut/2009/EkoViikki_raportti_Motiva%202008.pdf
10 Benefits and barriers
The cornerstone of the design of the city is the exploitation of latest state-of-art energyefficiency and renewable technologies in all sectors, for electricity and heat generation,always adapted to the local context. The project will also urge best practices in wastemanagement and transportation planning focusing on modal shift and technologies anddemand management. Additional emissions savings are expected from the followingsectors: agriculture, wastewater management, carbon sequestration through treesplanting in the green belt surrounding the city.
There are numerous benefits for undertaking the FS, and hence transferring NBC intoan EcoCity. First, for E-JUST staff and students, the transferring process itself willprovide endless research topics to the staff and students. The work on FS together withthe other activities of the project as WS, Seminars, ST, etc., will enhance the knowledgeand experience of the staff of E-JUST about EcoCities. This would increase cooperationpossibilities between E-JUST and other national, regional and international Universitiesand Research Institutes. Thanks to the growing experience of staff in the differentsectors, E-JUST will develop bank of expertise on EcoCity aspects serving similarprojects and cities in Egypt and possibly in neighbour Arab Countries.
Second, industry and commercial sectors are going to enjoy the outcomes of transferringNBC into an EcoCity. More efficient use of energy and possible utilization of renewableenergy as in solar heating, air-conditioning and biogas would considerably decreasetheir energy bill, hence increase profitability. On the other hand, improving the livingconditions and transportation means in and to NBC will encourage their employee tolive in the City and save time and money in transportation.
Third, the inhabitants of NBC will enjoy living an ecologically friendly and safeenvironment, with clean potable water, adequate liquid and solid wasterecycling/management, energy efficient building and equipments and clean andconvenient transportation system.
Fourth, on the country scale, the project has also huge potential for replication.Besides, the technical tools and the regulatory framework as well as financial incentivesto be developed under the proposed project will all contribute to boost energy efficiencyand renewable energy technologies market in Egypt and the region. In addition, theglobal environmental benefits will result from the successful implementation of the tools

79
developed and investments in clean energy technologies at both demand side andsupply side (EE&RE).
On the other hand there are several barriers that would be encountered beforearriving at these benefits. First of all, Egypt faces serious challenges in attracting privateinvestments in clean energy technologies. There are several reasons for this as well aspossible solutions. First, fossil fuel subsidies are twisting the energy economy of thecountry making it difficult to invest in EE&RE projects. national energy strategy isrequired to lift fossil fuel subsidies and provide incentives for EE&RE projects. In thisconnection, awareness raising campaigns targeted at decision makers are badly needed.
On the other hand, dedicated sources of financing for energy efficiency are lacking. Thisrequires the creation of opportunities for industrial facilities and business enterprises toinvest in energy efficiency and renewable energy projects through the development ofdemonstration projects for these clean technologies in order to gain more experienceand to increase confidence in this emerging technology.
Second, local experts lack adequate knowledge and experience in identifying andformulating energy efficiency investment project proposals. There is need to developskills in the private and public sectors at the local level to identify, formulate andimplement energy efficiency and renewable energy investment in selected proventechnologies. Hence, training courses and workshops are thus needed for professionalsto raise awareness and to overcome the current lack of expertise amongst professionals(planners, installer, etc.). Also developing planning guidelines to promote EE&RE byassisting planners is also recommended.
Third, in the absence of policy and institutional support, private investors are notmotivated to finance energy efficiency projects. This requires specific assistance tomunicipal authorities and national Governments to introduce reforms needed tosupport these investments.
80
11 References
Ahmad, A., Ghufran, R., Wahid, Z. A. 2011. Bioenergy from anaerobic degradation of lipidsin palm oil mill effluent Reviews in Environmental Science and Bio/Technology, vol.10, no. 4, pages 353–376, Oct. 2011.
Chairattanamanokorn, P., Tapananont, S., Detjaroen, S., Sangkhatim, J.,Anurakpongsatorn, P., Sirirote, P. 2012. Additional paper waste in pulping sludge forbiohydrogen production by heat-shocked sludge Applied biochemistry andbiotechnology, vol. 166, no. 2, pages 389–401, Jan. 2012.
Chen, Y., Cheng, J. J., Creamer, K. S. 2008. Inhibition of anaerobic digestion process:review. Bioresource technology, vol. 99, no. 10, pages 4044–64, Jul. 2008.
Daseking, W. 2009. Interview by Åsa Hedman Freiburg, Germany, May 2009
Dqg, D. I., Lrpdvv, R., Sveinsdottir, M., Sigurbjornsdottir, M. A., Orlygsson, J. 2011.WKDQRO DQG \GURJHQ 3URGXFWLRQ ZLWK 7KHUPRSKLOLF, 2011.
EIA (Energy Information Administration). 2013. Country analysis brief: Egypt.
Eurostat. 2014. Energy price statistics European Commission, Luxembourg. Available athttp://epp.eurostat.ec.europa.eu/statistics_explained/index.php/energy_price_statistics
Farghaly, A., Tawfik, A., Gamal Eldin Ibrahim, M. 2015. Surfactant-supplemented mixedbacterial cultures to produce hydrogen from paperboard mill wastewater Eng. Life Sci.,00, 1–8, 2015.
Forgacs, E., Cserhati, T., Oros, G. 2004. Removal of synthetic dyes from wastewaters:review. Environ. Int. 30 (7), 953–971.
Kalin, S. 2014. Egypt raises electricity prices. Reuters, London. Available athttp://af.reuters.com/article/investingNews//idAFKBN0F81KF20140703
Lay, C., Sen, B., Huang, S., Chen, C., Lin, C. 2013. Sustainable bioenergy production fromtofu-processing wastewater by anaerobic hydrogen fermentation for onsite energyrecovery Renewable Energy, vol. 58, pages 60–67, 2013.
Leaño, E. P., Babel, S. 2012. The influence of enzyme and surfactant on biohydrogenproduction and electricity generation using Palm Oil Mill Effluent Journal of CleanerProduction, vol. 31, pages 91–99, Aug. 2012.
Oil and Gas Journal. 2012. Vol. 110, issue 12 C, Dec. 2012.

81
Razavi, H. 2012. Clean energy development in Egypt African Development Bank, 2012.
Reda, F., Tuominen, P., Hedman, Å., Gamal Eldin Ibrahim, M. 2015. Low-energy residentialbuildings in New Borg El Arab: Simulation and survey based energy assessment Energyand Buildings, Volume 93, 15 April 2015, pages 65–82, ISSN 0378-7788,http://dx.doi.org/10.1016/j.enbuild.2015.02.021
Ryan, L., Campbell, N. 2012. Spreading the Net: The Multiple Benefits of Energy EfficiencyImprovements IEA: Insights Series 2012.
Shahin, M., Hedman, Å. 2014. Transportation planning key element in EcoCitydevelopment. Analysis of scenarios for NewBorgElArab, Egypt European Conference onTransportation. Frankfurt, Germany, 30.9.–2.10.2014.
Tawfik, A., Zaki, D. F., Zahran, M. K. 2014. Degradation of reactive dyes wastewatersupplemented with cationic polymer (Organo Pol.) in down flow hanging sponge(DHS) system Journal of Industrial and Engineering Chemistry, vol. 20, issue 4, pages2059–2065, 25 July 2014.
Tuominen, P., Reda, F., Dawoud, W., Elboshy, B., Elshafei, G., Negm, A. 2015. Economicappraisal of energy efficiency in buildins using Cost-Effectiveness Assessment ProcediaEconomics and Finance 21, 422-430, 2015.
UNEP (United Nations Environment Programme). 2008. Climate Change and Energy inthe Mediterranean Sophia Antipolis, France, 2008.
You, S., Damodar, R. A., Hou, S. 2010. Degradation of Reactive Black dye usinganaerobic/aerobic membrane bioreactor (MBR) and photochemical membrane reactorJournal of Hazardous Materials 177, 1112–1118, 2010.

Kindergarten Occasions Hall Sport Club Youth Hostel
First Neighbourhood Done Kindergarten Basic EducationSchool Mosques 3
Second Neighbourhood Done Experimental School Culture Center 2
Third Neighbourhood Done Kindergartens Health Center Bakery 4
Fourth Neighbourhood Done KindergartenTraffic
AdministrationBuilding
Market Secondry Al-Azharinstitutes 4
Fifth Neighbourhood Done Kindergarten Youth Center Youth hostelPolice, Fire
Brigade,NationalSecurity
Al-Azhar institutes Puplic Hospital 8
Sixth Neighbourhood Done Kindergartens Secondary EducationSchool 3
Seventh Neighbourhood Done Kindergarten AdminstrationBuilding,
Basic EducationSchool
Mail, Telegraph andTelephones 5
Eighth Neighbourhood Done Kindergarten Mosques Health Insurance 3
Ninth Neighbourhood Done Kindergarten Occasions Hall EndowmentsBuilding
El Baraka Market ElSuika Market
Basic EducationSchool IndustrialSecondary School
Mosques Health Center 9
First Society Done Fire Brigade Basic EducationSchool 2
Second Society Done El Thamany Market 1
Third Society Done 0
Fourth Society Done Kindergarten 1
Fifth Society Done Court Building 1
Sixth Society Done Health Unit 1
Seventh District Done Kindergarten Market Health Unit 3
Central Axis Done Fire Brigade Health Unit Central 3
Extension of Central Axis Done Police Bus Station 2
Industrial Regions Done Fire Brigades Services Building 3
First Industrial Regions Done Training center Stores 2
City Gate DoneParking Building
AgricultureAdministration
2
TOTAL 12 1 1 1 5 10 5 9 1 3 7 5 1 1 62
NBC Masterplan 180 1 4 11 99 16 61 72
ANNEX 1: SUMMARY OF COMMERCIAL/PUBLIC FACILITIES SECTOR
Centrals TOTALEducation Services
(Schools and Al-Azhar institutes)
Culture Services(Culture Centers)
Religious Services(Mosques)
Health Services(Hospitals, Health
Centers and HealthInsuranceCliniques)
Public Services(Bakery, Mail,
Telegraph, BusStation, Training
Center)
Industrial Services(Services Building
for IndustrialRegion)
CommercialServices (Markets)DISTRICT Status
Social ServicesAdministration
services(AdministrationBuilding and theAnnexations andother Buildings)
Security Services(Police, Fire
Brigade, NationalSecurity and
Traffic)

ANNEX 2: VISION AND SCENARIOS FOR TURNING NBC INTO AN ECOCITY
1. VISION
Sectors considered for the Feasibility StudyIssues ofconcern General Residential Commercial/Public facilities Industrial Services/Utilities Transport
Energy Possibility to sell extra energy to thegridSolar water heatingSolar air conditioningWaste to energyIncrease public awarenessUse of efficient lighting solutionsMonitor and trace hazardous chemicalsSmart use of energy (reduce peakconsumption, energy storage, loadmatching, smart control)Energy efficiencyGreen policy for allUse of local materialsCleaner production (green industry)Enforcement of environmental lawsand regulationsEnergy information and tips available(E-JUST Energy Office)ESCO companiesEnforcement of traffic laws andregulationsUse of biofuelsElectric carsElectrification of railway connectionbetween Borg El Arab City andAlexandriaPedestrian and bicycle lanesImprove bus systemSupporting car poolingIntroduce intelligent traffic systems,ITSReduce use of private cars in citycentres (parking fees)
Possibility to sell extra energy to the gridLocal building energy code (includinglighting)Solar water heatingSolar air conditioningWaste to energyIncrease public awarenessUse of efficient lighting solutionsSmart use of energy (reduce peakconsumption, energy storage, loadmatching, smart control)Energy efficiencyUse of local materials--------------------------Targets:
100% net renewable energy in allnew buildings
Reduce by 50% in 10 years thetotal energy consumptioncompared to business as usual
Solar water heatingSolar air conditioningWaste to energyIncrease public awarenessUse of efficient lighting solutionsMonitor and trace hazardous chemicalsSmart use of energy (reduce peakconsumption, energy storage, loadmatching, smart control)Energy efficiencyGreen policy for allUse of local materials-------------------Targets:
Enforcement of existing law toclose businesses at given time
Energy efficiency (efficientlighting, refrigeration)
Cleaner production (green industry)Monitoring (in-plant control)Maintaining the energy cycleRenewable energyEnergy efficiency (ISO 50000, etc.)Increase public awarenessUse of efficient lighting solutionsMonitor and trace hazardouschemicalsPossibility to sell extra energy to thegridSmart use of energy (reduce peakconsumption, energy storage, loadmatching, smart control)Enforcement of environmental lawsand regulations-------------------Targets:
100% of industries energyaudited on regular basis
100% of industries havinggreen policy, self-monitoringand continuous improvementprocesses
Shared responsibility in trade(hazardous chemicals)
Upgrading of outdatedequipment throughenforcement and incentives
Use of renewable energy(numerical target to be definedlater)
Minimization of electricityconsumption in public placesDaily services within walking distance(around 500m)Use of efficient lighting solutionsIncrease public awarenessSmart use of energy (reduce peakconsumption, energy storage, loadmatching, smart control)Providing consultancy on energyefficient solutionsProviding energy audit service (E-JUST Energy Office)Energy information and tips available(E-JUST Energy Office)ESCO companies-------------------Targets:
60% reduction of energyconsumption in Governmentoffices compared to business asusual
E-JUST Energy Office is up andrunning in the near future
Use of biofuelsElectric carsFuel cellsElectrification of railway connectionbetween Borg El Arab City andAlexandriaPedestrian and bicycle lanesImprove bus systemBusycleSupporting car poolingIncrease public awarenessEnergy efficiencyIncrease the use of public transportIncrease cycling, walking…Introduce intelligent traffic systems, ITSIntroduce information systems fortravellersCar-free zonesIntroduce traffic calming measuresBus and HOV priorityReduce use of private cars in citycentres (parking fees)Enforcement of traffic laws andregulations--------------Targets:
Modal Split: Public transportshare 50%
Pedestrian/cycling share 10-15%
Decrease private care share 40%
use of electric cars (20% by2035 for the best scenario –thisfigure needs to be checked throughelectric/energy engineer
100% of cars should be regularlychecked and maintained
Water Water conservation (includingagricultural activities)Water qualityNon-conventional water resources(solar desalination…)Fresh water management
Sufficient water supplyMinimization of water consumption
Recycling and reuse of treated wastewaterProvision of fresh drinking water andsanitationRain harvestingIncrease public awareness
Water conservationWater qualityNon-conventional water resources (solardesalination…)Fresh water management
Sufficient water supplyMinimization of water consumption
Recycling and reuse of treated wastewaterProvision of fresh drinking water andsanitationRain harvestingIncrease public awareness---------------------Targets:
30% less water consumption(including water recycling)compared to business as usual
Water conservation (includingagricultural activities)Water qualityNon-conventional water resources(solar desalination…)Fresh water management
Sufficient water supplyMinimization of water consumption
Recycling and reuse of treated wastewaterProvision of fresh drinking water andsanitationRain harvestingIncrease public awareness---------------------Targets:
100% use of non-conventionalwater for irrigation and non-conventional irrigation
Non-conventional water resources(solar desalination…)Recycling and reuse of treated wastewaterRain harvestingIncrease public awareness-------------------Targets:
100% of industries wateraudited on regular basis
100% recycling of waste waterwhere applicable
Enforcement of the lawregulating discharge into waterstreams
Rai harvestingIncrease public awarenessProviding clean water-------------------Targets:
30% of reduction in waterconsumption in the Servicesector
All septic tanks should bemodified to prevent groundwater pollution and serviceavailable to empty the tanks
Rain harvesting for the road systemIncrease public awareness

ANNEX 2: VISION AND SCENARIOS FOR TURNING NBC INTO AN ECOCITY
100% pure drinking water foreveryone
50% water treated usingrenewable energy sources in 10years
100% sanitation for everyone
Respect carrying capacities interms of water availability
techniques
Waste In situ sorting of wasteIncrease public awarenessWaste minimizationRecyclingLow cost technologies for waste watertreatmentBiogas production from wasteSolid waste treatmentPollution preventionWaste minimizationMarket for used goods (flea market,online sale…)Well-functioning waste managementservices availableBiofuel from wasteReduction of emissions (see energy)
In situ sorting of wasteIncrease public awarenessWaste minimization------------------Targets:
Near 100% of the waste (includingboth solid waste and waste water)is treated, recycled and/or reused
100% of hazardous waste isproperly treated
RecyclingLow cost technologies for waste watertreatmentBiogas production from wasteIncrease public awareness------------------Targets:
Near 100% of the waste(including both solid waste andwaste water) is treated, recycledand/or reused
100% of hazardous waste isproperly treated
Waste minimizationSolid waste treatmentRecyclingRecovery (including waste to energy)Pollution preventionIncrease public awareness------------------Targets:
Near 100% of the waste istreated, recycled and/orreused
100% of hazardous waste isproperly treated
Increase public awarenessMarket for used goods (flea market,online sale…)Well-functioning waste managementservices available------------------Targets:
100% garbage collection
At least one functioningmarket place for used goods(either physical or online)
Near 100% of the waste istreated, recycled and/orreused
100% of hazardous waste isproperly treated
Biofuel from wasteHydrogen productionReduction of emissions (see energy)Recycling (tyres, other parts)RecoveryIncrease public awareness
Note1: This part can’t be estimated bytransport planning field rather bymechanical engineer--------------Targets:
Enforcement of law regulatingdisposal of old cars
100% tyres recycled
Near 100% of the waste istreated, recycled and/or reused
100% of hazardous waste isproperly treated
Otherindependentissues(material, etc.)
Protect aquatic ecosystemsConservation and sustainable use oflandSustainable green coverBiodiversityGreen areasGood governanceUse of eco-friendly chemicalsMinimization of raw material useHealth and safety
Protect aquatic ecosystemsTarget: Intensifying waterpollution prevention to reducehealth hazards and damage toecosystems
Conservation and sustainable use of landTarget: Reducing salinization,combating desertification,reducing cropland expansion,preventing soil pollution anddegradation
Sustainable green coverTarget: Reducing plant uprootingand removal of natural vegetation
Biodiversity
Green areas
Good governanceTarget: In general improving thelegislation, but in particular,introducing the adequatelegislation to allow and regulatethe use of renewable energy
Use of eco-friendly chemicals
Minimization of raw material use
Health and safetyTarget: OHS rules should befollowed by all employees at alltimes. Develop processes tosupport this
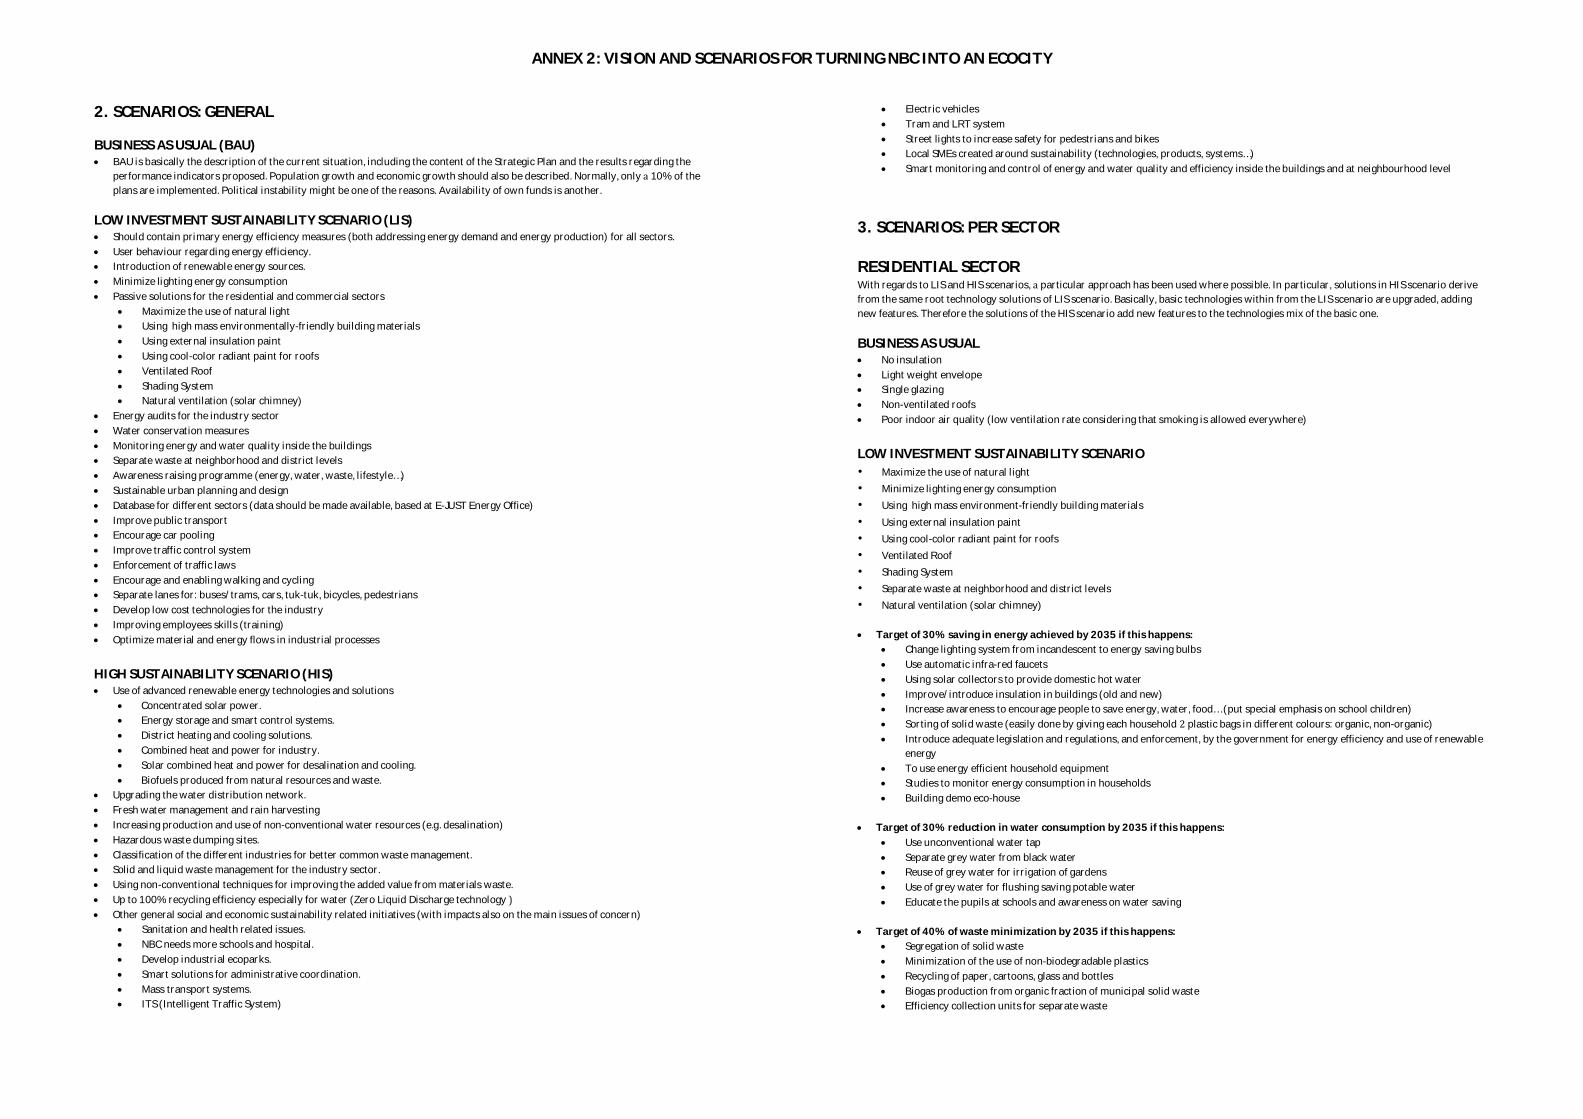
ANNEX 2: VISION AND SCENARIOS FOR TURNING NBC INTO AN ECOCITY
2. SCENARIOS: GENERAL
BUSINESS AS USUAL (BAU)BAU is basically the description of the current situation, including the content of the Strategic Plan and the results regarding theperformance indicators proposed. Population growth and economic growth should also be described. Normally, only 10% of theplans are implemented. Political instability might be one of the reasons. Availability of own funds is another.
LOW INVESTMENT SUSTAINABILITY SCENARIO (LIS)Should contain primary energy efficiency measures (both addressing energy demand and energy production) for all sectors.User behaviour regarding energy efficiency.Introduction of renewable energy sources.Minimize lighting energy consumptionPassive solutions for the residential and commercial sectors
Maximize the use of natural lightUsing high mass environmentally-friendly building materialsUsing external insulation paintUsing cool-color radiant paint for roofsVentilated RoofShading SystemNatural ventilation (solar chimney)
Energy audits for the industry sectorWater conservation measuresMonitoring energy and water quality inside the buildingsSeparate waste at neighborhood and district levelsAwareness raising programme (energy, water, waste, lifestyle…)Sustainable urban planning and designDatabase for different sectors (data should be made available, based at E-JUST Energy Office)Improve public transportEncourage car poolingImprove traffic control systemEnforcement of traffic lawsEncourage and enabling walking and cyclingSeparate lanes for: buses/trams, cars, tuk-tuk, bicycles, pedestriansDevelop low cost technologies for the industryImproving employees skills (training)Optimize material and energy flows in industrial processes
HIGH SUSTAINABILITY SCENARIO (HIS)Use of advanced renewable energy technologies and solutions
Concentrated solar power.Energy storage and smart control systems.District heating and cooling solutions.Combined heat and power for industry.Solar combined heat and power for desalination and cooling.Biofuels produced from natural resources and waste.
Upgrading the water distribution network.Fresh water management and rain harvestingIncreasing production and use of non-conventional water resources (e.g. desalination)Hazardous waste dumping sites.Classification of the different industries for better common waste management.Solid and liquid waste management for the industry sector.Using non-conventional techniques for improving the added value from materials waste.Up to 100% recycling efficiency especially for water (Zero Liquid Discharge technologyOther general social and economic sustainability related initiatives (with impacts also on the main issues of concern)
Sanitation and health related issues.NBC needs more schools and hospital.Develop industrial ecoparks.Smart solutions for administrative coordination.Mass transport systems.ITS (Intelligent Traffic System)
Electric vehiclesTram and LRT systemStreet lights to increase safety for pedestrians and bikesLocal SMEs created around sustainability (technologies, products, systems…)Smart monitoring and control of energy and water quality and efficiency inside the buildings and at neighbourhood level
3. SCENARIOS: PER SECTOR
RESIDENTIAL SECTORWith regards to LIS and HIS scenarios, particular approach has been used where possible. In particular, solutions in HIS scenario derivefrom the same root technology solutions of LIS scenario. Basically, basic technologies within from the LIS scenario are upgraded, addingnew features. Therefore the solutions of the HIS scenario add new features to the technologies mix of the basic one.
BUSINESS AS USUALNo insulationLight weight envelopeSingle glazingNon-ventilated roofsPoor indoor air quality (low ventilation rate considering that smoking is allowed everywhere)
LOW INVESTMENT SUSTAINABILITY SCENARIO• Maximize the use of natural light• Minimize lighting energy consumption• Using high mass environment-friendly building materials• Using external insulation paint• Using cool-color radiant paint for roofs• Ventilated Roof• Shading System• Separate waste at neighborhood and district levels• Natural ventilation (solar chimney)
Target of 30% saving in energy achieved by 2035 if this happens:Change lighting system from incandescent to energy saving bulbsUse automatic infra-red faucetsUsing solar collectors to provide domestic hot waterImprove/introduce insulation in buildings (old and new)Increase awareness to encourage people to save energy, water, food… (put special emphasis on school children)Sorting of solid waste (easily done by giving each household plastic bags in different colours: organic, non-organic)Introduce adequate legislation and regulations, and enforcement, by the government for energy efficiency and use of renewableenergyTo use energy efficient household equipmentStudies to monitor energy consumption in householdsBuilding demo eco-house
Target of 30% reduction in water consumption by 2035 if this happens:Use unconventional water tapSeparate grey water from black waterReuse of grey water for irrigation of gardensUse of grey water for flushing saving potable waterEducate the pupils at schools and awareness on water saving
Target of 40% of waste minimization by 2035 if this happens:Segregation of solid wasteMinimization of the use of non-biodegradable plasticsRecycling of paper, cartoons, glass and bottlesBiogas production from organic fraction of municipal solid wasteEfficiency collection units for separate waste

ANNEX 2: VISION AND SCENARIOS FOR TURNING NBC INTO AN ECOCITY
Sweep streets regularlySeparate the hazardous wasteImprovement of the existing wastewater treatment of the citySeparation of industrial wastewater streamsReplication of cost-effective treatment units for similar industrial facilitiesReuse and recycling the treated water either in irrigation or in industry
HIGH SUSTAINABILITY SCENARIOPV integrated into shading systemAdding insulation within the building envelopePerformant Window (Low-e, double glass)Thermal solar system for DHW and Space HeatingUse PV-heat pump for supplying coolingMixed ventilation (including free cooling)Adopting ventilated green roofMicro windmillsNew performant envelope material (PCM)Separate waste at household and building level
Target of 60% saving in energy achieved by 2035 if this happens:To develop the building code for energy efficiency for Borg El Arab and for EgyptBuild solar and wind energy plants to provide energy for buildingsUse renewable energy co-generation units to provide heat and power for building, groups of buildings or compoundsUse central solar cooling plants to provide cooling for major buildings, compounds, even district coolingSolar combined generation for desalination and cooling
Target of 100% pure drinking water for everyone by 2035 if this happens:Use of low cost and efficient water treatment technologiesSolar energy for disinfectionImprovement and integration of the existing water treatment unitsPollution preventionCourses and capacity building for pupils and workers
Target of 100% of waste recovery/treatment by 2035 if this happens:Non-conventional and low cost wastewater treatment plantsEnergy production from wasteUse waste as wealth for recoveryUse of green technologiesZero liquid discharge unitsStrictly follow the rules and regulationsPenalties for discharge of industrial wastewaterCreate guidelines and new obligatory for discharge of solid wasteSelling the energy produced from wastesReuse of treated water as non-conventional resource
COMMERCIAL/PUBLIC FACILITIES SECTOR
BUSINESS AS USUALBAU is basically the description of the current situation, including the content of the Strategic Plan and the results regarding theperformance indicators proposed.
LOW INVESTMENT SUSTAINABILITY SCENARIOPublic awarenessTarget 100% buildings monitored and auditedSmart use of energyBuilding demo eco-office buildingsUsing solar water heatingWater quality monitoring inside the buildings done on regular basisWater conservation measures
Recycling and reuse of waste water for irrigation and other purposesDevelop low cost technologies for waste water treatment
HIGH SUSTAINABILITY SCENARIOUse efficient lighting solutions (LED lamps)Waste to energy generationSolar air conditioning and heating30% energy produced from renewable sourcesIncreasing production and use of non-conventional water resources (e.g. desalination)Provision of sufficient fresh drinking water and sanitationFresh water management and rain harvestingBiogas production and supply
INDUSTRY SECTOR
BUSINESS AS USUALIn order to describe the current situation in an appropriate way, the following information should be available, but as explained in theIntroduction, it hasn’t been possible for the expert team to access this information:
How many plants are there in the city? What is the expected growth of that number?How many employees are there? What is the expected growth of that number?How developed is the technology used?How skilled are the employees? What are the required skills?What kinds of energy sources are used? What is the distribution of these?Water supply and water treatment
LOW INVESTMENT SUSTAINABILITY SCENARIOTarget 100% factories monitored and auditedRenewable energy applicationsDevelop low cost technologies.Enhance recycling process (water -solid)Improving employees skills (training)
HIGH SUSTAINABILITY SCENARIOUp to 100% recycling efficiency especially for water (Zero Liquid Discharge technologyUp to 50-80% energy produced from renewable sourcesUse more developed technologyUsing non-conventional techniques for improving the added value from materials waste.
TRANSPORT SECTOR
BUSINESS AS USUALThe Business As Usual scenario (Reference Scenario) is based on continuation of the existing travel behavior of the year 2013/2014 in thefuture, according to the following assumptions:
Forecasted population based on the proposed master plan and increase rate of populationLittle change in the modal split to the benefit of the bus modeChange in the road infrastructures based on the master plan
LOW INVESTMENT SUSTAINABILITY SCENARIOModal split public transport share 20%100% cars should be checked and maintainedModal split private car share 25%Modal pedestrian and cycling share 7%To achieve these targets the following measures have to be taken:
Improve public transportEncourage car poolingImprove traffic control systemAwareness raising
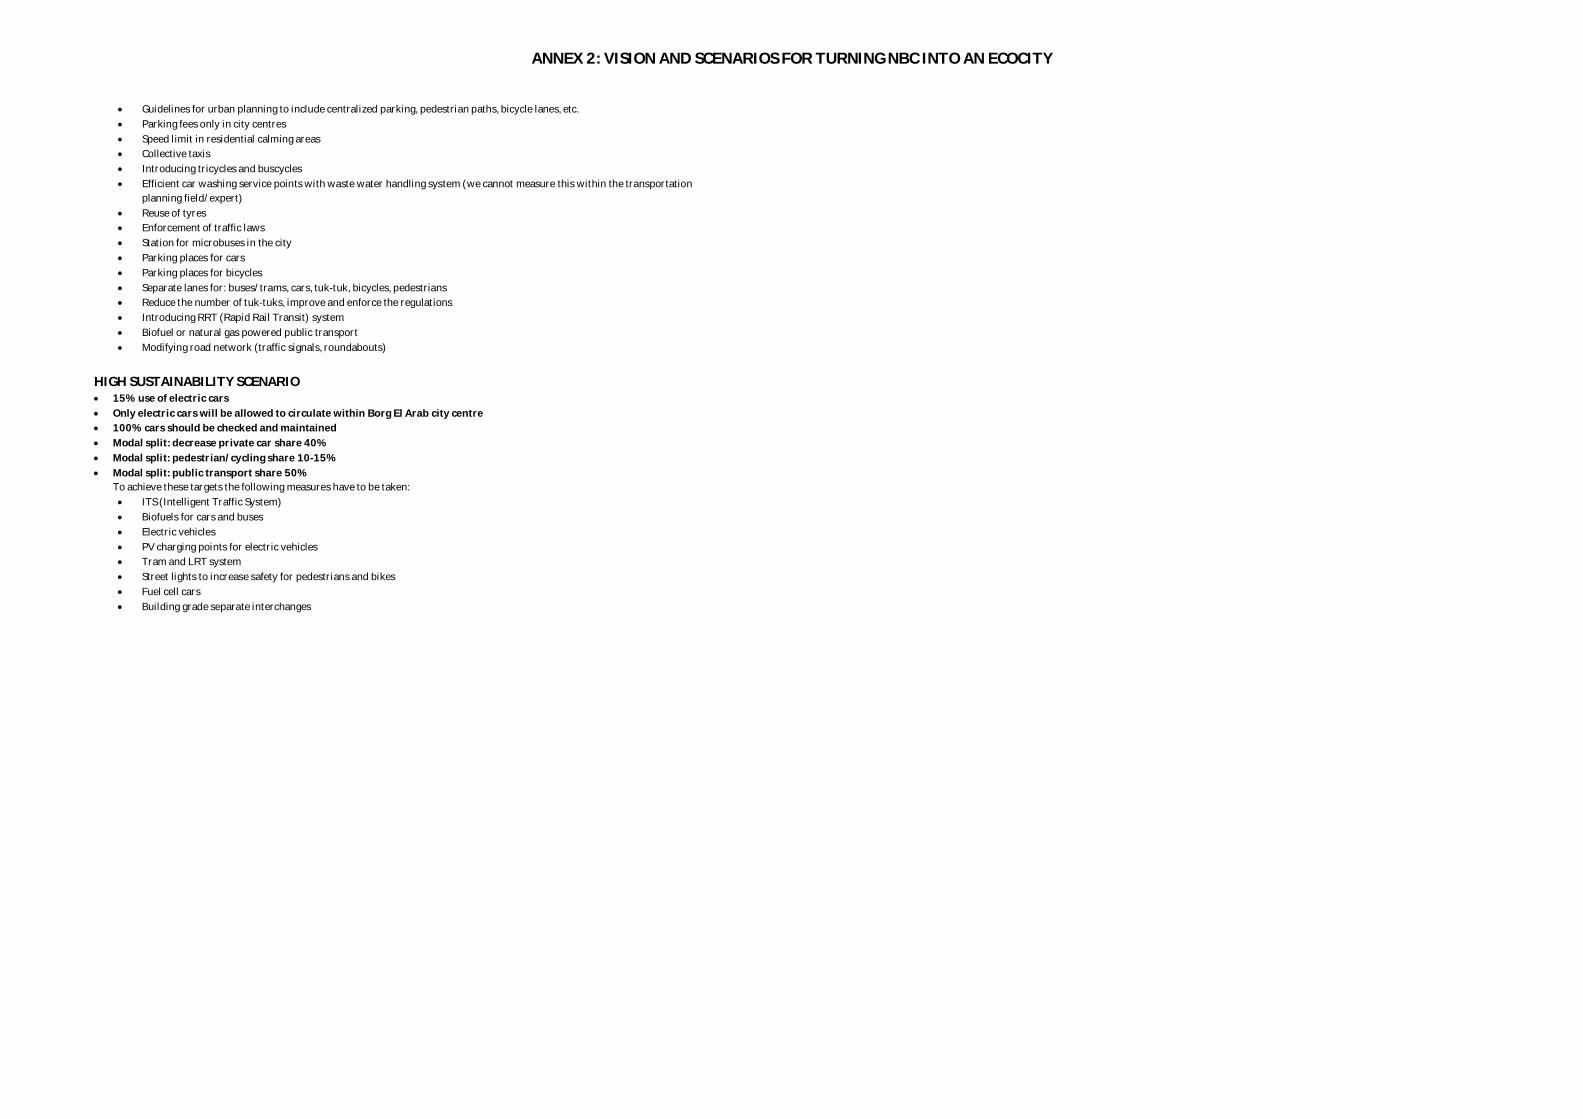
ANNEX 2: VISION AND SCENARIOS FOR TURNING NBC INTO AN ECOCITY
Guidelines for urban planning to include centralized parking, pedestrian paths, bicycle lanes, etc.Parking fees only in city centresSpeed limit in residential calming areasCollective taxisIntroducing tricycles and buscyclesEfficient car washing service points with waste water handling system (we cannot measure this within the transportationplanning field/expert)Reuse of tyresEnforcement of traffic lawsStation for microbuses in the cityParking places for carsParking places for bicyclesSeparate lanes for: buses/trams, cars, tuk-tuk, bicycles, pedestriansReduce the number of tuk-tuks, improve and enforce the regulationsIntroducing RRT (Rapid Rail Transit) systemBiofuel or natural gas powered public transportModifying road network (traffic signals, roundabouts)
HIGH SUSTAINABILITY SCENARIO15% use of electric carsOnly electric cars will be allowed to circulate within Borg El Arab city centre100% cars should be checked and maintainedModal split: decrease private car share 40%Modal split: pedestrian/cycling share 10-15%Modal split: public transport share 50%To achieve these targets the following measures have to be taken:
ITS (Intelligent Traffic System)Biofuels for cars and busesElectric vehiclesPV charging points for electric vehiclesTram and LRT systemStreet lights to increase safety for pedestrians and bikesFuel cell carsBuilding grade separate interchanges

Series title and number
VTT Technology 220
Title EcoNBC feasibility study Transforming New Borg El Arab into an EcoCity
Author(s) Carmen Antuña Rozado, Åsa Hedman, Pekka Tuominen, Francesco Reda (VTT); Yehia ElMahgary, Ahmed ElShazly, Mona GamalEldin, Ali Kamel, Abdelazim Negm, Ahmed Tawfik, Heba Saeed, Ahmed AbdelMonteleb, Mohamed Ayeldeen, Waled Dawoud, Bahaa Elboshy, Ghada Elshafei (E-JUST); Mohamed Shahin (Alexandria University); Ahmed Yousry (Cairo University)
Abstract New Borg El Arab was inaugurated in 1988 and is seen as the natural extension of Alexandria, as well as one of the most important industrial areas in Egypt. Transforming New Borg El Arab City into an EcoCity was one of the main drivers for EcoNBC project (EcoCity Capacity Building in New Borg El Arab City). Carrying out a Feasibility Study to explore more in detail the viability of the idea was one of the first steps to be taken towards that transformation. In this case, it is the result of the joint effort of a team of Finnish and Egyptian experts through a series of structured workshops that took place both in Finland and Egypt, and a number of focused discussions that involved also key stakeholders.
ISBN, ISSN ISBN 978-951-38-8301-0 (URL: http://www.vttresearch.com/impact/publications) ISSN-L 2242-1211 ISSN 2242-122X (Online)
Date April 2015
Language English
Pages 82 p. + app. 6 p.
Name of the project
Commissioned by
Keywords
Publisher VTT Technical Research Centre of Finland Ltd P.O. Box 1000, FI-02044 VTT, Finland, Tel. 020 722 111

EcoNBC feasibility study Transforming New Borg El Arab into an EcoCity New Borg El Arab was inaugurated in 1988 and is seen as the natural extension of Alexandria, as well as one of the most important industrial areas in Egypt. Transforming New Borg El Arab City into an EcoCity was one of the main drivers for EcoNBC project (EcoCity Capacity Building in New Borg El Arab City). Carrying out a Feasibility Study to explore more in detail the viability of the idea was one of the first steps to be taken towards that transformation. In this case, it is the result of the joint effort of a team of Finnish and Egyptian experts through a series of structured workshops that took place both in Finland and Egypt, and a number of focused discussions that involved also key stakeholders. An insight into the different economic sectors has been taken and a vision of how the main issues of concern selected, namely Energy, Water and Water, should be approached from each of those sectors has been defined, of course with a special emphasis on the sustainability of the Ecosystem. This has allowed the expert team responsible for this Feasibility Study to propose practical solutions in the form of scenarios. In the case of some sectors where reliable data was available for the calculations, these scenarios have been developed down to their associated impacts. In consequence, by providing a more grounded understanding of the present situation and the opportunities for the future, this Feasibility Study can be useful for decision makers and planners, but also for investors, funding organizations and donors.
ISBN 978-951-38-8301-0 (URL: http://www.vttresearch.com/impact/publications) ISSN-L 2242-1211 ISSN 2242-122X (Online)
VT
T T
EC
HN
OL
OG
Y 2
20
Ec
oN
BC
fea
sibility stu
dy
•VISIONS•S
CIE
NC
E•T
ECHNOLOGY•R
ES
EA
RC
HHIGHLIGHTS
220
EcoNBC feasibility study Transforming New Borg El Arab into an EcoCity