Embed Size (px)
Citation preview
Econometric Measures of Econometric Measures of
Systemic Risk in the Systemic Risk in the
Finance and Insurance SectorsFinance and Insurance Sectors
Monica Billio, Mila Getmansky, Monica Billio, Mila Getmansky, Monica Billio, Mila Getmansky, Monica Billio, Mila Getmansky,
Andrew W. Lo, Loriana PelizzonAndrew W. Lo, Loriana Pelizzon
Scuola Normale di PisaScuola Normale di Pisa
March 29, 2011March 29, 2011
Systemic
Risk
Measures
� Increased interconnectedness of financial institutions
(banks, hedge funds, brokers, and insurance companies)
amplified systemic problems and served as a major factor in the
Financial Crisis of 2007-2009
� Study the degree of interconnectedness between these
financial institutions
MotivationMotivation
financial institutions
� Develop econometric measures of systemic risk to capture
linkages and vulnerabilities of the entire financial system
� Indentify systemically important institutions
� Capture the build-up of systemic risk prior to a crisis
Slide 2
Systemic
Risk
Measures
� Several measures of systemic risk in the finance and insurance
sectors based on the statistical properties of aggregate market
returns.
� In the absence of direct information concerning leverage and
linkages among financial institutions, statistical relationships
can yield valuable indirect information about the build-up of
Our contributionOur contribution
can yield valuable indirect information about the build-up of
systemic risk.
� Moreover, even if regulatory reforms impose the disclosure for
such information, an econometric approach may still provide
more immediate and actionable measures of systemic risk.
Slide 3
Systemic
Risk
Measures
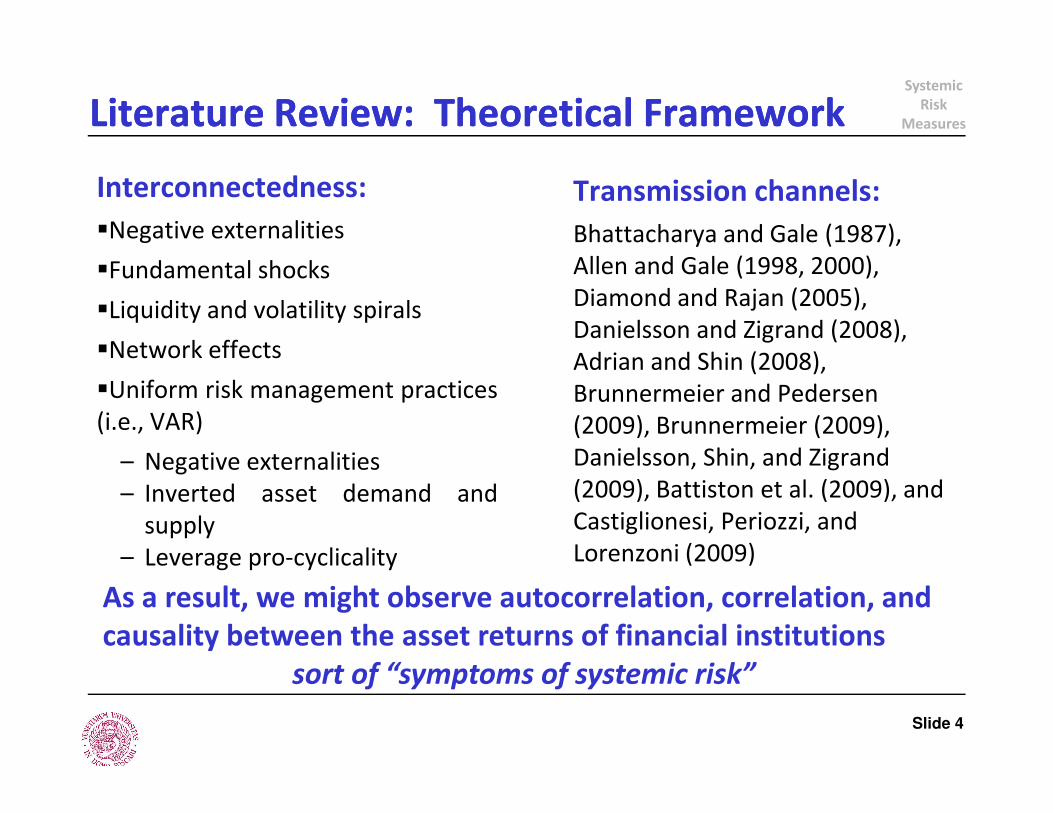
Interconnectedness:
�Negative externalities
�Fundamental shocks
�Liquidity and volatility spirals
�Network effects
�Uniform risk management practices
(i.e., VAR)
Transmission channels:
Bhattacharya and Gale (1987),
Allen and Gale (1998, 2000),
Diamond and Rajan (2005),
Danielsson and Zigrand (2008),
Adrian and Shin (2008),
Brunnermeier and Pedersen
Literature Review: Theoretical FrameworkLiterature Review: Theoretical Framework
(i.e., VAR)
– Negative externalities
– Inverted asset demand and
supply
– Leverage pro-cyclicality
(2009), Brunnermeier (2009),
Danielsson, Shin, and Zigrand
(2009), Battiston et al. (2009), and
Castiglionesi, Periozzi, and
Lorenzoni (2009)
As a result, we might observe autocorrelation, correlation, and
causality between the asset returns of financial institutions
sort of “symptoms of systemic risk”
Slide 4
Systemic
Risk
Measures
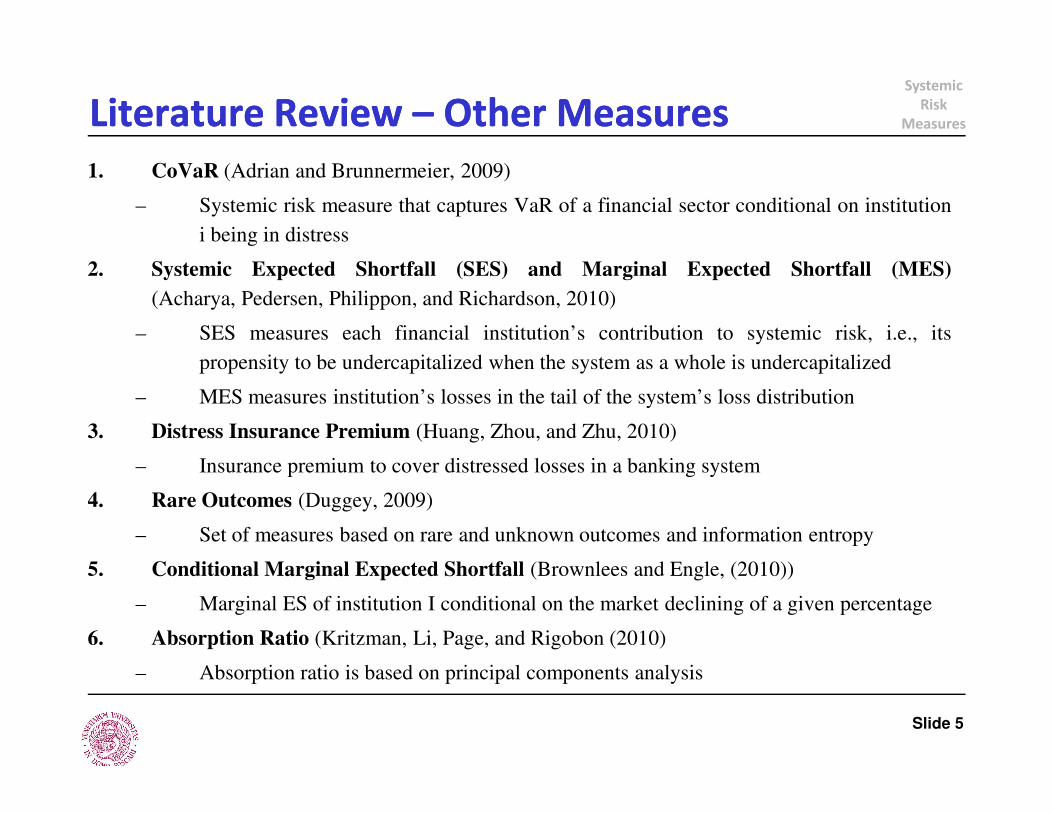
1. CoVaR (Adrian and Brunnermeier, 2009)
– Systemic risk measure that captures VaR of a financial sector conditional on institution
i being in distress
2. Systemic Expected Shortfall (SES) and Marginal Expected Shortfall (MES)
(Acharya, Pedersen, Philippon, and Richardson, 2010)
– SES measures each financial institution’s contribution to systemic risk, i.e., its
propensity to be undercapitalized when the system as a whole is undercapitalized
– MES measures institution’s losses in the tail of the system’s loss distribution
Literature Review Literature Review –– Other MeasuresOther Measures
– MES measures institution’s losses in the tail of the system’s loss distribution
3. Distress Insurance Premium (Huang, Zhou, and Zhu, 2010)
– Insurance premium to cover distressed losses in a banking system
4. Rare Outcomes (Duggey, 2009)
– Set of measures based on rare and unknown outcomes and information entropy
5. Conditional Marginal Expected Shortfall (Brownlees and Engle, (2010))
– Marginal ES of institution I conditional on the market declining of a given percentage
6. Absorption Ratio (Kritzman, Li, Page, and Rigobon (2010)
– Absorption ratio is based on principal components analysis
Slide 5
Systemic
Risk
Measures
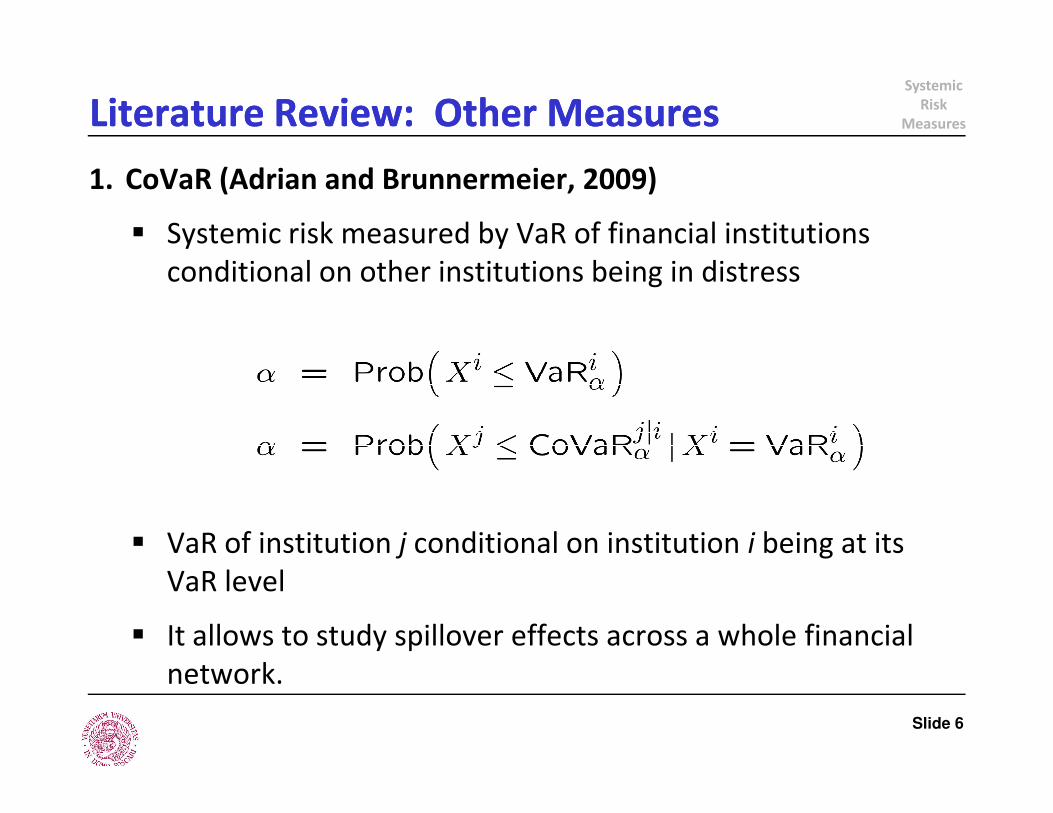
1. CoVaR (Adrian and Brunnermeier, 2009)
� Systemic risk measured by VaR of financial institutions
conditional on other institutions being in distress
Literature Review: Other MeasuresLiterature Review: Other Measures
� VaR of institution j conditional on institution i being at its
VaR level
� It allows to study spillover effects across a whole financial
network.
Slide 6
Systemic
Risk
Measures
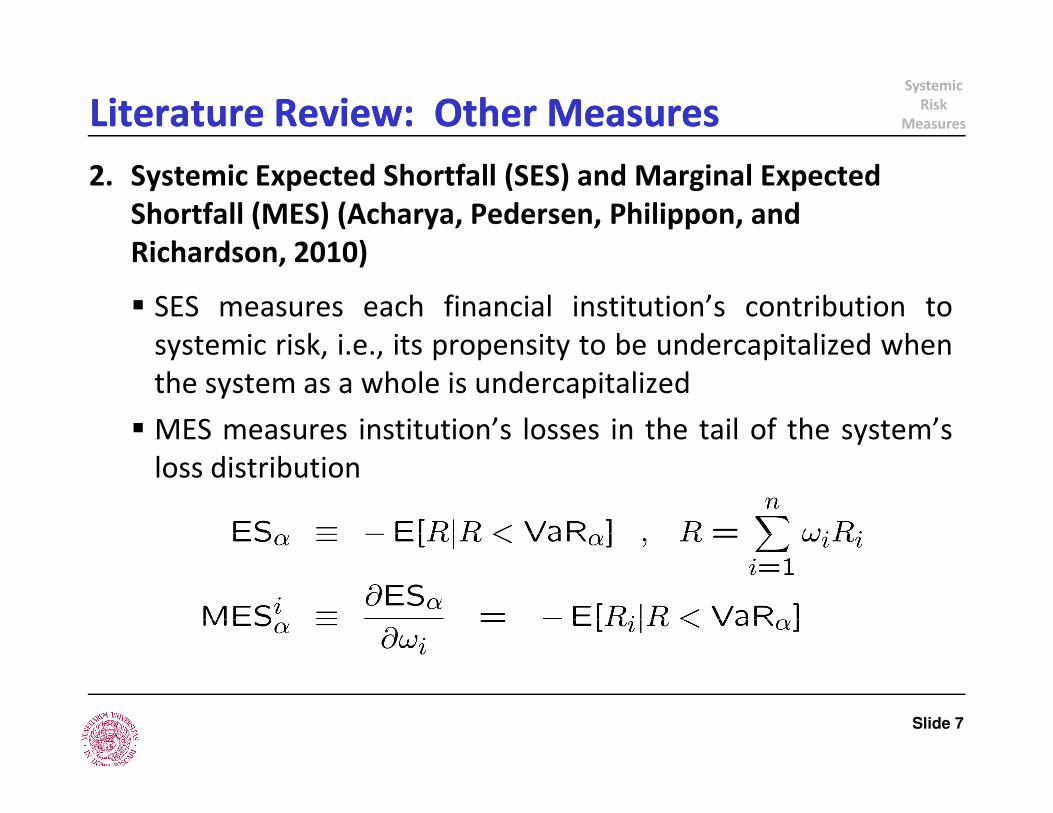
2. Systemic Expected Shortfall (SES) and Marginal Expected
Shortfall (MES) (Acharya, Pedersen, Philippon, and
Richardson, 2010)
� SES measures each financial institution’s contribution to
systemic risk, i.e., its propensity to be undercapitalized when
the system as a whole is undercapitalized
Literature Review: Other MeasuresLiterature Review: Other Measures
� MES measures institution’s losses in the tail of the system’s
loss distribution
Slide 7
Systemic
Risk
Measures
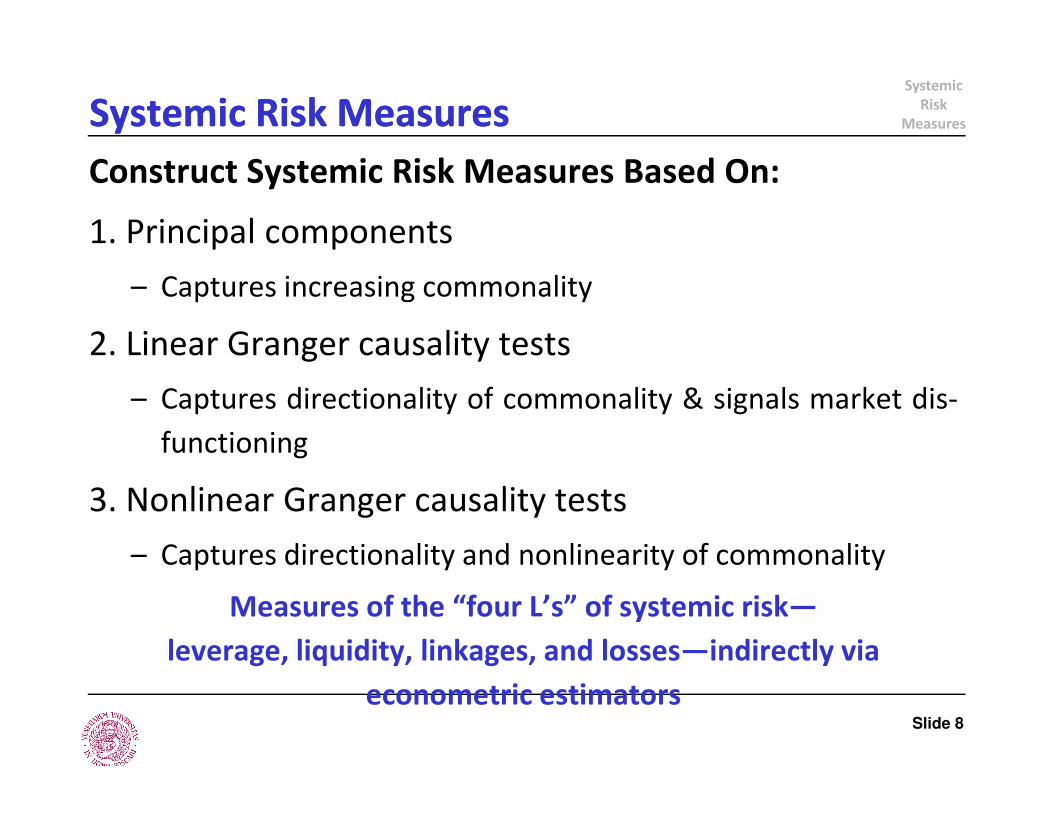
Construct Systemic Risk Measures Based On:
1. Principal components
– Captures increasing commonality
2. Linear Granger causality tests
– Captures directionality of commonality & signals market dis-
Systemic Risk MeasuresSystemic Risk Measures
– Captures directionality of commonality & signals market dis-
functioning
3. Nonlinear Granger causality tests
– Captures directionality and nonlinearity of commonality
Measures of the “four L’s” of systemic risk—
leverage, liquidity, linkages, and losses—indirectly via
econometric estimatorsSlide 8
Systemic
Risk
Measures
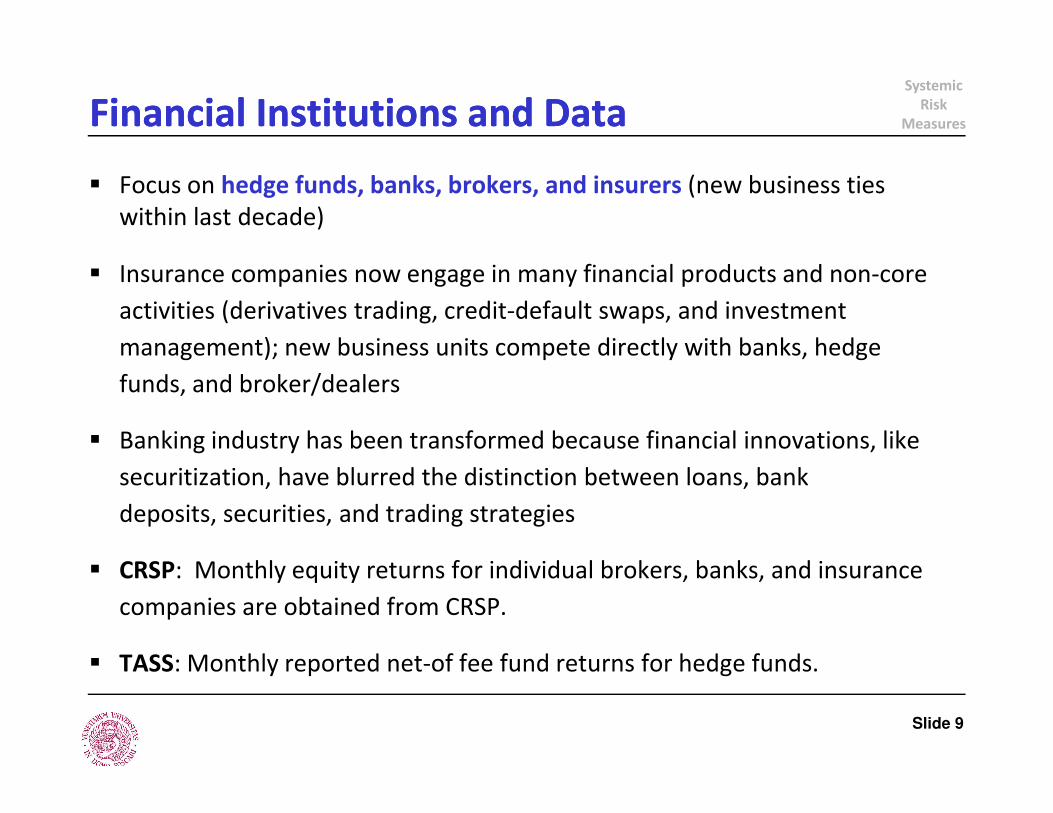
� Focus on hedge funds, banks, brokers, and insurers (new business ties
within last decade)
� Insurance companies now engage in many financial products and non-core
activities (derivatives trading, credit-default swaps, and investment
management); new business units compete directly with banks, hedge
funds, and broker/dealers
Financial Institutions and DataFinancial Institutions and Data
� Banking industry has been transformed because financial innovations, like
securitization, have blurred the distinction between loans, bank
deposits, securities, and trading strategies
� CRSP: Monthly equity returns for individual brokers, banks, and insurance
companies are obtained from CRSP.
� TASS: Monthly reported net-of fee fund returns for hedge funds.
Slide 9
Systemic
Risk
MeasuresPCA Systemic Risk MeasuresPCA Systemic Risk Measures
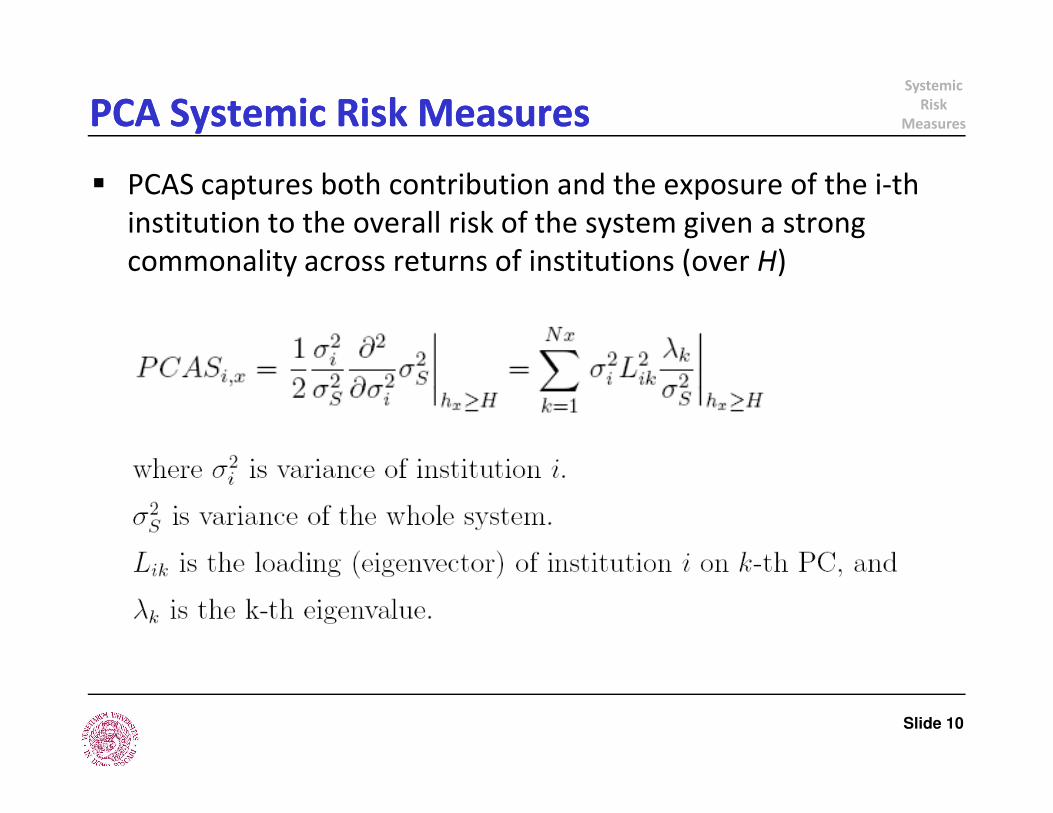
� PCAS captures both contribution and the exposure of the i-th
institution to the overall risk of the system given a strong
commonality across returns of institutions (over H)
Slide 10
Systemic
Risk
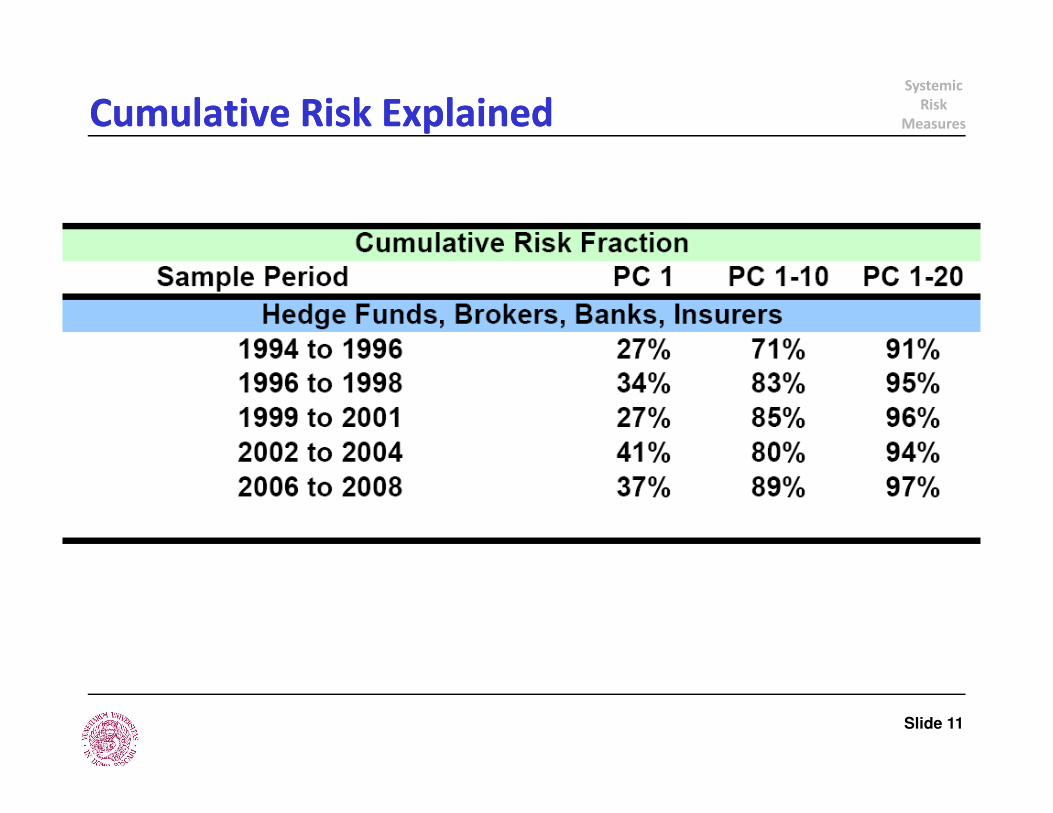
MeasuresCumulative Risk ExplainedCumulative Risk Explained
Slide 11
Systemic
Risk
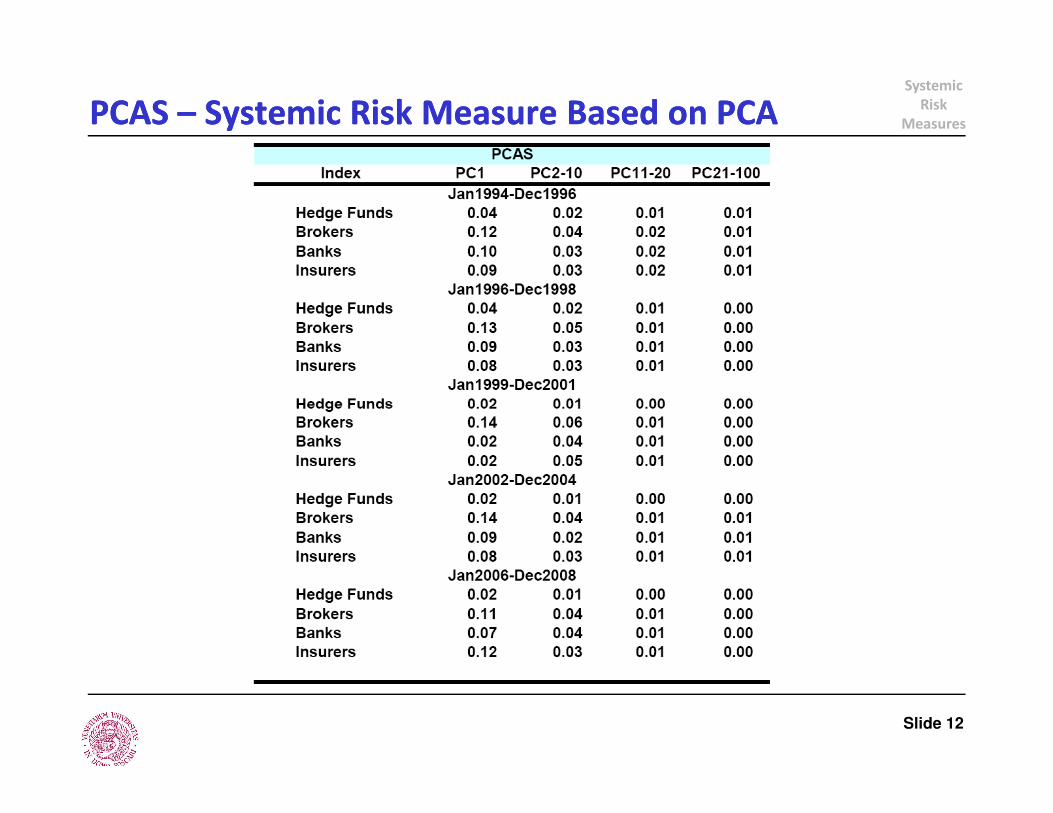
MeasuresPCAS PCAS –– Systemic Risk Measure Based on PCASystemic Risk Measure Based on PCA
Slide 12
Systemic
Risk
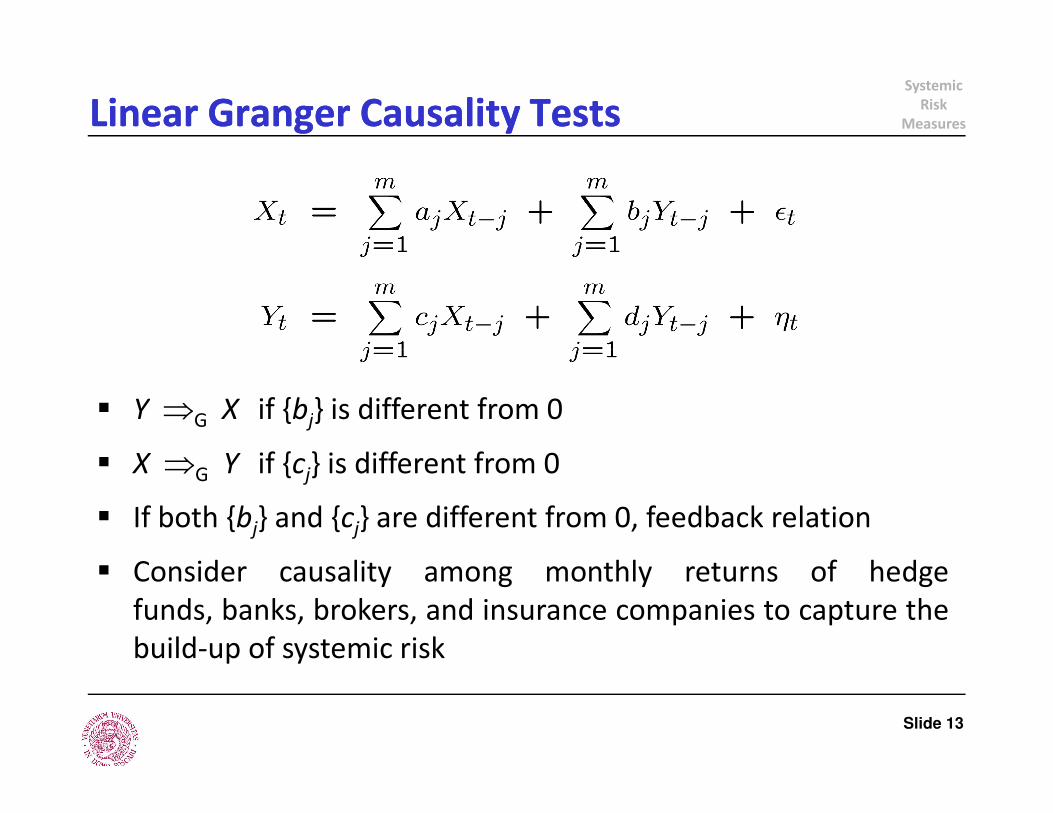
MeasuresLinear Granger Causality TestsLinear Granger Causality Tests
� Y ⇒G X if {bj} is different from 0
Slide 13
� Y ⇒G X if {bj} is different from 0
� X ⇒G Y if {cj} is different from 0
� If both {bj} and {cj} are different from 0, feedback relation
� Consider causality among monthly returns of hedge
funds, banks, brokers, and insurance companies to capture the
build-up of systemic risk
Systemic
Risk
Measures
� Dynamic propagation of systemic risk involves causal
relationships between financial institutions
� Informationally efficient markets should not exhibit Granger
causality. It is a signal of predictability, i.e. market dis-
functioning
� Potential sources of Granger Causality:
Granger Causality TestsGranger Causality Tests
� Potential sources of Granger Causality:
– VaR constraints, network effects, or other market frictions
– Degree of Granger causality may be a proxy for spillover
effects, e.g., Danielsson, Shin, and Zigrand (2009), Battiston
et al. (2009).
Slide 14
Systemic
Risk
Measures
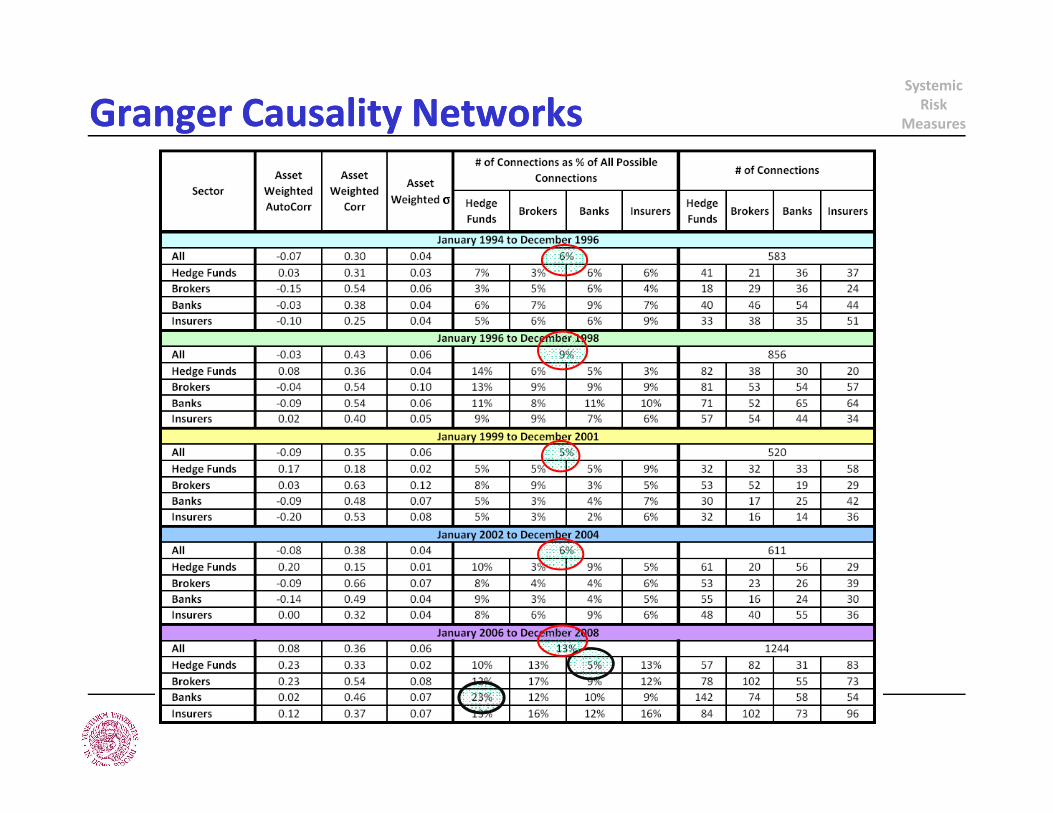
� Granger-causal relationships among 100 largest (by
AUM) banks, hedge funds, insurers, and brokers for
36-month rolling sub-periods
Granger Causality NetworksGranger Causality Networks
� Each financial and insurance sector is represented by
the 25 largest (by AUM) individual institutions.
Slide 15
Systemic
Risk
MeasuresGranger Causality NetworksGranger Causality Networks
Systemic
Risk
MeasuresGranger Causality NetworksGranger Causality Networks
7%
8%
9%
10%
11%
12%
13%
14%
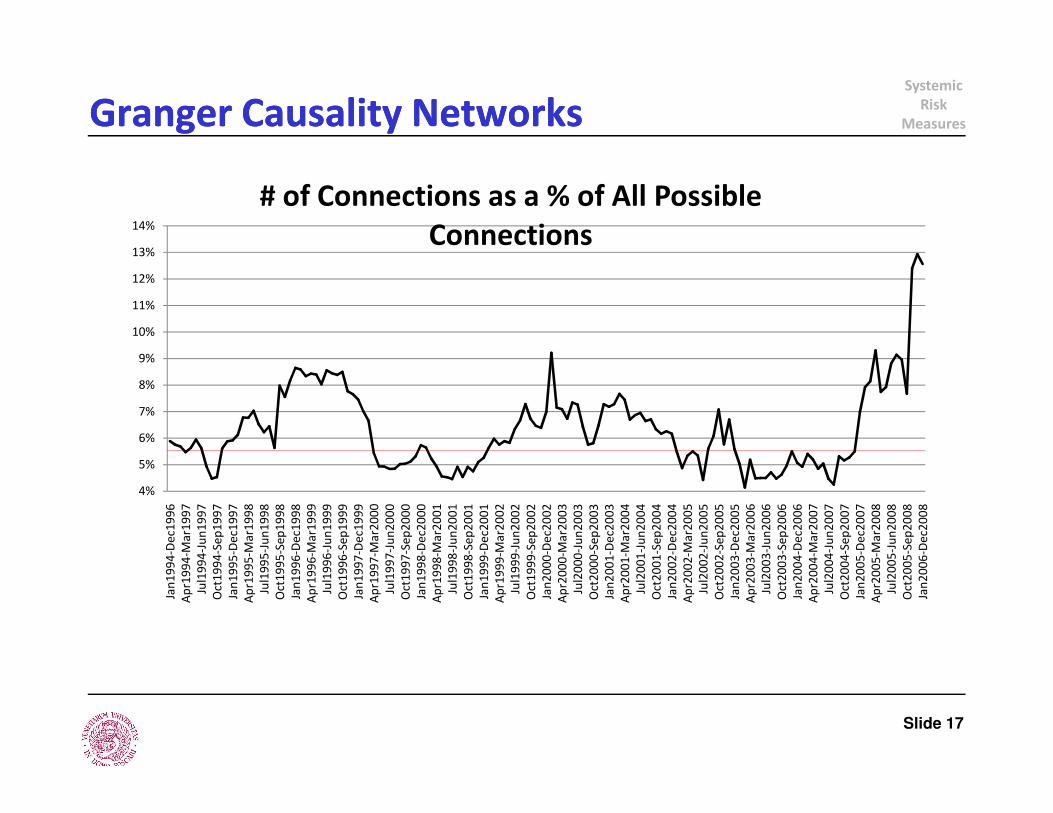
# of Connections as a % of All Possible
Connections
Slide 17
4%
5%
6%
7%
Jan
19
94
-De
c19
96
Ap
r19
94
-Ma
r19
97
Jul1
99
4-J
un
19
97
Oct
19
94
-Se
p1
99
7
Jan
19
95
-De
c19
97
Ap
r19
95
-Ma
r19
98
Jul1
99
5-J
un
19
98
Oct
19
95
-Se
p1
99
8
Jan
19
96
-De
c19
98
Ap
r19
96
-Ma
r19
99
Jul1
99
6-J
un
19
99
Oct
19
96
-Se
p1
99
9
Jan
19
97
-De
c19
99
Ap
r19
97
-Ma
r20
00
Jul1
99
7-J
un
20
00
Oct
19
97
-Se
p2
00
0
Jan
19
98
-De
c20
00
Ap
r19
98
-Ma
r20
01
Jul1
99
8-J
un
20
01
Oct
19
98
-Se
p2
00
1
Jan
19
99
-De
c20
01
Ap
r19
99
-Ma
r20
02
Jul1
99
9-J
un
20
02
Oct
19
99
-Se
p2
00
2
Jan
20
00
-De
c20
02
Ap
r20
00
-Ma
r20
03
Jul2
00
0-J
un
20
03
Oct
20
00
-Se
p2
00
3
Jan
20
01
-De
c20
03
Ap
r20
01
-Ma
r20
04
Jul2
00
1-J
un
20
04
Oct
20
01
-Se
p2
00
4
Jan
20
02
-De
c20
04
Ap
r20
02
-Ma
r20
05
Jul2
00
2-J
un
20
05
Oct
20
02
-Se
p2
00
5
Jan
20
03
-De
c20
05
Ap
r20
03
-Ma
r20
06
Jul2
00
3-J
un
20
06
Oct
20
03
-Se
p2
00
6
Jan
20
04
-De
c20
06
Ap
r20
04
-Ma
r20
07
Jul2
00
4-J
un
20
07
Oct
20
04
-Se
p2
00
7
Jan
20
05
-De
c20
07
Ap
r20
05
-Ma
r20
08
Jul2
00
5-J
un
20
08
Oct
20
05
-Se
p2
00
8
Jan
20
06
-De
c20
08
Systemic
Risk
MeasuresGranger Causality NetworksGranger Causality Networks
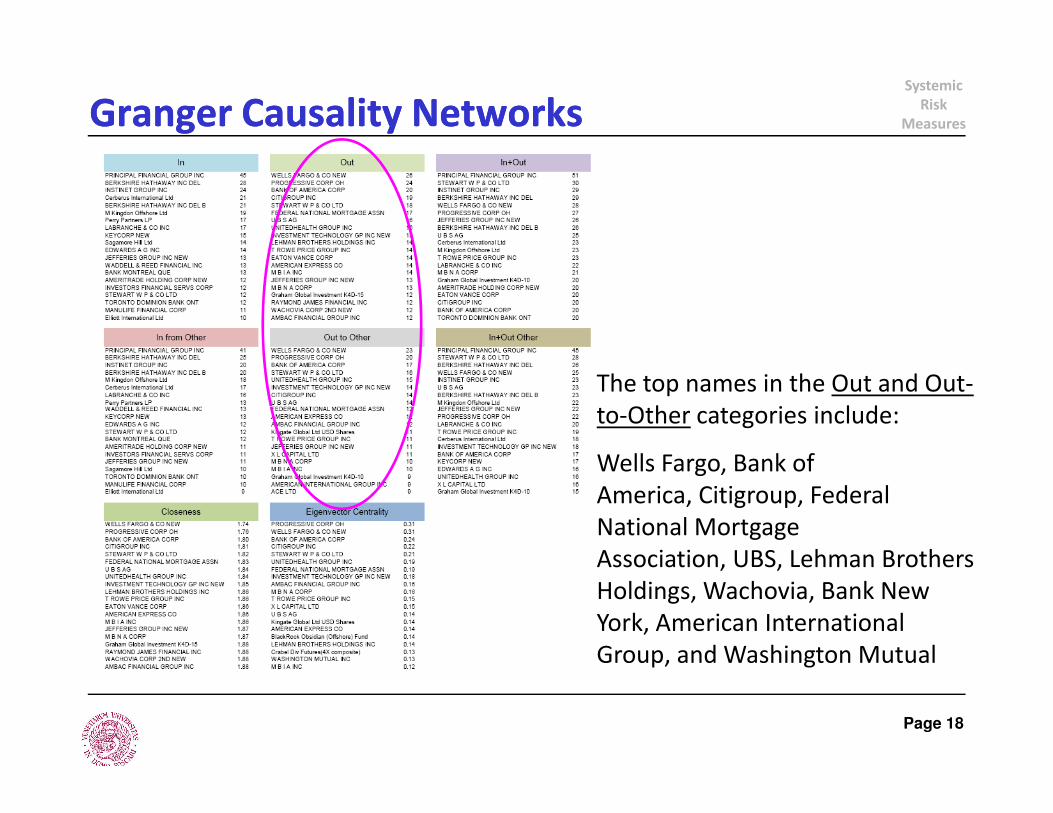
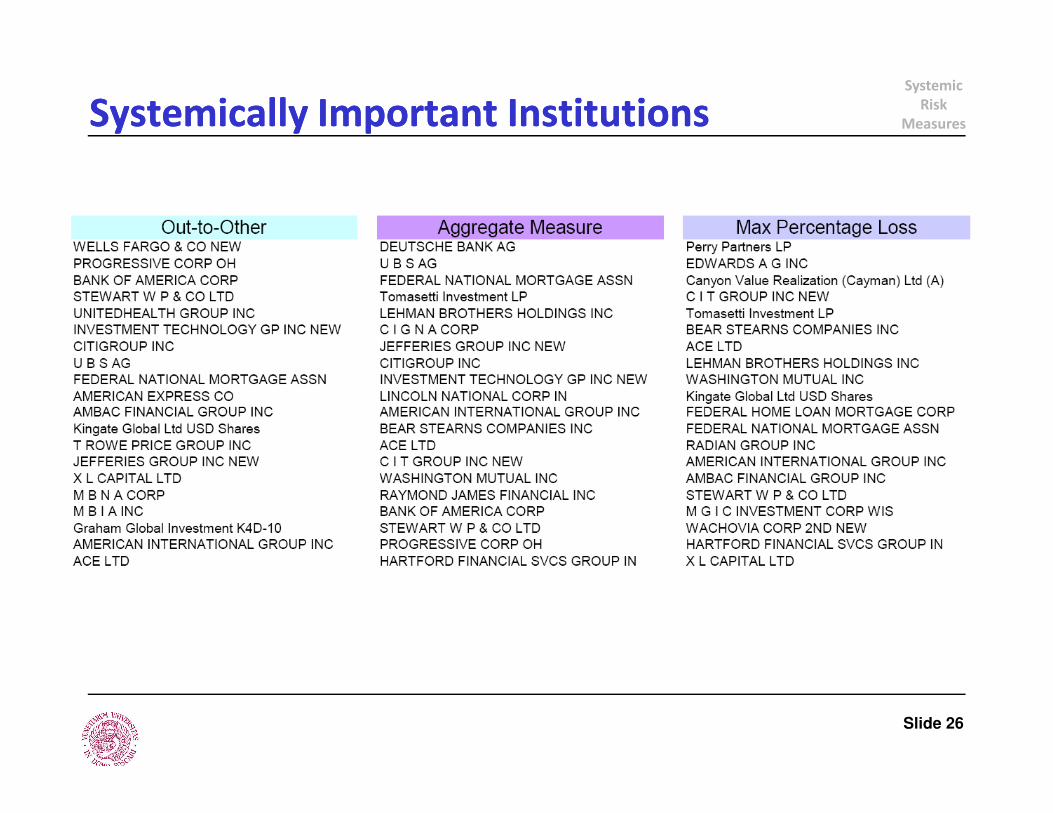
The top names in the Out and Out-
to-Other categories include:
Page 18
to-Other categories include:
Wells Fargo, Bank of
America, Citigroup, Federal
National Mortgage
Association, UBS, Lehman Brothers
Holdings, Wachovia, Bank New
York, American International
Group, and Washington Mutual
Systemic
Risk
MeasuresGranger Causality NetworksGranger Causality Networks
Page 19
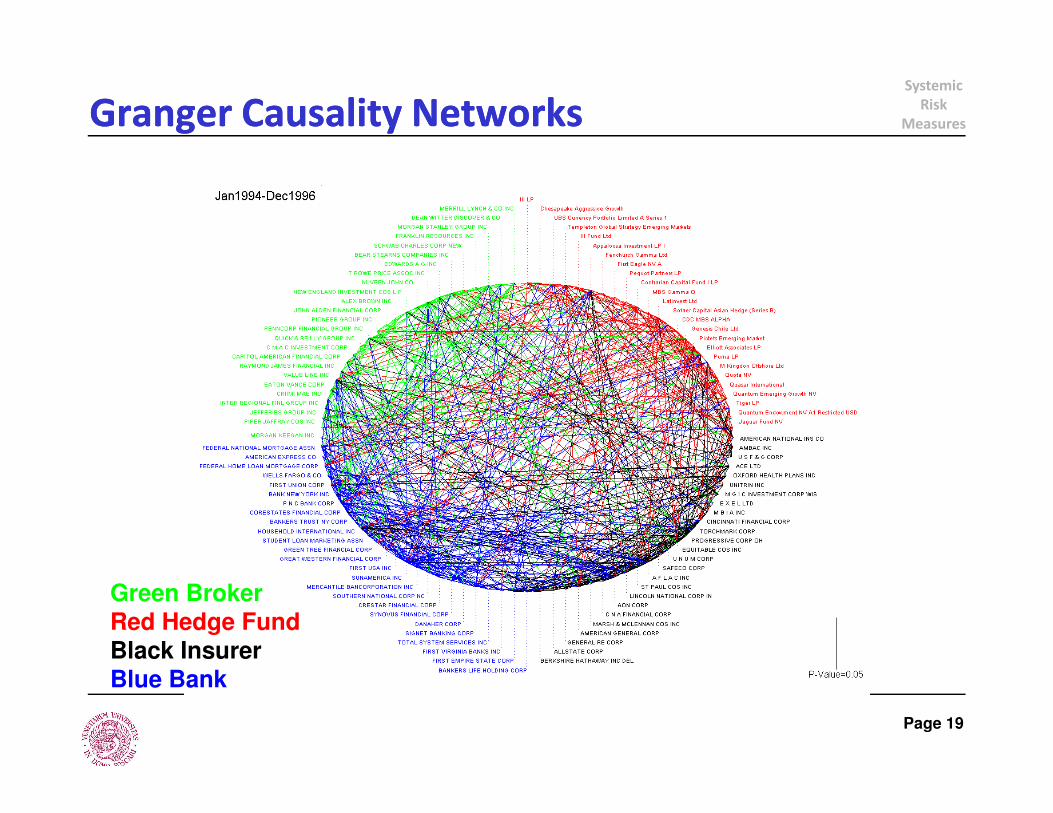
Green Broker
Red Hedge Fund
Black Insurer
Blue Bank
Systemic
Risk
MeasuresGranger Causality NetworksGranger Causality Networks
Page 20
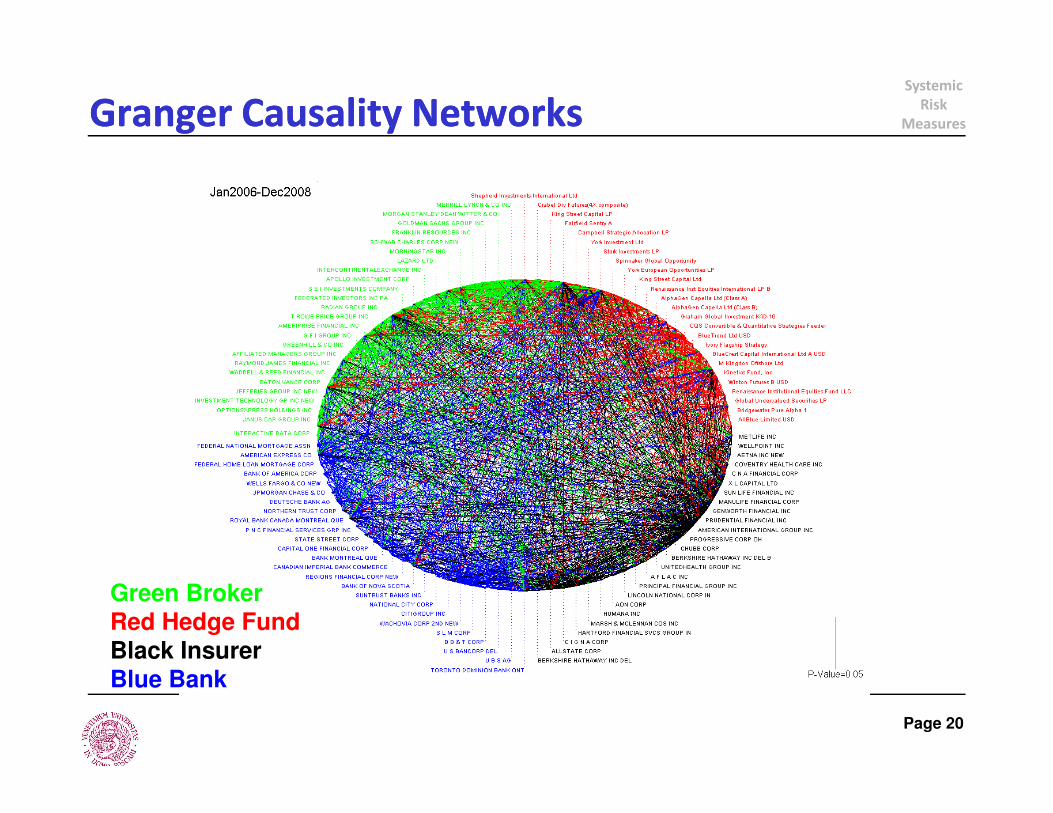
Green Broker
Red Hedge Fund
Black Insurer
Blue Bank
Systemic
Risk
Measures
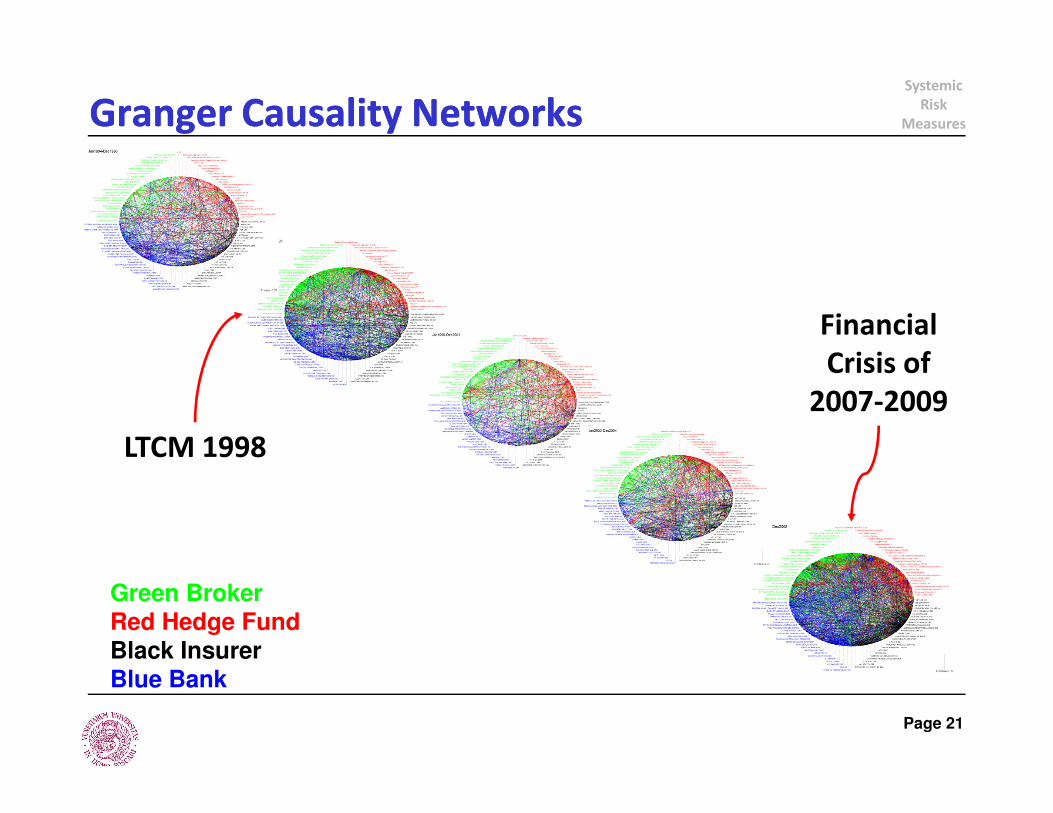
Financial
Crisis of
2007-2009
Granger Causality NetworksGranger Causality Networks
LTCM 1998
2007-2009
Page 21
Green Broker
Red Hedge Fund
Black Insurer
Blue Bank
Systemic
Risk
MeasuresGranger Causality ResultsGranger Causality Results
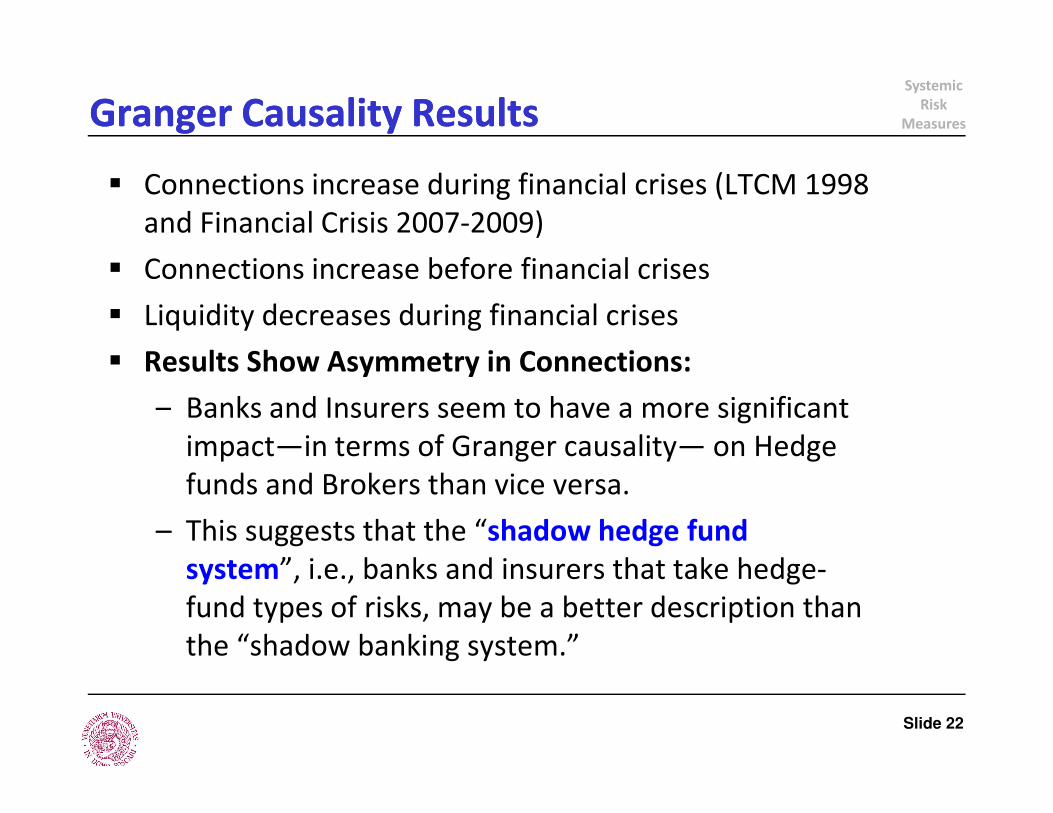
� Connections increase during financial crises (LTCM 1998
and Financial Crisis 2007-2009)
� Connections increase before financial crises
� Liquidity decreases during financial crises
� Results Show Asymmetry in Connections:
– Banks and Insurers seem to have a more significant – Banks and Insurers seem to have a more significant
impact—in terms of Granger causality— on Hedge
funds and Brokers than vice versa.
– This suggests that the “shadow hedge fund
system”, i.e., banks and insurers that take hedge-
fund types of risks, may be a better description than
the “shadow banking system.”
Slide 22
Systemic
Risk
Measures
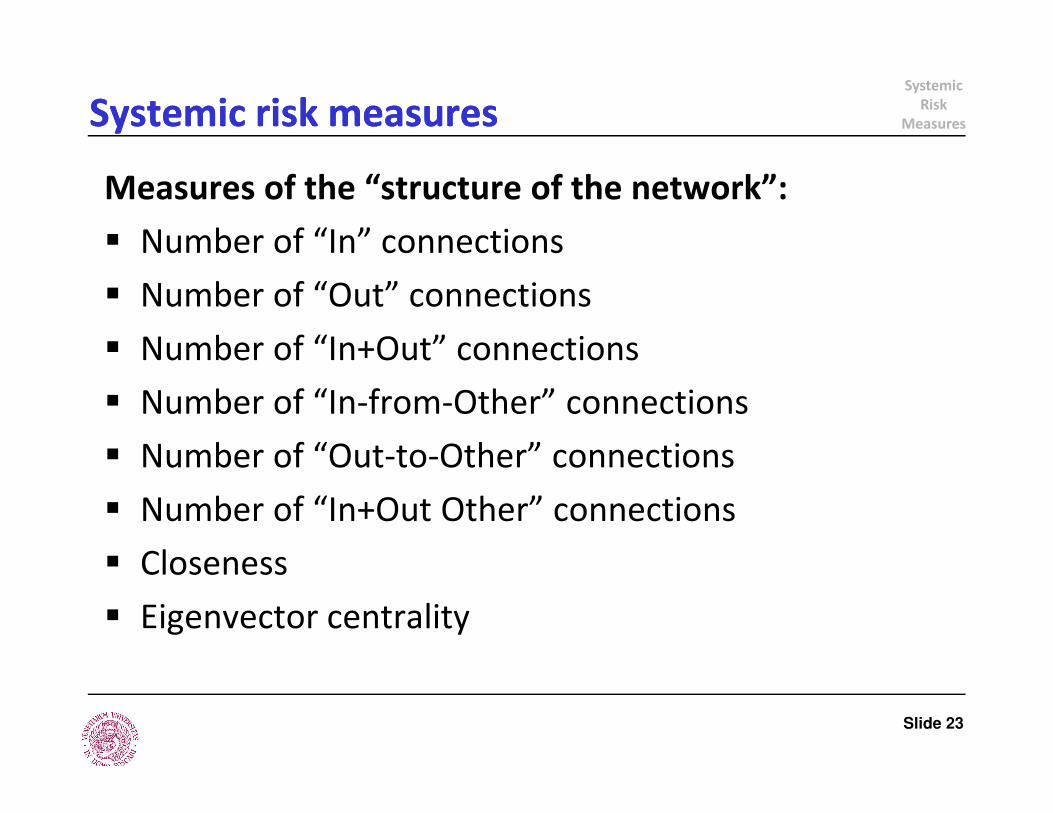
Measures of the “structure of the network”:
� Number of “In” connections
� Number of “Out” connections
� Number of “In+Out” connections
� Number of “In-from-Other” connections
Systemic risk measuresSystemic risk measures
� Number of “In-from-Other” connections
� Number of “Out-to-Other” connections
� Number of “In+Out Other” connections
� Closeness
� Eigenvector centrality
Slide 23
Systemic
Risk
Measures
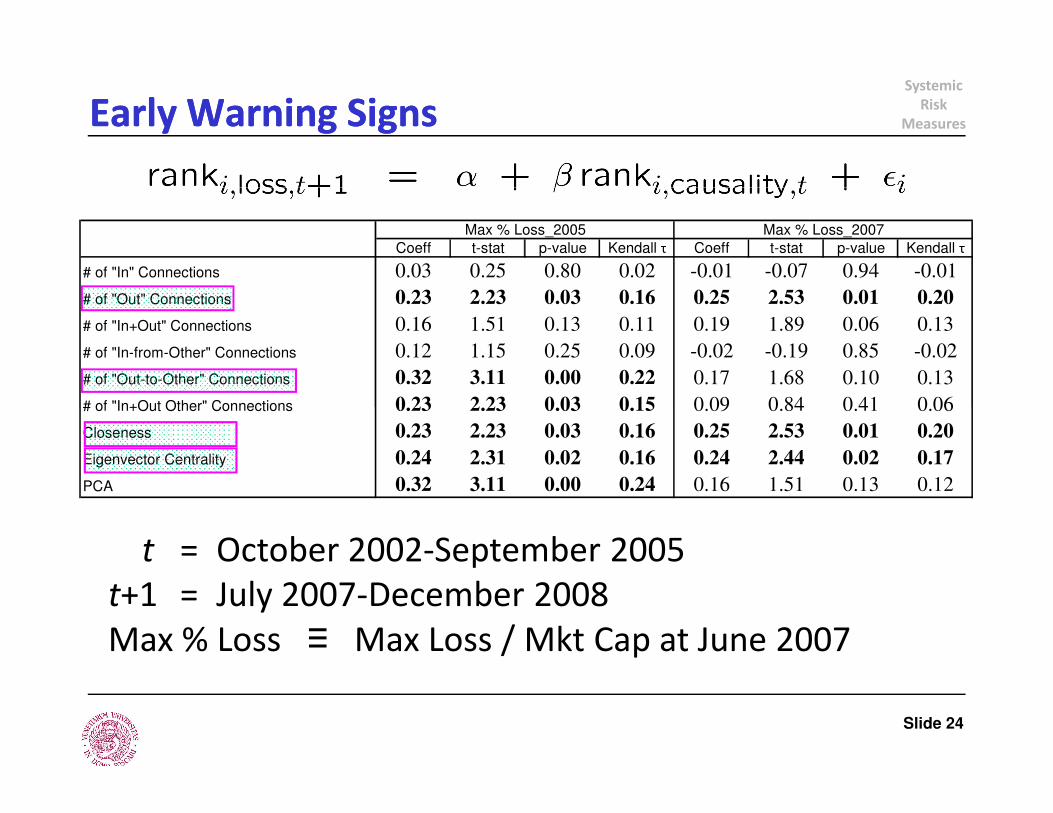
Coeff t-stat p-value Kendall τ Coeff t-stat p-value Kendall τ
# of "In" Connections 0.03 0.25 0.80 0.02 -0.01 -0.07 0.94 -0.01
# of "Out" Connections 0.23 2.23 0.03 0.16 0.25 2.53 0.01 0.20
# of "In+Out" Connections 0.16 1.51 0.13 0.11 0.19 1.89 0.06 0.13
# of "In-from-Other" Connections 0.12 1.15 0.25 0.09 -0.02 -0.19 0.85 -0.02
# of "Out-to-Other" Connections 0.32 3.11 0.00 0.22 0.17 1.68 0.10 0.13
# of "In+Out Other" Connections 0.23 2.23 0.03 0.15 0.09 0.84 0.41 0.06
Max % Loss_2005 Max % Loss_2007
Early Warning SignsEarly Warning Signs
t = October 2002-September 2005
t+1 = July 2007-December 2008
Max % Loss ≡ Max Loss / Mkt Cap at June 2007
# of "In+Out Other" Connections 0.23 2.23 0.03 0.15 0.09 0.84 0.41 0.06
Closeness 0.23 2.23 0.03 0.16 0.25 2.53 0.01 0.20
Eigenvector Centrality 0.24 2.31 0.02 0.16 0.24 2.44 0.02 0.17
PCA 0.32 3.11 0.00 0.24 0.16 1.51 0.13 0.12
Slide 24
Systemic
Risk
Measures
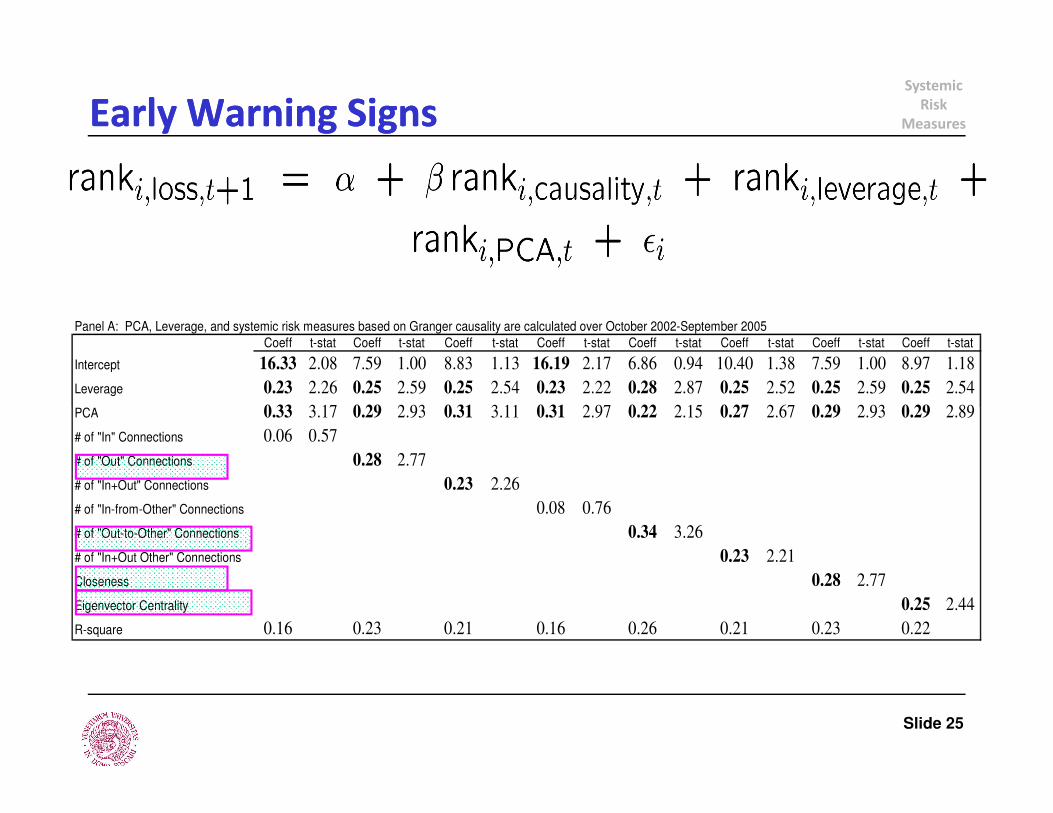
Panel A: PCA, Leverage, and systemic risk measures based on Granger causality are calculated over October 2002-September 2005
Coeff t-stat Coeff t-stat Coeff t-stat Coeff t-stat Coeff t-stat Coeff t-stat Coeff t-stat Coeff t-stat
Intercept 16.33 2.08 7.59 1.00 8.83 1.13 16.19 2.17 6.86 0.94 10.40 1.38 7.59 1.00 8.97 1.18
Leverage 0.23 2.26 0.25 2.59 0.25 2.54 0.23 2.22 0.28 2.87 0.25 2.52 0.25 2.59 0.25 2.54
PCA 0.33 3.17 0.29 2.93 0.31 3.11 0.31 2.97 0.22 2.15 0.27 2.67 0.29 2.93 0.29 2.89
Early Warning SignsEarly Warning Signs
PCA 0.33 3.17 0.29 2.93 0.31 3.11 0.31 2.97 0.22 2.15 0.27 2.67 0.29 2.93 0.29 2.89
# of "In" Connections 0.06 0.57
# of "Out" Connections 0.28 2.77
# of "In+Out" Connections 0.23 2.26
# of "In-from-Other" Connections 0.08 0.76
# of "Out-to-Other" Connections 0.34 3.26
# of "In+Out Other" Connections 0.23 2.21
Closeness 0.28 2.77
Eigenvector Centrality 0.25 2.44
R-square 0.16 0.23 0.21 0.16 0.26 0.21 0.23 0.22
Slide 25
Systemic
Risk
MeasuresSystemically Important InstitutionsSystemically Important Institutions
Slide 26
Systemic
Risk
Measures
� The financial system has become more complex as distinctions
between hedge funds, insurance companies, banks, and
broker/dealers have blurred, thanks to financial innovation and
deregulation; greater interconnectedness
� We propose measuring systemic risk indirectly via econometric
techniques such as principal components analysis and
Granger-causality tests
ConclusionsConclusions
Granger-causality tests
– Principal components analysis provides a broad view of
commonality among all four groups of financial institutions
– Granger-causality networks capture the intricate web of
dynamic and causal statistical relations among individual
firms in the finance and insurance industries
Slide 27
Systemic
Risk
Measures
� Using monthly returns for hedge-fund indexes and portfolios of
publicly traded banks, insurers, brokers, we show that such
indirect measures can:
– identify periods of market dislocation and distress
– Serve as early warning signals
� Moreover, over the recent sample period, our empirical results
ConclusionsConclusions
� Moreover, over the recent sample period, our empirical results
suggest that the banking and insurance sectors may be more
important sources of systemic risk than other financial
institutions, which is consistent with the anecdotal evidence
from the current financial crisis.
Slide 28

Thank You!Thank You!
Systemic
Risk
Measures
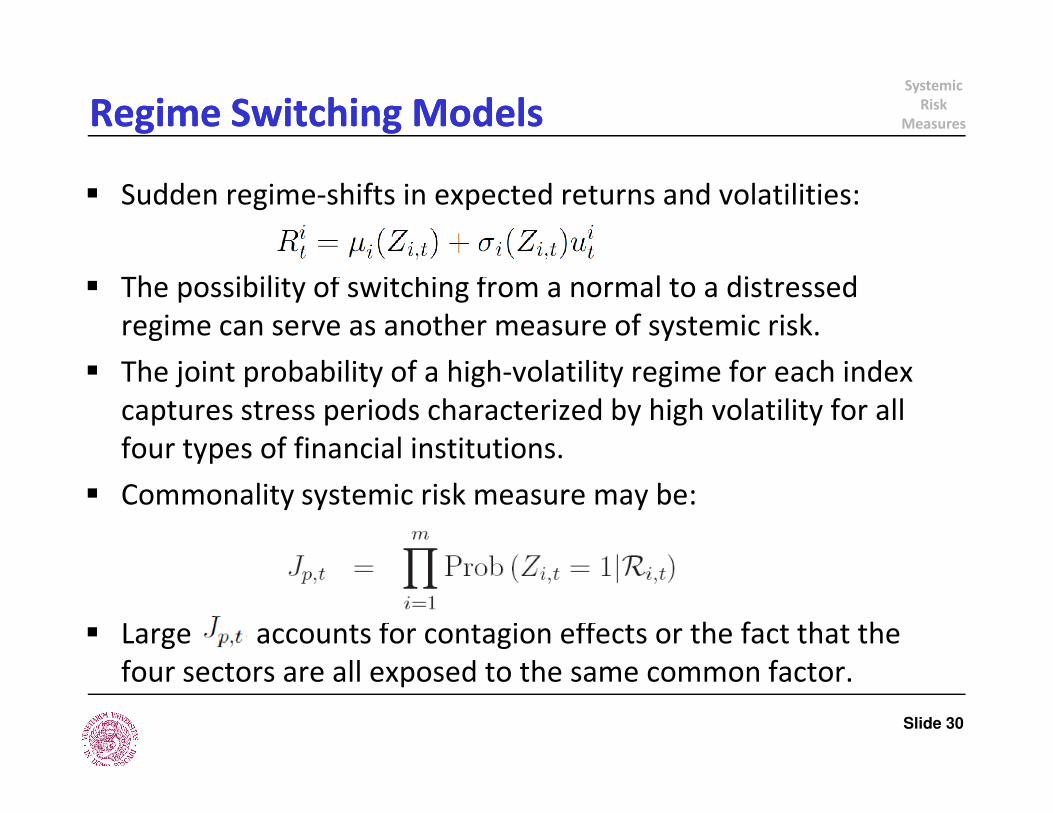
� Sudden regime-shifts in expected returns and volatilities:
� The possibility of switching from a normal to a distressed
regime can serve as another measure of systemic risk.
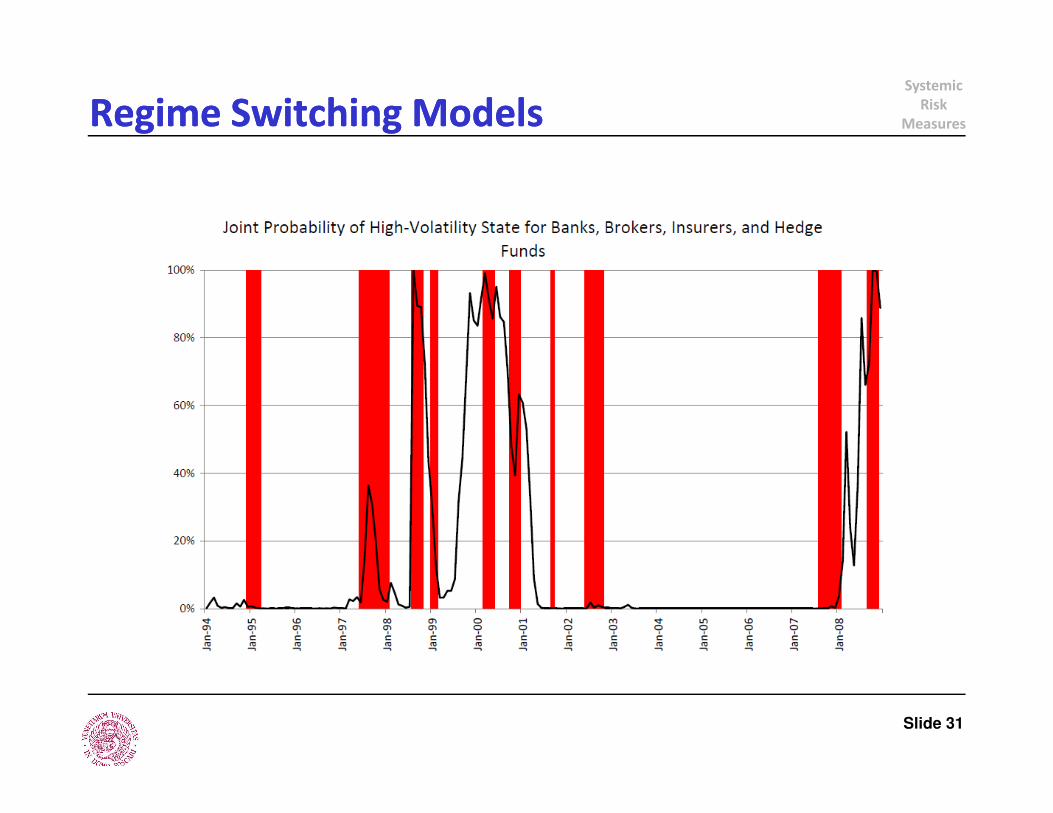
� The joint probability of a high-volatility regime for each index
captures stress periods characterized by high volatility for all
Regime Switching ModelsRegime Switching Models
captures stress periods characterized by high volatility for all
four types of financial institutions.
� Commonality systemic risk measure may be:
� Large accounts for contagion effects or the fact that the
four sectors are all exposed to the same common factor.
Slide 30
Systemic
Risk
MeasuresRegime Switching ModelsRegime Switching Models
Slide 31
Systemic
Risk
Measures
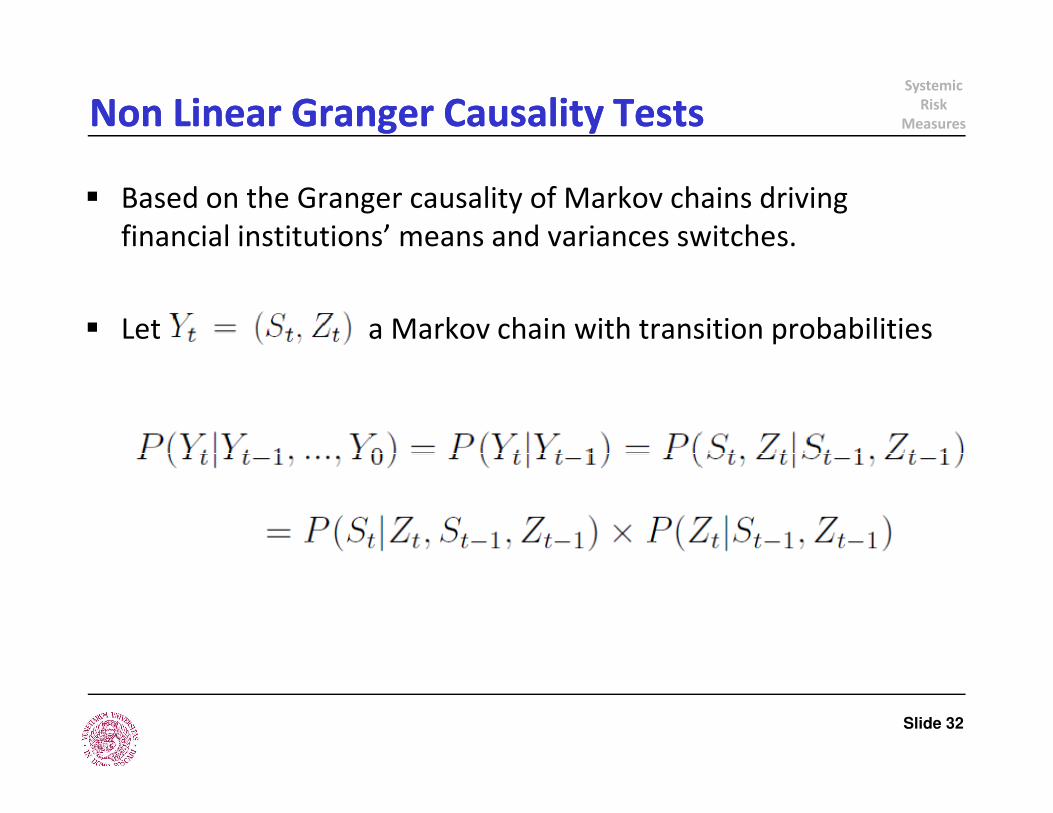
� Based on the Granger causality of Markov chains driving
financial institutions’ means and variances switches.
� Let a Markov chain with transition probabilities
Non Linear Granger Causality TestsNon Linear Granger Causality Tests
Slide 32
Systemic
Risk
MeasuresNon Linear Granger Causality TestsNon Linear Granger Causality Tests
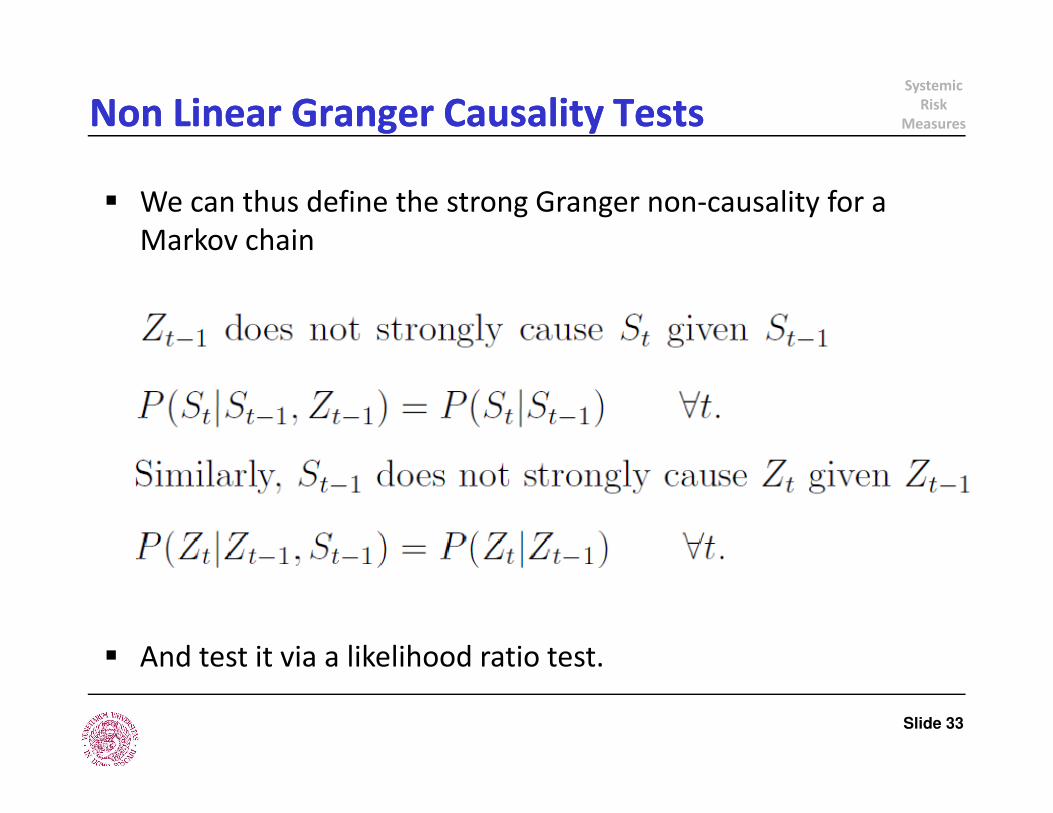
� We can thus define the strong Granger non-causality for a
Markov chain
Slide 33
� And test it via a likelihood ratio test.
Systemic
Risk
MeasuresNon Linear Granger Causality TestsNon Linear Granger Causality Tests
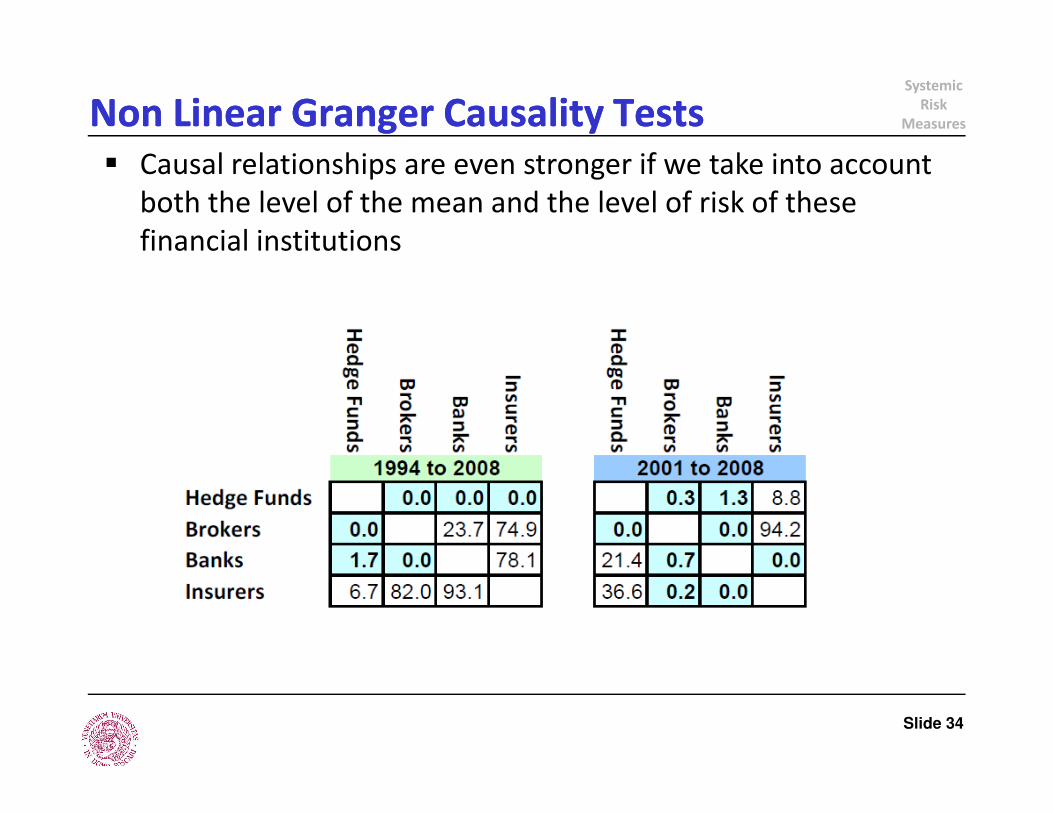
� Causal relationships are even stronger if we take into account
both the level of the mean and the level of risk of these
financial institutions
Slide 34