Embed Size (px)
DESCRIPTION
economic
Citation preview
A PROJECT REPORT ON
“ECONOMIC PROJECT ON INDIAN AND ASEAN TRAD’S”
SUBMITTED BY
MR/MISS ZINE SAGAR VIJAY SANGITA,
ROLL NO: 6279
M.Com. SEM- I
(ADVANCE ACCOUNTANCY)
ACADEMIC YEAR: 2014-15
Under the guidance of PROJECT GUIDE
PROF. S.V.RANE
PROF.Mrs. C. K. Kaul , PROF.Dr. ArjunLakhe
SUBMITTED TO UNIVERSITY OF MUMBAI
MULUND COLLEGE OF COMMERCE
S N ROAD, MULUND (WEST)
Page | 1
MUMBAI - 400080
DECLARATION FROM THE STUDENT
I, ZINE SAGAR VIJAY SANGITA ROLL No. 6279 Student of Mulund
College Of Commerce, S. N. Road, Mulund (West) 400080, studying in
M.Com Part- I hereby declare that I have completed the project on “INDIAN
AND ASEAN TRADE’S ” under the guidance of project guide
Prof.C.k.kaul and prof. Arjnulakhe during the academic year 2014-15. The
information submitted is true to the best of my knowledge.
Date: 01st November, 2014 Signature
Place: Mulund
Page | 2
CERTIFICATE
I, Prof., hereby certify that Mr/Miss ZINE SAGAR VIJAY SANGITA Roll No. 6279 of
Mulund College of Commerce, S. N. Road, Mulund (West), Mumbai -400080 of M.com
Part I (Advanced Accountancy) has completed her project on “INDIAN AND ASEAN
TRAD’S” during the academic year 2014-15. The information submitted is true and
original to the best of my knowledge.
Project Guide External guide
Co-coordinator Principal
Date: 01st November, 2014
Page | 3
ACKNOWLEDGEMENT
I would like to express my sincere gratitude to Principal of Mulund
College of Commerce DR. (Mrs.) ParvathiVenkatesh, Course -
Coordinator Prof. C.K.KAUL and Prof. arjunlakhe and our project guide
Prof., for providing me an opportunity to do my project work on
“INDIAN AND ASEAN (TRAD’S)”. I also wish to express my sincere
gratitude to the non - teaching staff of our college. I sincerely thank
to all of them in helping me to carrying out this project work. Last but
not the least, I wish to avail myself of this opportunity, to express a
sense of gratitude and love to my friends and my beloved parents for
their mutual support, strength, help and for everything.
DATE: 01st November, 2014 SIGNATURE
PLACE:MULUND
Page | 4

Contents
Executive summary 6
INTRODUCTION 8
Objective of the study 10
Literature review 11
Background: 15
HISTROY : 16
Methodology – 18
India’s Trade with ASEAN Countries 20
SHARE OF INDIA’S EXPORTS IN ASEAN IMPORTS: 1980-2009 22
The ASEAN-India FTA in Goods 39
Impact on bilateral trade between India and ASEAN 40
Effect of increased imports on domestic production in India 45
Effect of increased import from India on the ASEAN region 46
Impact on the Agricultural Sector 47
RISING ASEAN - INDIA TRAD 48
Conclusion 50
Bibliography/ webliography 51
Page | 5
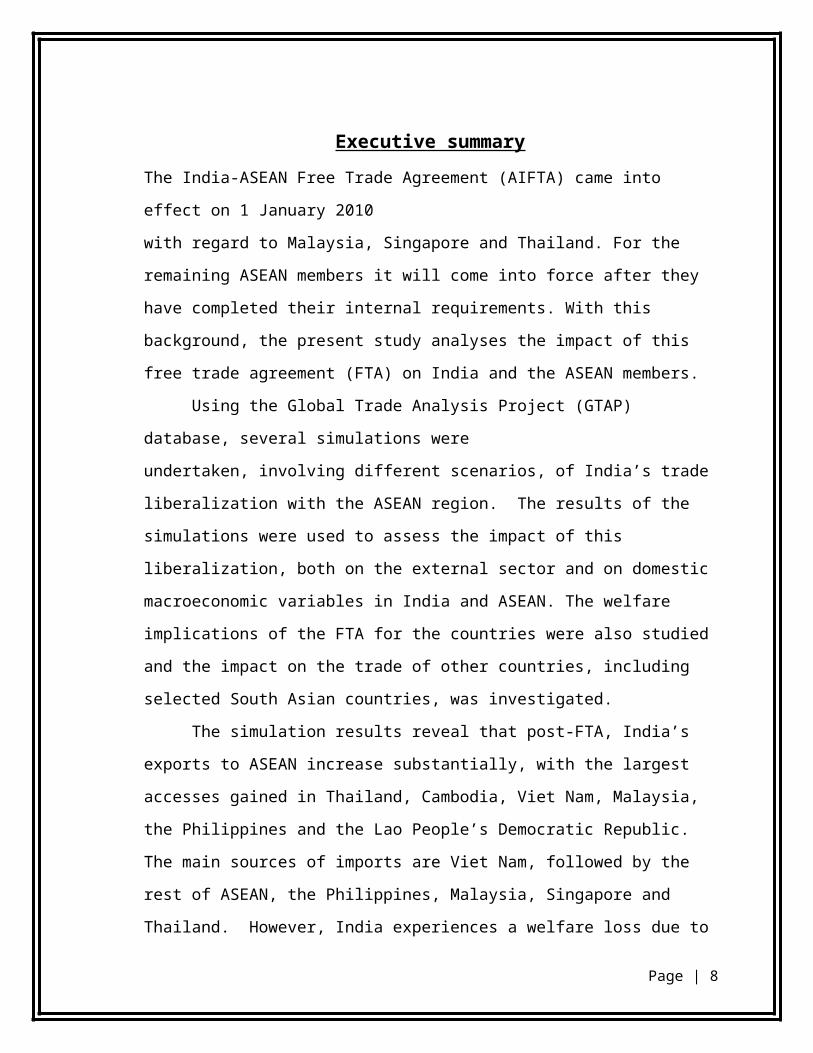
Executive summary
The India-ASEAN Free Trade Agreement (AIFTA) came into effect on 1 January 2010
with regard to Malaysia, Singapore and Thailand. For the remaining ASEAN members it
will come into force after they have completed their internal requirements. With this
background, the present study analyses the impact of this free trade agreement (FTA) on
India and the ASEAN members.
Using the Global Trade Analysis Project (GTAP) database, several simulations were
undertaken, involving different scenarios, of India’s trade liberalization with the ASEAN
region. The results of the simulations were used to assess the impact of this
liberalization, both on the external sector and on domestic macroeconomic variables in
India and ASEAN. The welfare implications of the FTA for the countries were also
studied and the impact on the trade of other countries, including selected South Asian
countries, was investigated.
The simulation results reveal that post-FTA, India’s exports to ASEAN increase
substantially, with the largest accesses gained in Thailand, Cambodia, Viet Nam,
Malaysia, the Philippines and the Lao People’s Democratic Republic. The main sources
of imports are Viet Nam, followed by the rest of ASEAN, the Philippines, Malaysia,
Singapore and Thailand. However, India experiences a welfare loss due to both
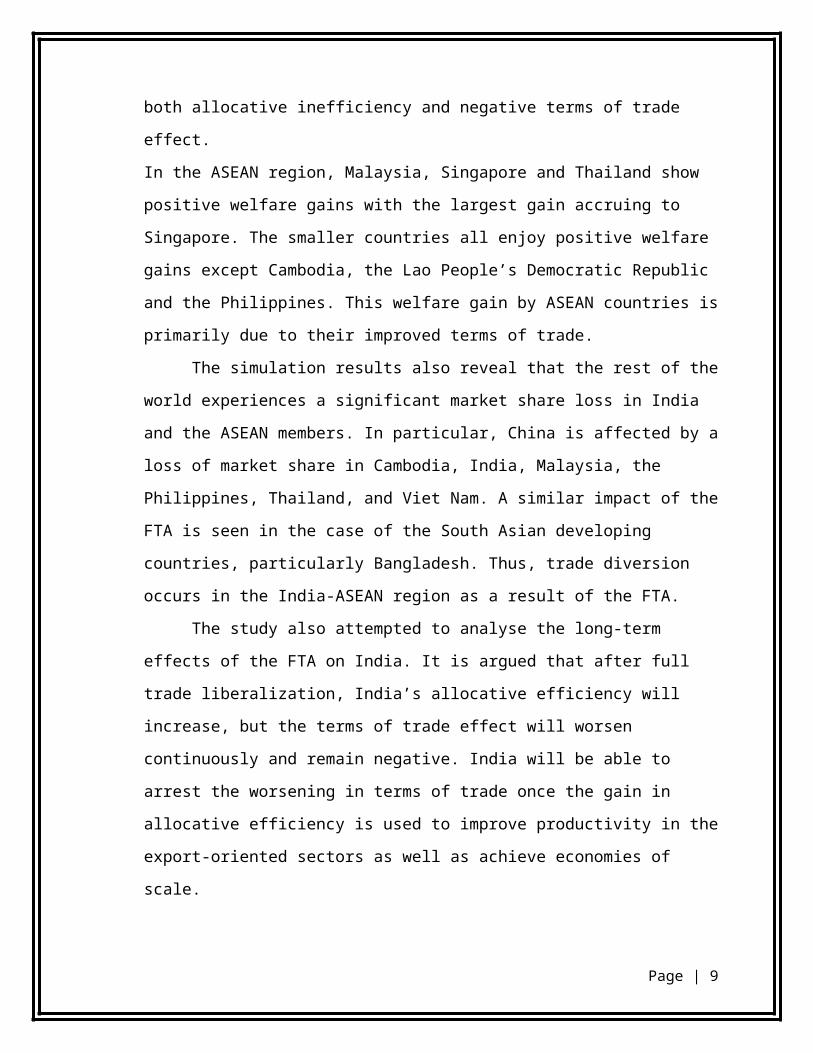
allocative inefficiency and negative terms of trade effect.
In the ASEAN region, Malaysia, Singapore and Thailand show positive welfare gains
with the largest gain accruing to Singapore. The smaller countries all enjoy positive
welfare gains except Cambodia, the Lao People’s Democratic Republic and the
Philippines. This welfare gain by ASEAN countries is primarily due to their improved
terms of trade.
The simulation results also reveal that the rest of the world experiences a
significant market share loss in India and the ASEAN members. In particular, China is
affected by a loss of market share in Cambodia, India, Malaysia, the Philippines,
Thailand, and Viet Nam. A similar impact of the FTA is seen in the case of the South
Page | 6
Asian developing countries, particularly Bangladesh. Thus, trade diversion occurs in the
India-ASEAN region as a result of the FTA.
The study also attempted to analyse the long-term effects of the FTA on India. It
is argued that after full trade liberalization, India’s allocative efficiency will increase, but
the terms of trade effect will worsen continuously and remain negative. India will be able
to arrest the worsening in terms of trade once the gain in allocative efficiency is used to
improve productivity in the export-oriented sectors as well as achieve economies of scale.
Page | 7
INTRODUCTION
ASEAN–India Free Trade Area
India’s growing profile has attracted countries of South-East Asia to foster closer engagement at regional and multilateral level. India and ASEAN set up various institutions mechanisms like India- ASEAN Business Council, India – ASEAN Business Summit, India – ASEAN Negotiation Committee etc. to overcome the barriers in deepening interactions. India-ASEAN Trade in Goods (TIG) Agreement came into force since January, 2010 has been another landmark development in greater integration of Indian economy with that of ASEAN. The growing realization that both regions are complementary rather than competitive, has given a further boost to trade and economic engagements. As a result, in the last four years, the bilateral trade has increased by more than 90 percent from US $ 23 b in 2005 to US $ 44 b by 2009-10.Therefore, it is necessary and useful to analyze the trends and direction of Indo-ASEAN trade for the period 1980- 2009. To analyze, Indo-ASEAN trade at aggregate level, and to explore the importance of Indo-ASEAN trade, the share of India in ASEAN trade as well as share of ASEAN in India’s trade has been analyzed. To know the direction of India’s trade with ASEAN, it is essential to look into the country- wise share and growth in trade overtime.
The ASEAN–India Free Trade Area (AIFTA) is a free trade area among the ten
member states of the Association of Southeast Asian Nations (ASEAN) and India. The
initial framework agreement was signed on 8 October 2003 in Bali,Indonesia and the
final agreement was on 13 August 2009. The free trade area came into effect on 1
January 2010. India hosted the latest ASEAN-India Commemorative Summit in New
Delhi on December 20–21, 2012. As of 2011-12, two-way trade between India &
ASEAN stood at US$ 79 billion.
India announced its “Look East” policy in 1991 in an attempt to increase its engagement
with the East Asian countries. Consequently, in 1992, it became a sectoral dialogue
partner of the Association of Southeast Asian Nations (ASEAN). ASEAN, which is a
geo-political and economic organization with 10 member countries, was formed in
August 1967 by Indonesia, Malaysia, the Philippines, Singapore and Thailand. Since
then, the membership has expanded to include Brunei Darussalam, Cambodia, the Lao
People’s Democratic Republic, Myanmar and Viet Nam. ASEAN’s objectives are to
Page | 8
accelerate economic growth, social progress and cultural development among its
members, protect the peace and stability of the region, and provide opportunities for the
member countries to discuss their differences peacefully.
India became a Full Dialogue Partner of ASEAN in 1995and a member of the ASEAN
Regional Forum (ARF) in 1996. India and ASEAN signed a Framework Agreement – the
Comprehensive Economic Cooperation Agreement (CECA) – on 8 October 2003 with a
view to providing an institutional framework that would enable economic cooperation to
come into effect. Negotiations on a trade in goods agreement between India and ASEAN
were started in March 2004. The negotiations continued for six years and finally the
India-ASEAN Free Trade Agreement (AIFTA) was signed on 13 August 2009 in
Bangkok during a meeting of the Economic Ministers of ASEAN. The agreement, which
only covers trade in goods between India and the ASEAN members, came into effect on
1 January 2010 in the case of Malaysia, Singapore and Thailand. For the remaining
ASEAN members it will come into force after they have completed their internal
requirements.
AIFTA will boost bilateral trade between the two regions. ASEAN is a major trading
partner of India and it accounted for 9.27 per cent of India’s global trade in 2008. In
2008/09, bilateral trade between India and ASEAN was worth almost US$ 45 billion.
India and ASEAN set a target of achieving bilateral trade of US$ 50 billion by 2010, a
goal that is likely to be achieved (Dash, 2010). India’s trade with ASEAN is mainly
concentrated in Indonesia, Malaysia, Singapore and Thailand. These four countries
remain the largest markets for Indian exports in the ASEAN region as well as the largest
sources for India’s imports from the ASEAN region. Among them, Singapore is the
largest destination for Indian goods (45.6% of total exports to ASEAN in 2008) and the
largest source of imports for India (31.1% of India’s total imports from ASEAN in 2008),
followed by Malaysia, Indonesia and Thailand.
Page | 9
Objective of the study
Against the above backdrop, the present study analysed the impact of the trade agreement
on India and the ASEAN members. The study used the Global Trade Analysis Project
(GTAP) for this purpose. The GTAP model is a comparative, static multi-regional
computable general equilibrium (CGE) model that uses a common global database. This
is an analytical tool used to understand the dynamics of major economic variables in a
simulated environment. Using this database, a number of simulations were carried out by
this study, involving different scenarios of
(a) India’s trade liberalization with regard to Malaysia, Singapore and Thailand; (b)
liberalization with all 10 ASEAN countries (as will be the case by 2019); and (c) full
liberalization if tariffs on all products traded between India and the ASEAN members are
completely eliminated. The results of the simulations were then used to assess the impact
of liberalization on India and ASEAN members as well as on some other countries. The
welfare implications of the FTA for the countries involved were studied in the case of
where (a) perfect competition and constant returns to scale and imperfect competition,
and (b) increasing returns to scale characterize the production structure in the Indian
economy. Thus, the study revealed different possibilities of welfare and other
macroeconomic implications, which will help policymakers to assess the actual
situation so that a proper domestic policy can be formulated as this agreement gradually
takes effect.
Page | 10
Literature review
The negotiations between India and the ASEAN representatives during the past few years
have created considerable interest among researchers across the world. Pal and Dasgupta
(2009) studied the tariff schedule of India and made a preliminary evaluation of the India-
ASEAN FTA. By analysing India’s commitment schedule, and by studying the
production structure of the ASEAN members, the present study concluded that sectors
such as tea, spices, coffee and rubber will be negatively affected. The marine products,
textiles and garments, and auto components industries are also likely to face increased
competition. The study points out that the net effect of the trade agreement crucially
depends on the ability of the Government of India to redistribute some of the increased
wealth gained from this trade agreement to those industries negativelyc affected by the
agreement. Pal and Dasgupta (2008) concluded that, on the basis of a similar study, India
was unlikely to benefit in the short term from the India-ASEAN FTA. They pointed out
that ASEAN was not a natural trading partner of India, and, unlike China, has not
established close relations with the region. However, the agreement may make strategic
sense in the long term, if India looks at the option of becoming a hub for services exports
to the ASEAN region.
Harilal (2010) made a similar study that assessed the likely impact of the India-
ASEAN agreement on the economy of Kerala in southern India. In fact, southern India,
particularly Kerala, and South-East Asia have many features in common. This is
especially true in the case of the agricultural and allied sectors and the agro-based
industries. The agro-climatic conditions and cropping patterns are almost the same in the
two regions. On the basis of India’s tariff schedule and the provision for rules of origin
(RoO) under AIFTA, the study concluded that AIFTA would be detrimental to the
interests of tropical commodity producers in Kerala. This is due to the
competitive nature of the production structure of Kerala vis-à-vis the ASEAN members.
Free trade in tropical commodities under the provision of AIFTA is likely to add to the
already existing problem of severe price instability with regard to these products, in
addition to pushing down the share of the producers in the value chain.
Page | 11
Lee and Liew (2007) also attempted to measure the impact of the then proposed India-
ASEAN Free Trade Area (FTA). They used the Augmented Dickey-Fuller (ADF), and
the Phillips and Perron (PP) test results to indicate that India and ASEAN were relatively
integrated with regard to goods and services markets; however, they found that the
Purchasing Power Parity (PPP) evidence to be comparatively weaker. Financial market
integration, however, was found to be significantly incomplete. The main implication of
this finding is that the impact of liberalization will be great on financial markets. Due to
the weak PPP evidence, the goods and services markets will also experience a substantial
impact from liberalization. Therefore it was suggested that the two regions could further
exploit their FTA partnership in their complementary areas, particularly in both the goods
and services markets, and financial markets.
Sen, Asher and Rajan (2004) studied the then status and future prospects of India-
ASEAN economic relations, and suggested that significant potential existed for greater
economic cooperation between the two sides. However, their study was not based on any
theoretical modelbuilding exercise. Karmakar (2005) analysed the opportunities in
services trade that might arise out of Indian-ASEAN economic cooperation, and assessed
the net gains that could arise from liberalization of the service sector. They analysed the
economic scenario in the Asia-Pacific region and took a macro overview of the trade
creation potential of an agreement on trade in services between India and the members of
ASEAN. They suggested that, at least in the medium term, much could be gained from a
bilateral engagement between India and ASEAN in services, especially as the latter
region remains relatively closed to foreign service providers. However, their study was
also not based on any theoretical model. Although some studies attempted to
study the possible impact of the India-ASEAN FTA, few were based on theoretical
modelbuilding. Some of the more recent studies that have used models to analyse the
likely impact of India-ASEAN FTA are discussed below.
Kawai and Wignaraja (2007) used a CGE model to examine the economic impact
of forming various types of FTAs in East Asia among such groups as ASEAN+1
(ASEAN+China, ASEAN+Japan, ASEAN+Republic of Korea, ASEAN+India and
ASEAN+CER) mainly in the form of free trade agreements (FTAs) or comprehensive
economic partnership agreements, ASEAN+3 (ASEAN, China, Japan and the Republic
Page | 12
of Korea), ASEAN+6 (ASEAN+3, Australia, New Zealand and India). They concluded
that of the plausible regional trade arrangements, consolidation at the ASEAN+6 level
would yield the largest gains for East Asia. For such a consolidation to occur, ASEAN
must act as the regional “hub” by further broadening and strengthening ASEAN
economic integration, while the plus-three countries (China, Japan and the Republic of
Korea) need to collaborate more closely, and India needs to pursue further structural
reforms. Thus, Kawai and Wignaraja (2007) looked at the impact of multilateral trading
agreements to which India and the ASEAN members are parties, rather than bilateral
trading agreement between India and ASEAN region.
Similarly, using a gravity model and a CGE model, Sasatra and Prasopchoke
(2007) examined the trade potential and the economic impact of bilateral free trade
agreements between the ASEAN-5 member countries (Indonesia, Malaysia, the
Philippines, Singapore and Thailand) and the seven-candidate FTA partners (Australia,
India, Japan, New Zealand, the Republic of Korea and the United States). Their study
suggested that the strategic FTA partners of ASEAN-5 to be the ASEAN+3, ASEAN-
China, ASEAN-United States, ASEAN-Japan and ASEAN-India FTAs. Sasatra and
Prasopchoke (2007) also showed that ASEAN-5 would gain greater benefits from the
FTAs if they fully liberalized trade among themselves. This would be due in part to less
trade diversion, better resource allocation and terms-of-trade effect improvement. The
results clearly indicated the potential for gains from intraregional free trade and pointed
towards the importance of ASEAN regional cooperation.
Veeramani and Saini (2010) carried out a quantitative assessment of the impact of
AIFTA on selected plantation commodities, i.e., coffee, tea and pepper, in India. A partial
equilibriummodelling approach (SMART and gravity models) was used to simulate the
likely increase in
imports of the plantation commodities by India under the proposed tariff reduction
schedules of the India-ASEAN FTA. The results suggested that AIFTA would lead to a
significant increase in such imports by India, driven mainly by trade creation rather than
trade diversion. The analysis showed that the proposed tariff reductions under the India-
ASEAN trade agreement might lead to a significant loss of tariff revenue for the
Government of India. However, the gain in consumer surplus (due to falls in domestic
Page | 13
prices and the consequent reduction in dead-weight loss) would outweigh the tariff
revenue loss, leading to a net welfare gain. However, Veeramani and Saini (2010) only
discussed and analysed the likely impact and welfare implications of the India-ASEAN
FTA for India for some selected plantation commodities only, using a partial equilibrium
model to do so.
Ahmed (2010) investigated the sectoral dimensions of the India-ASEAN FTA as
a result of tariff liberalization. Using GTAP and SMART models, the study showed that
both India and ASEAN would gain in terms of welfare while the terms of trade for India
would deteriorate. The study revealed that, in the case of India, the processed food
products, grain crops, textiles and wearing apparel, light manufacturing goods and heavy
manufacturing sectors were likely to be significantly affected. ASEAN’s exports of
processed food items, and agricultural and fisheries products were likely to increase,
which could have an adverse impact on employment and wages among the Indian
working class. Ahmed also found that the present FTA would adversely affect
India’s trade balance and cause revenue losses for the Government. To understand the
impact on unskilled workers, the study considered sticky wages and allowing factors of
production to adjust accordingly. The study analysed the impact of the FTA with
complete tariff elimination with regard to bilateral trade between India and ASEAN.
It is important to note that none of the above studies take into account the final
tariff schedule as agreed by India and ASEAN members. Also, no analysis has been made
of the overall impact on India as well as ASEAN members under the phased
liberalization schedule as agreed in the FTA. The objective of the present study therefore
was to fill this gap by using a general equilibrium methodology to help in assessing the
possible impact of this trade agreement on the India economy as well as on ASEAN
members. The literature survey is summarized in table 1 in the annex.
Page | 14
Background:
The ASEAN–India Free Trade Area emerged from a mutual interest of both parties to
expand their economic ties in the Asia-Pacific region. India's Look East policy was
reciprocated by similar interests of many ASEAN countries to expand their interactions
westward.
After India became a sectoral dialogue partner of ASEAN in 1992, India saw its trade
with ASEAN increase relative to its trade with the rest of the world. Between 1993 and
2003, ASEAN-India bilateral trade grew at an annual rate of 11.2%, from US$ 2.9 billion
in 1993 to US$ 12.1 billion in 2003. Much of India's trade with ASEAN is directed
towards Singapore, Malaysia, and Thailand, with whom India holds strong economic
relations.
In 2008, the total volume of ASEAN-India trade was US$ 47.5 billion. ASEAN’s export
to India was US$ 30.1 billion – a growth of 21.1 per cent in comparison with that of
2007. ASEAN’s imports from India were US$ 17.4 billion – a growth of 40.2 per cent in
comparison to that of 2006. As for foreign direct investment (FDI), the inflow from India
to ASEAN Member States was US$476.8 million in 2008, accounting for 0.8 per cent of
total FDI in the region. Total Indian FDI into ASEAN from 2000 to 2008 was US$ 1.3
billion.
Acknowledging this trend and recognising the economic potential of closer linkages, both
sides recognised the opportunities for deepening trade and investment ties, and agreed to
negotiate a framework agreement to pave the way for the establishment of an ASEAN–
India Free Trade Area (FTA).
Page | 15
HISTROY :
At the Second ASEAN-India Summit in 2003, the ASEAN-India Framework Agreement
on Comprehensive Economic Cooperation was signed by the Leaders of ASEAN and
India. The Framework Agreement laid a sound basis for the eventual establishment of an
ASEAN-India Regional Trade and Investment Area (RTIA), which includes FTA in
goods, services, and investment.
ASEAN and India signed the ASEAN-India Trade in Goods (TIG) Agreement in
Bangkok on 13 August 2009, after six years of negotiations. The ASEAN-India TIG
Agreement entered into force on 1 January 2010. The 7th ASEAN-India Summit in Cha-
am HuaHin, Thailand on 24 October 2009 agreed to revise the bilateral trade target to 70
billion USD to be achieved in the next two years, noting that the initial target of USD 50
billion set in 2007 may soon be surpassed.
ASEAN-India trade grew at over 22 percent annually during the 2005-2011 period. Trade
between India and ASEAN in 2011-2012 increased by more than 37 percent to $79
billion, which was more than the target of $70 billion set in 2009.
At the 10th ASEAN-India Summit in New Delhi on December 20, 2012, India and
ASEAN concluded negotiations for FTAs in services and investments. The two sides
expect bilateral trade to increase to $100 billion by 2015, and $200 billion within a
decade.
ASEAN and India are also working on enhancing private sector engagement. Details on
the re-activation of the ASEAN-India Business Council (AIBC), the holding of the
ASEAN-India Business Summit (AIBS) and an ASEAN-India Business Fair (AIBF), are
being worked out by officials. On 27 April 2010, India informed the ASEAN Secretariat
that the Federation of Indian Chambers of Commerce and Industry (FICCI) would be
organising the ASEAN Trade and Industrial Exhibition at the PragatiMaidan in New
Delhi on 8–11 January 2011, at the sidelines of the AIBF.
The Fourteenth ASEAN Transport Ministers (ATM) Meeting on 6 November 2008 in
Makati, Metro Manila, Philippines adopted the ASEAN-India Aviation Cooperation
Framework, which will lay the foundation for closer aviation cooperation between
Page | 16
ASEAN and India. The ASEAN-India Air Transport Agreement (AI-ATA) is being
negotiated with the implementation timeline of 2011.
In tourism, the number of visitor arrivals from ASEAN to India in 2006 was 277,000,
while the number of visitor arrivals from India to ASEAN in 2008 was 1.985 million. At
the Sixth ASEAN-India Summit held on 21 November 2007 in Singapore, India proposed
to set a target of 1 million tourist arrivals from ASEAN to India by 2010. The 2nd
Meeting of ASEAN and India Tourism Ministers (ATM+India) held on 25 January 2010
in Bandar Seri Begawan positively responded to India’s proposal to develop an ASEAN-
India Tourism Cooperation Agreement and requested the ASEAN-India Tourism
Working Group to further discuss and prepare the draft agreement. The Ministers also
supported the establishment of the ASEAN Promotional Chapter for Tourism in Mumbai
as an important collaborative platform for ASEAN National Tourism Organisations
(NTOs) to market Southeast Asia to the Indian consumers and, at the same time, create
mutual awareness between ASEAN Member States and India.
Page | 17
Methodology
The data has been collected from UN-COMTRADE Statistics Division at 1 digit SITC
(Standard International Trade Classification) Rev. 2 for the period 1980-2009.
Alternative sources of data are : IMF – Foreign Trade Statistics yearbook and ASEAN
Merchandise Trade Statistics Database. The data comprises exports and imports of India
and ASEAN (10 countries i.e. Brunei, Darussalam, Cambodia, Indonesia, Lao PDR,
Malaysia, Myanmar, The Philippines, Singapore, Thailand and Vietnam). For calculating
the share of ASEAN in the India’s Exports and Imports and India’s share in ASEAN
trade, percentage method is used. To calculate growth trends, Test of significance with
regression coefficients has been implied.
A complete analysis of trade and trade-related issues requires an analytical framework
that takes into account a holistic view of the economies across the world. This is because
not onlyareinterlinkages present between various sectors of an economy; sectors in an
economy are also linked to the rest of the world through, for example, exports and
imports of final products, intermediate goods, capital goods. Thus, linkages are present at
the national, regional and global levels both in terms of products and in the input markets.
Thus, in order to fully take into account these interlinkages, the present study used the
Global Trade Analysis Project (GTAP) as the analytical tool. The CGE modelling
framework of GTAP is one of the best possible ways of analysing, ex ante, the economic
consequences and trade implications of multilateral and bilateral trade agreements.
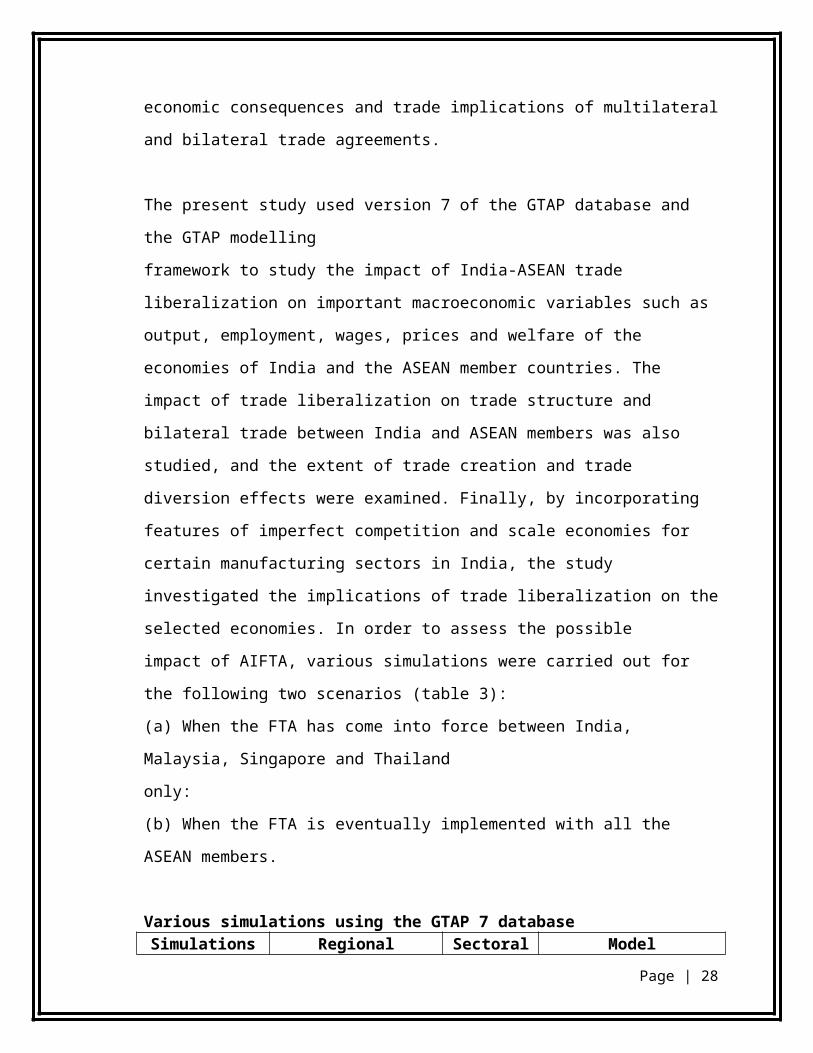
The present study used version 7 of the GTAP database and the GTAP modelling
framework to study the impact of India-ASEAN trade liberalization on important
macroeconomic variables such as output, employment, wages, prices and welfare of the
economies of India and the ASEAN member countries. The impact of trade liberalization
on trade structure and bilateral trade between India and ASEAN members was also
studied, and the extent of trade creation and trade diversion effects were examined.
Finally, by incorporating features of imperfect competition and scale economies for
certain manufacturing sectors in India, the study investigated the implications of trade
liberalization on the selected economies. In order to assess the possible
Page | 18
impact of AIFTA, various simulations were carried out for the following two scenarios
(table 3):
(a) When the FTA has come into force between India, Malaysia, Singapore and Thailand
only:
(b) When the FTA is eventually implemented with all the ASEAN members.
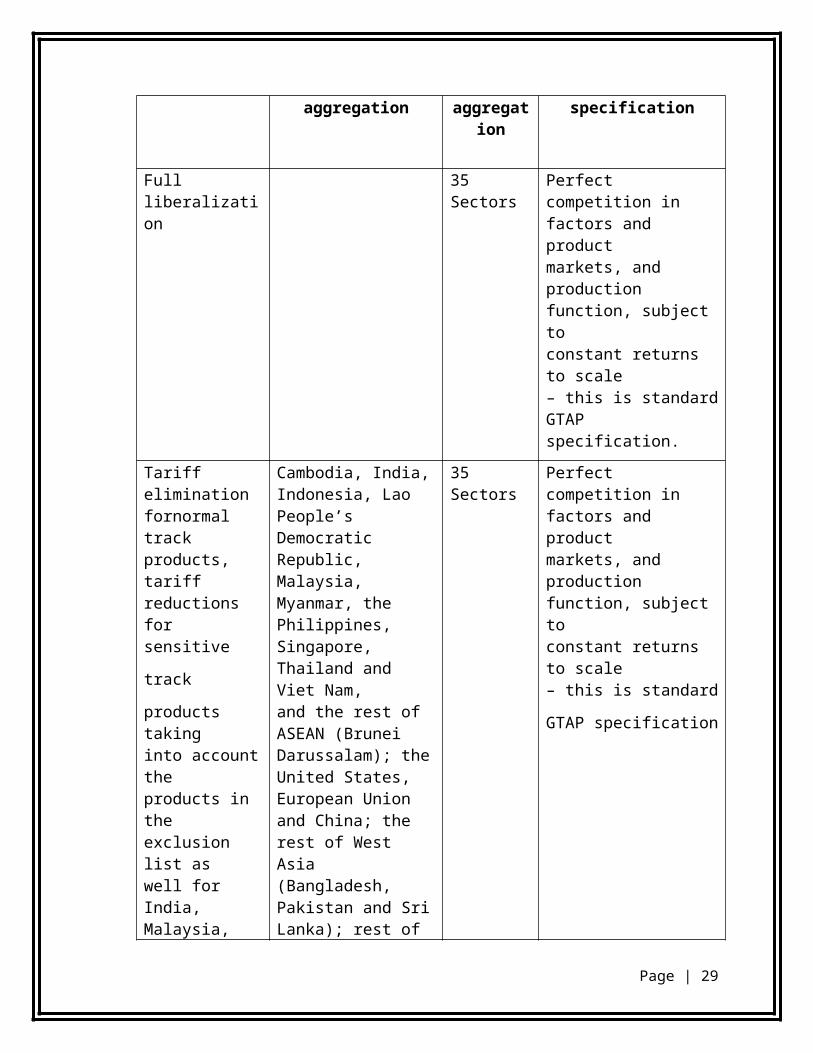
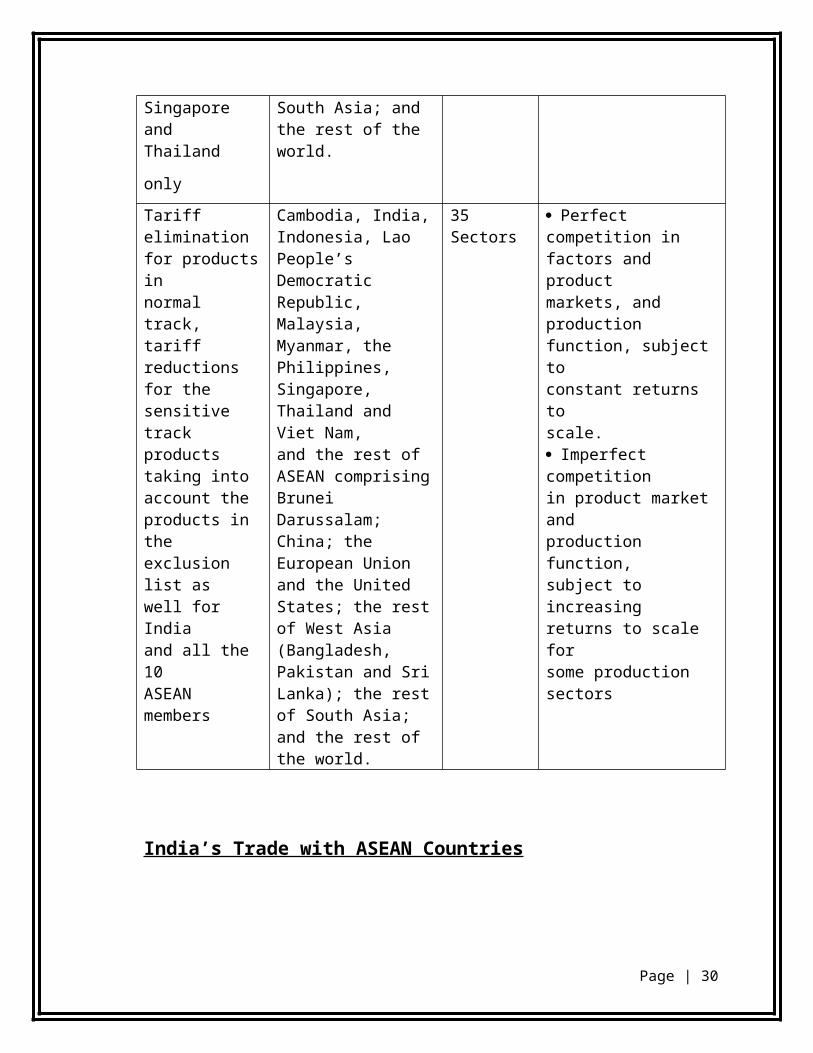
Various simulations using the GTAP 7 databaseSimulations Regional aggregation Sectoral
aggregationModel specification
Full liberalization 35Sectors
Perfect competition infactors and productmarkets, and productionfunction, subject toconstant returns to scale– this is standard GTAPspecification.
Tariff elimination fornormal trackproducts, tariffreductions forsensitive track
products takinginto account theproducts in theexclusion list aswell for India,Malaysia,Singapore andThailand only
Cambodia, India, Indonesia, Lao People’s Democratic Republic,Malaysia, Myanmar, the Philippines, Singapore, Thailand and Viet Nam,and the rest of ASEAN (Brunei Darussalam); the United States, European Union and China; the rest of West Asia (Bangladesh, Pakistan and Sri Lanka); rest of South Asia; and the rest of the world.
35Sectors
Perfect competition infactors and productmarkets, and productionfunction, subject toconstant returns to scale– this is standard GTAP
specification
Tariff elimination for products innormal track,tariff reductionsfor the sensitivetrack productstaking intoaccount theproducts in theexclusion list as
Cambodia, India, Indonesia, Lao People’s Democratic Republic,Malaysia, Myanmar, the Philippines, Singapore, Thailand and Viet Nam,and the rest of ASEAN comprising Brunei Darussalam; China; theEuropean Union and the
35Sectors
Perfect competition infactors and productmarkets, and productionfunction, subject toconstant returns toscale.Imperfect competitionin product market andproduction function,subject to increasing
Page | 19
well for Indiaand all the 10ASEAN members
United States; the rest of West Asia (Bangladesh, Pakistan and SriLanka); the rest of South Asia; and the rest of the world.
returns to scale forsome production sectors
India’s Trade with ASEAN Countries
While in 1995, Singapore followed by Indonesia were the most important markets for
India within ASEAN, Malaysia and Thailand also became more important later on. But
by 2004, Singapore’s shares in Indian exports increased much faster and following the
signing of the CECA in 2005, this increased to nearly 5% in 2008. On the other hand, the
share of India’s exports going to Thailand declined after 2002 and has hovered around
1.1% despite the coming into force of the Early Harvest Program (EHP) of the India-Thai
FTA in 2004. In 2008, a total 10% of India’s exports were absorbed by the ASEAN-5
countries (Singapore, Indonesia, Malaysia, Thailand and Vietnam).
Source: Based on UN Comtrade Database.
Page | 20
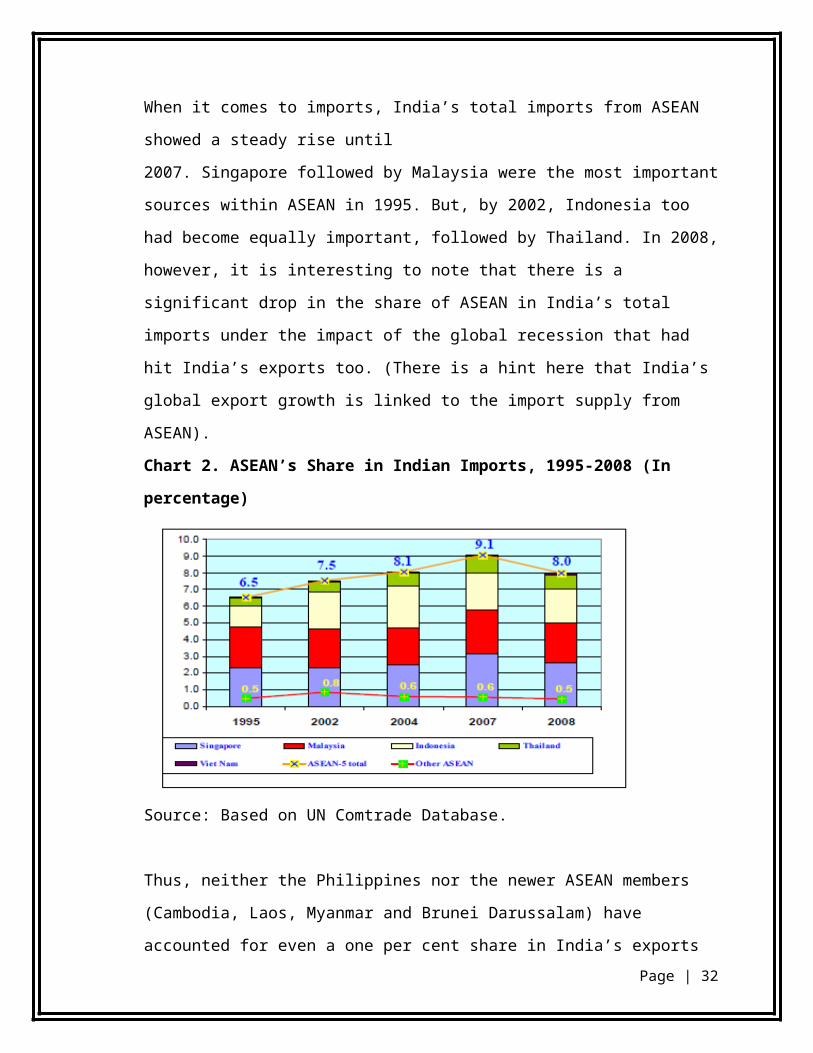
When it comes to imports, India’s total imports from ASEAN showed a steady rise until
2007. Singapore followed by Malaysia were the most important sources within ASEAN
in 1995. But, by 2002, Indonesia too had become equally important, followed by
Thailand. In 2008, however, it is interesting to note that there is a significant drop in the
share of ASEAN in India’s total imports under the impact of the global recession that had
hit India’s exports too. (There is a hint here that India’s global export growth is linked to
the import supply from ASEAN).
Chart 2. ASEAN’s Share in Indian Imports, 1995-2008 (In percentage)
Source: Based on UN Comtrade Database.
Thus, neither the Philippines nor the newer ASEAN members (Cambodia, Laos,
Myanmar and Brunei Darussalam) have accounted for even a one per cent share in
India’s exports or imports until now. Given that Vietnam’s share in India’s total trade
with ASEAN also remains very low, we focus the rest of the detailed analysis in this
paper to the four ASEAN countries namely, Singapore, Malaysia, Indonesia and
Thailand.
EXPORTS AND IMPORTS OF INDIA AND ASEAN: 1980-2009
The present section provides an overview of India’s share in ASEAN trade as well as
Page | 21
ASEAN share in India’s trade. Further, to explore the growth of trade between the two regions, growth rate of India’s trade with ASEAN on the whole and ASEAN countries has been calculated:
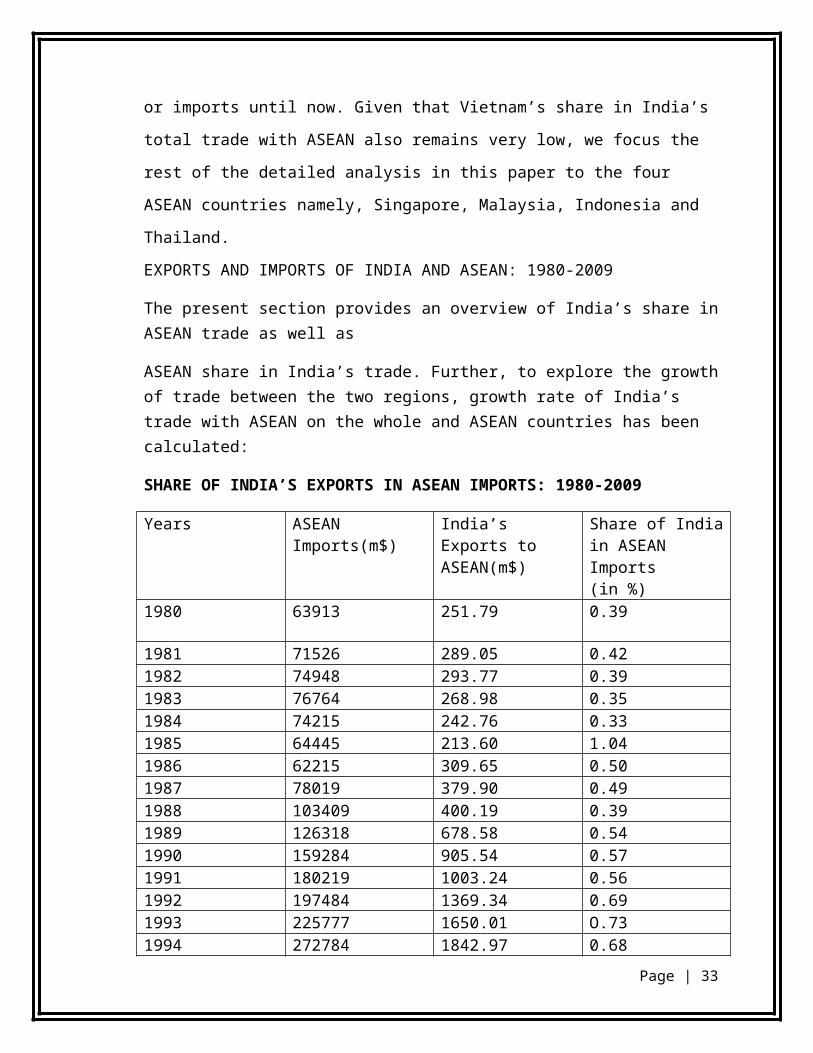
SHARE OF INDIA’S EXPORTS IN ASEAN IMPORTS: 1980-2009
Years ASEANImports(m$)
India’s Exports toASEAN(m$)
Share of India in ASEAN Imports(in %)
1980 63913 251.79 0.39
1981 71526 289.05 0.421982 74948 293.77 0.391983 76764 268.98 0.35
1984 74215 242.76 0.331985 64445 213.60 1.04
1986 62215 309.65 0.501987 78019 379.90 0.49
1988 103409 400.19 0.391989 126318 678.58 0.54
1990 159284 905.54 0.571991 180219 1003.24 0.56
1992 197484 1369.34 0.69
1993 225777 1650.01 O.731994 272784 1842.97 0.681995 341443 2697.69 0.791996 359188 2855.09 0.791997 367296 2462.37 0.671998 273919 1623.84 0.591999 294621 2227.00 0.762000 365350 2660.83 0.732001 338664 3315.11 0.982002 355047 4503.30 1.272003 397928 5071.80 1.272004 501222 7552.22 1.512005 576451 10285.77 1.782006 660131 12369.34 1.872007 748251 13824.08 1.852008 929387 19433.27 2.092009 715782 17898.83 2.50
Source: Author's calculation using UNCOMTRADE database, United Nations Statistical
Page | 22
Division
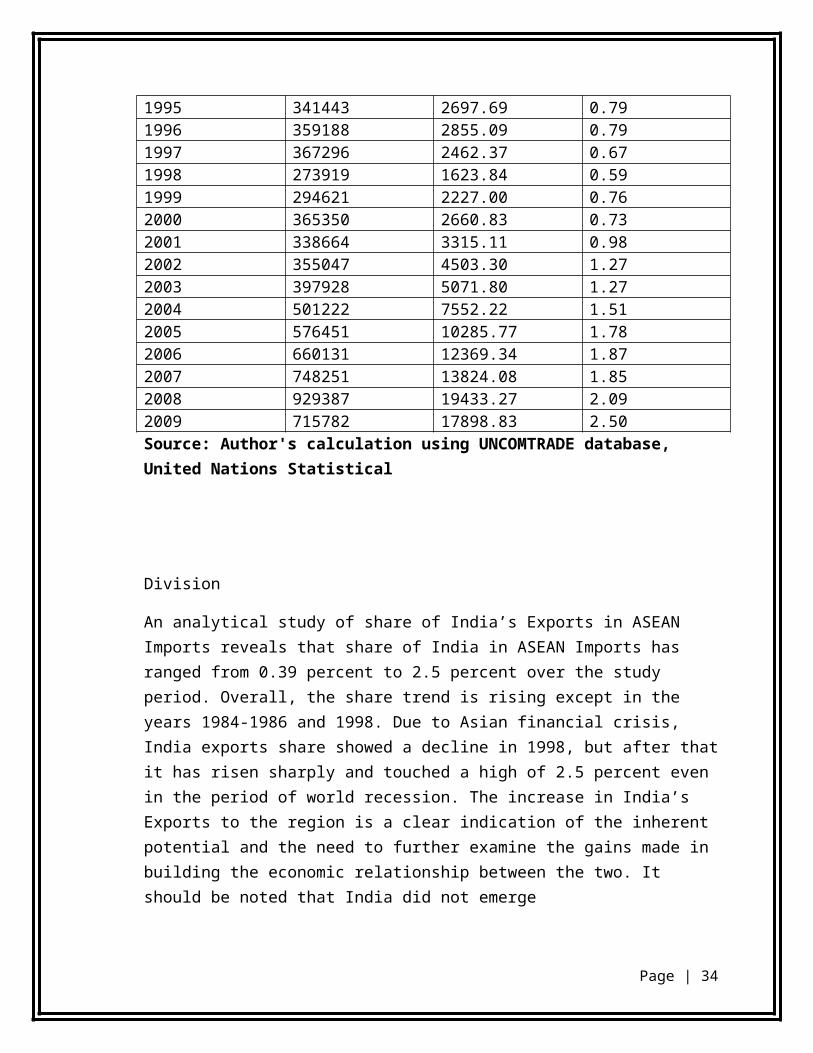
An analytical study of share of India’s Exports in ASEAN Imports reveals that share of India in ASEAN Imports has ranged from 0.39 percent to 2.5 percent over the study period. Overall, the share trend is rising except in the years 1984-1986 and 1998. Due to Asian financial crisis, India exports share showed a decline in 1998, but after that it has risen sharply and touched a high of 2.5 percent even in the period of world recession. The increase in India’s Exports to the region is a clear indication of the inherent potential and the need to further examine the gains made in building the economic relationship between the two. It should be noted that India did not emerge
on the global landscape until it began to seriously engage with ASEAN and the other East Asian countries, for which the India-ASEAN summits provided a most useful opportunity. India-ASEAN engagements at the summit level and all the subsequent developments have helped India to become a credible interlocutor with the major powers of the world.
Page | 23
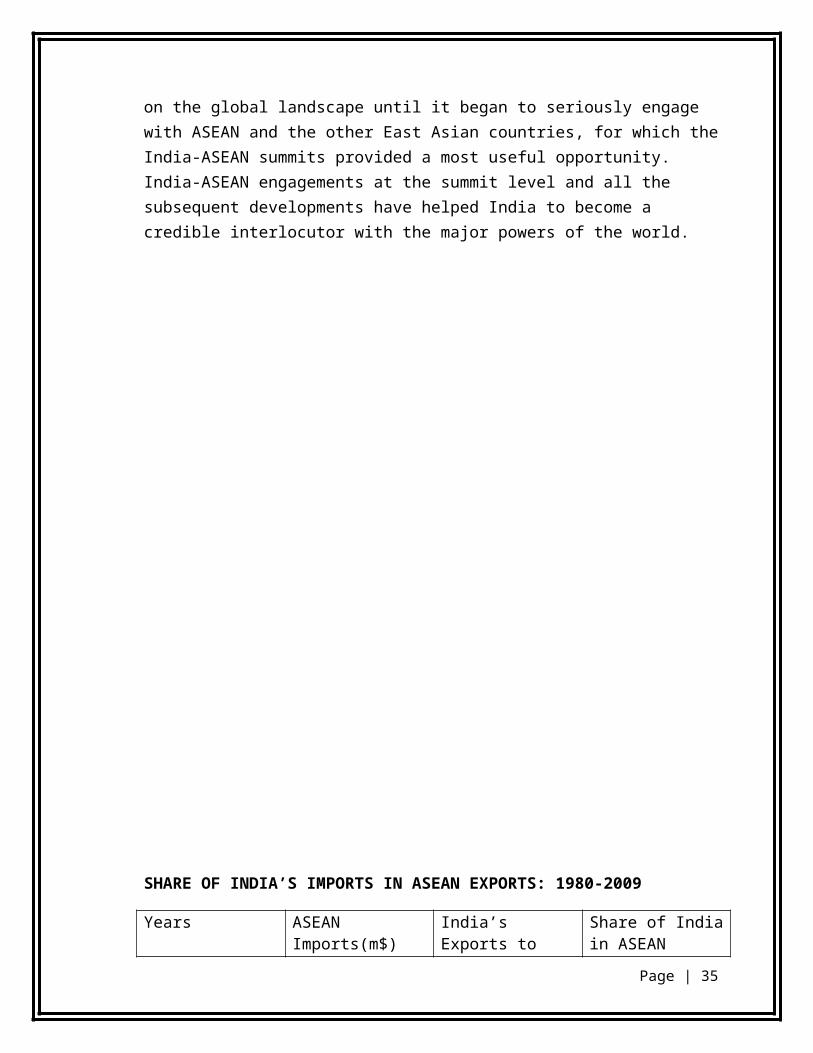
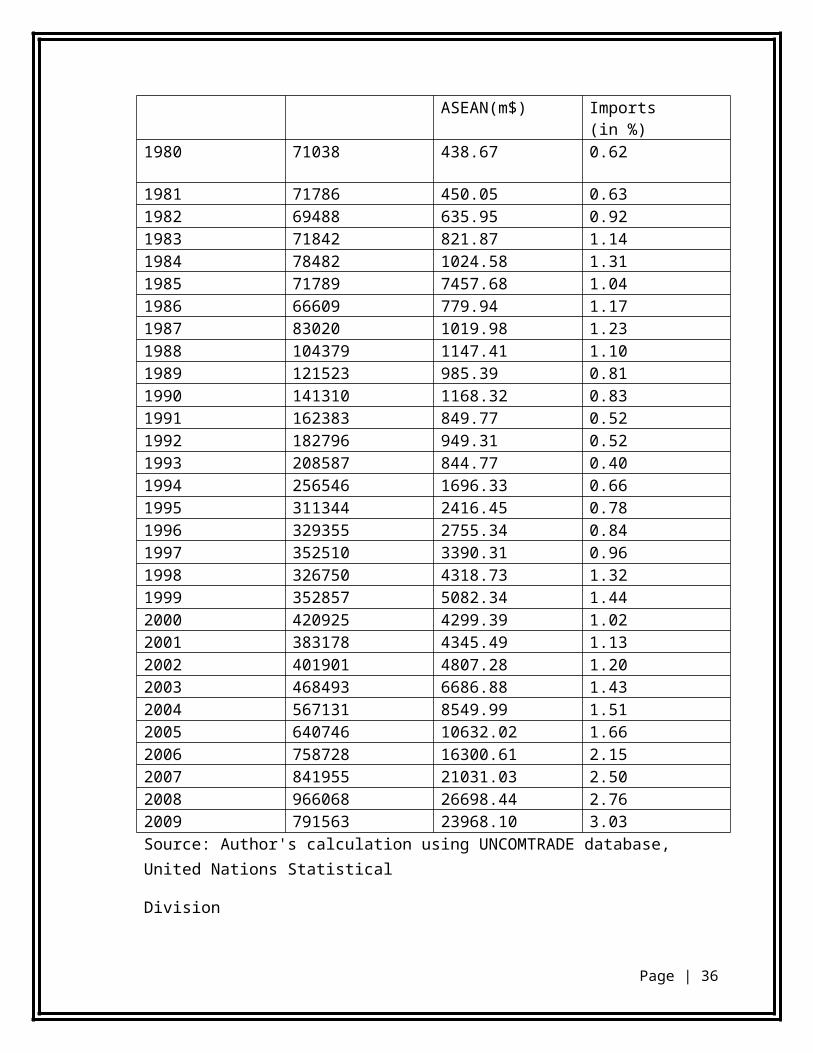
SHARE OF INDIA’S IMPORTS IN ASEAN EXPORTS: 1980-2009
Years ASEANImports(m$)
India’s Exports toASEAN(m$)
Share of India in ASEAN Imports(in %)
1980 71038 438.67 0.62
1981 71786 450.05 0.631982 69488 635.95 0.921983 71842 821.87 1.14
1984 78482 1024.58 1.311985 71789 7457.68 1.04
1986 66609 779.94 1.171987 83020 1019.98 1.23
1988 104379 1147.41 1.101989 121523 985.39 0.81
1990 141310 1168.32 0.831991 162383 849.77 0.52
1992 182796 949.31 0.52
1993 208587 844.77 0.401994 256546 1696.33 0.661995 311344 2416.45 0.781996 329355 2755.34 0.841997 352510 3390.31 0.961998 326750 4318.73 1.321999 352857 5082.34 1.442000 420925 4299.39 1.022001 383178 4345.49 1.132002 401901 4807.28 1.202003 468493 6686.88 1.432004 567131 8549.99 1.512005 640746 10632.02 1.662006 758728 16300.61 2.152007 841955 21031.03 2.502008 966068 26698.44 2.762009 791563 23968.10 3.03
Source: Author's calculation using UNCOMTRADE database, United Nations Statistical
Page | 24
Division
Table II presents merchandise Imports of India from ASEAN and its relative share in ASEAN’s Exports. It is observed from the table that India’s share in ASEAN Exports is showing significantly a rising trend and it is also important to note that in 1997, exports share has shown a decline but imports share does not affected by it. Imports share of India is rapidly rising after 1994 and it ranges from 0.69 percent to 3.03 percent during the study period. As ASEAN’s economic significance has been representing an impressive increase, similarly India’s sustained economic
growth has attracted ASEAN to foster economic ties with it. India’s natural environment, nature of industries, expertise, demands and supply conditions have made positive environment for ASEAN.
Therefore, India’s merchandise Imports have shown rising trend.
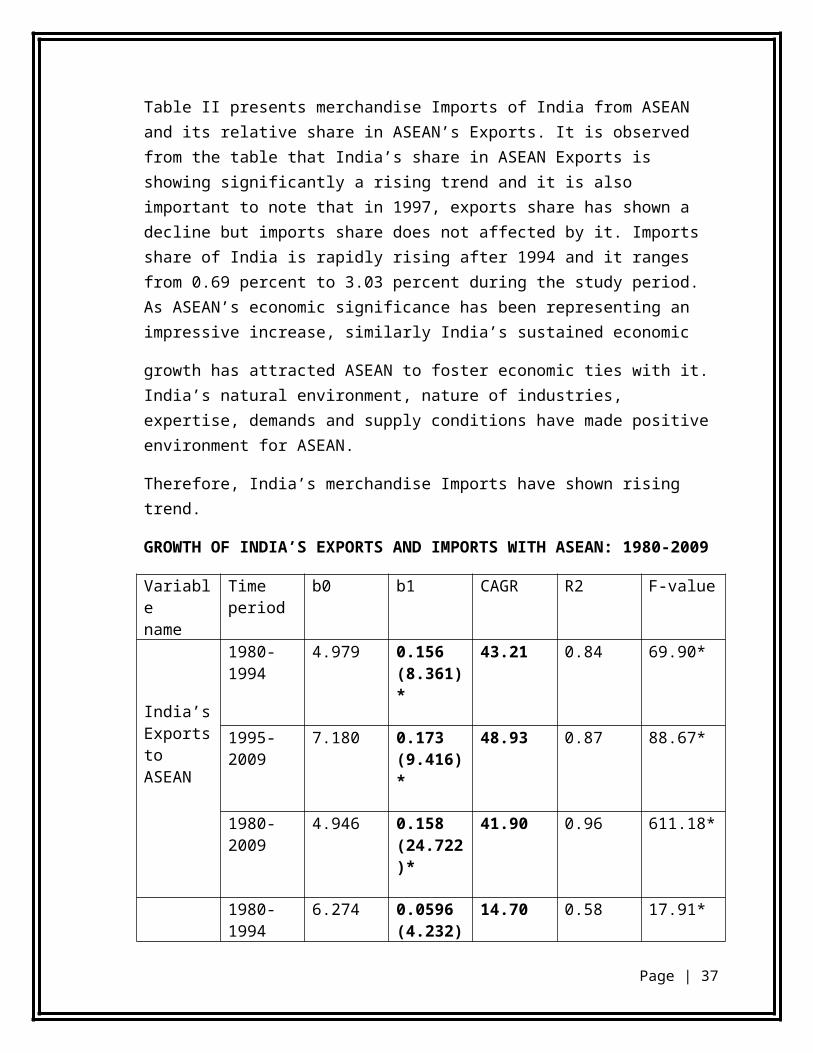
GROWTH OF INDIA’S EXPORTS AND IMPORTS WITH ASEAN: 1980-2009
Variablename
Time period
b0 b1 CAGR R2 F-value
India’sExports toASEAN
1980-1994 4.979 0.156(8.361)*
43.21 0.84 69.90*
1995-2009 7.180 0.173(9.416)*
48.93 0.87 88.67*
1980-2009 4.946 0.158(24.722)*
41.90 0.96 611.18*
India’sImports fromASEAN
1980-1994 6.274 0.0596(4.232)*
14.70 0.58 17.91*
1995-2009 7.493 0.172(13.023)*
48.59 0.93 169.59*
1980-2009 5.606 0.146(13.754)*
39.95 0.87 189.17*
t* - significant at 5% level of significance
F*- significant at 5% level of significance
Source: Author's calculation using UNCOMTRADE database, United Nations Statistical
Page | 25
Division
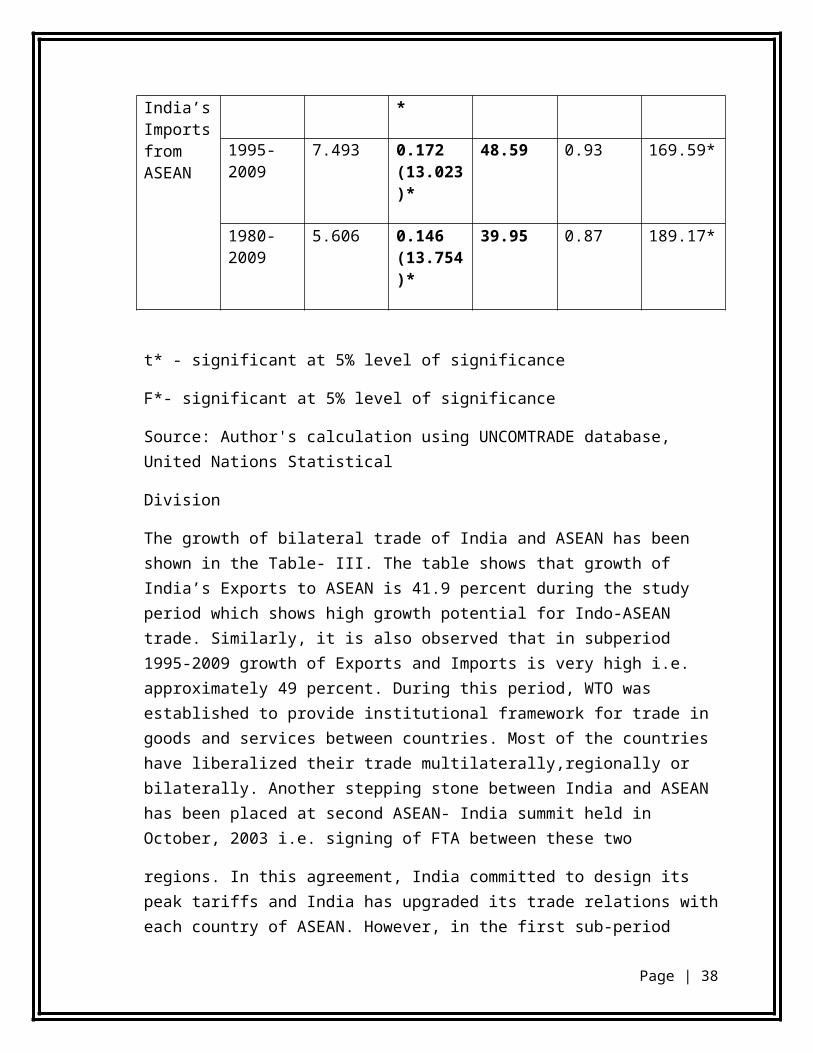
The growth of bilateral trade of India and ASEAN has been shown in the Table- III. The table shows that growth of India’s Exports to ASEAN is 41.9 percent during the study period which shows high growth potential for Indo-ASEAN trade. Similarly, it is also observed that in subperiod 1995-2009 growth of Exports and Imports is very high i.e. approximately 49 percent. During this period, WTO was established to provide institutional framework for trade in goods and services between countries. Most of the countries have liberalized their trade multilaterally,regionally or bilaterally. Another stepping stone between India and ASEAN has been placed at second ASEAN- India summit held in October, 2003 i.e. signing of FTA between these two
regions. In this agreement, India committed to design its peak tariffs and India has upgraded its trade relations with each country of ASEAN. However, in the first sub-period (1980-1994) growth of India Imports from ASEAN is comparatively very low (14.7 percent) than growth of India’s Exports (43.2 percent) to ASEAN. The values including t-statistics, ANOVA (F-value) and coefficient of determination (R2) for India’s Exports and Imports confirm that the growth rate is statistically significant. On the whole, Exports growth is higher than Imports growth over the period.
After analyzing India’s share and growth with ASEAN trade, it is essential to examine ASEAN share in total Exports and Imports of India. The table depicts the ASEAN share in India’s total Exports and Imports for the period 1980-2009:
Page | 26
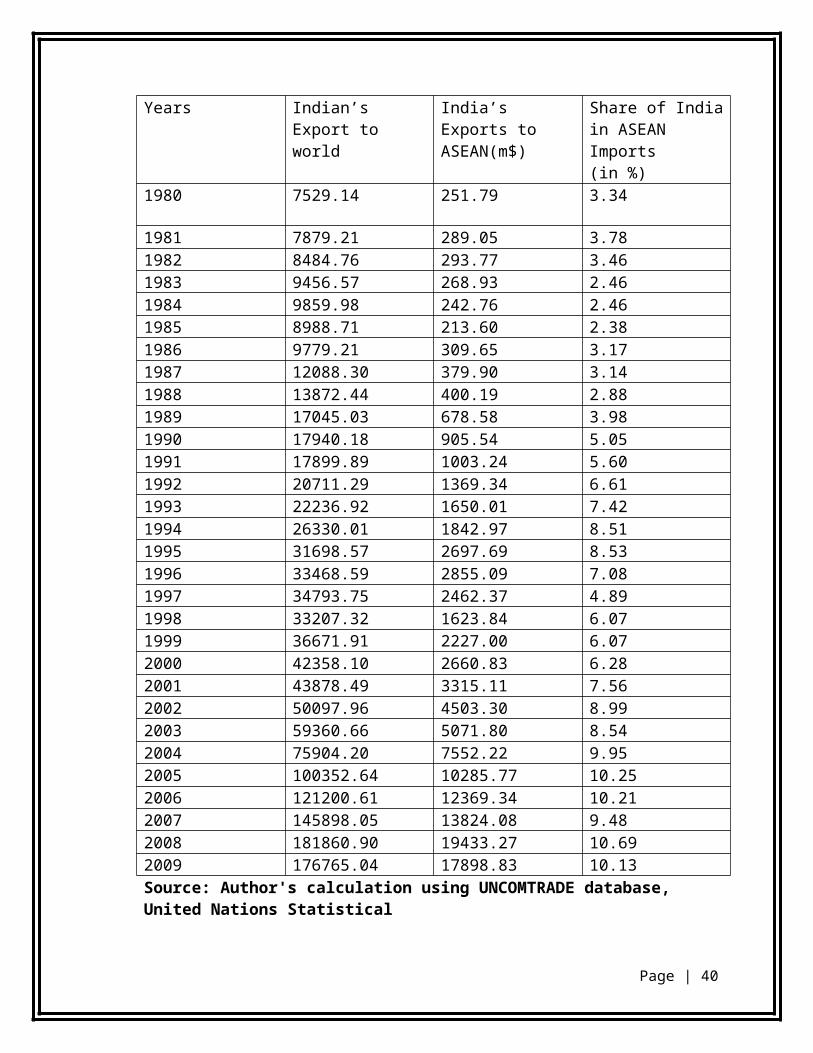
The table IV SHARE OF ASEAN IN INDIA’S TOTAL EXPORTS: 1980-2009
Years Indian’s Export to world
India’s Exports toASEAN(m$)
Share of India in ASEAN Imports(in %)
1980 7529.14 251.79 3.34
1981 7879.21 289.05 3.781982 8484.76 293.77 3.461983 9456.57 268.93 2.46
1984 9859.98 242.76 2.461985 8988.71 213.60 2.38
1986 9779.21 309.65 3.171987 12088.30 379.90 3.14
1988 13872.44 400.19 2.881989 17045.03 678.58 3.98
1990 17940.18 905.54 5.051991 17899.89 1003.24 5.60
1992 20711.29 1369.34 6.61
1993 22236.92 1650.01 7.421994 26330.01 1842.97 8.511995 31698.57 2697.69 8.531996 33468.59 2855.09 7.081997 34793.75 2462.37 4.891998 33207.32 1623.84 6.071999 36671.91 2227.00 6.072000 42358.10 2660.83 6.282001 43878.49 3315.11 7.562002 50097.96 4503.30 8.992003 59360.66 5071.80 8.542004 75904.20 7552.22 9.952005 100352.64 10285.77 10.252006 121200.61 12369.34 10.212007 145898.05 13824.08 9.482008 181860.90 19433.27 10.692009 176765.04 17898.83 10.13
Source: Author's calculation using UNCOMTRADE database, United Nations Statistical
Page | 27
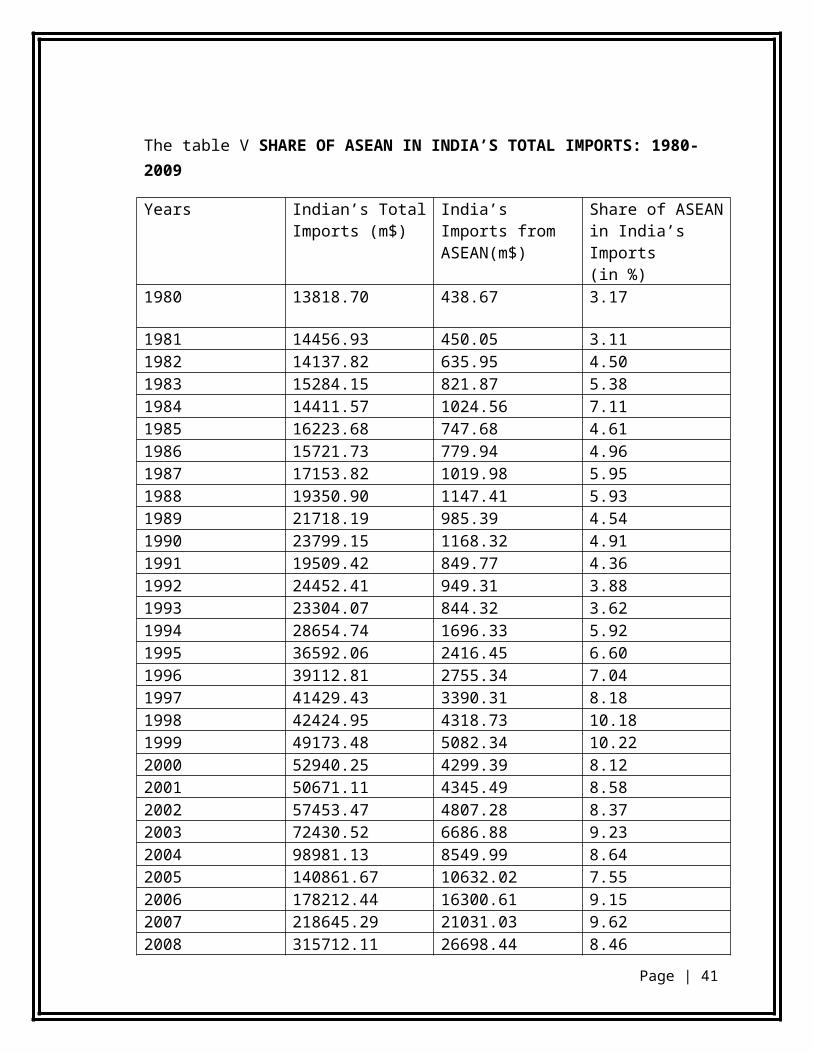
The table V SHARE OF ASEAN IN INDIA’S TOTAL IMPORTS: 1980-2009
Years Indian’s Total Imports (m$)
India’s Imports from ASEAN(m$)
Share of ASEAN in India’s Imports(in %)
1980 13818.70 438.67 3.17
1981 14456.93 450.05 3.111982 14137.82 635.95 4.501983 15284.15 821.87 5.38
1984 14411.57 1024.56 7.111985 16223.68 747.68 4.61
1986 15721.73 779.94 4.961987 17153.82 1019.98 5.95
1988 19350.90 1147.41 5.931989 21718.19 985.39 4.54
1990 23799.15 1168.32 4.911991 19509.42 849.77 4.36
1992 24452.41 949.31 3.88
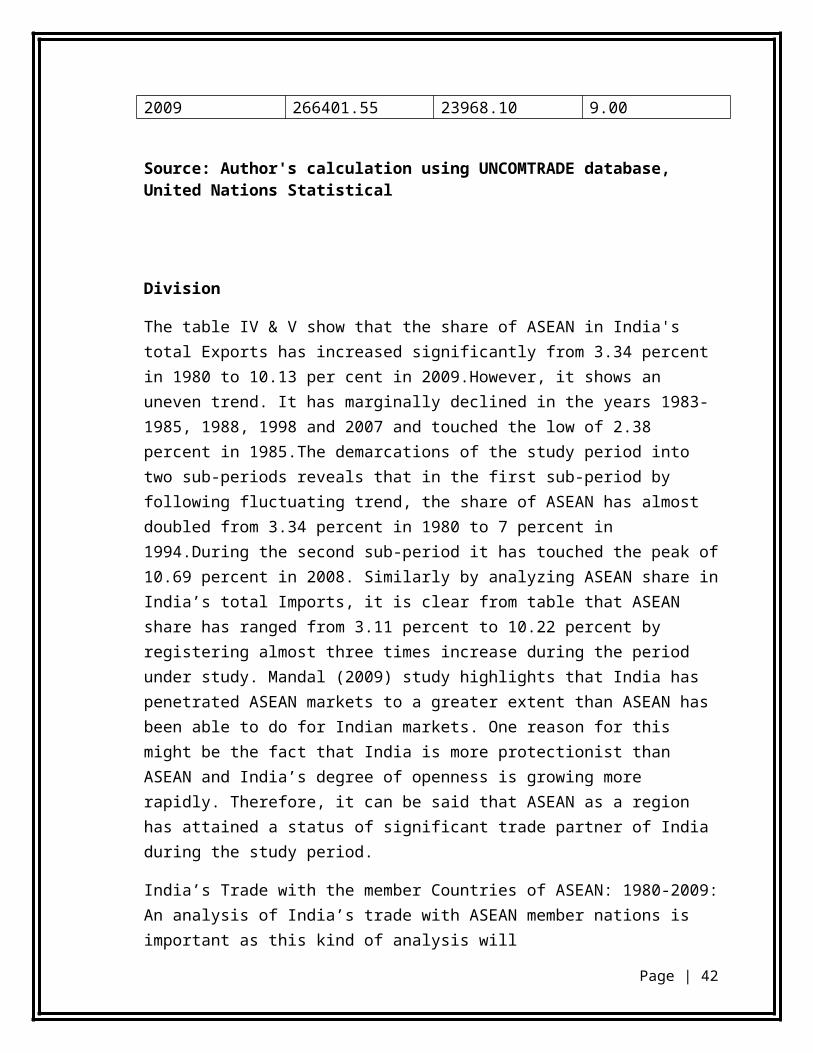
1993 23304.07 844.32 3.621994 28654.74 1696.33 5.921995 36592.06 2416.45 6.601996 39112.81 2755.34 7.041997 41429.43 3390.31 8.181998 42424.95 4318.73 10.181999 49173.48 5082.34 10.222000 52940.25 4299.39 8.122001 50671.11 4345.49 8.582002 57453.47 4807.28 8.372003 72430.52 6686.88 9.232004 98981.13 8549.99 8.642005 140861.67 10632.02 7.552006 178212.44 16300.61 9.152007 218645.29 21031.03 9.622008 315712.11 26698.44 8.462009 266401.55 23968.10 9.00
Source: Author's calculation using UNCOMTRADE database, United Nations Statistical
Page | 28
Division
The table IV & V show that the share of ASEAN in India's total Exports has increased significantly from 3.34 percent in 1980 to 10.13 per cent in 2009.However, it shows an uneven trend. It has marginally declined in the years 1983-1985, 1988, 1998 and 2007 and touched the low of 2.38 percent in 1985.The demarcations of the study period into two sub-periods reveals that in the first sub-period by following fluctuating trend, the share of ASEAN has almost doubled from 3.34 percent in 1980 to 7 percent in 1994.During the second sub-period it has touched the peak of 10.69 percent in 2008. Similarly by analyzing ASEAN share in India’s total Imports, it is clear from table that ASEAN share has ranged from 3.11 percent to 10.22 percent by registering almost three times increase during the period under study. Mandal (2009) study highlights that India has penetrated ASEAN markets to a greater extent than ASEAN has been able to do for Indian markets. One reason for this might be the fact that India is more protectionist than ASEAN and India’s degree of openness is growing more rapidly. Therefore, it can be said that ASEAN as a region has attained a status of significant trade partner of India during the study period.
India’s Trade with the member Countries of ASEAN: 1980-2009: An analysis of India’s trade with ASEAN member nations is important as this kind of analysis will
enable us to understand the relative significance of member countries of ASEAN in India’s trade and explore the possibilities of future growth. Therefore, in the present section, share and growth of India’s trade with ASEAN member countries has been analyzed individually. In 1967, ASEAN was established by the five original Member Countries, namely, Indonesia, Malaysia, Philippines, Singapore, and Thailand. Brunei Darussalam joined on 8 January 1984, Vietnam on 28 July 1995, Lao PDR and Myanmar on 23 July 1997, and Cambodia on 30 April 1999. As the present study
has been confined from 1980 to 2009 period, so trade of each country of ASEAN has been analyzed when it had joined ASEAN. To explore growth of Indo-ASEAN trade, initially six countries trade has been taken into consideration. After the joining of Vietnam in 1995, ASEAN -7 and in 1997, ASEAN has become ASEAN 9 and now ASEAN has ten member nations. Therefore, from 1999, India’s trade with ASEAN-10 has been analyzed. The following table analyzes the share of every country in India exports and import
Page | 29
Source: Author's calculation using UNCOMTRADE database, United Nations Statistical
Page | 30
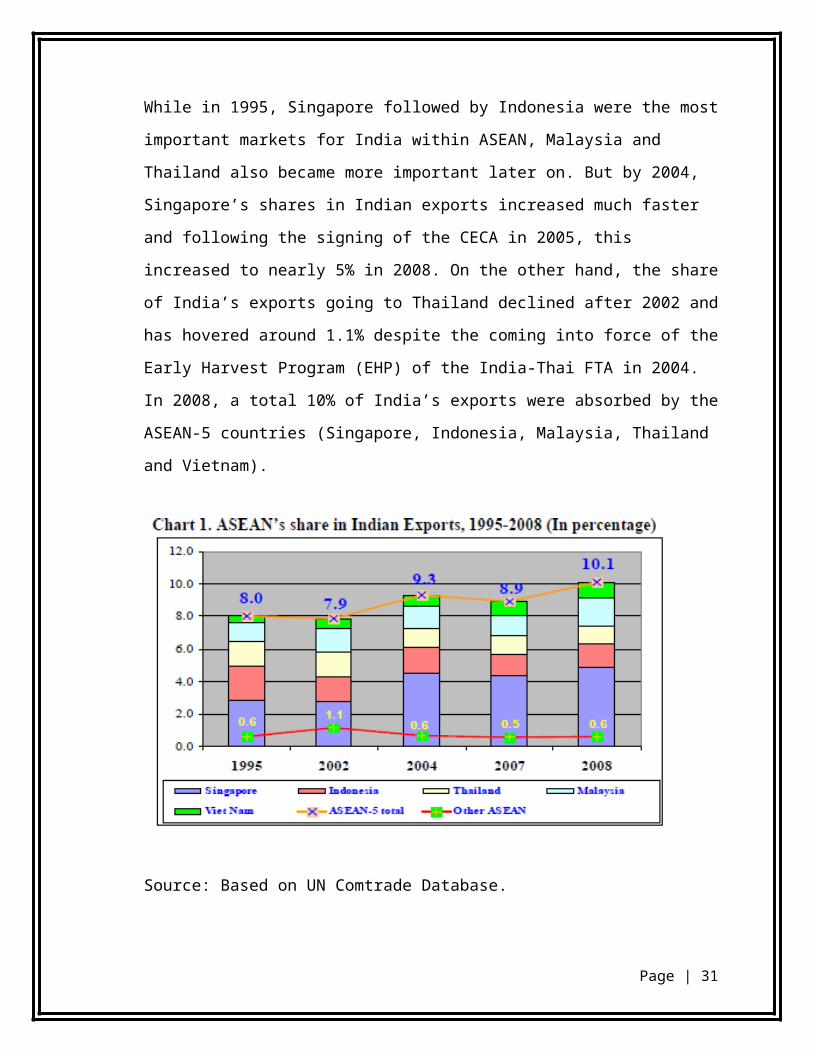
Table VI outlines the share of individual member countries of ASEAN in India’s Exports to ASEAN for the period under study. It is clear that since 1980, India’s major Export destinations have been Singapore, Malaysia, Indonesia and Thailand. In 1980, the share of these four countries in total Exports of India to ASEAN was 97.07 percent registered a significant decline and become 84.18 percent in 2009. However, there have been many fluctuations in the intermittent years with.
Singapore’s share has significantly increased to 55 percent from 1985 -1988 and has registered double decline and settled at 27.93 percent in 2001. After that the share of Singapore has continuously shown rising trend except 2009 due to global economic meltdown. This structural change in the pattern of Singapore’s total trade since 2001 could well be attributed to its open and liberal attitude during the post- 2001 period. This change in attitude is clearly evident from the fact that all its trade agreements have entered into force only after 2001. Thus, Singapore is the largest market for Indian Exports within ASEAN. Presently, Singapore absorbs almost half of India’s total
Exports to ASEAN.
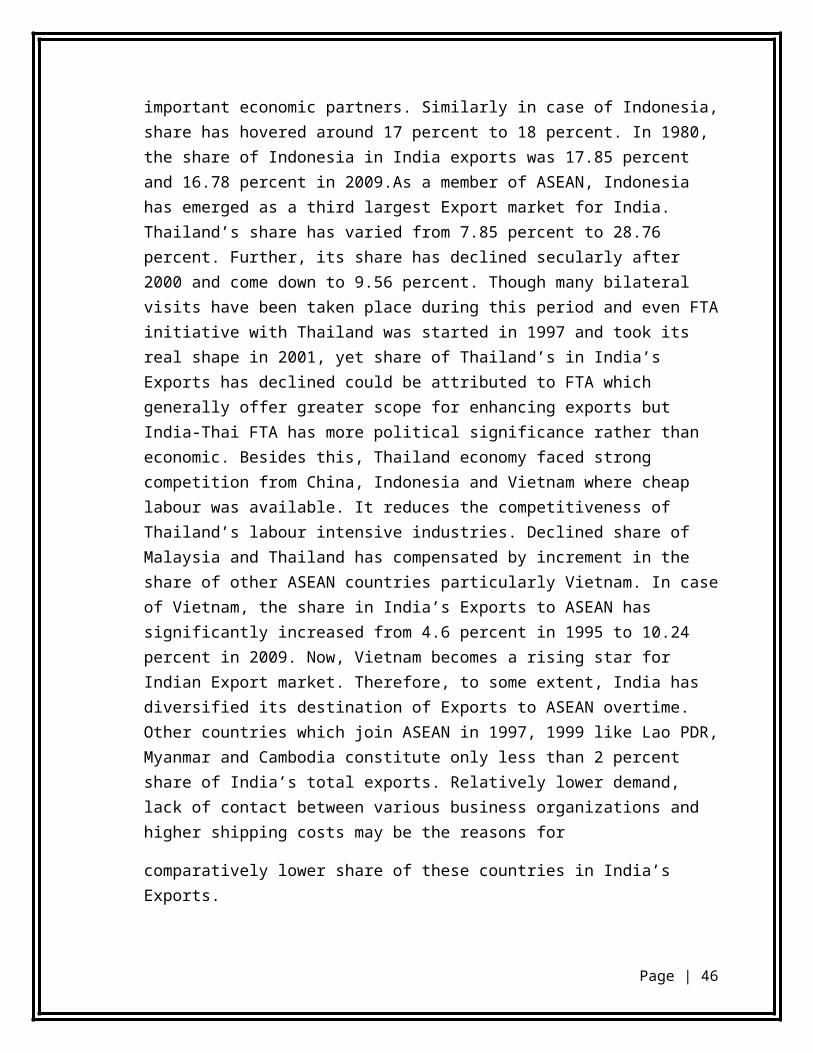
Malaysia is India’s second most important trading partner amongst the ASEAN countries. Although, the share of Malaysia has marginally fallen from 23.63 percent to 19.69 percent during the study period, yet it has emerged as India’s second largest trading partner in the ASEAN after Singapore. Spectacular progress of the Malaysian economy since the late eighties, the new selfconfidence of Malaysian entrepreneurs, and the liberalization of the Indian economy since 1991 have triggered new dimensions in bilateral commercial and economic relations. India and Malaysia are now mutually important economic partners. Similarly in case of Indonesia, share has hovered around 17 percent to 18 percent. In 1980, the share of Indonesia in India exports was 17.85 percent and 16.78 percent in 2009.As a member of ASEAN, Indonesia has emerged as a third largest Export market for India. Thailand’s share has varied from 7.85 percent to 28.76 percent. Further, its share has declined secularly after 2000 and come down to 9.56 percent. Though many bilateral visits have been taken place during this period and even FTA initiative with Thailand was started in 1997 and took its real shape in 2001, yet share of Thailand’s in India’s Exports has declined could be attributed to FTA which generally offer greater scope for enhancing exports but India-Thai FTA has more political significance rather than economic. Besides this, Thailand economy faced strong competition from China, Indonesia and Vietnam where cheap labour was available. It reduces the competitiveness of Thailand’s labour intensive industries. Declined share of Malaysia and Thailand has compensated by increment in the share of other ASEAN countries particularly Vietnam. In case of Vietnam, the share in India’s Exports to ASEAN has significantly increased from 4.6 percent in 1995 to 10.24 percent in 2009. Now, Vietnam becomes a rising star for Indian Export market. Therefore, to some extent,
Page | 31
India has diversified its destination of Exports to ASEAN overtime. Other countries which join ASEAN in 1997, 1999 like Lao PDR, Myanmar and Cambodia constitute only less than 2 percent share of India’s total exports. Relatively lower demand, lack of contact between various business organizations and higher shipping costs may be the reasons for
comparatively lower share of these countries in India’s Exports.
Page | 32
Source: Author's calculation using UNCOMTRADE database, United Nations Statistical
Page | 33
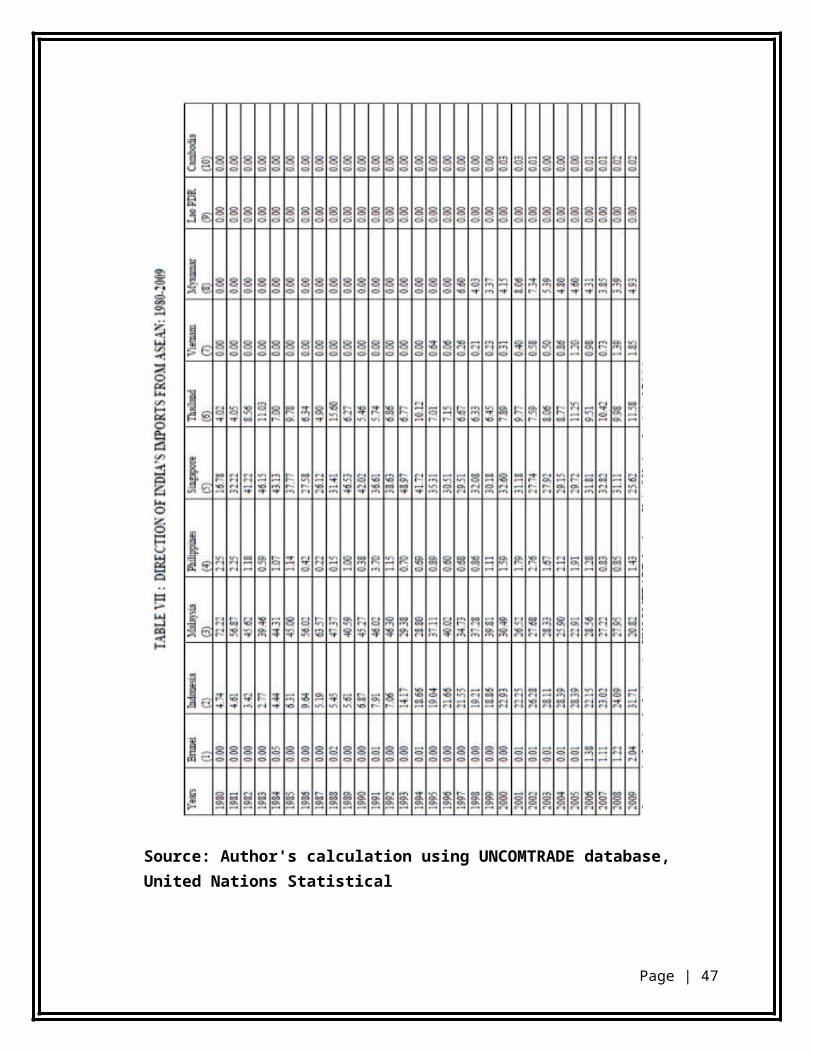
During the period 1980-2009, the relative importance of ASEAN’s countries in India’s Imports has changed considerably (Table VII). In the 1980, Malaysia’s share was 72.22 percent and 89 percent imports of India come from only two countries of ASEAN i.e. Malaysia and Singapore. At the end of this sub-period, Malaysia’s share dropped to only 29 percent. Correspondingly, Singapore’s share increased from 17 percent to 42 percent; and Indonesia from 5 percent to 19 percent. In the second
sub-period, initially Indonesia’s share was the highest i.e. 37 percent, but in 2009 it comes down to 21 percent; whereas Malaysia’s share increased from 19 percent to 31 percent. But Singapore’s share declined from 42 percent to 26 percent. Overall, it is observed that in the year 2009, India’s major Import destinations in ASEAN region are Indonesia, Singapore, Malaysia, and Thailand. Other countries of ASEAN like Myanmar, Philippines Brunei, Vietnam, and Cambodia only comprise 10 percent share of India’s Imports.
Page | 34
Source: Author's calculation using UNCOMTRADE database, United Nations Statistical Division
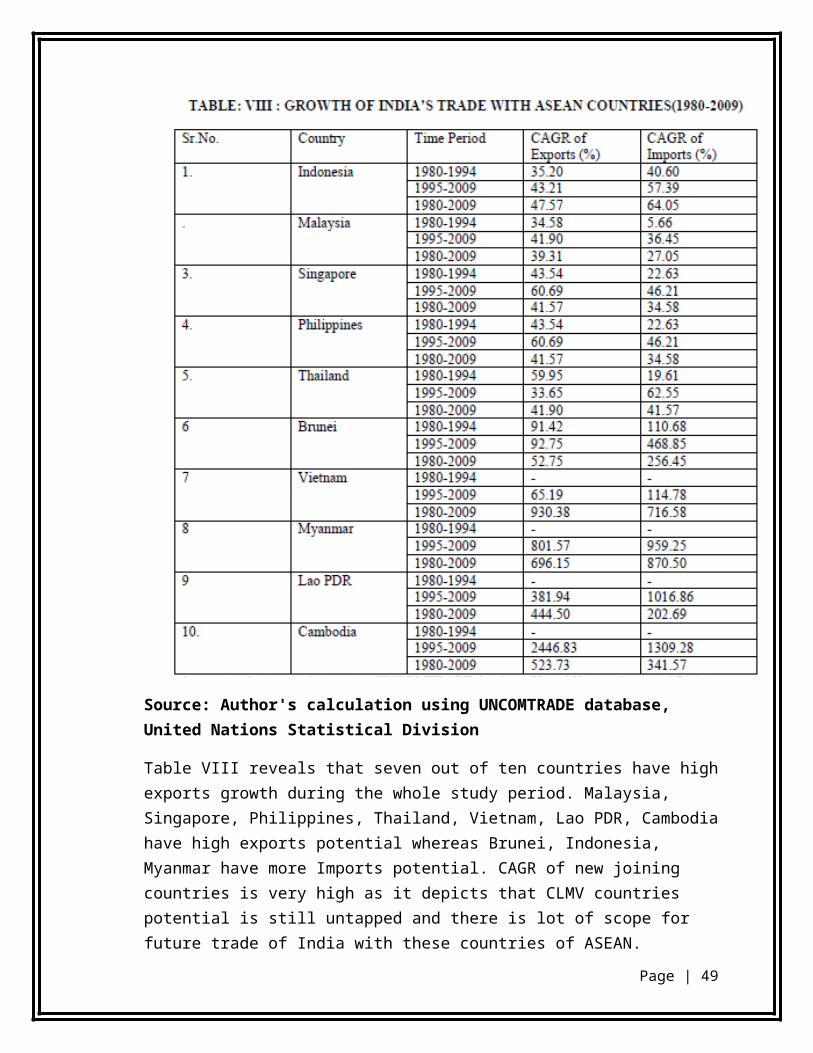
Table VIII reveals that seven out of ten countries have high exports growth during the whole study period. Malaysia, Singapore, Philippines, Thailand, Vietnam, Lao PDR, Cambodia have high exports potential whereas Brunei, Indonesia, Myanmar have more Imports potential. CAGR of new joining countries is very high as it depicts that CLMV countries potential is still untapped and there is lot of scope for future trade of India with these countries of ASEAN.
Page | 35
Composition of India-ASEAN Bilateral Trade
A country-by-country analysis of the bilateral trade between India and the four ASEAN
countries shows that two-way trade between India and ASEAN has increased in 13
sectors.
These are:
Mineral fuels, oils, distillation products, etc.;
Organic chemicals;
Miscellaneous chemical products;
Plastics & articles thereof;
Rubber & articles thereof;
Pearls, precious stones, metals, coins, etc.;
Iron & steel;
Articles of Iron & steel;
Copper & articles thereof;
Nuclear reactors, boilers, machinery, etc.;
Electrical, electronic equipment;
Vehicles other than railway, tramway (transport equipment); and
Optical, photo, technical, medical, etc. apparatus
While a detailed analysis of India’s bilateral trade with each of these four countries at the
6-digit product level is called for to understand the dynamics of this increased two-way
trade, there is preliminary evidence pointing towards India’s increased integration with
the regional and global production networks centred on ASEAN.
Integration in global production networks driven by FDI is the manner in which
most ASEAN-5 countries have achieved export-led growth. The patterns of
manufacturing sector production in most of these countries has been highly dependent on
the networks put in place by multinational corporations, which have been able to place
parts of their production processes in different countries across the region based on the
availability of skills andresources required for particular stages of production along the
value chain. ASEAN has been the most important production base for not only Japanese
but also American and European multinational firms, which have invested and organized
production and procurement networks in ASEAN for half a century. Firms from South
Page | 36
Korea and Taiwan Province of China too have built production networks across the
region at least since the late 1980s. But, liberalization of trade and investment regimes as
part of regional trade agreements (RTAs) removes the need for multinational
corporations (MNCs) to maintain horizontal national operations. That is, RTAs enable
MNCs to restructure their operations by assigning the
responsibility for serving specific regional or even global markets in particular product
lines to certain affiliates in particular countries.
It has been observed that the implementation of the Indo-Thai bilateral FTA in
terms of the Early Harvest Program (EHP)4 led to significant industrial restructuring in
the operations of not only Japanese corporations, but also South Korean and Indian
MNCs. For instance, Toyota was reportedly restructuring its operations in Thailand and
India, under which some models of vehicles would be sourced from Thailand for the
Indian market and gearboxes exported to Thailand from India. A similar restructuring
was on in Sony’s operations in India and Thailand. On the other hand, Hyundai was
making India a regional and global hub for compact cars and was to source them from
India. Other MNCs like Honda which have built up sizeable capacities in India for two
wheeler production might use it as a regional base for them while sourcing some models
of cars from Thailand.5 Some Indian companies are also developing their regional
production networks across the region. Indian companies are looking at Thailand as an
important investment destination both for its domestic market and as a gateway to the
other ASEAN countries. Tata Motors, Tata Consultancy, Mittal Group, Tata Steel and
Satyam Computers are among major Indian players in Thailand.
Thus there is evidence that the bilateral FTA between India and Thailand has lead to
some production restructuring by both Indian and East Asian MNCs. As a result, FDI-led
trade integration is emerging between India and Thailand. The India-Thai FTA’s EHP
has thus had a major impact in changing the composition of bilateral trade between India
and Thailand.6While India had maintained trade surplus vis-à-vis Thailand continuously
during 1995-2004,with the higher growth in Thailand’s exports to India, this turned into a
trade deficit in 2005.
India’s Balance of Trade with ASEAN Countries, 1995-2008
(In Million USD)
Page | 37
1995 2002 2005 2007 2008
Singapore 45.5 46.7 2268.1 -511.5 549.1
Indonesia 200.3 -493.6 -1628.9 -2962.2 -3772.0
Thailand 302.2 376.1 -147.3 -519.0 -659.5
Malaysia -504.9 -587.7 -1292.2 -3875.3 -4427.0
Viet Nam 108.5 276.4 506.1 1088.3 1441.0
ASEAN-5 151.7 -382.2 -284.2 -6779.7 -6868.4
Philippines 122.4 334.5 278.9 397.9 527.4
Myanmar -131.9 -278.9 -371.9 -646.3 -668.9
Cambodia 1.8 16.3 20.9 43.6 49.6
Brunei Darussalam 7.2 4.3 3.6 -225.3 -308.7
Lao People's DR. na na na na na
Other ASEAN -0.6 76.2 -68.5 -430.1 -400.7
Source: Based on UN Comtrade Database.
Among the ASEAN countries, India has maintained a trade deficit in most years with
Indonesia, Malaysia and Myanmar, and with Thailand more recently. India has run a
trade surplus with Singapore, Vietnam, Cambodia and the Philippines. However, India’s
overall trade balance with ASEAN-10 countries is significantly negative. Given this
backdrop, we examine the implications of India’s tariff reduction commitments under
AIFTA in thefollowing section.
The ASEAN-India FTA in Goods
Main Features of Tariff Reduction Commitments
AIFTA provides for a phased reduction of import duties on Indian and ASEAN
member countries’ agricultural and non-agricultural goods between January 2010 and
January 2016. These duties will come down from their 2007 applied most favoured
nation (MFN) tariff levels.
India, Indonesia, Malaysia, Singapore, Thailand and Brunei Darussalam have to
Page | 38
eliminate tariffs by 2013 for the products listed under Normal Track-1 (NT-1) and by
2016 for Normal Track-2 (NT-2) products. The deadlines for bilateral duty
elimination for India and the Philippines are 2018 and 2019 respectively.
Apart from a Sensitive Track, there is a list of Special Products, for which tariffs
willbe reduced at a much lower pace than the Normal Track and Sensitive Track.
There isalso an Exclusion List of products for which no tariff reduction
commitments havebeen made.
With the signing of AIFTA, India has made commitments to reduce or eliminate tariffs
forover 89% of all of its agriculture, marine and manufactured goods by 2016. Nearly
70% ofIndia’s tariff lines fall under Normal Track-1, for which tariffs reduce to zero by
2013. Theremaining nearly 9% tariff lines fall under Normal Track-2, for which tariffs
reduce to zero by 2016. The 496 products excluded from tariff reduction commitments
and kept under the Exclusion List constitute 9.8% of India’s total tariff lines, while India
has kept 11.1% of its total tariff lines under the Sensitive Track. Special Products
constitute just 0.1% of its total tariff lines. Evidently, the vast majority of products come
under the lists for tariff rate eliminations by 2013 or 2016.
In the following sections, we examine the implications of the tariff reduction
commitments undertaken by India on its agriculture and the manufacturing sectors
through an analysis of the nature of tariff reductions under the different categories.
Impact on bilateral trade between India and ASEAN
Section E shows the total trade increase in India and the ASEAN region following FTA
implementation, whether with either full trade liberalization or with liberalization taking
into account the tariff commitments of the countries under the current scenario or the
ultimate scenario. This subsection takes a closer look at bilateral trade between the two
partners, India and ASEAN, under the different scenarios. It is evident from figure 1 that
Page | 39
bilateral trade between India and ASEAN steadily increases (from 32.79% under the
current scenario to 62.69% under
full liberalization) as the scope of the FTA widens with regard to the number of countries
and products involved.
Figure 1. Total bilateral trade between India and ASEAN
(Unit: US$ million)
Both India and the ASEAN members gain substantial access to each other’s’ markets
following the implementation of the FTA (table 7). However, under all circumstances the
market access gained by the ASEAN region in India is substantially higher compared to
India’s access in their region.
Page | 40
Impact on exports from India
Figure 2 identifies the countries in the ASEAN region that are the main destinations for
exports from India. In the current situation of trade liberalization with regard to just
Malaysia, Singapore and Thailand, the largest market for Indian goods is Thailand.
Eventually, when trade is liberalized with all ASEAN countries, India’s largest market
access is in Cambodia, followed by Thailand, Viet Nam, the Philippines, the Lao
People’s Democratic Republic and Malaysia. In the event of full liberalization, Indonesia
also becomes important as a market for India, due to the fact that Indonesia has a lengthy
negative list. Singapore remains the least important destination
(in terms of export volume) for Indian exports under all scenarios.
Page | 41
Increase in India’s exports to ASEAN countries under different scenarios, inPercentage
Source: Based on the results of the simulations.
All the sectors in India register increases in export demand. The sectors that register
notable increases in exports to the ASEAN region are wearing apparel, textiles, food
products, other crops, wood and wood products, fisheries, mineral products, machinery,
beverages and tobacco, and leather and leather products. The main destinations for these
exports are listed in table 8. With full liberalization, the motor vehicle-producing sector
and primary sectors such as rice and sugar also register good export growth. Rice is on
the exclusion list of Indonesia, Malaysia, Myanmar, the Philippines and Thailand. It is
also on the sensitive list of the Lao People’s Democratic Republic. With complete tariff
elimination under full liberalization, large
quantities of rice are exported to Indonesia, Malaysia and the Philippines. Sugar is on the
exclusion list of Indonesia, Myanmar, the Philippines, Thailand and Viet Nam. With full
Page | 42
liberalization there is a notable surge in sugar exports to Indonesia, Malaysia and
Thailand.
Exports of motor vehicles are largely to Malaysia and Thailand. Under the current and
ultimate scenarios both Malaysia and Thailand have this product on their exclusion list.
As noted in table 8, those sectors in India that register notable increases in the demand for
their exports to ASEAN are mostly concentrated in the three bigger countries of
Malaysia, Singapore and Thailand. Among the smaller countries, Viet Nam is also an
important destination for many of these products. In summary, India’s export markets in
the ASEAN region following FTA implementation record the largest demand in Thailand
under the current scenario, and in Cambodia when allcountries implement the FTA.
Smaller countries such as Viet Nam, the Lao People’s Democratic Republic and the
Philippines also become large markets. Indonesia has the potential to become a major
market if there is full liberalization. Among the bigger countries, Malaysia shows
reasonable growth as an important market. Thus, growth in total exports from India is
mainly concentrated in the smaller countries of the ASEAN region with the exception of
Thailand, but when it comes to markets for Indian products that register the highest
increase in exports to ASEAN, Malaysia, Singapore and Thailand become important
destinations. Among the smaller countries, Viet Nam is also an important destination for
many of these products. However, in
terms of growth of both total exports and markets for important export items, Thailand
becomes the most important market for India.
Page | 43
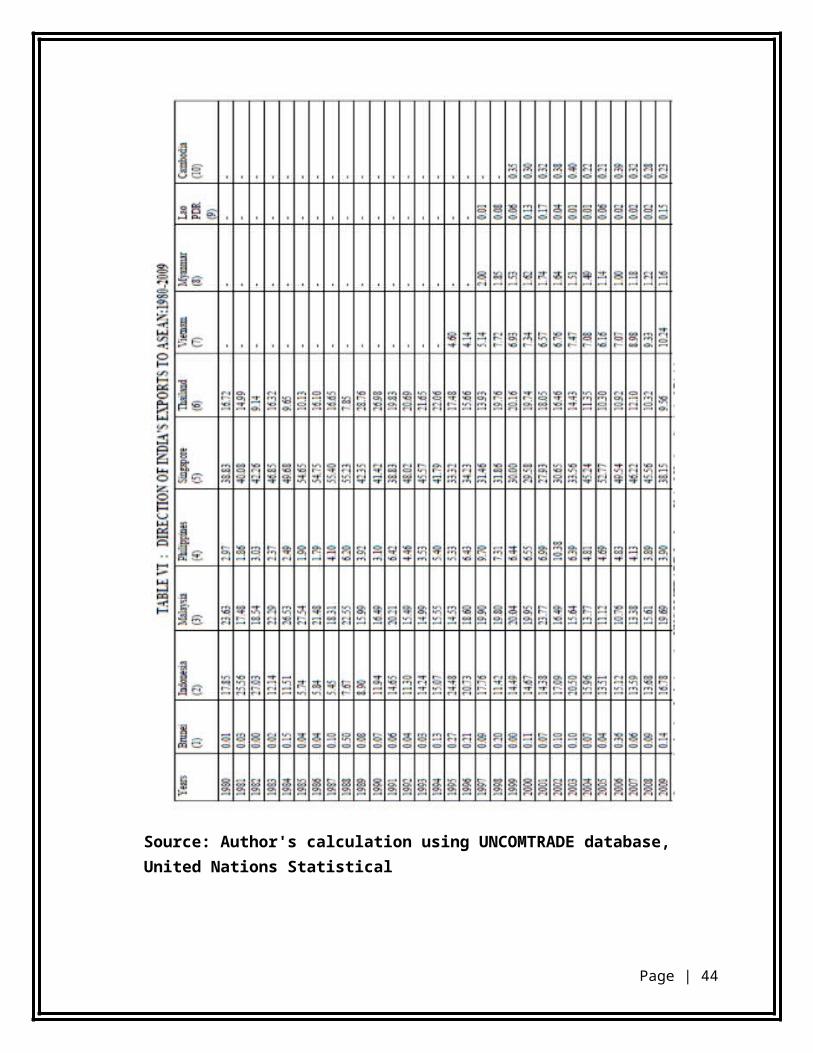
Table 8. Sectors in India showing highest export growth and their destinations
Exports of motor vehicles are largely to Malaysia and Thailand. Under the current and
ultimate scenarios both Malaysia and Thailand have this product on their exclusion list.
As noted in table 8, those sectors in India that register notable increases in the demand for
their exports to ASEAN are mostly concentrated in the three bigger countries of
Malaysia, Singapore and Thailand. Among the smaller countries, Viet Nam is also an
important destination for many of these products. In summary, India’s export markets in
the ASEAN region following FTA implementation record the largest demand in Thailand
under the current scenario, and in Cambodia when allcountries implement the FTA.
Smaller countries such as Viet Nam, the Lao People’s Democratic Republic and the
Philippines also become large markets. Indonesia has the potential to become a major
market if there is full liberalization. Among the bigger countries, Malaysia shows
reasonable growth as an important market. Thus, growth in total exports from India is
mainly concentrated in the smaller countries of the ASEAN region with the exception of
Thailand, but when it comes to markets for Indian products that register the highest
increase in exports to ASEAN, Malaysia, Singapore and Thailand become important
destinations. Among the smaller countries, Viet Nam is also an important destination for
many of these products. However, in
Page | 44
terms of growth of both total exports and markets for important export items, Thailand
becomes the most important market for India.
Effect of increased imports on domestic production in India
With import prices coming down and import demand increasing in India, domestic
production of those goods is likely to suffer. With regard to domestic output by the
sectors thatregister the highest import growth following the tariff liberalization, the
simulation shows that India’s demand for domestically produced goods falls for all
sectors of India. In fact, some of these sectors (i.e., oil and gas, chemicals, transport
equipment, ferrous metals, other crops and coal) experience such large decreases in
domestic demand that their total outputs register decreases. For the other sectors, the
increase in export demand compensates for the loss in domestic demand.
Effect on factor demand in the Indian economy
For all sectors that register declines in domestic output in the face of increased imports
from ASEAN, the demand for all the mobile factors, i.e., capital and labour (both skilled
and unskilled), also falls. Given their mobility, these factors move across sectors and
manage to find employment in sectors where domestic output has increased. As such,
total demand for unskilled labour shows an increase of 0.93% while that of capital rises
by 0.53%. For the sluggish factor, land demand falls among most of the sectors
experiencing declines in domestic production.
However, on the whole, demand rises by 14.86%. Demand for natural resources also
increases by 0.12%. The only factor to show a fall in demand is skilled labour, which
declines by 0.62%. Among the sectors that contribute to large declines in demand for
skilled labour are coal, oil and gas, transport equipment and other crops. After the FTA
implementation, total domestic output for all 35 sectors in India shows an
increase of 2.78%. This results in an increase in demand for primary factor composite
(comprising land, labour, capital and natural resources) for all production sectors in the
country taken together.
This is the positive expansionary effect, which results in an increase in demand of 2.78%
for the primary factor composite. This, in turn, leads to simultaneous increases in the
price of the primary factor composite in the region and in relative prices of the mobile
Page | 45
endowments (unskilled labour – 9.86%, skilled labour – 11.58% and capital – 10.27%).
This increase in relative prices of the factors results in a negative substitution effect on
demand for the factors. The negative substitution effect of a relative price change
outweighs the positive expansion effect of an output increase in the case of unskilled
labour, and results in a fall in total demand by 0.62%
5. Effect of increased import from India on the ASEAN region
As in the case of India, prices of products imported from India for ASEAN markets
decline substantially following FTA implementation. However, as the share of Indian
goods in total imports by most of the ASEAN members is much smaller, the fall in prices
of imports from India fails to push down the prices of the total imports of these goods
(import composite comprising the imports of similar products sourced from different
countries of the world) in the
respective countries .
The increased imports in each of those countries are not only due to increased household
demand but also increased input demand by firms. The domestic demands in sectors that
show the highest increase in imports from India generally register a decline in most
countries. To a large extent, this results in a fall in the sectors’ domestic production.
Some of the sectors, despite the decline in the size of domestic markets manage to
register increased production due to increased export demand for their products. For
some countries such as Indonesia and Myanmar as well as the rest of ASEAN, total
output falls in all sectors due to declines in domestic demand. With the exception of the
Philippines and the Lao People’s Democratic Republic, total domestic output for all
thesmall ASEAN members decline following FTA implementation. In contrast, Malaysia,
Singapore and Thailand show increases in total domestic output . Due to the expansion
effect of total production, the demand for the mobile factors of production rises in the
Lao People’s Democratic Republic, the Philippines, Malaysia, Singapore and Thailand,
while it falls in the other ASEAN members. Due to increased demand, the prices of the
mobile factors also rise in Malaysia, Singapore and Thailand. However, the price of the
factors in Cambodia, Indonesia, Myanmar, the Philippines and Viet Nam, as well as the
rest of ASEAN, rises despite a decline in total demand for the factors.
Page | 46
Impact on the Agricultural Sector
We can observe that out of the 722 6-digit tariff lines coming under the agricultural
sector (HS 1-24 including fisheries), 402 products fall under the Normal track with tariffs
to be10reduced to zero by 2013 or 2016; while 14 are in the Sensitive Track; five are
SpecialProducts; and 301 products are in the Exclusion List.
Analysis of India’s Sensitive Track, Special Products and Exclusion List
Under the Sensitive Track, India has to bring down tariffs on products with applied MFN
tariffs above 5% to 5% by 2016. Applied MFN tariffs can be maintained at 5% for only
50 tariff lines. Tariffs for the remaining products with applied MFN at 5% had to be
reduced to 4.5% in January 2010, which will be reduced further to 4% by 2016. Applied
MFN tariffs on another 4% of the products placed in the Sensitive Track will drop to zero
by 2019. It is observed that out of the 14 agricultural products (HS 1-24), as many as 13
products had their 2007 MFN applied rates at an average of 30%. Even if the government
plans to maintain the tariffs on all products falling under the agricultural sector (HS 1-24)
at 5% or 4%, it is clear that AIFTA involves high tariff reductions given that their applied
MFN level in 2007 averaged about 30%.
It is also relevant to consider the non-agricultural products under the Sensitive Track.
Apart from product lines under the automobiles sector with the highest 2007 applied
tariff of 32.5%, there are several other manufactured sectors, including organic
chemicals, plastic products, rubber products, machinery and electrical machineries,
textiles and footwear &parts, whose 2007 applied MFN rates ranged from 7% to 25%. In
the entire Sensitive List, only ‘residue of food and animal fodder’ (HS 23) had its 2007
applied MFN tariff at 5%. Thus, all the remaining tariffs have to be brought down to 5%
by 2016. It is clear that out of the 563 tariff lines under the Sensitive Track, this implies
quite significant tariff reduction across a wide range of products. Many of these will be
further brought down to zero by 2019 and tariffs on only 50 lines will be maintained at
5%. Next we consider India’s Special Products, which are: crude palm oil (CPO; Applied
MFN - 80%); refined palm oil (RPO; 90%); coffee (100%); black tea (100%); and
pepper (70%). The initial tariff drops for these five products were in the range of only 3%
to 5% in January 2010. However, by 2014, these will drop by 20%, 20%, 25%, 25% and
Page | 47
10% respectively. By 31 December 2019, the rates will be 37.5%, 45%, 45%, 45% and
50%.
RISING ASEAN - INDIA TRADE
ASEAN has become India’s one of the largest trading partners in recent years.
India’s trade with ASEAN has increased from US$ 7.13 billion in 2000 to US$ 41.32
billion in 2009 (Table 1). Grown at 22 percent in the last decade, India’s trade with
ASEAN presently shares about 10 percent of India’s global trade, compared to 8
percent of 2000. India’s trade with ASEAN+3 countries is the most documented
development that the world has witnessed in the contemporary period. Trade between
India and ASEAN+3 countries increased from less than US$ 20 billion in 2000 to
over US$ 110 billion in 2009, grown at a CAGR of about 23 percent in the last
decade–perhaps the fastest trade growth ever witnessed by India with any economic
bloc in the world in the last one decade. Today, ASEAN+3 countries contribute 1/4th
of India’s global trade, thus emerging as India’s largest trading partner in the world.
However, this growth in trade varies across countries within ASEAN.
India’s export to ASEAN has been growing faster than her imports from ASEAN.
In 2009, India’s import from ASEAN was US$ 24 billion and the export to the region
was US$ 17billion (Table 2(a), (b)). Except 2005, India had net trade deficit with
ASEAN in the last decade. India’s trade with China has witnessed a phenomenal rise
in the last decade. India’s export to China mainland increased from about US$ 1.5
billion in 2001 to US$ 10 billion in 2009, witnessing a CAGR of 27 percent per
annum. In contrast, India’s import from China expanded sharply. In 2009, India’s
import from China mainland touched US$ 29 billion, which was a mere US$ 2 billion
101 in 2001, increasing with a CAGR of 39 percent since 2001. With a share of 6 percent
in India’s global export and 11 percent in India’s global import, China has become
India’s largest trading partner. At the same time, India’s trade with Indonesia,
Malaysia, Singapore, Japan and Korea have also grown rapidly. Vietnam comes next.
Today, ASEAN shares about 11 percent in India’s global exports (which was 7 percent
in 2001), and 9 percent of India’s global imports (which was 11 percent in 2001).
Compared to China and ASEAN, India’s trade with CLMV countries has not yet
picked-up the momentum. It also suggests further scope for trade expansion with
Page | 48
CLMV countries in coming years. This is also not to deny that India’s trade with
ASEAN and ASEAN+3 countries would be driven by the short run trend. However,
the structure of exports may change when the countries witness favorable trading
environment such as improved and enabling trade costs. The current trends of
ASEAN-India trade suggest that India could become an increasingly important market
for ASEAN’s exports and vice versa.
Trends in India’s Trade (Export+Import) with ASEAN and ASEAN+3
YEAR
ASEAN ASEAN+3 WORLD
Value
(US$
billion)
Share*
%
Value
(US$
billion)
Share*
%
Value
(US$
billion)
2000 7.13 7.67 18.02 19.38 92.96
2001 10.04 9.60 23.79 22.75 104.58
2002 9.29 8.49 22.81 20.84 109.43
2003 12.38 9.16 30.75 22.74 135.22
2004 15.91 9.08 40.23 22.96 175.22
2005 20.36 8.55 55.30 23.23 238.10
2006 28.36 9.54 73.45 24.71 297.23
2007 36.96 9.51 98.39 25.31 388.80
2008 43.26 9.42 117.42 25.57 459.17
2009 41.32 9.77 113.42 26.82 422.87
CAGR (%) 21.56 22.68 18.33
*Share in the worldSource: Calculated based on Direction of Trade Statistics Online Database, IMF
CONCLUSION:
An aggregate analysis of Indo-ASEAN trade exhibits the importance of ASEAN in India’s trade. It is observed that ASEAN’s importance has been increasing since 1980.
Page | 49
ASEAN as a region has displayed great dynamism. It is a noticeable fact that in comparison to ASEAN exports, India’s exports have become 70 times in 2009 compared to 1980. This indicates that with India’s sustained economic growth and increased unilateral liberalization, there is a large untapped potential for expansion of ASEAN-India merchandise trade from the present levels. By analyzing the share of each country of ASEAN in India Exports and Imports, it is concluded that four countries of ASEAN namely Singapore, Malaysia, Indonesia and Thailand constitute more than 80 percent share of India’s Exports and major Import destinations of India are Indonesia, Singapore, Malaysia and Thailand. Thus, the direction of India’s trade in ASEAN region has been changing overtime. These results are confirmed by Exports and Imports growth of India with each country of ASEAN. The empirical analysis of growth of trade of ASEAN countries shows that after 1995, Vietnam has also emerged as significant trade partner of India in ASEAN region. The growth of
Exports and imports of Cambodia, Lao and Myanmar also confirm that ASEAN on the whole has great trade potential and Indo-ASEAN trade has a lot of scope for future.
. Conclusion
The present study provides an analysis of, and insight into the impact of the India-ASEAN FTA on the macroeconomic variables, trade variables and welfare position of India and the countries of the ASEAN region. The trade consequences of this FTA for the important trading partners of India, i.e., the United States, European Union, China, the rest of West Asia and the other developing countries of South Asia are also examined. Three simulations of different scenarios were made, involving different stages of the FTA (current for implementation of the FTA between India, Malaysia, Singapore and Thailand; ultimate as of December 2019 when all countries of the region will have implemented the FTA; and a hypothetical scenario of full liberalization). In addition, a simulation of the ultimate scenario with IRS assumption for some of the manufacturing sectors in India was made, and the impact on the economy noted and compared with the results obtained under the simulations with the assumption of CRS. The impact of the FTA according to the simulation results is summarized below.
REFERENCES.
ASEAN Web (2010), “ASEAN-India Dialogue Relations”.
Asian Development Bank (2008), “Emerging Asian Regionalism”,
Page | 50
Webligraphy
http://www.asean.org/news/item/asean-india-free-trade-area
http://en.wikipedia.org/wiki/ASEAN%E2%80%93India_Free_Trade_Area
http://indianresearchjournals.com/pdf/IJSSIR/2013/February/8.pdf
http://www.aseanindia.com/countries/india/
Page | 51


![Level 5 Economics: Theory of the Firm [2] Economic Principles Economic Principles Economic Environment Economic Environment](https://img.pdfslide.net/doc/110x75/5519166655034638428b49a5/level-5-economics-theory-of-the-firm-2-economic-principles-economic-principles-economic-environment-economic-environment.jpg)