Embed Size (px)
Citation preview

University of Tennessee, KnoxvilleTrace: Tennessee Research and Creative
Exchange
University of Tennessee Honors Thesis Projects University of Tennessee Honors Program
5-2017
Economic Analysis of Rare Earth ElementsExtraction from Clay WasteSeth ArchambaultUniversity of Tennessee, [email protected]
Follow this and additional works at: https://trace.tennessee.edu/utk_chanhonoproj
Part of the Other Chemical Engineering Commons
This Dissertation/Thesis is brought to you for free and open access by the University of Tennessee Honors Program at Trace: Tennessee Research andCreative Exchange. It has been accepted for inclusion in University of Tennessee Honors Thesis Projects by an authorized administrator of Trace:Tennessee Research and Creative Exchange. For more information, please contact [email protected].
Recommended CitationArchambault, Seth, "Economic Analysis of Rare Earth Elements Extraction from Clay Waste" (2017). University of Tennessee HonorsThesis Projects.https://trace.tennessee.edu/utk_chanhonoproj/2053

May 1, 2017
Dr. Robert Counce
Department of Chemical and Biomolecular Engineering
University of Tennessee
424 Dougherty Engineering Building
Knoxville, TN 37996
Dear Dr. Counce:
We are submitting the attached report entitled Economic Analysis of Rare Earth
Elements Extraction from Clay Waste.
This report examines the results of designing a process and estimating the capital and
manufacturing costs for the extraction of rare earth elements from the wet process for
phosphoric acid production.
I hope you find this report satisfactory.
Sincerely,
Seth Archambault, Jacob Lockhart, Tiffany Onwu, Clifford Swanson
Honors Design in Green Engineering
University of Tennessee
Knoxville, Tennessee
Enclosure: Final Report
cc: Thomas Gaetjens

2
Economic Analysis of Rare Earth Elements Extraction from
Clay Waste
CBE 488: Honors Design in Green Engineering
Seth Archambault
Jacob Lockhart
Tiffany Onwu
Clifford Swanson
Submitted:
April 28, 2017
Chemical and Biomolecular Engineering Department
University of Tennessee
1331 Circle Park Drive SW, Knoxville, TN, 37916

3
Table of Contents
1.0 Introduction .............................................................................................................................3
2.0 Synthesis Information for Processes .......................................................................................4
2.1 Overall Process Schematic ..........................................................................................4
2.2 Process Chemistry .......................................................................................................5
2.3 Literature Summary ....................................................................................................6
2.4 Basic Process Economics ............................................................................................7
3.0 Method of Approach ...............................................................................................................8
3.1 Flow Diagram .............................................................................................................9
3.2 Sustainability, Environmental, and Worker Safety .....................................................9
3.3 Product Quality .........................................................................................................10
4.0 Results ...................................................................................................................................11
4.1 Capital Cost Estimates ..............................................................................................11
4.2 Manufacturing Cost Estimates ..................................................................................12
5.0 Discussion of Results ............................................................................................................13
6.0 Conclusions ...........................................................................................................................13
7.0 Recommendations .................................................................................................................14
8.0 References .............................................................................................................................16
Appendices ..................................................................................................................................18
Appendix A: Project Assumptions..................................................................................18
Appendix B: Mass and Energy Balance .........................................................................19
Appendix C: Capital Cost and Manufacturing Cost .......................................................23
Appendix D: Equipment Cost .........................................................................................28
Appendix E: REE data ....................................................................................................34

4
1.0 Introduction
This report will document the results of the study to design a process and analyze its
economics for the extraction of rare earth elements (REEs) from the wet process for phosphoric
acid (H₃PO₄) production. In the wet process being analyzed, phosphoric acid is produced using
concentrated sulfuric acid and multiple stirred reactors. The byproduct streams consist of sand,
clay, phosphogypsum, and sludge. Each of these streams contain varying amounts of REEs. During
the wet process for H3PO4 production, the ore is separated into phosphate rock and waste streams
of clay and amine flotation tails (sand). Through many mining processes, large amounts of clay
waste are produced. Since REEs are used for a variety of products, the recovery of REEs from
phosphoric acid by product streams could potentially provide additional economic value in
industry.
The process originated through efforts by Florida Industrial and Phosphate Research
Institute (FIPR) to recover these valuable REEs and make the process profitable. The economic
viability of this process will be estimated by determining the capital cost as function of equipment
cost and manufacturing cost [9]. The process scale is 4 million tonnes of clay processed annually.
The yearly profit will then be evaluated as a function of REE conversion from phosphate form to
oxide form.
The primary design objective was to develop and compare flow sheets, capital costs, and
the intermediate operating cost estimates for a process to recover REEs from the clay stream
exiting the dissolution step of the wet phosphoric acid process. The purity of the product required
low concentrations of non-Lanthanide (Ln) metals and low radioactivity. The Ln concentration of
the product was required to be 50wt%. With a ChE index of 543, this report aims to focus on
recovering rare earth elements from the clay waste stream. It will also display the approach that

5
involves analyzing the economics of REE extraction, estimating for the capital and operating costs,
and making recommendations for REE profits.
Contributions to this study were provided by Critical Materials Institute (CMI; a US
Department of Energy (DOE) energy innovation hub), Oak Ridge National Laboratory (ORNL),
the University of Tennessee (UT), Idaho National Laboratory (INL), and the phosphoric acid
industry, with support from FIPR.
2.0 Synthesis Information for Processes
2.1 Overall Process Design
The production of phosphoric acid is accomplished by processing mined phosphate rock.
It is in the waste streams of the phosphate process that the recovery of REE’s seems promising.
The different waste streams are clay, amine flotation tailings, phosphogypsum, and sludge. The
process begins with the mining of the ore followed by separation into three streams of phosphate
rock, clay waste, and amine flotation tailings.
For the REE recovery from clay, evaluated the process shown below. The steps of this
process are as follows: (1) separation of solids based on particle size, where the coarse fraction is
fed to the leaching vessel and the fine fraction sent for reclamation, (2) leaching of the REE
phosphates into REE sulfates and separation of the solids from the stream, (3) removal of the REE
sulfates out of the leaching product stream, (4) concentration of the REEs into our final product.
This is a basic look at the process design and each step involves more intermediate steps.

6
Figure 2.1: General Clay REE Recovery Process
2.2 Process Chemistry
The production of phosphoric acid is carried out by the reaction below. The general process
is that phosphate rock (represented by Ca₅(PO₄)₃X, where X is representative of OH, F, Cl, or Br)
is reacted with sulfuric acid to produce phosphoric acid, phosphogypsum, and HX.
The waste stream we are processing is the clay waste, which is separated prior to the
reaction described above. The reactions for our total process include the leaching reactions, the
precipitation reaction, and the calcination reaction. The leaching reaction is essentially a reaction
between sulfuric acid and REE phosphates (represented by Ln) to form phosphoric acid and REE
sulfates. Similar reactions will also take place during the leaching process between sulfuric acid
and Iron (III) oxide, aluminum oxide, magnesium oxide, and calcium oxide. Also, during this
process a reaction occurs between phosphorus pentoxide and water to form phosphoric acid.
Reaction 1: 2𝐿𝑛𝑃𝑂4 + 3𝐻2𝑆𝑂4 → 𝐿𝑛2(𝑆𝑂4)3 + 2𝐻3𝑃𝑂4
Reaction 2: 𝐹𝑒2𝑂3 + 3𝐻2𝑆𝑂4 → 𝐹𝑒2(𝑆𝑂4)3 + 3𝐻2𝑂

7
Reaction 3: 𝐴𝑙2𝑂3 + 3𝐻2𝑆𝑂4 → 𝐴𝑙2(𝑆𝑂4)3 + 3𝐻2𝑂
Reaction 4: 𝐶𝑎𝑂 + 𝐻2𝑆𝑂4 → 𝐶𝑎𝑆𝑂4 + 𝐻2𝑂
Reaction 5: 𝑀𝑔𝑂 + 𝐻2𝑆𝑂4 → 𝑀𝑔𝑆𝑂4 + 𝐻2𝑂
Reaction 6: 𝑃2𝑂5 + 3𝐻2𝑂 → 2𝐻3𝑃𝑂4
The leaching step is followed by the separation of Ln2(SO4)3 from the metal sulfates. This
step is carried out by a series of staged liquid-liquid extraction and stripping. The quantitative
model for extraction and stripping is given by the Kremser equation from Geankoplis, where the
distribution coefficients are given in Table E.2, in appendix E. This step is followed by
precipitation and calcination to obtain the final product. Below are the reactions for precipitation
and calcination. The precipitation reaction is a reaction between oxalic acid and the REE sulfates
to form REE oxalate. This reaction is important because REE oxalate is insoluble in water and
therefore can be separated out. The calcination then converts the REE oxalate into REE oxide
using oxygen at a high temperature, releasing carbon dioxide as a byproduct. These reactions are
shown below respectively.
Reaction 7: 𝐿𝑛2(𝑆𝑂4)3 + 3𝐻2𝐶2𝑂4 → 𝐿𝑛2(𝐶2𝑂4)3 + 3𝐻2𝑆𝑂4
Reaction 8: 𝐿𝑛2(𝐶2𝑂4)3 +3
2 𝑂2 → 𝐿𝑛2𝑂3 + 6𝐶𝑂2
2.3 Literature Summary
Rare earth elements (REEs) are a unique set elements that consist of fifteen lanthanide
elements and yttrium, and are so called “rare” because most of them were originally isolated in the
18th and 19th centuries as oxides from rare minerals. Due to their reactivity, REEs are difficult to
extract and refine to pure metals. Each of these elements have unique characteristics that make
them useful for a variety of purposes. All the REEs were identified in the 20th century, and
commercial markets for most of them arisen in the past fifty years.

8
REEs exist in multiple forms, such as halides, oxides, carbonates, and silicates. While most
of these elements are not as uncommon as the name implies, they are simply uncommon in
commercially viable concentrations. Cerium, for instance, is more abundant in the earth’s crust
than copper or lead. Furthermore, many REEs are more common than tin and molybdenum, and
all but promethium are more common than silver or mercury. The element praseodymium is used
to create strong metals for use in aircraft engines. Praseodymium is also a component of a special
sort of glass, used to make visors to protect welders and glassmakers.
In addition to a world of increasing technological innovations, REEs also serve as
components of efficient lighting and display panels. Lanthanum is used in camera and telescope
lenses. The compounds containing lanthanum are used extensively in carbon lighting applications,
such as studio lighting and cinema projection. With expected rise in cinematography and
automotive industry, and as the future progresses, the demand for REEs will continue to increase.
2.4 Basic Process Economics
In this study, our main goal was to analyze the economic viability of REE recovery from
the clay waste stream. We looked at many different scenarios based on the conversion of REEs
into REE oxides. The variables used in our economic analysis include the overall REE phosphate
conversion to REE oxide form (our final product), the design variables of the individual equipment
cost variables (generally the cost of purchasing and operating the equipment), and the conversion
of our sellable byproducts. The cost information for our products, byproducts, and raw materials
is shown below in Table 2.1.

9
Table 2.1: Material Cost Data
3.0 Method of Approach
The following steps explain how the REEs are extracted from a clay stream. First, the clay
stream is fed into the hydrocyclone, where it is separated into a fine stream and a coarse stream.
The coarse stream is sent to a flotation tower, where air and wash water enter the tower and separate
the coarse clay into a waste tailings stream and a concentrate stream that will be fed into the
leaching vessel. During the leaching step, the sulfuric acid enters the leaching vessel and converts
the REE phosphates into REE sulfates. This leachate is then filtered to remove insoluble
impurities. Next, the filtered leachate is pumped into a solvent extractor to separate the REEs from
the phosphoric acid produced via leaching. A second extractor is then used to strip the REEs from
the organic solvent back into the aqueous phase. The REE sulfates are then sent to a precipitator
where they are converted to insoluble REE oxalates. The REE oxalates are sent through a second
filter to separate them from water. The REE oxalates are then fed into a calciner, where they react
with air at high temperature to produce REE oxides.

10
Figure 3.1: Flow diagram for REE extraction from clay stream.
3.2 Sustainability, Environmental, and Worker Safety
The plant design was made considering sustainability and environmental impact. The
overall plant was expected to be a sustainable process. The reason is that the plant gets the raw
materials from the waste of an existing plant, leading to the assumption that this plant will be
sustainable for as long as the phosphoric acid plant is running. The process does produce a few
waste streams, such as a slightly acidic waste stream from the second vacuum filter, a solid waste
stream from the first vacuum filter, a clay waste stream from the hydrocyclone, and a tailings
stream from the flotation tower. Despite there being several waste streams, there is not a large
environmental impact that is not already present. This can be seen from the fact that every waste
stream contains mining waste that is already being released by phosphate mining and the
phosphoric acid plant. The only other possible source of environmental contamination is the
effluent air from the calcination process due to some residual acid that gets vaporized and carbon
dioxide production. An analysis showed that the annual acid release is less than 5kg/year. It is also
determined that at our operating conditions, the plant produces less than 1000 tonnes of carbon

11
dioxide in an operating year. This is a very small environmental impact from the calciner, allowing
us to assume that the proposed plant has a small environmental impact.
Another major consideration for designing this plant was worker safety. Looking at all the
materials used in this plant the most dangerous aspects are the high amount of acids used and the
temperature of operation for the leaching vessel and the calciner. Extra precaution is required for
operators working with the calciner due to the extreme temperature it operates at. This may mean
some special training and probably some warning system to keep the calciner separate from
untrained persons. The rest of the plant will not be different than the existing phosphate plant, as
it uses similar reagents as the proposed plant. This means that our proposed plant will adhere to
the same safety measures as the phosphoric acid plant.
3.3 Product Quality
The next major design consideration was product quality. The quality is important as the
better the quality of product and byproduct, the closer to selling prices from table 2.1 we can
achieve. For product quality, we set a goal of greater than 50% by weight of elemental REEs. To
go with this, we also had to consider the content of radioactive materials (i.e. the thorium and
uranium content). The product had to contain less than 5kg of radioactive material for the
production year. Alongside the product quality, we had to consider the byproduct quality, which
was phosphoric acid. The major quality consideration was that the phosphoric acid must be at 50%
concentration to be sold at our assumed phosphoric acid price. To meet these considerations the
equipment had to be designed for specific separations, which affected their sizing and costing.
4.0 Results
A study of the economic potential of the process was performed to determine its viability.
The economic potential was determined as a function of conversion of Ln2(SO4)3 to Ln2O3 in four

12
different levels as described by Douglas in his paper. The level four economic potential study
showed an economic potential range from $37.6 million at 0% conversion of Ln2(SO4)3 to $39.7
million at the maximum possible conversion of Ln2(SO4)3. The results of the economic potential
study are shown below in Figure 4.1.
Figure 4.1. Economic potential vs conversion of Ln2(SO4)3 to Ln2O3
4.1 Capital Cost Estimates
The equipment was sized based on the mass balance and the capital cost of each piece of
equipment was determined based on the cost charts in Ulrich. Sample capital cost calculations can
be found in Appendix D, and the capital cost of each piece of equipment can be found in the capital
cost summary in Appendix C. The total capital cost of the plant was determined to be $26,117,668.
The capital cost distribution is shown below in Figure 4.2.

13
Figure 4.2. Yearly capital cost distribution.
4.2 Manufacturing Cost Estimates
The manufacturing cost was determined following the method outlined in Ulrich. The
manufacturing expense estimates can be found in the manufacturing cost summary located in
Appendix C. The total manufacturing cost was determined to be $27,515,992.73 per year. The
manufacturing cost distribution is shown below in Figure 4.3.
Figure 4.3. Yearly manufacturing expense distribution.
Capital Cost
Pumps
Calciner
Flotation Tower
Leaching Vessel
Vacuum Filters
Percipitator
Extractor-Stripper
Hydrocyclone
Contingency and Fee
Manufacturing Costs
Utilities
Raw Materials
Labor
Maintenance
Operating Supplies
Overhead
Local Taxes
Insurance
General Expenses

14
5.0 Discussion of Results
The recovery of REES from phosphoric acid was found to have a favorable economic
potential. As shown, the level 4 economic potential has a $40 million potential profit with the
inclusion of raw materials and equipment, while excluding utilities and miscellaneous operating
expenses. The net annual profit after taxes of the process was $14.4 million, compared to the price
of raw materials of $3.3 million. The capital cost was about $26 million, which is reasonable, since
the most expensive piece of equipment was the leaching vessel, costing about $7.37 million. The
process appears to have significant potential given that we are achieving an annual rate of return
after taxes of 72%.
6.0 Conclusions
Based on the level 4 economic analysis, a potential profit of about $40 million can be seen.
It was also shown that with our capital cost ($26million), manufacturing cost ($27.5million), REE
revenue ($1.8million), and byproduct revenue ($47.5million) that we are able to achieve an annual
rate of return after taxes of 72%. This tells us that the process has lots of potential for being a
profitable, viable option for REE production. The big thing to note here is that the large majority
of the profit is derived from phosphoric acid production, and that if it was not there, the process
would lose millions of dollars a year. It can also be seen that there is still a significant amount of
work left to be done as this study gave a base case. The study is not going to be very accurate as
many price assumptions are all best-case scenarios since the product will not be entirely pure and
the byproduct is not at merchant grade concentrations of 50%. The other large issue is that the
product contains about 2% thorium and uranium, which yields a total radioactive production of
4,557 kg/year, well above the required 5 kg/year. This tells us that there is significant work that
must be done to remove the remaining thorium and uranium from the product. Despite these areas
that need to be considered, we have a lot of confidence in the economic viability of this process.

15
7.0 Recommendations
The first major recommendation is to implement an evaporative system that takes the
phosphoric acid mixture from the solvent extraction process and increases the concentration to
merchant grade. This change would bring our byproduct revenues to our estimated revenue given
earlier. This process would help remove most of the soluble metals and potentially could separate
the sulfuric acid from the phosphoric acid, making it easier to recycle. The equipment required is
something that would need to be looked at, but is suspected to consist of a single evaporator or
maybe a series of evaporators.
Something that needs to be worked on is the removal of radioactive material from the
product, such as thorium and uranium. This process would potentially be very costly as this process
would be very difficult. The problem is that thorium, and partially uranium, behave similarly to
the REEs and therefore would be hard to separate. To do so would most likely require another
section of extraction-stripping, but different reagents would be required to make the thorium and
uranium leave the REEs. This is where most of the research would need to focus, the reagent for
removing thorium and uranium.
A major percentage of the potential process is lost after the first separation stage, the
hydrocyclone cluster. This stage results in the loss of approximately 60% of the REEs, but is
critical in removing large portions of the excess water. Improvements in this field would greatly
increase the profitability of this process. Alternative separation processes could be explored to
remove the excess water, such as distillation, but since distillation is so costly to operate, it was
not considered for this process. Improvements in the separation processes would generate greater
yields and thus greater profits, if the cost of alternative separation were not costlier than the added
profits from the increased yield.

16
The design of our plant does not incorporate any recycling schemes. Potential locations
where recycling may improve the profitability of the plant would be the wastes from the vacuum
filter after the leaching vessel and the stripped aqueous phase. Originally, we considered a second
hydrocyclone cluster after the leaching vessel that allowed for an easy recycle stream, but a
vacuum filter fit our needs more appropriately. By optimizing the recycle ratios around these two
points, an increase in phosphoric acid and REE production may be seen, which would increase the
economic viability of the plant. More experiments would need to be performed to determine if
recycle streams are worthwhile and if they are, what the optimized ratio would be.
A large portion of the equipment had high bare module factors (FBM) because many of the
process are acidic in nature. While doing a more in-depth analysis, it would be advantageous to
explore newer materials rather stainless steel or nickel-based alloys for process vessels. While this
project did not explore piping costs, installing all stainless-steel pipes would be a costly venture,
so most cost saving from using polymer lined materials would likely be seen here.

17
8.0 References and Acknowledgement
1.[1] An Investigation of Flotation Reagents. Tech. no. 02-158-227. N.p.: FIPR, 2008.
Print.
2.[2] Compressed Water and Superheated Steam. Rep. N.p.: n.p., n.d. Print.
3.[3] Dobby, Glenn. "Column Flotation." SGS Mineral Services 23 (2002): n. pag. Web.
4.[4] Douglas, J. M. (1985). A Hierarchical Decision Procedure for Process Synthesis.
AIChE Journal, 31(3), 353-362
5.[5] Felder, Richard M., and Ronald W. Rousseau. Elementary Principles of Chemical
Processes, 3rd Update Edition. N.p.: John Wiley & Sons, 2004. Print.
6.[6] Geankoplis, Christie J. Transport processes and unit operations. Englewood Cliffs:
Prentice-Hall , 2002. Print.
7.[7] Hussein, Gamal A.M. "Review: Rare earth metal oxides: formation, characterization,
and catalytic activity Thermoanalytical and applied pyrolysis review." Journal of
Analytical and Applied Pyrolysis 37 (1996): n. pag. Web.
8.[8] Standard Thermodynamic Properties of Chemical Substances. Rep. N.p.: n.p., n.d.
Print.
9.[9] Ulrich, Gael D., and Palligarnai T. Vasudevan. Chemical engineering process design
and economics: a practical guide. Durham: Process Publishing, 2004. Print.
10.[10] Wendlandt, W. W., T. D. George, and G. R. Horton. "The Thermal Decomposition of
Thorium(IV), Uranium(IV), and the Rare-Earth Metal(III) Oxalate Hydrates.
Differential Thermal Analysis and Weight-Loss Studies." Journal of Inorganic
Nuclear Chemistry 273 (1961): 280-86. Web.
11.[11] Yianatos, J. B. "Column Flotation Modelling and Technology." (n.d.): n. pag. Web

18
Acknowledgements
● Dr. Counce, University of Tennessee: Guidance in Project
● Weir Minerals: For Hydrocyclone Design and Pricing
● Cytec Industries: For Mixer-Settler Design and Pricing
● Dr. Zhang and FIPR: Process Assumptions and Data
19
Appendices
Appendix A: Project Assumptions
The equipment assumptions include assumptions made about the separations the perform
as given by the data of Dr. Zhang. This is given in table A.1
Table A.1. Equipment assumptions
The economic assumptions range from CE plant cost index to operator pay. These
assumptions are based on Ulrich’s method for economic analysis or from various online source
for economics. These are shown in the table below.
Process Assumption Assumption Value
Feed Composition 97wt% Water, 3wt% Clay
Clay Separation 40wt% Clay recovery in Coase
Coarse Composition 15wt% Clay, 85wt% Water
30wt% Solid Recovery
70wt% REE Recovery
80wt% P2O5 Recovery
Fuel Oil Usage 1lb/Ton fed
H2SO4:CaO 4:1 Molar Ratio
REE Conversion 90%
P2O5 Conversion 95%
Fe Conversion 10%
Al Conversion 35%
Mg Conversion 20%
Operationg Temp 230⁰C
Residence Time 240minutes
Vacuum Filtration Moisture Contenet in Solids 10wt%
Solvent Extraction Organic:Aqueous 1:1 Mass Based
REE Recovery Organic:Aqueous 1:1 Mass Based
Conversion 100%
Oxalic Fed: Oxalic Needed 2:1 Molar Ratio
Conversion 100%
Temperature 900⁰C
Thermal Efficiency 75%
Percipitation
Calcination
Concentrate Recovery
Equipment Assumptions
Hydrocyclone
Flotation
Leaching

20
Table A.2: Some of our economic Assumptions
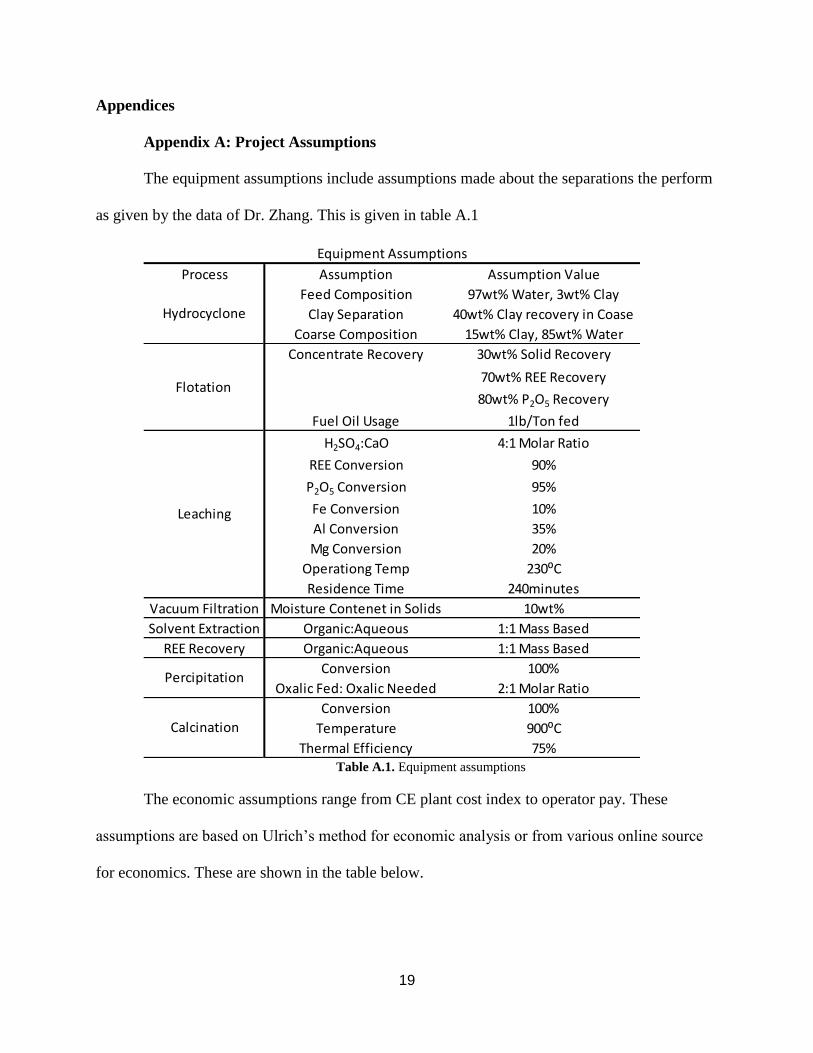
Appendix B: Mass and Energy Balance
One of the first major steps in this analysis was a full material balance and energy
balance. The material balance followed a basic steady state format of input equals output, which
can be shown in Equation B-1. The separation assumptions and conversions for each piece of
equipment can be found in Table A.1. Using this equation with each stream we get the results in
Table B.1a and Table B.1b.
Equation B.1: 𝐹𝑜𝑢𝑡 = 𝐹𝑖𝑛 + 𝐺𝑒𝑛𝑒𝑟𝑎𝑡𝑖𝑜𝑛
21
Table B.1a: Material Balance table for streams 1 through 12
1 2 3 4 5 6 7 8 9 10 11 12
Total* NA 16911889 15558938 1352951 138544.2 848.5834 1299497 191997.9 235381.4 43394.87 47284.4 188097 202254.8
H2O 18 16404532 15254524 1150008 138544.2 0 1150008 138544.2 139139.6 3037.641 3411.962 135727.6 14157.84
H2SO4 98.076 0 0 0 0 0 0 0 35041.7 40357.23 859.2881 34182.42 188097
H3PO4 97.998 0 0 0 0 0 0 0 12356.04 0 302.9932 12053.05 0
H2C2O4 90.038 0 0 0 0 0 0 0 0 0 0 0 0
P2O5 141.948 29394.02 17636.41 11757.61 0 0 2351.522 9406.087 470.3043 0 470.3043 0 0
Organic** NA 0 0 0 0 0 0 0 0 0 0 0 0
Air*** 29 0 0 0 0 848.5834 0 0 0 0 0 0 0
Fe2O3 159.69 10200.41 6120.245 4080.163 0 0 2856.114 1224.049 1101.644 0 1101.644 0 0
Fe2(SO4)3 399.87 0 0 0 0 0 0 0 306.5066 0 7.516116 298.9905 0
Al2O3 101.963 36317.56 21790.53 14527.02 0 0 10168.92 4358.107 2832.769 0 2832.769 0 0
Al2(SO4)3 342.143 0 0 0 0 0 0 0 5118.362 0 125.5118 4992.85 0
MgO 40.305 11328.52 6797.113 4531.408 0 0 3171.986 1359.423 1087.538 0 1087.538 0 0
MgSO4 120.365 0 0 0 0 0 0 0 811.9434 0 19.91037 792.033 0
CaO 56.078 48073.95 28844.37 19229.58 0 0 13460.71 5768.875 5768.875 0 5768.875 0 0
LnPO4 221.817 145.9235 87.55411 58.3694 0 0 17.51082 40.85858 4.085858 0 4.085858 0 0
Ln2(SO4)3 541.863 0 0 0 0 0 0 0 44.9148 0 1.101395 43.8134 0
Ln2(C2O4)3 516.259 0 0 0 0 0 0 0 0 0 0 0 0
Ln2O3 300.193 0 0 0 0 0 0 0 0 0 0 0 0
1000 1000 1000 1000 1.15 1000 1000 1169 1840 NA 1169 1781.2
19.7 10 10 10 10 10 40 10 40 10 10 10
25 25 25 25 25 25 25 25 25 25 25 25
* Total may not equal the sum of everything shown. Th and U were neglected, as well as Unreactive soluble and insoluble
** Includes a mixture of Exxal 12, Ligand A, and a other components for aid in REE extraction
*** Air is assumed to be 79% Nitrogen and 21% Oxygen
Density (kg/m3)
Streams (kg/hr)
Pressure (Bar)
Temperature (⁰C)
Component MW (kg/kmole)

22
Table B.1b: Second Half of Material Balance.
The next thing we were concerned with was the energy balance, specifically the energy
balance around the leaching vessel to determine our heating needs, and the energy balance
around the calciner for the natural gas needs. Starting with the leaching vessel the heat to raise
the material temperature came from the reaction and a steam heater. This lead to Equation B.2
shown below. The data for the steam comes from a large NIST steam table, where the steam is
used at 45barg from temperatures 900oC to 270oC. This is more than likely not realistic but it
was a possible operational range that gave us a realistic steam need. The heat of reaction was
determined based upon the chemical reaction given by Reaction B.1. This reaction we assumed
represented the phosphate reaction, since this reaction occurred at a higher molar quantity than
any of the other reactions. The specific heat of the fluid was assumed to be that of water since
water was such a high weight percentage.
𝑬𝒒𝒖𝒂𝒕𝒊𝒐𝒏 𝑩. 𝟐: − Δ𝐻𝑟𝑥𝑛 − Δ𝐻𝑠𝑡𝑒𝑎𝑚 = 𝐶𝑝 ∗ 𝑛 ∗ Δ𝑇
13 14 15 16 17 18 19 20 21 22 23 24
Total* NA 390304.1 390399.6 390399.6 390399.6 390447.1 44.3067 390491.4 390445.5 45.89979 1413.717 2267.272 24.12086
H2O 18 149885.4 0 0 390399.6 390399.6 1.329201 390400.9 390396.3 4.589401 0 85.52549 0
H2SO4 98.076 222279.4 0 0 0 0 0 23.40713 23.40685 0.000275 0 0.000275 0
H3PO4 97.998 12053.05 0 0 0 0 0 0 0 0 0 0 0
H2C2O4 90.038 0 0 0 0 0 42.9775 21.48875 21.4885 0.000253 0 0.000253 0
P2O5 141.948 0 0 0 0 0 0 0 0 0 0 0 0
Organic** NA 0 390351.8 390351.8 0 0 0 0 0 0 0 0 0
Air*** 29 0 0 0 0 0 0 0 0 0 1413.717 2062.343 0
Fe2O3 159.69 0 0 0 0 0 0 0 0 0 0 0 0
Fe2(SO4)3 399.87 298.9905 0 0 0 0 0 0 0 0 0 0 0
Al2O3 101.963 0 0 0 0 0 0 0 0 0 0 0 0
Al2(SO4)3 342.143 4992.85 0 0 0 0 0 0 0 0 0 0 0
MgO 40.305 0 0 0 0 0 0 0 0 0 0 0 0
MgSO4 120.365 792.033 0 0 0 0 0 0 0 0 0 0 0
CaO 56.078 0 0 0 0 0 0 0 0 0 0 0 0
LnPO4 221.817 0 0 0 0 0 0 0 0 0 0 0 0
Ln2(SO4)3 541.863 1.305888 42.50752 0.128354 0 42.37916 0 0 0 0 0 0 0
Ln2(C2O4)3 516.259 0 0 0 0 0 0 40.488 0 40.488 0 0 0
Ln2O3 300.193 0 0 0 0 0 0 0 0 0 0 0 23.54287
1501.7 791.8 791.8 1000 1000 1000 1000 1000 NA 1.18 1.15 NA
10 10 10 10 10 10 10 10 10 1 1 1
25 25 25 25 25 25 25 25 25 25 900 900
Density (kg/m3)
Streams (kg/hr)
Pressure (Bar)
Temperature (⁰C)
Component MW (kg/kmole)

23
𝑹𝒆𝒂𝒄𝒕𝒊𝒐𝒏 𝑩. 𝟏: 𝐶𝑎3(𝑃𝑂4)2 + 3𝐻2𝑆𝑂4 → 3𝐶𝑎𝑆𝑂4 + 2𝐻3𝑃𝑂4
Δ𝐻𝑟𝑥𝑛 = 𝑛𝑝ℎ𝑜𝑠𝑝ℎ𝑎𝑡𝑒 ∗ (hf,prod − ℎ𝑓,𝑟𝑒𝑎𝑐𝑡𝑎𝑛𝑡𝑠)
=62.95𝑘𝑚𝑜𝑙𝑒𝑠
ℎ𝑟
∗ (2 ∗ (−1271.7𝑘𝐽
𝑚𝑜𝑙) + 3 ∗ (−
1434.5𝑘𝐽
𝑚𝑜𝑙𝑒) − 3 ∗ (−
814𝑘𝐽
𝑚𝑜𝑙𝑒) − (−
4120.8𝑘𝐽
𝑚𝑜𝑙𝑒))
∗1000𝑚𝑜𝑙𝑒
𝑘𝑚𝑜𝑙𝑒= −4967.9𝑘𝑊
Δ𝐻𝑠𝑡𝑒𝑎𝑚 = 𝑚𝑠𝑡𝑒𝑎𝑚 ∗ (𝐻𝑓 − 𝐻𝑜) = 𝑚𝑠𝑡𝑒𝑎𝑚 ∗ (2846.7 − 4352.1) = −1505.4 ∗ 𝑚𝑠𝑡𝑒𝑎𝑚
𝐶𝑝𝑛 ∗ Δ𝑇 = (75.3𝑘𝐽
𝑘𝑚𝑜𝑙𝑒 ∗ 𝐾) ∗ (
2.322𝑘𝑚𝑜𝑙𝑒
sec) ∗ (2300𝐶 − 250𝐶) = 35843.553𝑘𝑊
4967.9𝑘𝑊 + 1505.4𝑚𝑠𝑡𝑒𝑎𝑚 = 35843.553𝑘𝑊 → 𝑚𝑠𝑡𝑒𝑎𝑚 = 20.5 𝑘𝑔/𝑠𝑒𝑐
The other portion we looked at was the energy required to heat air from ambient
temperature to 900oC required for the calcination process. The heat required is based on the
specific heat, since it is air we used the temperature dependent function for specific heat given by
Felder. The heat supply is based on the heat of reaction from natural gas, which we assumed was
nearly pure methane, at a 75% efficiency. This lead to Equation B.3 given below.
Equation B.3:
−𝑛𝑁𝐺 ∗ 𝜀𝑡ℎ𝑒𝑟𝑚𝑎𝑙 ∗ Δ𝐻𝑟𝑥𝑛 = 𝑛𝑎𝑖𝑟 ∫ 𝐶𝑝 1173𝐾
298𝐾
𝑑𝑇
𝑛𝑁𝐺 ∗ 𝜀𝑡ℎ𝑒𝑟𝑚𝑎𝑙 ∗ Δ𝐻𝑟𝑥𝑛 = 0.75 ∗ −802.3665𝑀𝐽
𝑘𝑚𝑜𝑙𝑒𝐶𝐻4∗ 𝑛𝑁𝐺 = −601.775𝑛𝑁𝐺

24
𝑛𝑎𝑖𝑟 ∫ 𝐶𝑝1173𝐾
298𝐾
𝑑𝑇
=992.26𝑘𝑚𝑜𝑙𝑒
ℎ𝑟
∗ ∫ 0.02809 + 1.96 ∗ 10−6𝑇 + 4.799 ∗ 10−9𝑇2 − 1.965 ∗ 10−12𝑇41173𝐾
298𝐾
𝑑𝑇
= 1345.4𝑀𝐽/ℎ𝑟
601.775𝑛𝑁𝐺 =1345.4𝑀𝐽
ℎ𝑟→ 𝑛𝑁𝐺 = 2.23𝑘𝑚𝑜𝑙𝑒/ℎ𝑟
Appendix C: Economic Results and Analysis
The first major portion for the economic analysis would be the required fixed capital for
the process. To determine this, we followed the method outlined by Ulrich. This method required
us to first determine the actual capital of each piece of equipment, which is shown in Appendix
C. The following step required the sum of the equipment capital with an assumption of two
pumps, one for the process and one for a backup. The remaining amount of fixed capital for a
non-grassroots plant was the capital related to contingency and fee, which is given by the
following equation:
Equation C.1: CC+CF=0.18*CBM
Where CC and CF are the associated capital of contingencies and fees and CBM is the total
equipment capital. From this, we can add the two together to get our non-grassroots plant fixed
capital, which is given by CTM in the table below to be about 26 million dollars.

25
Ye
ar 2
004
Ye
ar 2
017
Ga
s-So
lid C
on
tacto
rs
Calc
iner
B-1
90
$ 9
8,2
17.0
0
$ 1
33,3
29.5
8
10.0
$ 1
,333,2
95.7
8
1,3
33,2
95.7
8$
To
tal G
as-S
olid
Co
nta
cto
rs $
1,3
33,2
95.7
8
Pro
ce
ss Ve
sselsF
lota
tion T
ow
er
D-1
20
$ 3
8,0
00.0
0
$ 5
1,5
85.0
0
5.0
0 $
257,9
25.0
0
257,9
25.0
0$
Flo
tatio
n T
ow
er T
rays
$ 1
6,0
00.0
0
$ 2
1,7
20.0
0
2.2
0 $
47,7
84.0
0
47,7
84.0
0$
Solve
nt E
xtra
cto
rD
-150
$ 5
96,2
67.9
4
$ 8
09,4
33.7
3
1.0
0 $
809,4
33.7
3
809,4
33.7
3$
RE
E S
tripper
D-1
60
$ 6
99,6
03.5
0
$ 9
49,7
11.7
5
1.0
0 $
949,7
11.7
5
949,7
11.7
5$
To
tal P
roce
ss Ve
ssels
$ 2
,064,8
54.4
7
Re
acto
rs
Leachin
g V
essel
R-1
30
$ 3
20,0
00.0
0
$ 4
34,4
00.0
0
16.0
$ 6
,950,4
00.0
0
6,9
50,4
00.0
0$
Leaching Vessel A
gitators124,000.00
$ 168,330.00
$ 2.5
$ 4
20,8
25.0
0
420,8
25.0
0$
To
tal R
ea
cto
rs $
7,3
71,2
25.0
0
Se
pa
rato
rs
Hydro
cyclo
ne
H-1
10
1,2
67,6
14.3
1$
1,7
20,7
86.4
3$
3.0
5,1
62,3
59.3
0$
5,1
62,3
59.3
0$
Vacuum
Filte
r for L
eachate
H-1
40
70,0
00.0
0$
95,0
25.0
0$
3.6
342,0
90.0
0$
342,0
90.0
0$
Pre
cip
itato
rH
-170
150,0
00.0
0$
203,6
25.0
0$
7.0
1,4
25,3
75.0
0$
1,4
25,3
75.0
0$
Pre
cip
itato
r Agita
tor
15,0
00.0
0$
20,3
62.5
0$
2.5
50,9
06.2
5$
50,9
06.2
5$
Vacum
m F
ilter fo
r Calc
iner
H-1
80
100,0
00.0
0$
135,7
50.0
0$
3.6
488,7
00.0
0$
488,7
00.0
0$
To
we
r To
tal
$ 7
,469,4
30.5
5
CA
PIT
AL
CO
ST
SU
MM
AR
YD
ate
to w
hic
h e
stim
ate
applie
s 2
017
Locatio
n: F
lorid
a
Cost In
dex T
ype: C
E P
lant C
ost In
dex
Eq
uip
me
nt Id
en
tifica
tion
Nu
mb
er
Ca
pa
city
or S
ize
Sp
ecific
atio
ns
Pu
rch
ase
d E
qu
ipm
en
t Co
st
(ba
se m
ate
rial)
Actu
al B
are
Mo
du
le
Fa
cto
r, FB
M
Actu
al B
are
Mo
du
le C
ost, C
BM
T
ota
l
Insid
e V
olu
me is
1700m
3, Dia
mete
r=4.5
mete
rs
5 S
tage M
ixer S
ettle
r, with
a s
ettlin
g a
rea o
f 140m
2
7 S
tage M
ixer S
ettle
r, with
a s
ettlin
g a
rea o
f 163m
2
Tw
o, 4
03m
3 Tanks
Two A
gitators for leaching vessel, both 48.5 kW
Jo
b title
: Ra
re E
arth
Ele
me
nt R
eco
ve
ry P
lan
t
Cost In
dex V
alu
e:
72m
heig
ht, 3
.5m
dia
mete
r
Sta
inle
ss S
teel T
rays
Used to
separa
te th
e C
lay, h
andle
s 4
.7m
3/sec
A p
ressure
vessel w
ith a
volu
me o
f about 7
28m
3
A b
elt filte
r, made to
handle
about 0
.1 m
3/s
ec
A b
elt filte
r, made to
handle
about 0
.06m
3/sec
Agita
tor fo
r pre
cip
itor, u
ses 9
.6kW

26
Table C.1: Plant Fixed Capital with equipment capital shown
Pu
mp
s
Hydro
cyclo
ne F
eed
L-1
11A
165,0
00.0
0$
223,9
87.5
0$
4.3
951,9
46.8
8$
951,9
46.8
8$
Hydro
cyclo
ne F
eed (b
ackup)
L-1
11B
165,0
00.0
0$
223,9
87.5
0$
4.3
951,9
46.8
8$
951,9
46.8
8$
Wash W
ate
r Pum
pL-1
21A
4,0
00.0
0$
5,4
30.0
0$
5.0
27,1
50.0
0$
27,1
50.0
0$
Wash W
ate
r Pum
p (b
ackup)
L-1
21B
4,0
00.0
0$
5,4
30.0
0$
5.0
27,1
50.0
0$
27,1
50.0
0$
Leacher C
oncentra
te
L-1
31A
30,0
00.0
0$
40,7
25.0
0$
5.2
209,7
33.7
5$
209,7
33.7
5$
Leacher C
oncentra
te (b
ackup)
L-1
31B
30,0
00.0
0$
40,7
25.0
0$
5.2
209,7
33.7
5$
209,7
33.7
5$
Leacher A
cid
Feed
L-1
32A
18,0
00.0
0$
24,4
35.0
0$
6.3
153,3
29.6
3$
153,3
29.6
3$
Leacher A
cid
Feed (b
ackup)
L-1
32B
18,0
00.0
0$
24,4
35.0
0$
6.3
153,3
29.6
3$
153,3
29.6
3$
Filte
red L
eachate
Feed
L-1
51A
18,5
00.0
0$
25,1
13.7
5$
5.0
125,5
68.7
5$
125,5
68.7
5$
Filte
red L
eachate
(backup)
L-1
51B
18,5
00.0
0$
25,1
13.7
5$
5.0
125,5
68.7
5$
125,5
68.7
5$
Extra
ctio
n A
cid
Feed
L-1
52A
16,0
00.0
0$
21,7
20.0
0$
5.0
108,6
00.0
0$
108,6
00.0
0$
Extra
ctio
n A
cid
Feed (b
ackup)
L-1
52B
16,0
00.0
0$
21,7
20.0
0$
5.0
108,6
00.0
0$
108,6
00.0
0$
Org
anic
Feed
L-1
61A
27,0
00.0
0$
36,6
52.5
0$
4.3
155,7
73.1
3$
155,7
73.1
3$
Org
anic
Feed (b
ackup)
L-1
61B
27,0
00.0
0$
36,6
52.5
0$
4.3
155,7
73.1
3$
155,7
73.1
3$
Strip
pin
g W
ate
rL-1
62A
25,0
00.0
0$
33,9
37.5
0$
4.3
144,2
34.3
8$
144,2
34.3
8$
Strip
pin
g W
ate
r (backup)
L-1
62B
25,0
00.0
0$
33,9
37.5
0$
4.3
144,2
34.3
8$
144,2
34.3
8$
Oxalic
Acid
Feed
L-1
71A
10,0
00.0
0$
13,5
75.0
0$
4.9
66,5
17.5
0$
66,5
17.5
0$
Oxalic
Acid
Feed (b
ackup)
L-1
71B
10,0
00.0
0$
13,5
75.0
0$
4.9
66,5
17.5
0$
66,5
17.5
0$
Calc
iner A
ir Feed
G-1
91A
1,5
24.0
0$
2,0
68.8
3$
2.2
4,5
51.4
3$
4,5
51.4
3$
Calc
iner A
ir Feed (b
ackup)
G-1
91B
1,5
24.0
0$
2,0
68.8
3$
2.2
4,5
51.4
3$
4,5
51.4
3$
To
tal P
um
ps
$ 3
,894,8
10.8
5
Tota
l bare
module
cost
$22,1
33,6
17
Contin
gency a
nd fe
e$3,9
84,0
51
Tota
l module
cost
$26,1
17,6
68
Auxilia
ry (o
ffsite
) Facilitie
s$6,6
40,0
85
Gra
ss R
oots
capita
l$32,7
57,7
53
Base m
ate
rials
, CTB
M =
S C
BM =
A 1
.15 k
W p
um
p
CG
R =
*2004 c
ost x
(Targ
et Y
ear C
ost In
dex/2
004 C
ost In
dex)
Actu
al m
ate
rials
, CTB
M =
S C
BM =
CC +
CF =
CTB
M x
0.1
8 =
CTM =
CTB
M x
0.3
0 =
A 3
31 k
W A
xia
l Fan
A 3
31 k
W A
xia
l Fan
A 2
91 k
W p
um
p
A 2
91 k
W p
um
p
A 5
1.8
kW
Pum
p
A 5
1.8
kW
Pum
p
A 1
30 k
W P
um
p
A 5
pum
p s
et, e
ach w
ith 2
12 k
W
A 5 pum
p set, each with 212 kW
A 1
.15 k
W p
um
p
A 1
30 k
W P
um
p
A 1
7 k
W P
um
p
A 1
7 k
W P
um
p
A 5
8 k
W P
um
p
A 5
8 k
W P
um
p
A 4
2 k
W P
um
p
A 4
2 k
W P
um
p
A 1
61 k
W P
um
p
A 1
61 k
W P
um
p

27
The next step was determining the annual manufacturing cost, revenue from sales, and
net annual profit after taxes. Most of the calculation assumptions are either given in the table
below or in appendix A. A big thing to keep in mind is that byproduct revenue is calculated with
direct manufacturing expenses, which indicates a negative overall manufacturing expense.

28
Table C.2: Manufacturing Expense Calculation Table
26,117,667.65$
3,917,650.15$
30,035,317.79$
$/yr $/yr
2,671,294.59$
(47,506,839.12)$
598,520.32$
1,260,000.00$
189,000.00$
Steam 581,053,822.78 kg/y 45 barg @ 0.012195 $/kg 7,086,126.38$
Electricity 34,977,290.05 kWh @ 0.1 $/kWh 3,423,822.89$
Process water 4,170,192.83 m3 @ 1.1 $/m3 4,584,448.63$
Natural Gas 14,142.75 GJ @ 2.73 $/GJ 38,605.50$
1,567,060.06$
235,059.01$
189,000.00$
714.25$
(25,663,187.48)$ (25,663,187.48)$
1,809,636.04$
391,765.01$
391,765.01$
2,593,166.06$ 2,593,166.06$
(23,070,021.42)$ (23,070,021.42)$
452,409.01$
14,285.00$
714.25$
467,408.26$ 467,408.26$
2,611,766.76$
(19,990,846.39)$ (19,990,846.39)$
Revenue from Sales ( 185,101.53 kg/yr @ 10.00 $/kg), As 1,851,015.33$
21,841,861.73$
7,426,232.99$
14,415,628.74$
71.99 %Aftertax rate of return, i = (1.5 A NNP /C TC ) x 100 =
Administrative costs (25% of overhead)
Distribution and selling (10% of total expense)
Direct
Raw materials
By-product credits
Catalysts and solvents
Local taxes (1.5% of fixed capital)
Insurance (1.5% of fixed capital)
Annual Cost
Indirect
Overhead (payroll and plant), packaging,
storage (60% of op. Labor+supervision+
maint.)
Income taxes (net annual profit times the tax rate), A IT
Net annual profit after taxes (A NP -A IT ), A NNP
Manufacturing Expenses
Operating labor
Supervisory and clerical labor (15% of operating labor)
Utilities
Research and development (5% of total expense)
Total general expense, A GE
Patents and royalties (5% of total expense)
Total, A DME
Maintenance and repairs (6% of fixed capital)
Operating supplies (15% of maint & repairs)
Laboratory charges (15% of operating labor)
Net annual profit, A NP
Depreciation (approximately 10% of fixed capital), A BD
Total Expenses, A TE
Total, A IME
Total manufacturing expense, A ME =A DME +A IME
General Expenses
Fixed capital, CFC
MANUFACTURING COST SUMMARY
Working capital (15% of fixed capital), CWC
Total capital investment, CTC
Job Title Rare Earth Element Recovery Plant
Location Florida Annual Capacity (kg/yr) 4,000,000,000 Waste Clay/year
Effective Date to Which Estimate Applies 2017 Cost Index Type CE Plant Cost Index
Cost Index Value 543
Capital

29
Appendix D: Equipment Design and Costing
1. Hydrocyclone (H-110): The sizing and costing of the hydrocyclone was based on an
estimation from Weir Minerals. The important thing here is that the capital for the
hydrocyclone is based on flow input, not physical dimensions. This meant we could
estimate the capital using Equations D.1 shown below. The capital is represented by Cp,
which does not consider the material of construction, Fbm. The actual capital is given as
Cbm, which is the product of Cp and Fbm. Fbm is determined to be a material factor,
which for carbon steel construction was 3. The next portion was determining the cost and
size of the feed pumps. Using figures 5.49, 5.50, and 5.51 from Ulrich, the cost of the
pumps is based on input shaft power. Equations D.2 and D.3 show how shaft power and
pump efficiency were determined. Also pump power would be required for the electricity
consumption, which is shown below in Equation D.4. Through our initial design, it was
determined that for a centrifugal pump the feed rate was far too much for one pump. We
then determined that it would require 5 feed pump to meet our feed rate demand. The
calculations below for shaft work and power are shown for one of these pump, the capital
for the pump system is given for the whole set of feed pump. This is the only place we
show an example calculation for the pumps as they all follow the same procedure.
𝐶𝐶 + 𝐶𝐹 = 0.18 ∗ 𝐶𝐵𝑀
𝑬𝒒𝒖𝒂𝒕𝒊𝒐𝒏 𝑫. 𝟏: 𝐶𝑝, ℎ𝑐 = $200,000 ∗𝑞
546𝐿sec
𝑞 =�̇�
𝜌, 𝑤ℎ𝑒𝑟𝑒 �̇� 𝑖𝑠 𝑔𝑖𝑣𝑒𝑛 𝑎𝑠
16911889𝑘𝑔
ℎ𝑟𝑔𝑖𝑣𝑒𝑛 𝑏𝑦 𝑚𝑎𝑠𝑠 𝑏𝑎𝑙𝑎𝑛𝑐𝑒
𝑞 =16911.88𝑚3
ℎ𝑟=
4697.7𝐿
𝑠𝑒𝑐
𝐶𝑝, ℎ𝑐 = $200,000 ∗
4697.7𝐿sec
546𝐿sec
= $1,720,786.43
𝐶𝑏𝑚 = 𝐹𝑏𝑚 ∗ 𝐶𝑝 = 3 ∗ $1,720,786.43 = $5,162,359.30
30
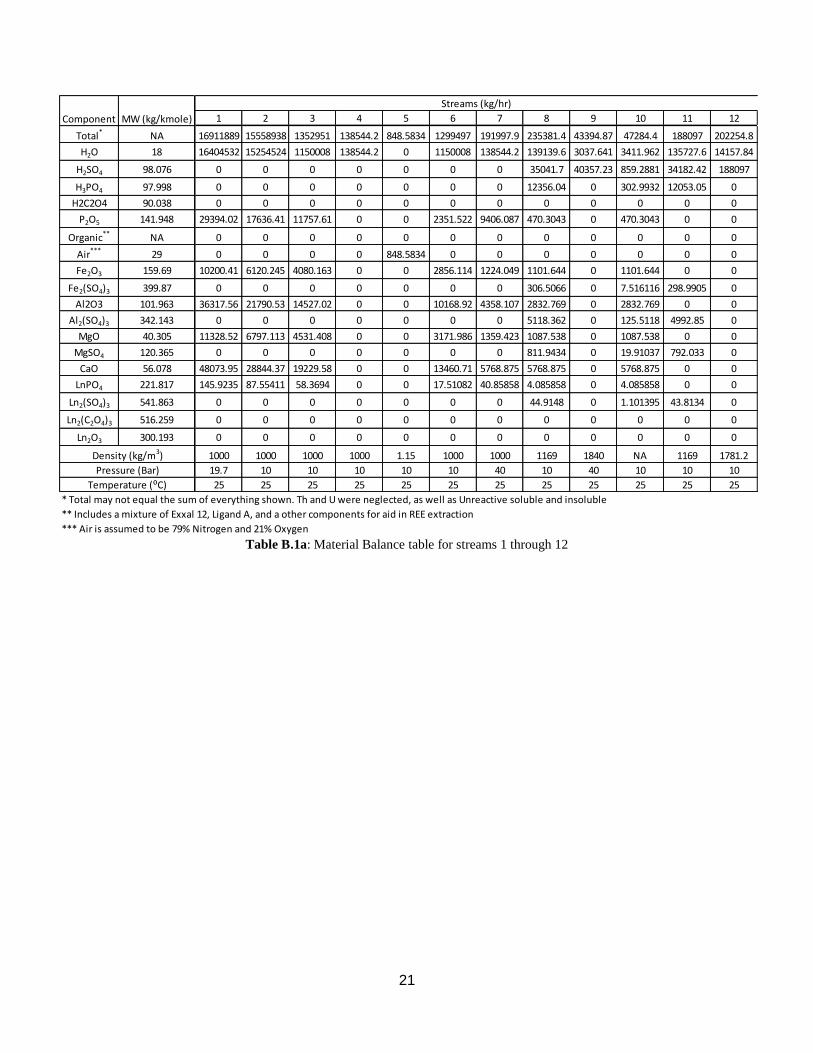
𝑬𝒒𝒖𝒂𝒕𝒊𝒐𝒏 𝑫. 𝟐: 𝑊𝑠 = 𝑞 ∗∆𝑝
𝜀𝑖, 𝑤ℎ𝑒𝑟𝑒 𝜀𝑖 𝑖𝑠 𝑡ℎ𝑒 𝑝𝑢𝑚𝑝 𝑒𝑓𝑓𝑖𝑐𝑖𝑒𝑛𝑐𝑦
𝑬𝒒𝒖𝒂𝒕𝒊𝒐𝒏 𝑫. 𝟑: 𝜀𝑖 = (1 − 0.12𝑞−0.27)(1 − 𝜇0.8)
= (1 − 0.12 ∗ (0.94𝑚3
𝑠)
−0.27
) ∗ (1 − 0.00089𝑃𝑎 ∗ 𝑠0.8) = 0.875
𝑊𝑠 =0.94𝑚3
𝑠𝑒𝑐∗
197𝑘𝑃𝑎
0.875= 211.5𝑘𝑊
𝑬𝒒𝒖𝒂𝒕𝒊𝒐𝒏 𝑫. 𝟒: 𝑃 =𝑊𝑠
𝜀𝑑=
211.5𝑘𝑊
0.9= 235.1𝑘𝑊
𝐶𝑏𝑚 = 𝐶𝑝 ∗ 𝐹𝑏𝑚 ∗ 543/400
𝐶𝑏𝑚 = 5 ∗ ($33,000.00 ∗ 4.25 ∗543
400) = $951,946.88
2. Flotation Tower (D-120): For the costing of the flotation tower we determine, with the
advisement of Dr. Counce, that it would be best to cost it as a pressure vessel with a gas
sparger and two sieve trays per column. This lead to us needing to size the column, which
a procedure for flotation columns was given by J.B. Yianatos, where equations are given
below. Due to the amount of material being processed, we determined that two flotation
columns would need to be used to meet limitations for costing given by Ulrich. The
material of construction for the sieve trays were stainless steel and for the vessel it was
carbon steel. We also needed to determine the power usage, which is given below for the
gas sparger.
Equation D.5:
𝑓𝑙𝑜𝑡 = 𝑞 ∗ 𝑟𝑒𝑠 = 30𝑚𝑖𝑛𝑢𝑡𝑒𝑠 ∗22.549𝑚3
𝑠𝑒𝑐= 676.47𝑚3
𝐻
𝐷= 10; 𝐷 = 3.5𝑚 , 𝐻 = 35𝑚
𝐶𝑏𝑚, 𝑣𝑒𝑠 = 2 ∗ ($19,000 ∗ 5 ∗543
400) = $257,925.00
𝐶𝑏𝑚, 𝑠𝑣𝑡 = 2 ∗ ($8,000 ∗ 2.2 ∗ 2 ∗ 1.6 ∗ 543/400) = $152,908.80
𝐶𝑏𝑚, 𝑓𝑙𝑜𝑡 = $257,925.00 + $152,908.80 = $410,833.80

31
𝑃𝑜𝑤𝑒𝑟 𝑜𝑓 𝐺𝑎𝑠 𝑆𝑝𝑎𝑟𝑔𝑒𝑟 = 𝑚𝑎𝑖𝑟 ∗ 06 ∗Δ𝑝
𝜌= 0.6 ∗ 𝑞𝑎𝑖𝑟 ∗ Δ𝑝
𝑆𝐺𝑅 =
2𝑐𝑚3
𝑐𝑚2
𝑠𝑒𝑐=
𝑞𝑎𝑖𝑟
𝐴𝑐𝑟𝑜𝑠𝑠→ 𝑞𝑎𝑖𝑟 =
0.02𝑚
𝑠𝑒𝑐∗ 𝜋 ∗ (
3.5𝑚
2)
2
=0.192𝑚3
𝑠𝑒𝑐
𝑃𝑜𝑤𝑒𝑟 𝑜𝑓 𝐺𝑎𝑠 𝑆𝑝𝑎𝑟𝑔𝑒𝑟 = 0.6 ∗ (0.192𝑚3
𝑠) ∗ 167𝑘𝑃𝑎 = 28.92𝑘𝑊
3. Leaching Vessel (R-130): The costing for the leaching vessel was done using figures
5.42, 5.44, 5.45, and 5.46 from Ulrich. They give costing information for an agitator and
a pressure vessel. The cost is heavily dependent on the volume and diameters. For the
vessel, the requirements were a 240-minute residence time for a 90% conversion of REE
phosphates. It also important to note that the leaching vessel needed to operate at 40barg
due to the temperature being at 230oC. Using Equation D.5 from the flotation section the
volume was determined. Again, due to limitations from the costing by Ulrich, we
determined two vessels in series would be used. The capital is given below for both the
agitator and vessel and then they are added together and multiplied by two to get the total
leaching capital. For operating cost, we needed to know the power requirements for the
agitator, which is given by Equation D.6 below.
𝑉𝑙𝑒𝑎𝑐ℎ𝑒𝑟 = 𝑞 ∗ 𝑅𝑒𝑠 =201.35𝑚3
ℎ𝑟∗ 240𝑚𝑖𝑛 ∗ (
1ℎ𝑟
60𝑚𝑖𝑛) = 805.7𝑚3
𝐻 =𝑉
𝐴𝑐𝑟𝑜𝑠𝑠; 𝐷𝑖𝑎𝑚𝑒𝑡𝑒𝑟 = 4𝑚; 𝐻 = 32𝑚
Equation D.6: 𝑃𝑜𝑤𝑒𝑟 𝑜𝑓 𝐴𝑔𝑖𝑡𝑎𝑡𝑜𝑟 = 0.4 ∗ 𝑉0.8 = 0.4 ∗ (𝑉𝑡𝑜𝑡
𝑛𝑡𝑎𝑛𝑘𝑠)
0.8= 0.4 ∗ (
805.7𝑚3
2)
0.8
= 48.53𝑘𝑊
𝐶𝑏𝑚, 𝑎𝑔 = 2 ∗ (𝐶𝑝, 𝑎𝑔 ∗ 𝐹𝑏𝑚 ∗ 543/400) = 2 ∗ ($62,000 ∗ 2.5 ∗ 543/400) = $420,825.00
𝐶𝑏𝑚, 𝑣𝑒𝑠 = 2 ∗ (𝐶𝑝, 𝑣𝑒𝑠 ∗ 𝐹𝑏𝑚 ∗ 543/400) = 2 ∗ (16 ∗ $160,000.00 ∗ 543/400) = $6,950,400.00

32
𝐶𝑏𝑚, 𝐿𝑒𝑎𝑐ℎ𝑒𝑟 = $420,825.00 + $6,950,400.00 = $7,371,225.00
4. Leachate Filter (H-140): The separation of solids and the aqueous is done by a belt
vacuum filter. The costing of this filter is done using Ulrich’s method, which is based on
the filter area. This was determined using Equation D.7 shown below, which is given by
Ulrich for a belt filter. The operating cost was based on power usage, which is given by
Equation D.8 from Ulrich.
Equation D.7: 𝑞
𝐴𝑓𝑖𝑙𝑡𝑒𝑟= 0.01 → 𝐴𝑓𝑖𝑙𝑡𝑒𝑟 = 0.01 ∗ 𝑞 = 0.01 ∗
0.0559𝑚3
𝑠= 5.59𝑚2
𝑃𝑜𝑤𝑒𝑟 = 𝐴0.75 = 5.59𝑚20.75= 3.64𝑘𝑊
𝐶𝑏𝑚 = 𝐶𝑝 ∗ 𝐹𝑏𝑚 ∗543
400= $70,000 ∗ 3.6 ∗
543
400= $342,090.00
5. Solvent Extractor (D-150): This equipment allowed us to take and remove all our REEs
from the aqueous stream, which we were then getting a byproduct credit for the
phosphoric acid produced. The method for determining the needed number of stages was
using the Kremser equation as it was given in Geankpolis. The design equations for the
Mixer settlers used were given by a representative of Cytec Industries and are shown
below. In this was also costing information and power requirements for the mixer settlers.
𝑉𝑜𝑙𝑢𝑚𝑒 = 𝑁𝑠𝑡𝑎𝑔𝑒𝑠 ∗ 𝑞𝑡𝑜𝑡 ∗ 𝑟𝑒𝑠𝑡𝑖𝑚𝑒 = 5 ∗0.193𝑚3
𝑠𝑒𝑐∗ 2𝑚𝑖𝑛𝑢𝑡𝑒𝑠 ∗
60𝑠𝑒𝑐
𝑚𝑖𝑛= 115.78𝑚3
𝑇𝑜𝑡𝑎𝑙 𝑃𝑜𝑤𝑒𝑟 =0.03𝐻𝑝
𝑔𝑎𝑙∗
264.172𝑔𝑎𝑙
𝑚3∗
1𝑘𝑊
1.34𝐻𝑃∗ 115.78𝑚3 = 943.3𝑘𝑊
𝑆𝑒𝑡𝑡𝑙𝑖𝑛𝑔 𝐴𝑟𝑒𝑎 =
694.7𝑚3
ℎ𝑟5𝑚ℎ𝑟
= 138.9𝑚2
𝐶𝑏𝑚 =$5372
𝑚2∗ 138.9𝑚2 = $727,964.58

33
6. REE Stripper (D-160): This process had the purpose of removing the REEs from the
organic phase into a water phase, this way we could recycle the organic for cheaper
operation. The design equations are the same as above.
𝑉𝑜𝑙𝑢𝑚𝑒 = 𝑁𝑠𝑡𝑎𝑔𝑒𝑠 ∗ 𝑞𝑡𝑜𝑡 ∗ 𝑟𝑒𝑠𝑡𝑖𝑚𝑒 = 7 ∗0.226𝑚3
𝑠𝑒𝑐∗ 2𝑚𝑖𝑛𝑢𝑡𝑒𝑠 ∗
60𝑠𝑒𝑐
𝑚𝑖𝑛= 190.188𝑚3
𝑇𝑜𝑡𝑎𝑙 𝑃𝑜𝑤𝑒𝑟 =0.03𝐻𝑝
𝑔𝑎𝑙∗
264.172𝑔𝑎𝑙
𝑚3∗
1𝑘𝑊
1.34𝐻𝑃∗ 190.188𝑚3 = 1123.97𝑘𝑊
𝑆𝑒𝑡𝑡𝑙𝑖𝑛𝑔 𝐴𝑟𝑒𝑎 =
815.1𝑚3
ℎ𝑟5𝑚ℎ𝑟
= 163𝑚2
𝐶𝑏𝑚 =$5372
𝑚2∗ 163𝑚2 = $876,227.30
7. Precipitator (H-170): The process of removing the REE from the aqueous phase started
with a precipitator. This assumed to be done using an agitated process vessel. Costing,
done by the Ulrich method, required the volume and height of the tank. This was done
using Equation D.5 from above in the flotation section. The residence time used was
picked so that we would not need multiple vessels as there was not an existing
assumption. The power usage for the agitator was done using Equation D.6 from the
leaching section.
𝑉 = 𝑞𝑡𝑜𝑡 ∗ 𝑅𝑒𝑠 =(360.23 + 0.041)𝑚3
ℎ𝑟∗ 50𝑚𝑖𝑛 ∗ (
1ℎ𝑟
60𝑚𝑖𝑛) = 300.2𝑚3
𝐷 = 4𝑚, 𝐻 =𝑉
𝜋4
∗ 𝐷2=
300.2𝑚3
𝜋4
∗ 42𝑚2= 24𝑚
𝑃𝑜𝑤𝑒𝑟 𝑜𝑓 𝐴𝑔𝑖𝑡𝑎𝑡𝑜𝑟 = 0.4 ∗ 𝑉0.8 = 0.4 ∗ 300.2𝑚30.75= 9.6𝑘𝑊
𝐶𝑏𝑚, 𝑡𝑜𝑡 = (𝐶𝑝, 𝑣𝑒𝑠 ∗ 𝐹𝑏𝑚, 𝑣𝑒𝑠 + 𝐶𝑝, 𝑎𝑔 ∗ 𝐹𝑏𝑚, 𝑎𝑔) ∗543
400= ($130,000 ∗ 7 + $15,000 ∗ 2.5) ∗
543
400= $1,286,231.25
8. Precipitation Filter (H-180): This process removed the REE oxalates from the aqueous
waste in the same fashion as the leachate filter, using a vacuum belt filter.
𝑞
𝐴𝑓𝑖𝑙𝑡𝑒𝑟= 0.01 → 𝐴𝑓𝑖𝑙𝑡𝑒𝑟 = 0.01 ∗ 𝑞 = 0.01 ∗
0.1𝑚3
𝑠= 10𝑚2
34
𝑃𝑜𝑤𝑒𝑟 = 𝐴0.75 = 10𝑚20.75= 5.63𝑘𝑊
𝐶𝑏𝑚 = 𝐶𝑝 ∗ 𝐹𝑏𝑚 ∗543
400= $100,000 ∗ 3.6 ∗
543
400= $488,700.00
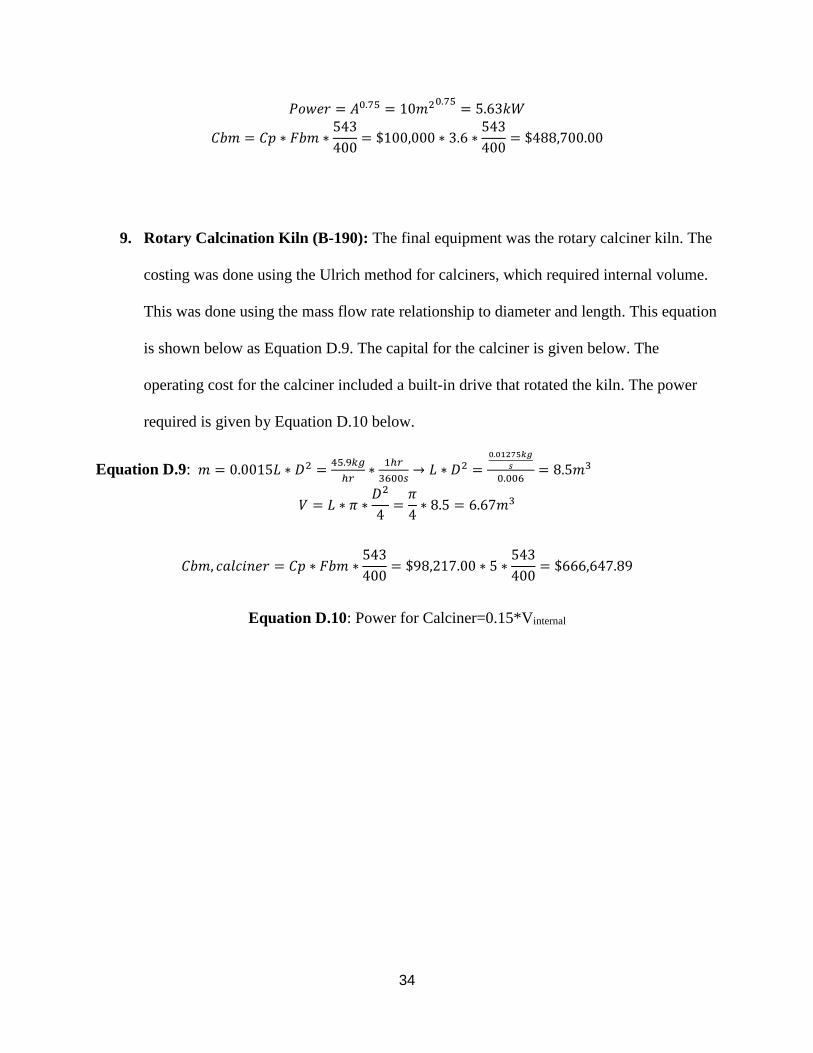
9. Rotary Calcination Kiln (B-190): The final equipment was the rotary calciner kiln. The
costing was done using the Ulrich method for calciners, which required internal volume.
This was done using the mass flow rate relationship to diameter and length. This equation
is shown below as Equation D.9. The capital for the calciner is given below. The
operating cost for the calciner included a built-in drive that rotated the kiln. The power
required is given by Equation D.10 below.
Equation D.9: 𝑚 = 0.0015𝐿 ∗ 𝐷2 =45.9𝑘𝑔
ℎ𝑟∗
1ℎ𝑟
3600𝑠→ 𝐿 ∗ 𝐷2 =
0.01275𝑘𝑔
𝑠
0.006= 8.5𝑚3
𝑉 = 𝐿 ∗ 𝜋 ∗𝐷2
4=
𝜋
4∗ 8.5 = 6.67𝑚3
𝐶𝑏𝑚, 𝑐𝑎𝑙𝑐𝑖𝑛𝑒𝑟 = 𝐶𝑝 ∗ 𝐹𝑏𝑚 ∗543
400= $98,217.00 ∗ 5 ∗
543
400= $666,647.89
Equation D.10: Power for Calciner=0.15*Vinternal

35
Appendix E: Distribution Coefficients and Clay Composition
Table E.1: Composition of Clay

36
Table E.2: Extraction and Stripping Process Distribution Coefficients


![Extraction of Rare Earth Elements from Permanent …...magnet scraps [5, 6]. The conventional ways to extract rare earth elements from permanent magnet are mainly based on hydrometal-lurgical](https://img.pdfslide.net/doc/110x75/5fb4abc5030aba005d23ad28/extraction-of-rare-earth-elements-from-permanent-magnet-scraps-5-6-the-conventional.jpg)