Embed Size (px)
Citation preview

Economic Analysis
of the Fuel Cycle Options
Considered in Korea
Hyo On Nam
2019.11.05.
Korea Atomic Energy Research Institute

2

Nuclear Energy in Korea
3
Site
Gori
Wolseong
Hanbit
Hanul
Total
In Operation(MWe)
7 (7,350)
6 (4,779)
6 (5,900)
6 (5,900)
25 (23,929)
UnderConstruction
(MWe)
2 (2,800)
-
-
2 (2,800)
4 (5,600)
Total(MWe)
9 (10,150)
6 (4,779)
6 (5,900)
8 (8,700)
29 (29,529)
As of Oct, 2019
Nuclear
23.4%Fossil Fuel
69.7%
Hydro, etc
6.9%
Source : www. epsis.kpx.or.kr
Source : www. khnp.co.kr
Ratio of Electricity Generation(2018)
25 NPPs are operating (2019.10)
* Early closure of Wolseong unit 1 was decided, and currently is not generating an electricity • Provide 23.4% (133,505 GWh) of total electricity in 2018
Wolseong (#1,2,3,4)
Shin-Wolseong (#1,2)
Hanul (#1,2,3,4,5,6)
Shin-Hanul (#1,2)
Gori (#2,3,4)
Shin-Gori (#1,2,3)
Shin-Gori (#4,5,6)
Hanbit
(#1,2,3,4,5,6)
◆ Under Construction
− APR1400 : Shin-Gori (#4,5,6), Shin-Hanul(#1,2)

Spent Nuclear Fuel Generation
4
Current status of SF storage (As of Dec. 2018)
– All PWR spent fuels are stored in the pool of NPP sites
– Some of CANDU spent fuels are stored in AR dry storage
– On-site SF storage is being saturated
Sites CapacityCurrent
storage
Saturation
Rate
Expected
saturation*
PWR
Kori 8,115 6,271 77.3% 2031 (2025)
Saewool 780 100 12.8% 2065
Hanbit 9,017 6,302 67.7% 2029
Hanul 7,066 5,531 78.3% 2030
Shin-Wolsong 1,046 386 36.9% 2042
Sum 26,024 18,590 71.4% -
CANDU Wolsong 499,632 451,260 90.3% 2021
(unit: assembly/bundle)
(about 16,600 tHM) * Estimated by KEEI in 2019
Overview of National Programme
5
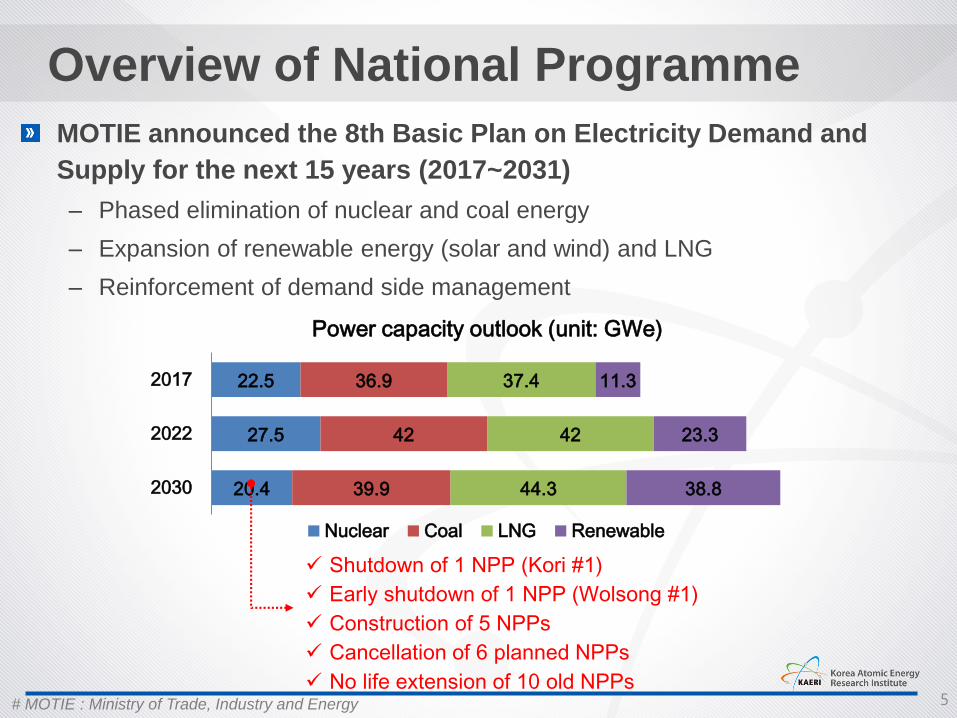
MOTIE announced the 8th Basic Plan on Electricity Demand and
Supply for the next 15 years (2017~2031)
– Phased elimination of nuclear and coal energy
– Expansion of renewable energy (solar and wind) and LNG
– Reinforcement of demand side management
# MOTIE : Ministry of Trade, Industry and Energy
22.5
27.5
20.4
36.9
42
39.9
37.4
42
44.3
11.3
23.3
38.8
2017
2022
2030
Power capacity outlook (unit: GWe)
Nuclear Coal LNG Renewable
✓ Shutdown of 1 NPP (Kori #1)
✓ Early shutdown of 1 NPP (Wolsong #1)
✓ Construction of 5 NPPs
✓ Cancellation of 6 planned NPPs
✓ No life extension of 10 old NPPs

National Framework for RWM in Korea
6
Regulatory
Work
Nuclear Mat’l
Control
President
Prime Minister
✓ Responsible for basic and
fundamental technologies
development for AFC and other
future reactor system
※ ACRONYMS
AEC: Atomic Energy Commission
NSSC: Nuclear Safety and Security Commission
KINS: Korea Institute of Nuclear Safety
KINAC: Korea Institute of Nuclear Nonproliferation and Control
KHNP: Korea Hydro & Nuclear Power Co.
KORAD: Korea Radioactive waste Agency
KAERI: Korea Atomic Energy Research Institute
Korea Atomic Energy
Research Institute
Atomc Energy
Commisssion
NSSC (Nuclear Safety and
Security Commission)
Regulator
Implementer & Promoter
A/E + NSSS
Design
Nuclear
Fuel Supply
✓ Responsible for the
management of all kinds of
radioactive waste
produced in Korea
including R&D projects
related to transportation,
storage and disposal.
Korea Radioactive
Waste Agency
Electric Power
Co.
Hydro & Nuclear
Power Co.
Ministry of Trade, Industry
and Energy (MOTIE)
Ministry of Science
and ICT (MSIT)

Overview of National Programme
7
Public Engagement Commission on SNF (PECOS)

Overview of National Programme
Master Plan for HLW Management (2016.07)
8
Overview of National Programme
9
Reconsideration of National SF Management Programme
– (2017/6) President Moon’s 5-year-plan included the reexamination of
spent fuel management policy through a public engagement.
– (2018/5~11) MOTIE has operated a preparation group for the
reexamination.
– (2019/4) MOTIE has started to form a reexamination committee with 15
neutral specialists for the amendment of the public engagement
• Lack of participation of public peoples around NPPs and NGOs
• Change of the amounts of SNFs generated due to the energy
transition policy of government
• Update the siting process and support process to local community
Development of Advanced Nuclear System
10
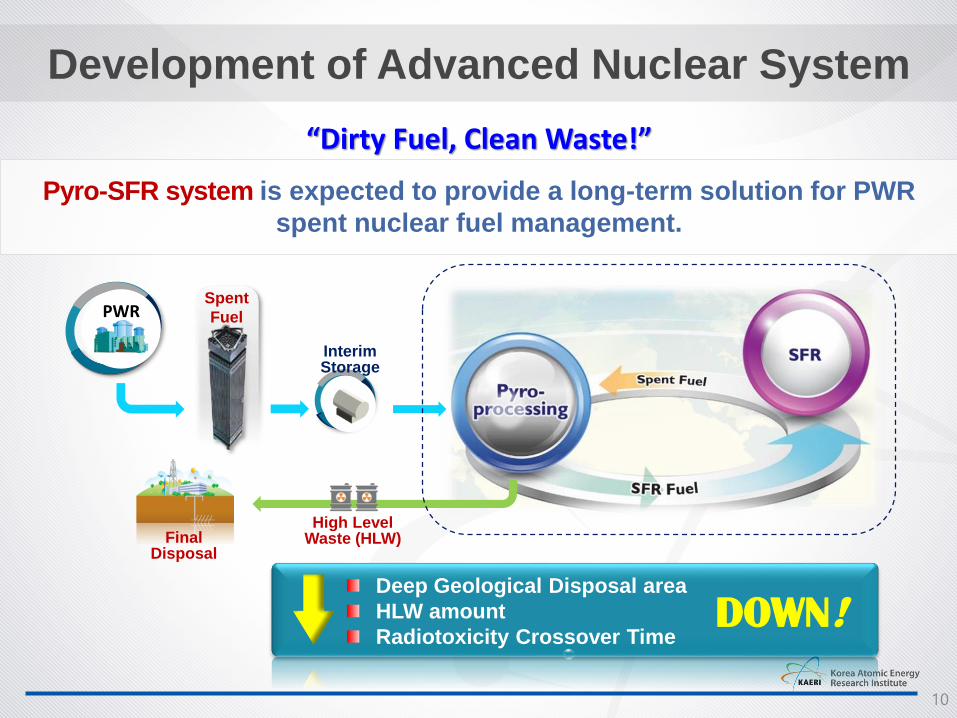
Pyro-SFR system is expected to provide a long-term solution for PWR
spent nuclear fuel management.
“Dirty Fuel, Clean Waste!”
Deep Geological Disposal area
HLW amount
Radiotoxicity Crossover TimeDOWN!
PWR
Final Disposal
Spent
Fuel
Interim Storage
High Level Waste (HLW)

Economic Analysis of the NFC Options
Workflow and Basic Assumptions
11
System Definition
Modeling
Material Flow
Economic Evaluation
Uncertainty / Sensitivity
Analysis
Cost Database
▶ Primary goal of Pyro-SFR cycle
▪ Minimize the waste
▪ SFR is a burner
▶ Dynamics is used
▪ To consider all the SFs generated in
the past and in the future
▪ PWR, PHWR, SFRs are considered in
the transition scenario
▪ Only PWR SFs are assumed to be
recycled
▶ Time frame
▪ 2035. Start of interim storage
▪ 2045. Start of commercial
pyroprocessing facility
▪ 2050. Start of commercial SFR
▪ 2053. Start of disposal site
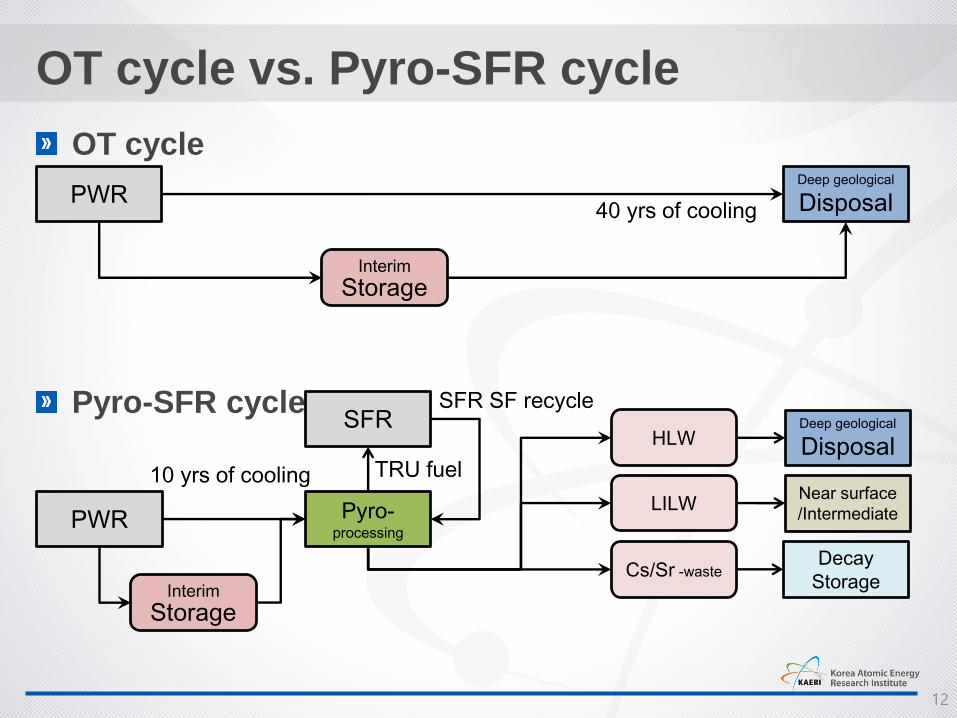
OT cycle
Pyro-SFR cycle
12
PWRDeep geological
Disposal
Interim
Storage
40 yrs of cooling
PWR
Deep geological
Disposal
Pyro-processing
10 yrs of cooling
Interim
Storage
Near surface
/Intermediate
HLW
Cs/Sr -waste
LILW
OT cycle vs. Pyro-SFR cycle
SFR
TRU fuel
SFR SF recycle
Decay
Storage

13
Modeling systems with Transition Scenario
Transition Scenario
for Pyro-SFR cycle
The 7th Basic Plan on
Electricity Demand and Supply
(2015)
- SFR capacity more than the equilibrium is needed to burn-out PWR SFs
- At around 2140, it reaches an equilibrium (PWR/SFR ≈ 2)
Assumed capacity of NPPs Fuel Stock between OT vs. Pyro-SFR cycle
14
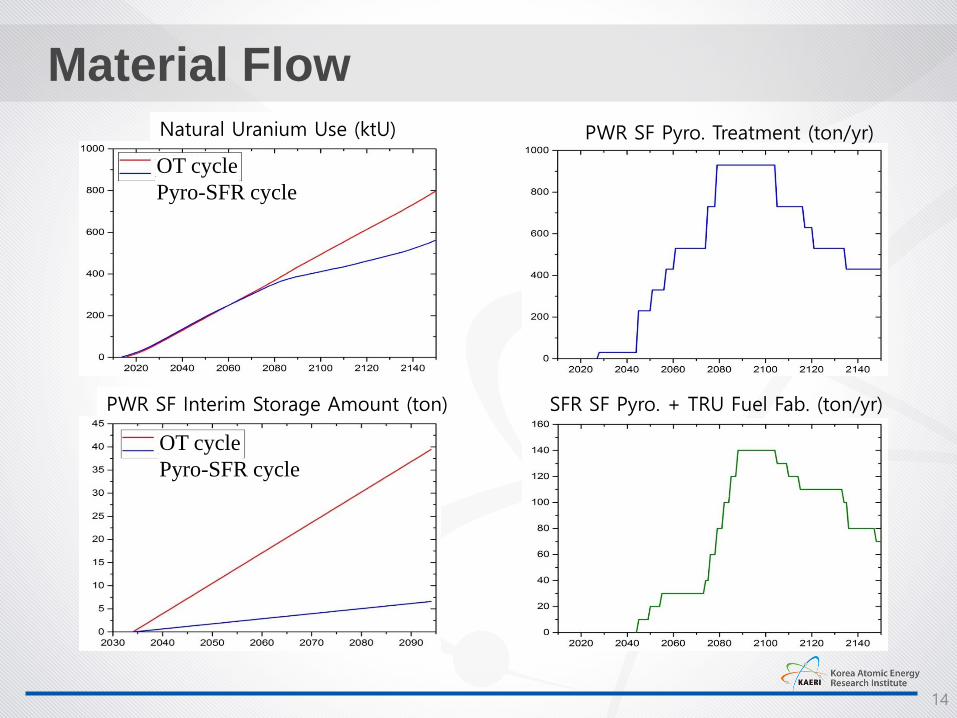
Material Flow
PWR SF Pyro. Treatment (ton/yr)
SFR SF Pyro. + TRU Fuel Fab. (ton/yr)
Natural Uranium Use (ktU)
PWR SF Interim Storage Amount (ton)
OT cycle
Pyro-SFR cycle
OT cycle
Pyro-SFR cycle

15
Levelized cost of electricity generation (LCOE)– Reactor cost + fuel cycle cost
• Reactor cost: capital cost for construction of a nuclear power plant, operation and maintenance cost, and the decontamination and decommissioning cost
• Fuel cycle cost: all the other cost regarding front-end and back-end fuel cycle steps, such as uranium mining/milling, conversion, enrichment, fuel fabrication, electrochemical recycling, interim storage, disposal, etc
Economic Analysis
Economic Analysis
Unit cost
Material Flow
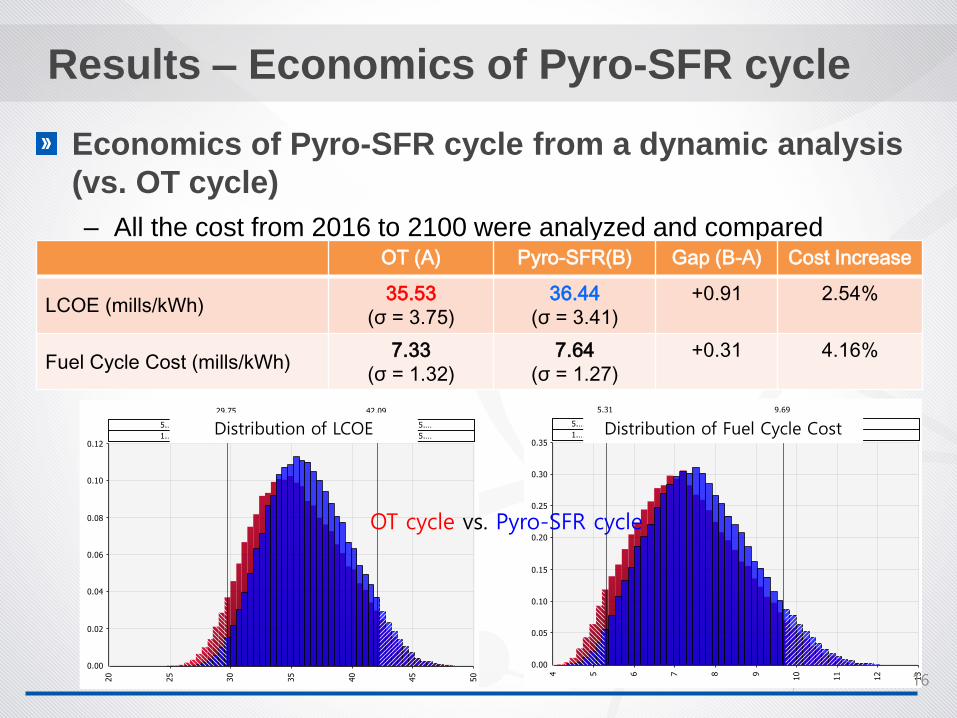
Economics of Pyro-SFR cycle from a dynamic analysis
(vs. OT cycle)
– All the cost from 2016 to 2100 were analyzed and compared
– Basis year: 2016, discount rate (3.55%), inflation rate (1.40%) were
assumed
Results – Economics of Pyro-SFR cycle
OT (A) Pyro-SFR(B) Gap (B-A) Cost Increase
LCOE (mills/kWh)35.53
(σ = 3.75)
36.44
(σ = 3.41)
+0.91 2.54%
Fuel Cycle Cost (mills/kWh)7.33
(σ = 1.32)
7.64
(σ = 1.27)
+0.31 4.16%
16
Distribution of LCOE Distribution of Fuel Cycle Cost
OT cycle vs. Pyro-SFR cycle

17
About 80% of LCOE is a reactor cost
Compared to the OT cycle, cost for front-end, interim storage,
disposal cost can be saved but there are increase in the cost for the
processing and LILW disposal
Results – Economics of Pyro-SFR cycle
Cost breakdown of LCOE Cost breakdown of fuel cycle cost
Reactor Capital
Reactor O&M, D&D
Pyro

18
Sensitivity Analysis
– To understand how the uncertainty in the output can be apportioned to
difference sources of uncertainty in the inputs
Capital costs are main contributor
Pyroprocessing cost is found to be the most sensitive
fuel cycle cost
Results – Sensitivity Analysis
LCOE Gap between the OT cycle and Pyro-SFR cycle
SFR Capital
PWR SF Pyro.
SFR CapitalPWR SF Pyro.

19
Discount rate (3.55%) is used in this study,
Zero discount rate showed a largest difference in the
LCOE
– The LCOE of the Pyro-SFR cycle is about 7.3% higher than the LCOE
of the OT cycle
About 10% discount rate,
– the LCOE gap decreases almost to zero
Results – Effect of Discount Rate
20
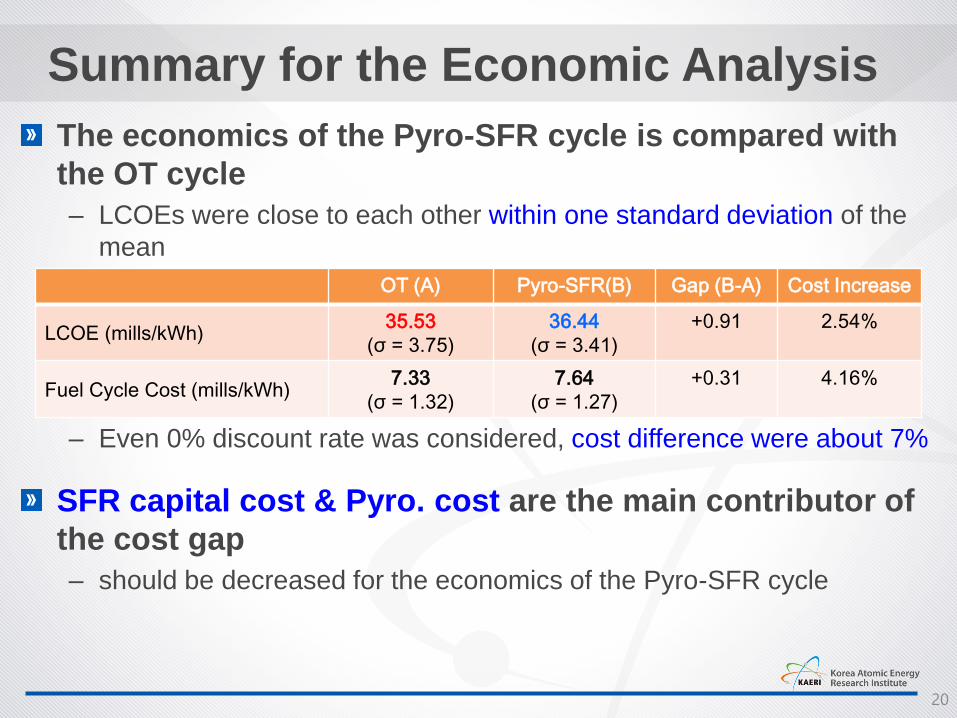
The economics of the Pyro-SFR cycle is compared with
the OT cycle
– LCOEs were close to each other within one standard deviation of the
mean
– Even 0% discount rate was considered, cost difference were about 7%
SFR capital cost & Pyro. cost are the main contributor of
the cost gap
– should be decreased for the economics of the Pyro-SFR cycle
Summary for the Economic Analysis
OT (A) Pyro-SFR(B) Gap (B-A) Cost Increase
LCOE (mills/kWh)35.53
(σ = 3.75)
36.44
(σ = 3.41)
+0.91 2.54%
Fuel Cycle Cost (mills/kWh)7.33
(σ = 1.32)
7.64
(σ = 1.27)
+0.31 4.16%

Cost for Nuclear Waste Management
Radioactive Waste Management Act (2008)
– Establishment of Korea Radioactive-waste Management Corporation of
which responsibilities includes spent fuel interim-storage and disposal
– Establishment of waste fund
RWMA Article 14 (Expenses for RWM)
RWMA Article 15 (Charges for Management of SNF)
RWMA Article 17 (Reserve for Cost of Decomm. of NPP, etc)
Expenses for RWM shall be reviewed in every 2 years
– LILW, approx. $12,000 / 200 liters
– PWR SF, approx. $ 280,000 / Assembly
– CANDU SF, approx. $ 11,000 / Assembly
21

Cost Estimation for Pyroprocess
Bottom-up costing based on the conceptual design
– 400 tHM/yr for PWR SF processing
– Total cost consists of capital cost, O&M cost, and D&D cost
– NPV of the cost,
– Levelized Unit Cost,
References
–
–
22
W.I. Ko et al., “Preliminary conceptual design and cost estimation for Korea Advanced
Pyroprocessing Facility Plus (KAPF+)”, Nuclear Engineering and Design 277 (2014) 212-224
W.I. Ko et al., “Preliminary conceptual design and cost estimation for SFR Fuel Manufacturing
Facility (SFMF)”, Nuclear Engineering and Design 277 (2014) 225-233

Cost Estimation for Pyroprocess
Annual Cash Flow of Facility
23

Cost Estimation for Pyroprocess
Capital Cost
24
O&M Cost
Total Cost

Summary
Spent Fuels
– About 16,000 tHM of spent fuels are generated from 26 NPPs
– Most of the SF are stored in the AR water pools except some of
CANDU fuels which are stored in the Silos and MACSTOR
National Strategy
– Master plan for HLW management was established to secure the
interim and disposal site and facilities by MOTIE
– R&D on the Pyroprocessing and SFR have been conducted as an
alternative for the SF management by MSIT
Economic Analysis on the NFC options
– Economic evaluations have been performed for the considered NFC
options to support the decision process
Estimation of Unit Cost
– Expenses for RWM is charged based on the RWM Act
– Cost for the Pyro. plant was estimated based on the conceptual design25